Jennie W, Jason O, Masayuki N, Keita K, Jim W,
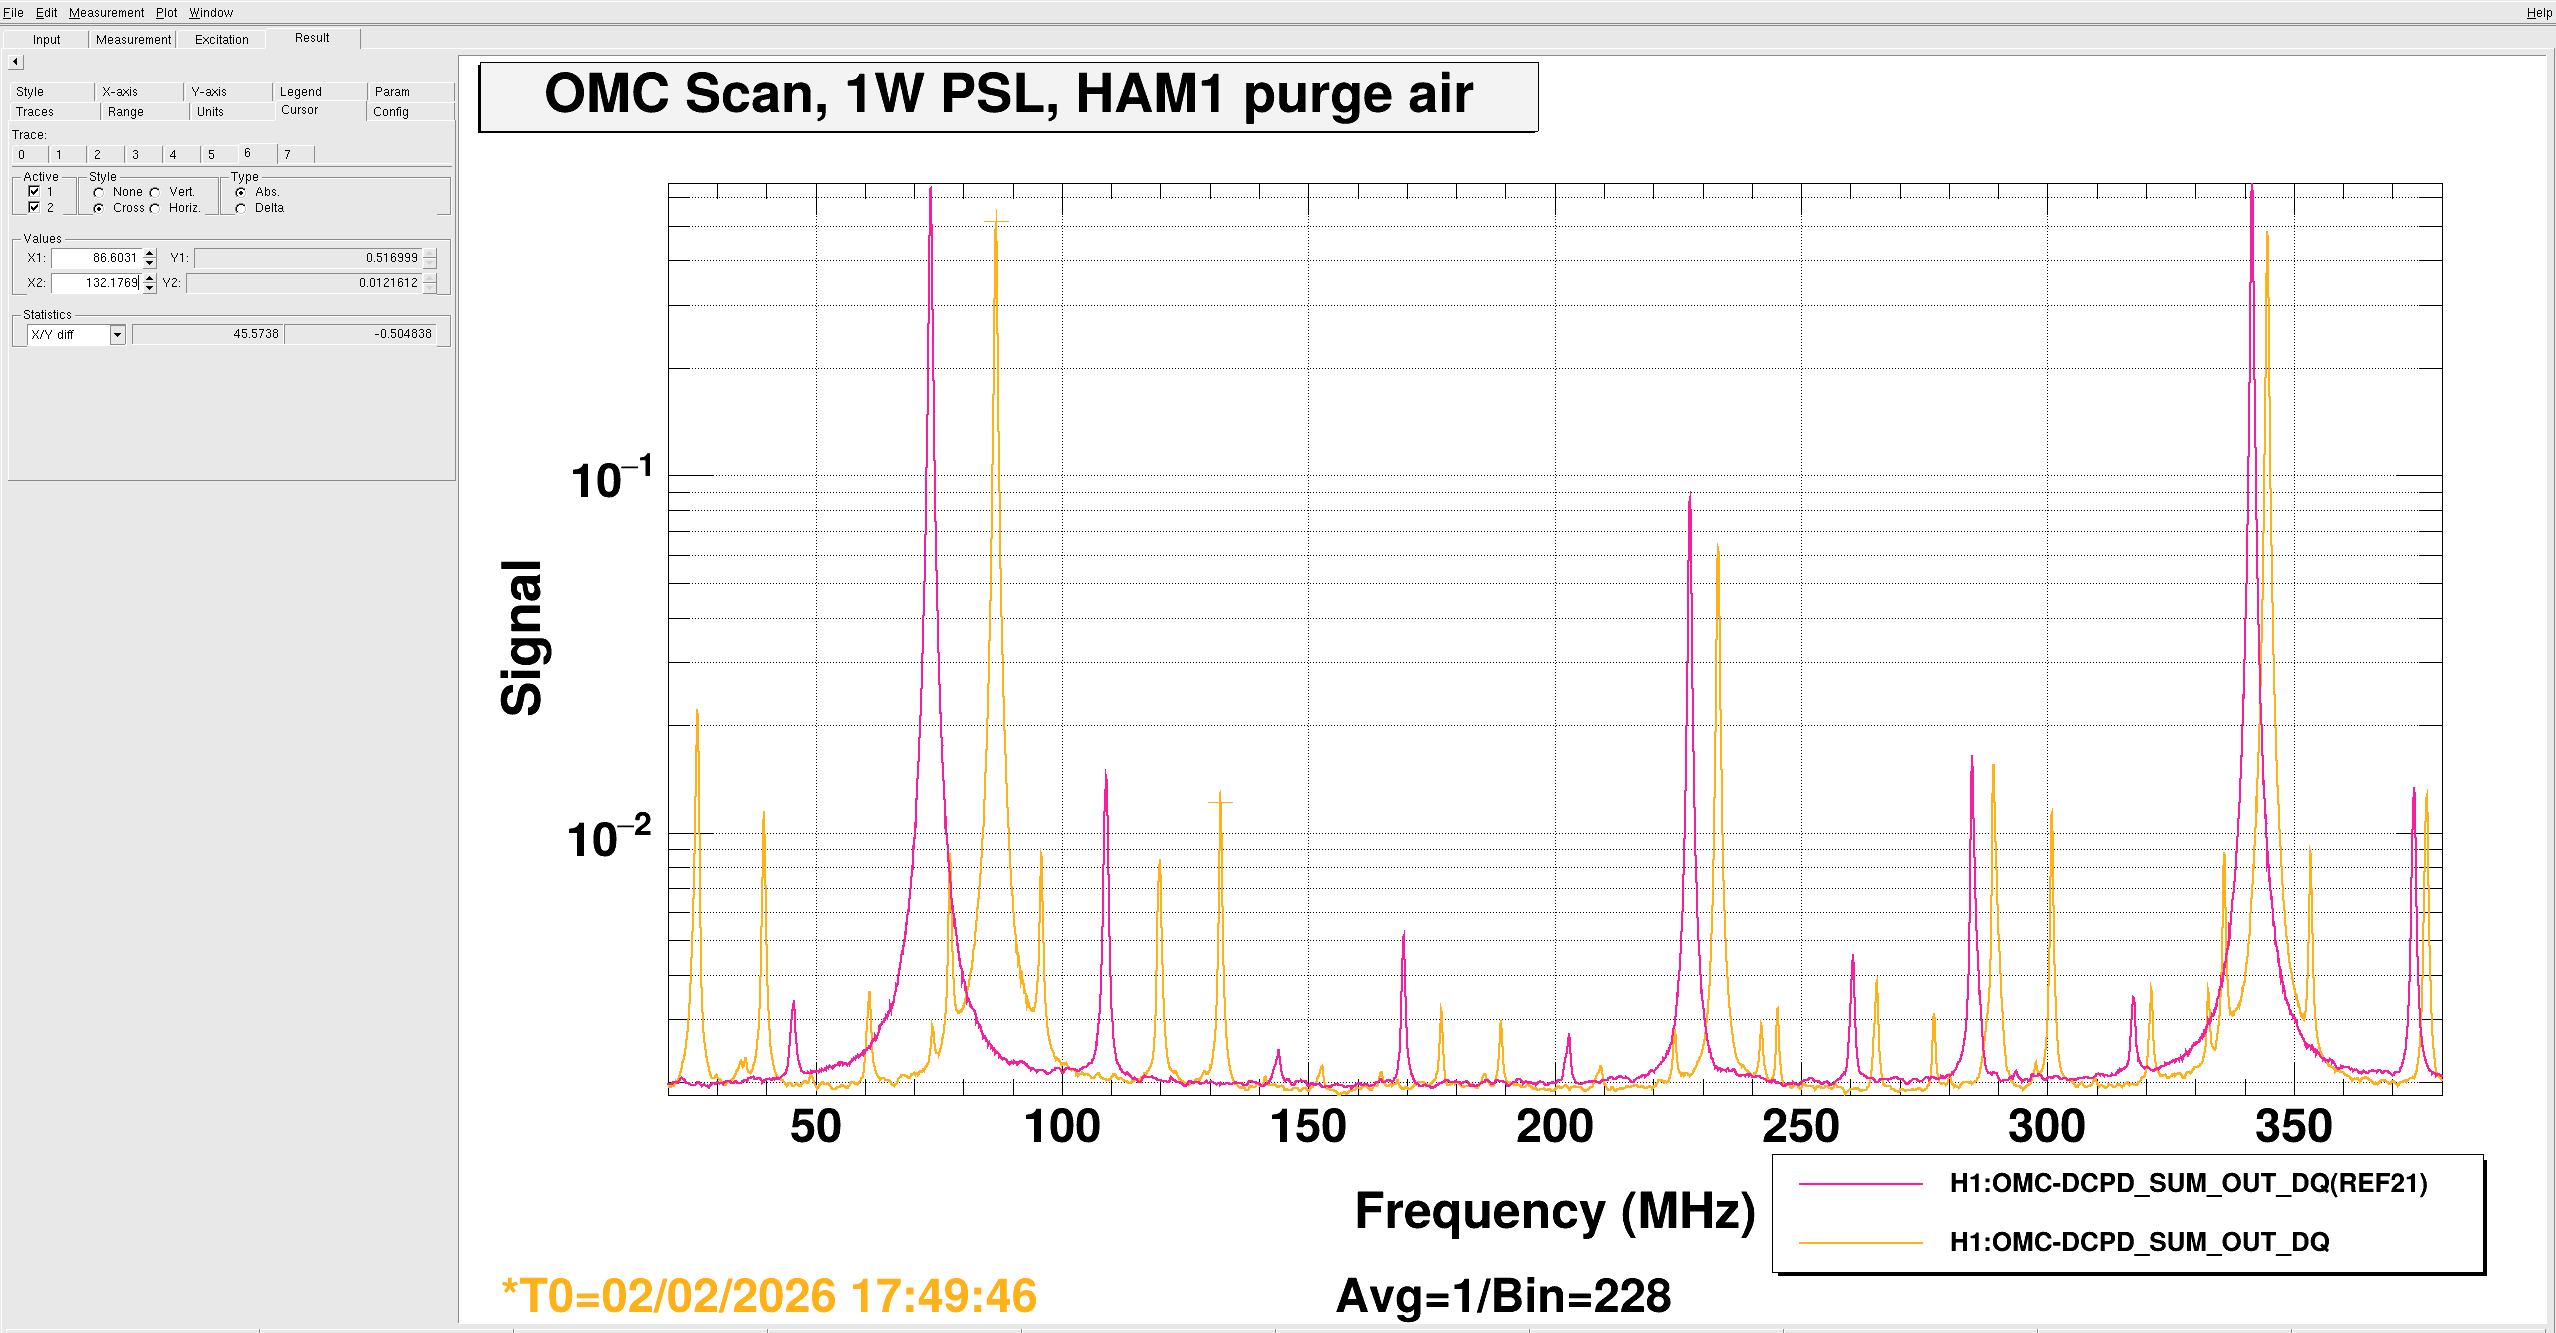
Summary: To check the function of the new EOM in chamber we made a measurement of the modulation indexes by locking the IMC and aligning the beam to AS_C with SR2. We couldn't get a good measurement of the sideband heights but this is probably due to the RF power being down by a factor of 100 from nominal. Will check with EE/Daniel on Monday.
First order of business was checking for stray beams at 100mW input power. Jason moved the BD we already placed for JM2 as we had moced this mirror position yesterday. We also put a new beam dump right after unused JAC port (output side there is tranismission through the curced mirror).
After this we turned the power up to 1W.
Lastly we found a stray beam exiting the table in the -Y direction, this was traced to the JAC REFL path. The REFL beam was hitting the side of a beam dump (near the -X side/PSL of the table) which is meant to cath a beam reflecting off the SEPTUM plate. This beam reflected off the beam dump causing a stray beam. We re-aligned the REFL path so the beam does not do this and instead bounces off the three REFL path steering mirrors and heads into a previously placed beam dump for this purpose on the -Y side of the table. This path will have to be re-aligned in order for the beam to get onto the IOT1 table.
No further stray beams were found so Jason de-energised the waveplate.
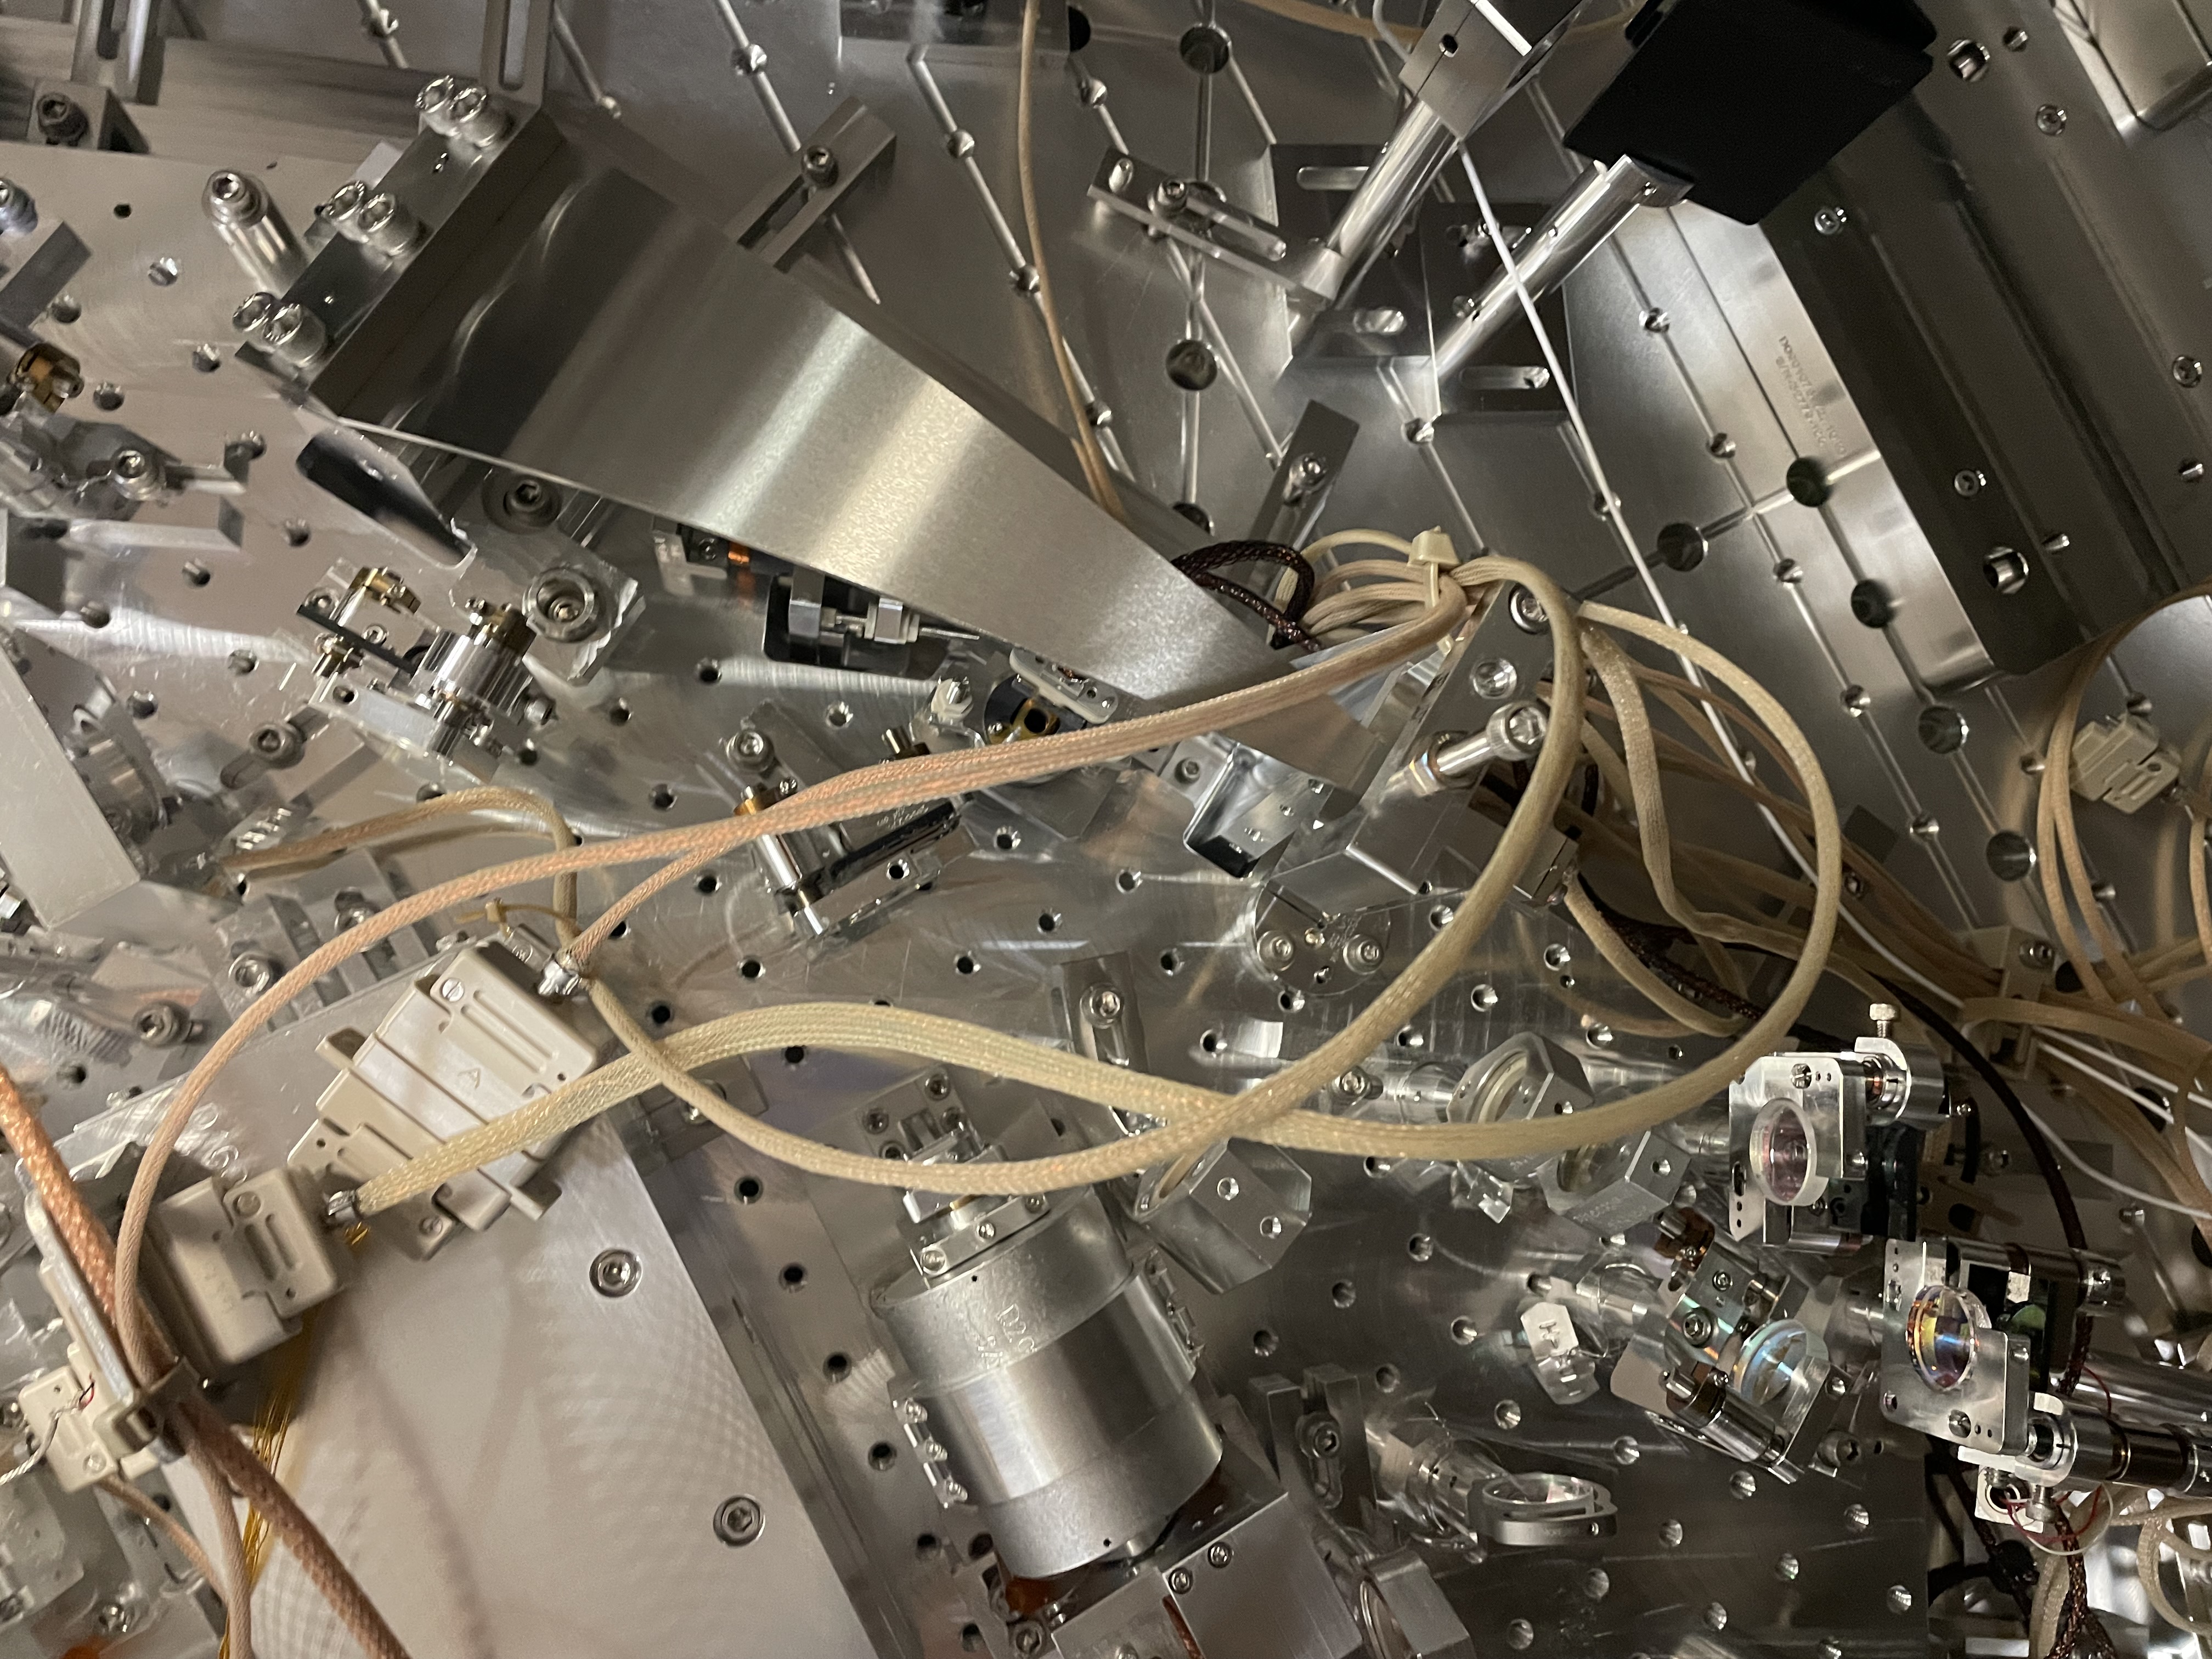
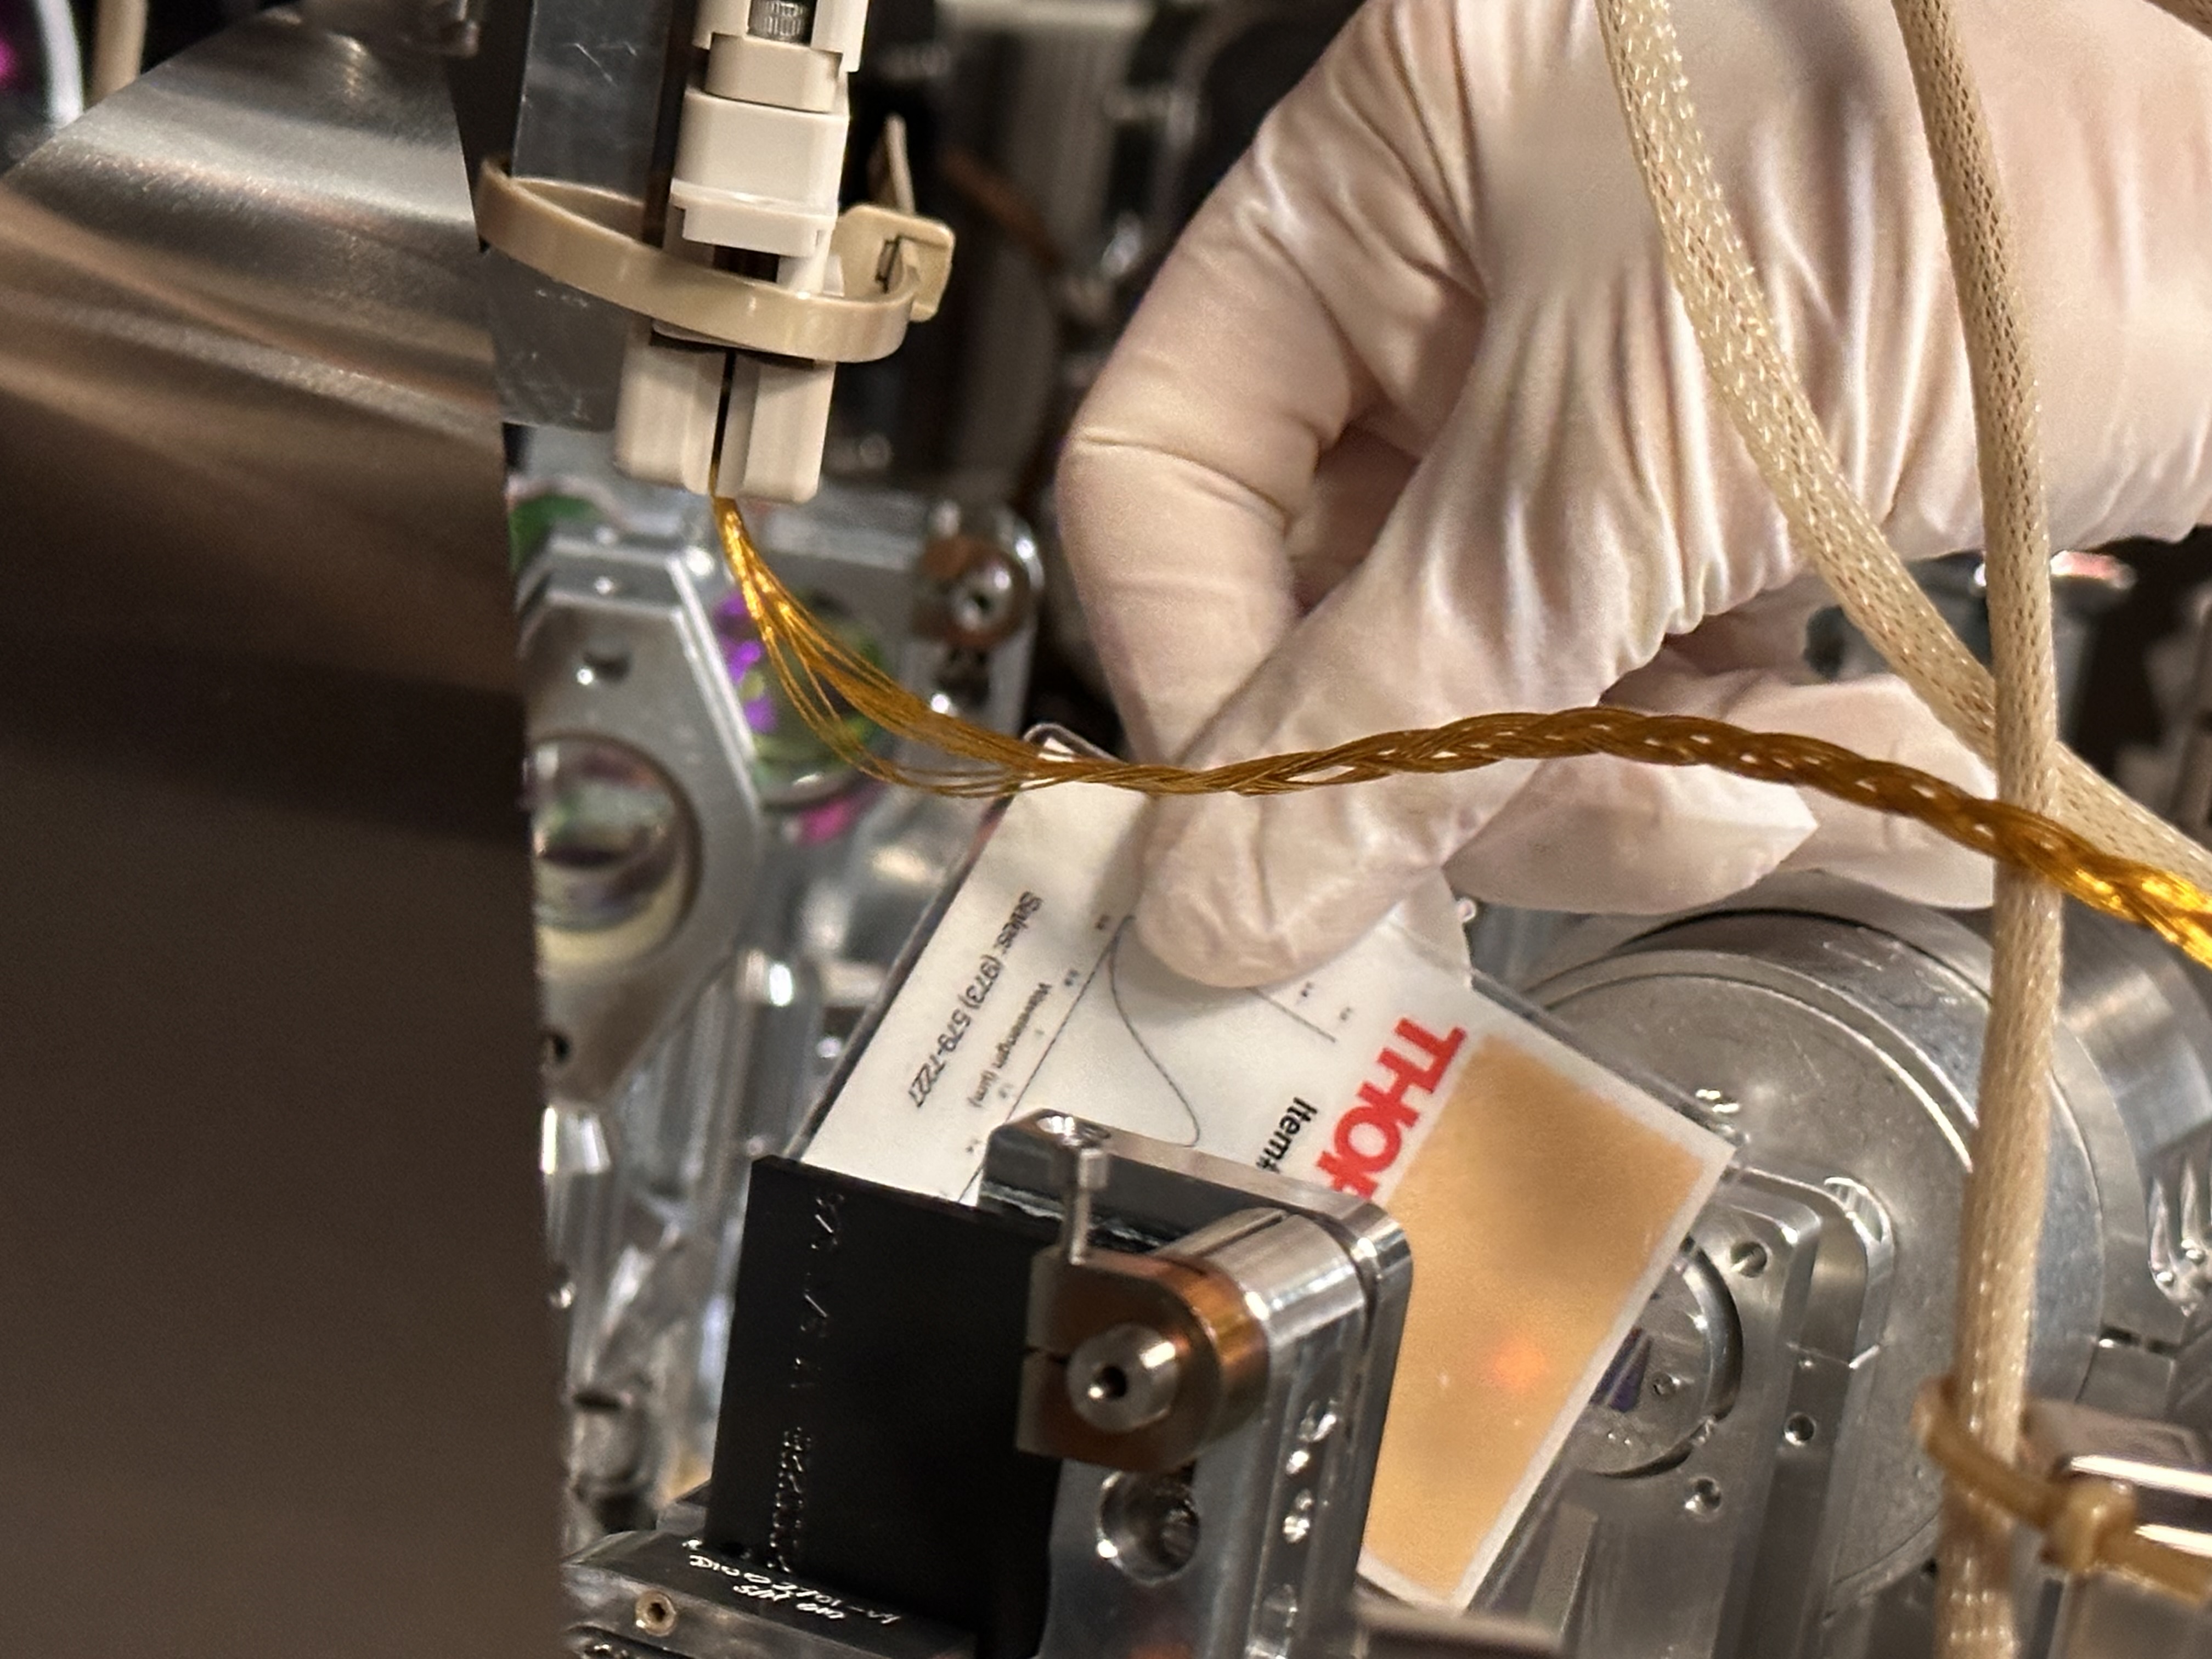
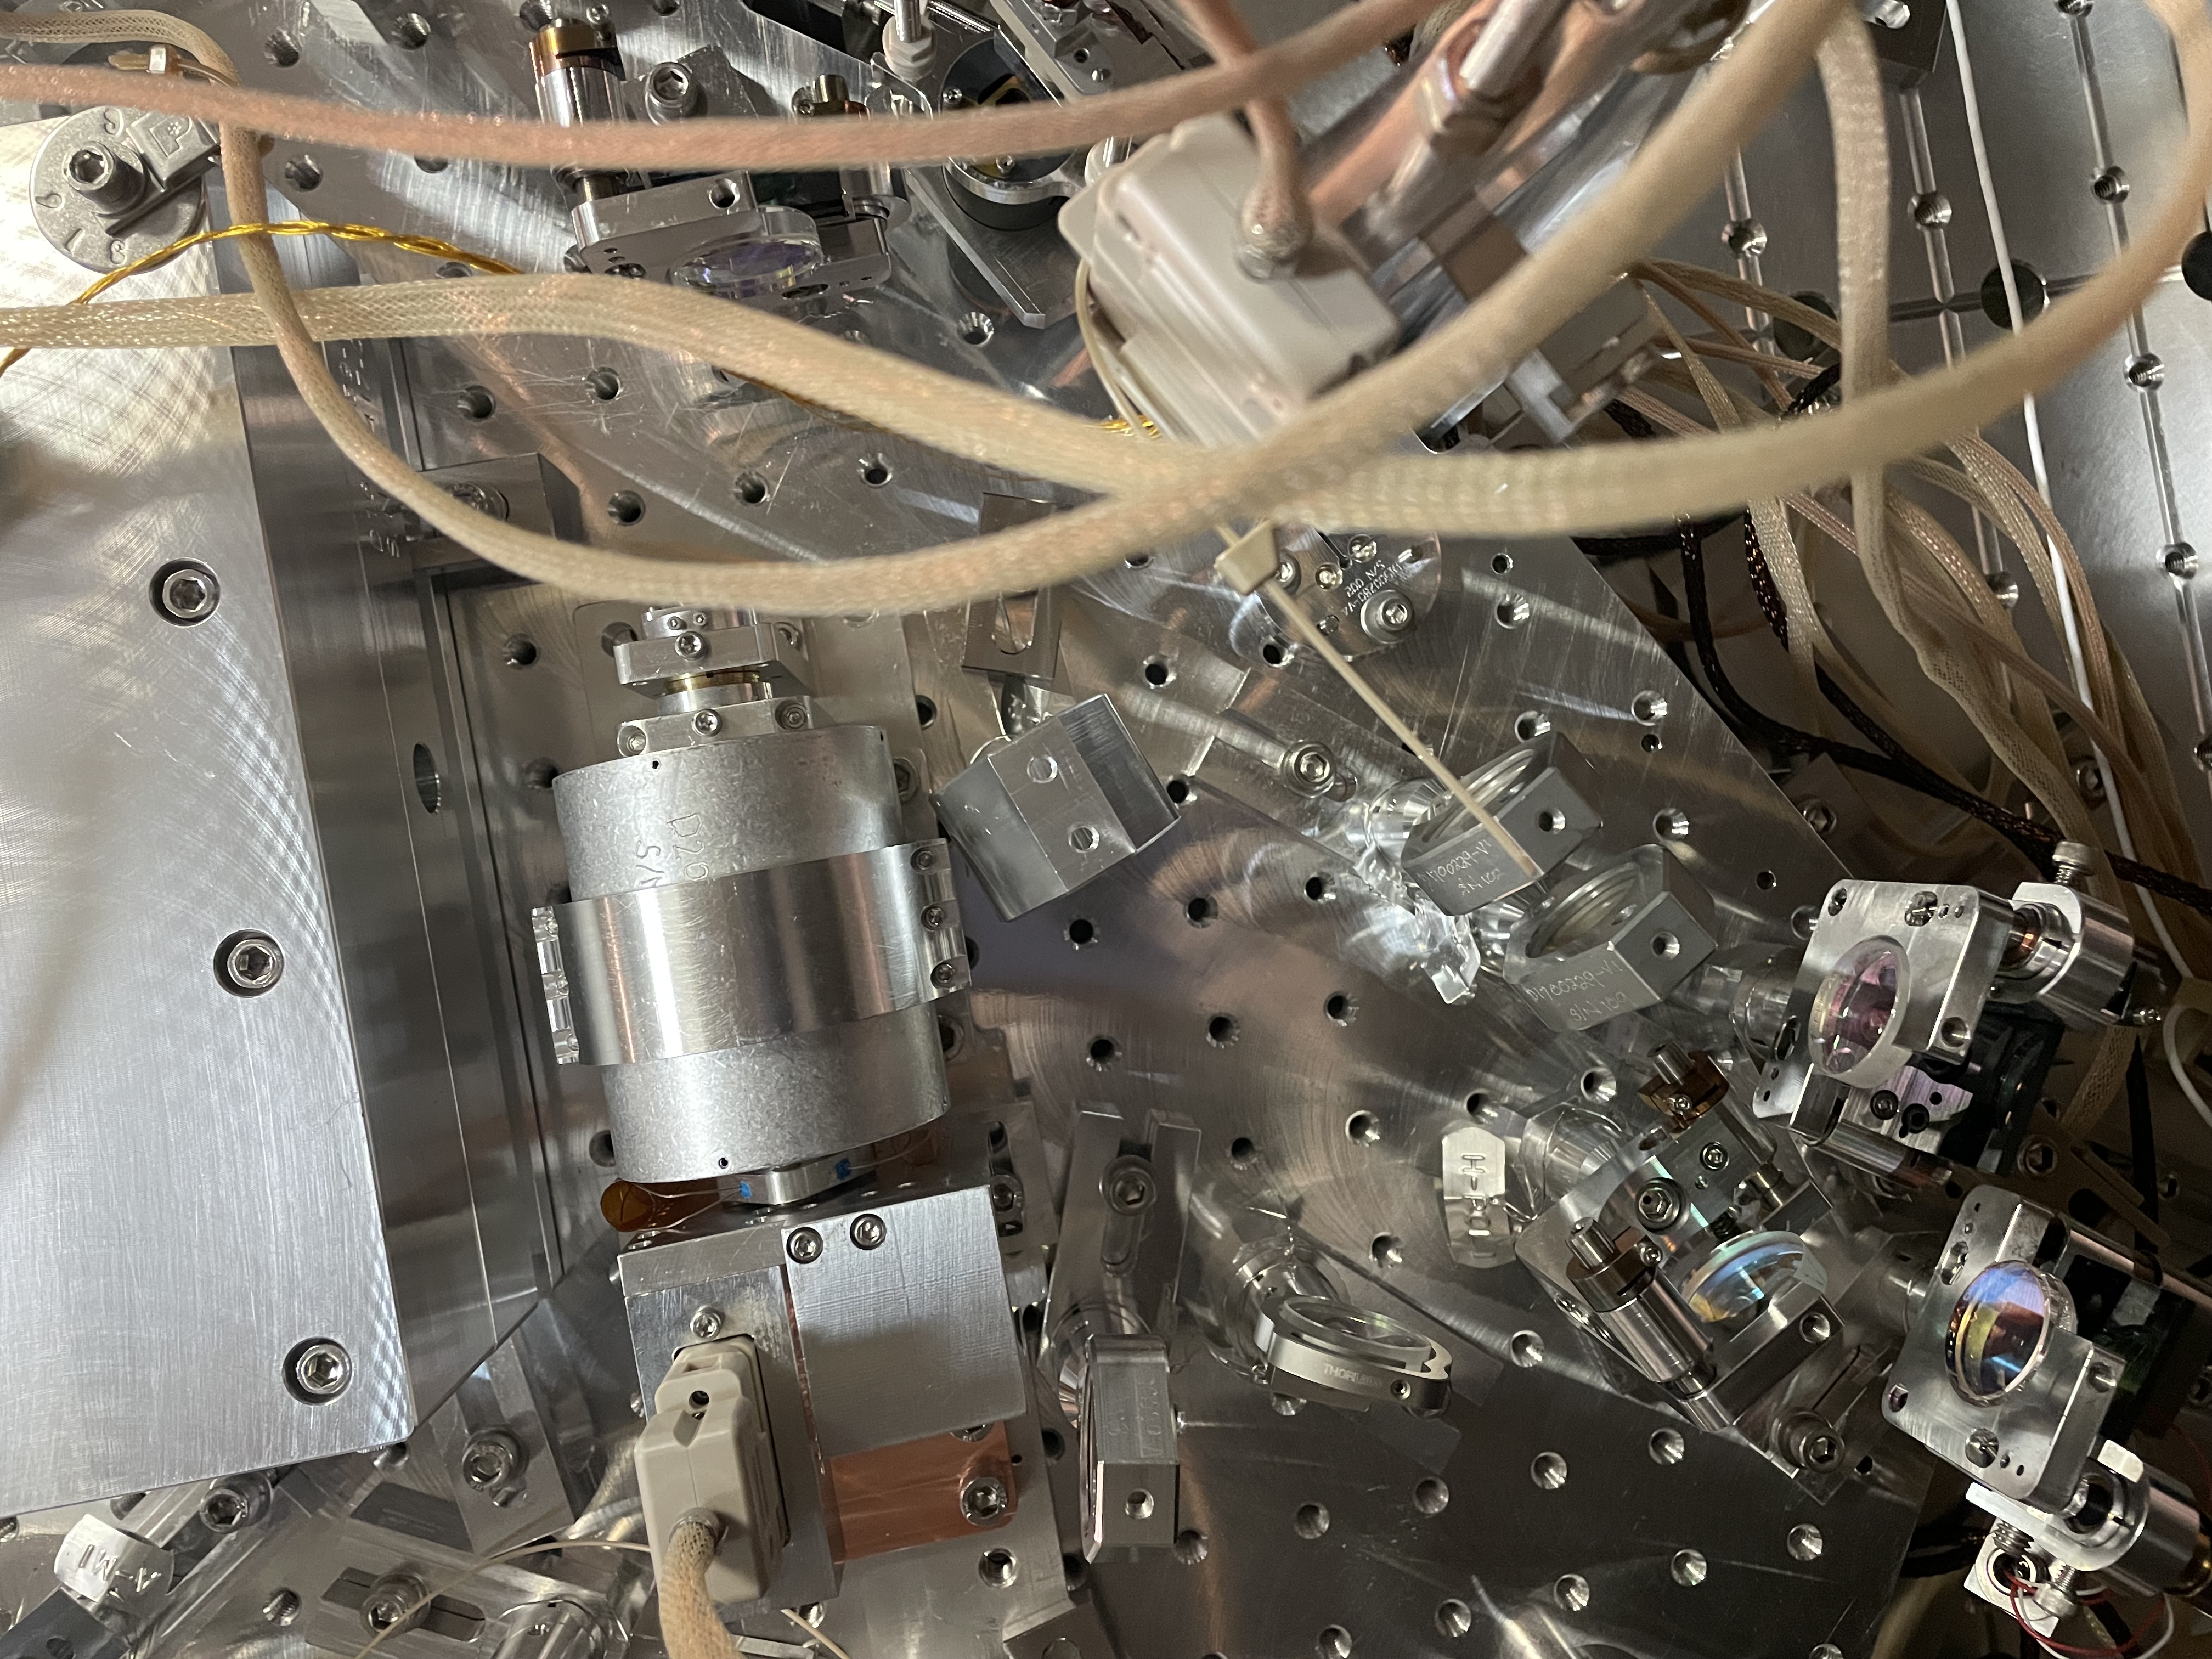
Photos to come.
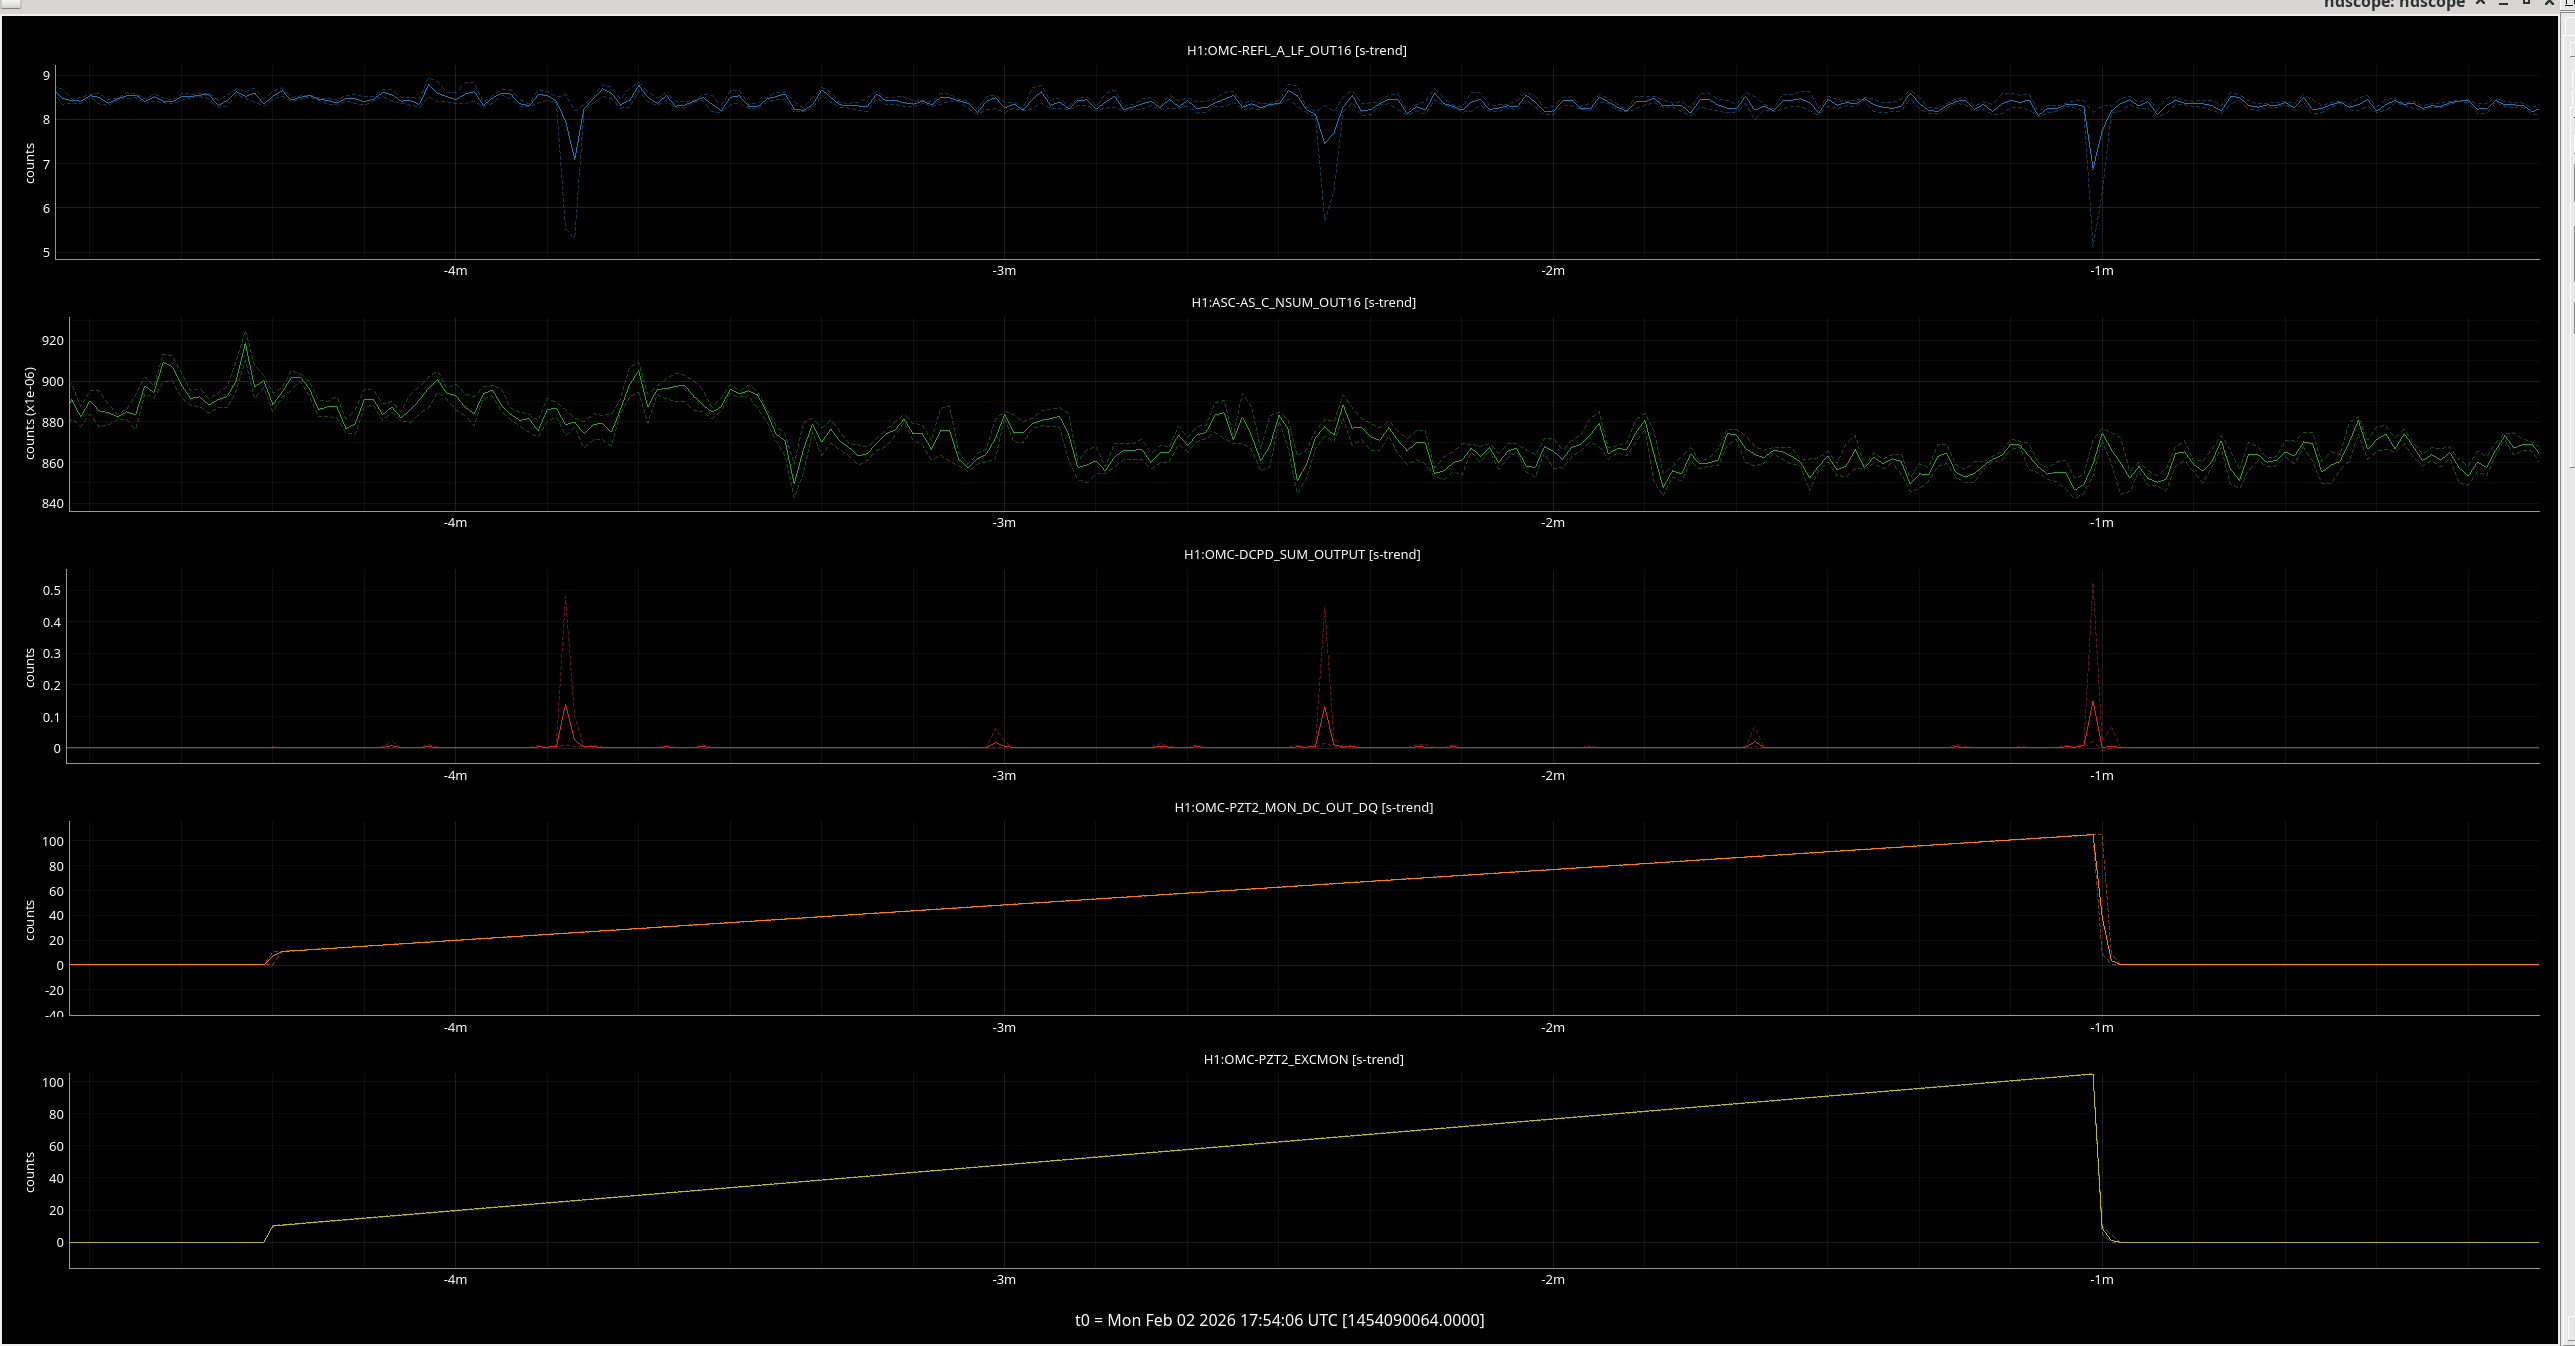
After realising that the beam did not reach the AS_C,A and B QPDs yet we came to the control room to re-align to the output port. This is with the ITMY, PRM and SRM mirrors mis-aligned to allow us to mode scan the OMC in the 'single bounce' IFO configuration.
After Jim re-isolated HAM4,5 and 6 and BSC2 for us we were able to use SR2 to bring back the alignment to AS_C and then turn on the DC centering loops for AS_A and AS_B.
The OMC ASC did not work at first as the suspensions were railed. I cleared the ASC history, this did not help. We cleared the locking filter banks for OM1-3 and this unrailed the outputs and allowed us to turn on the OMC ASC.
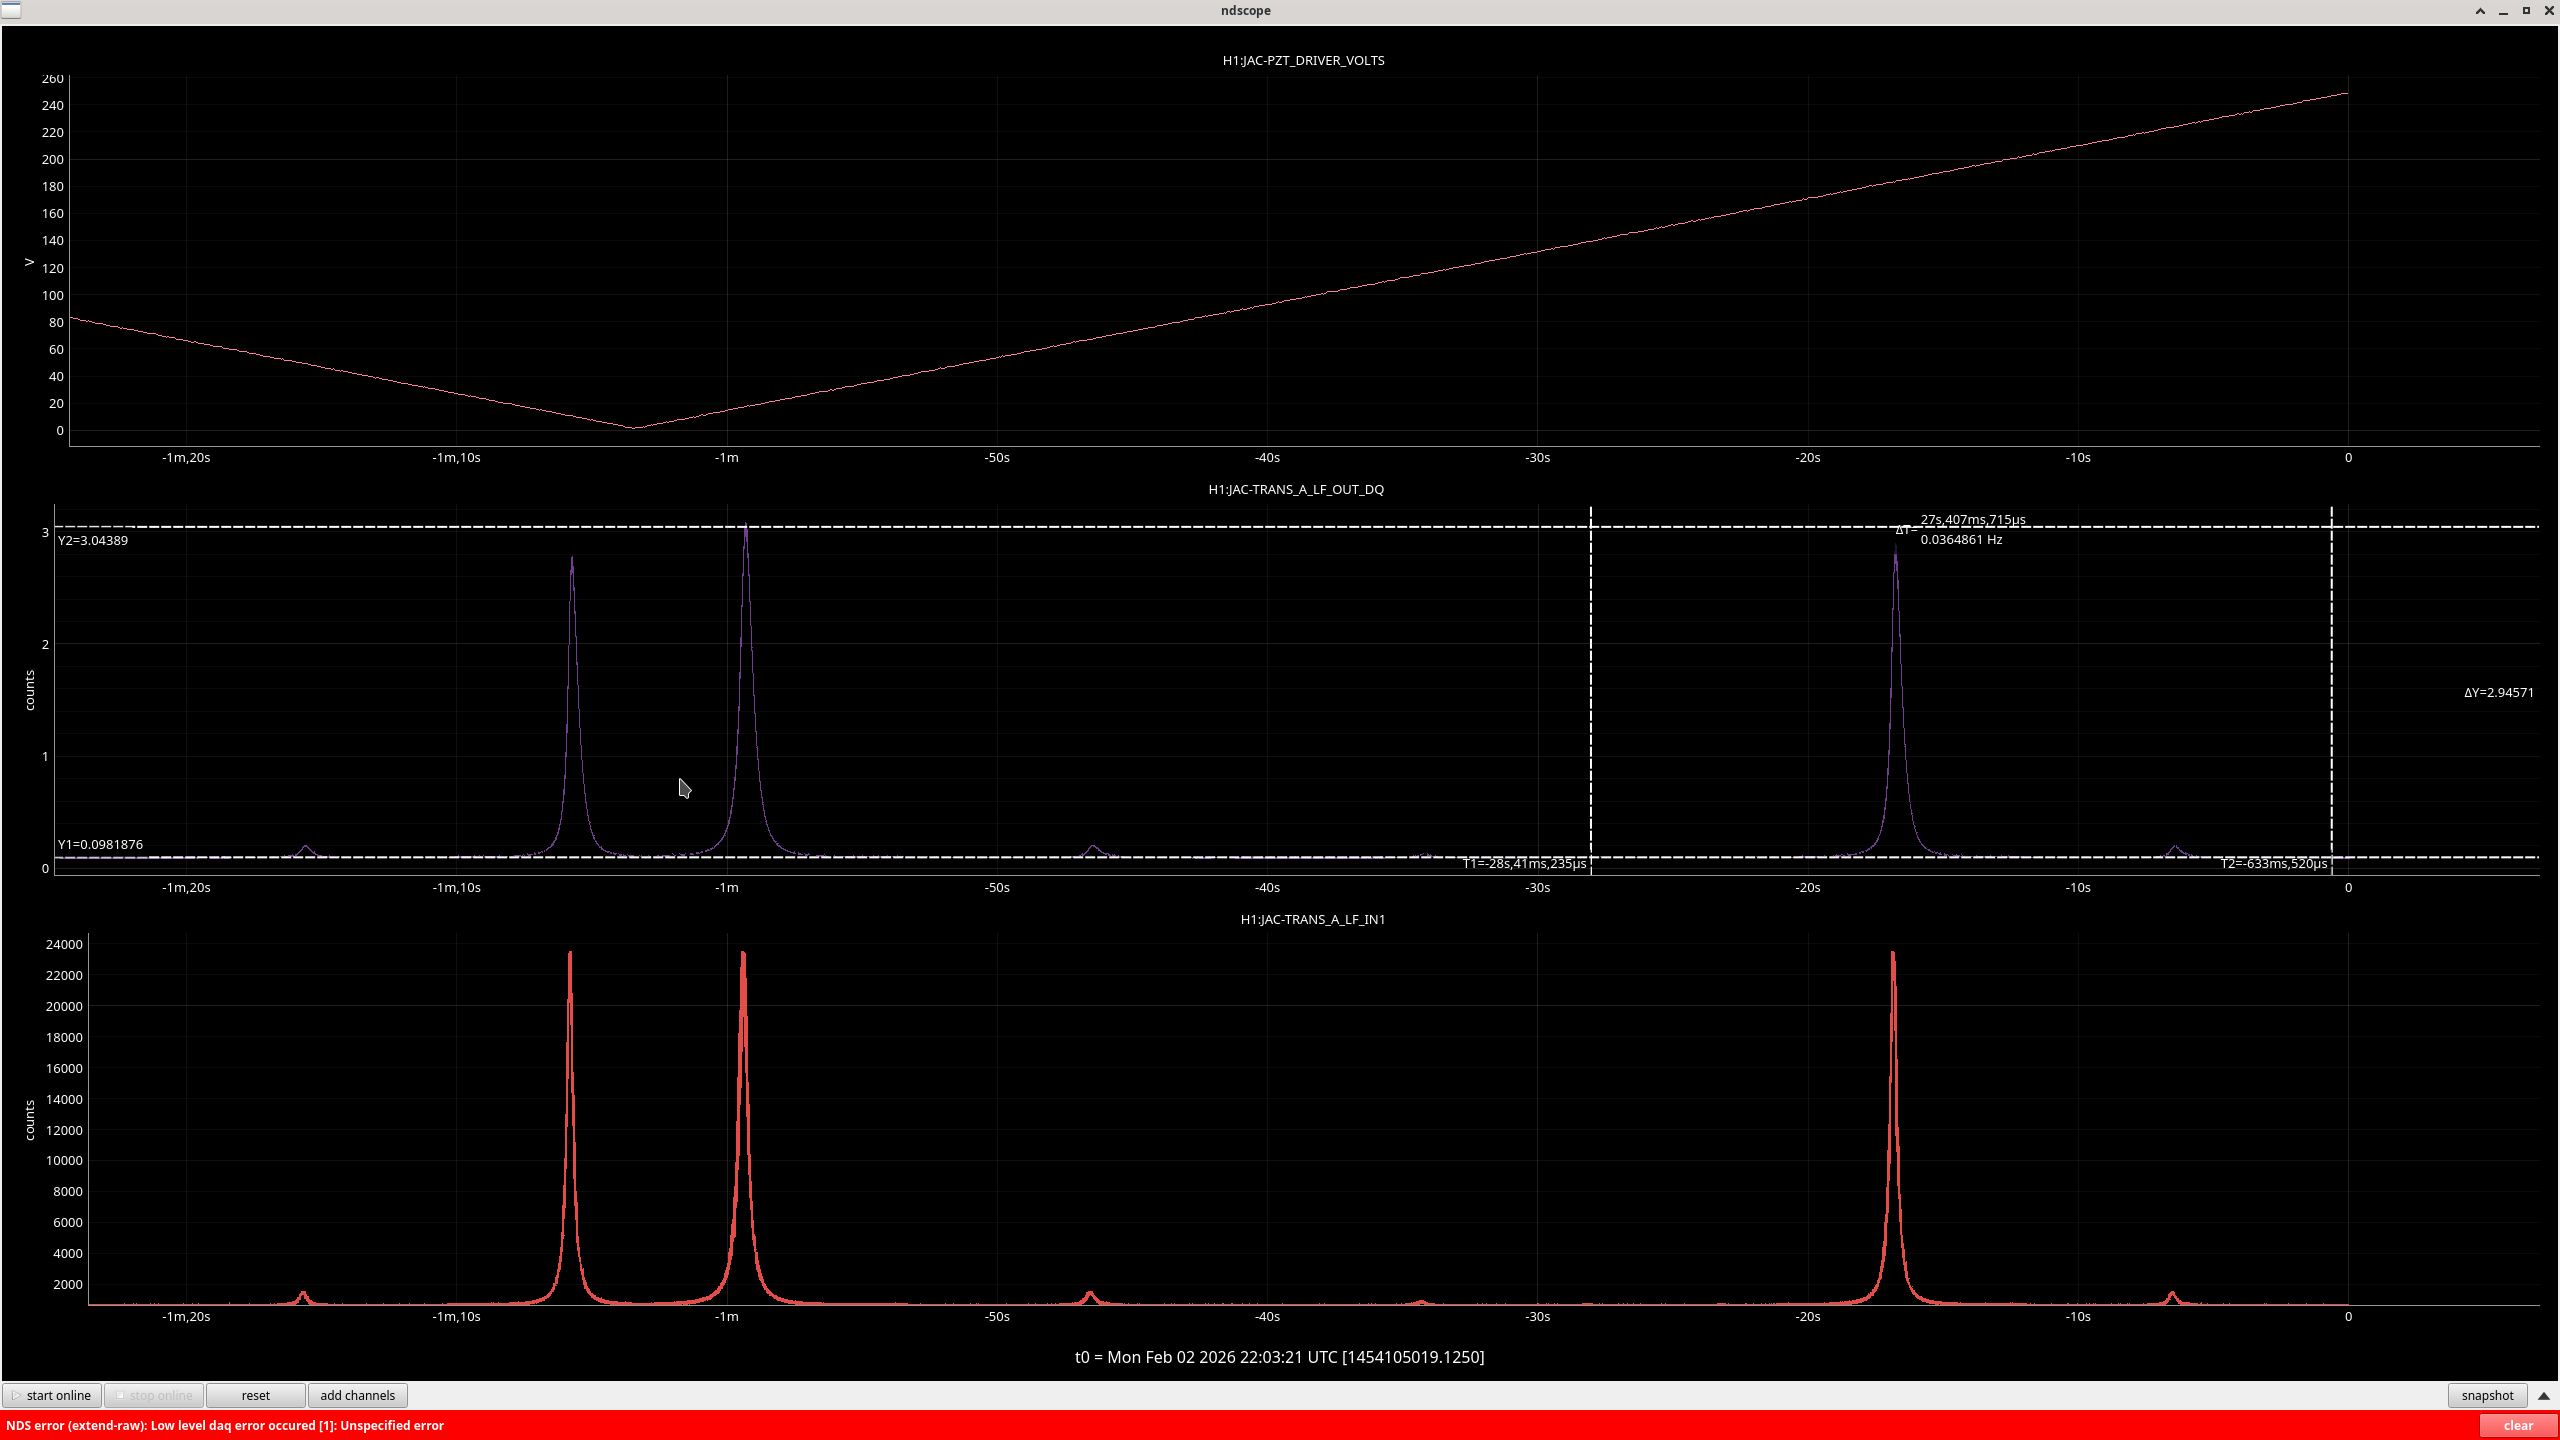
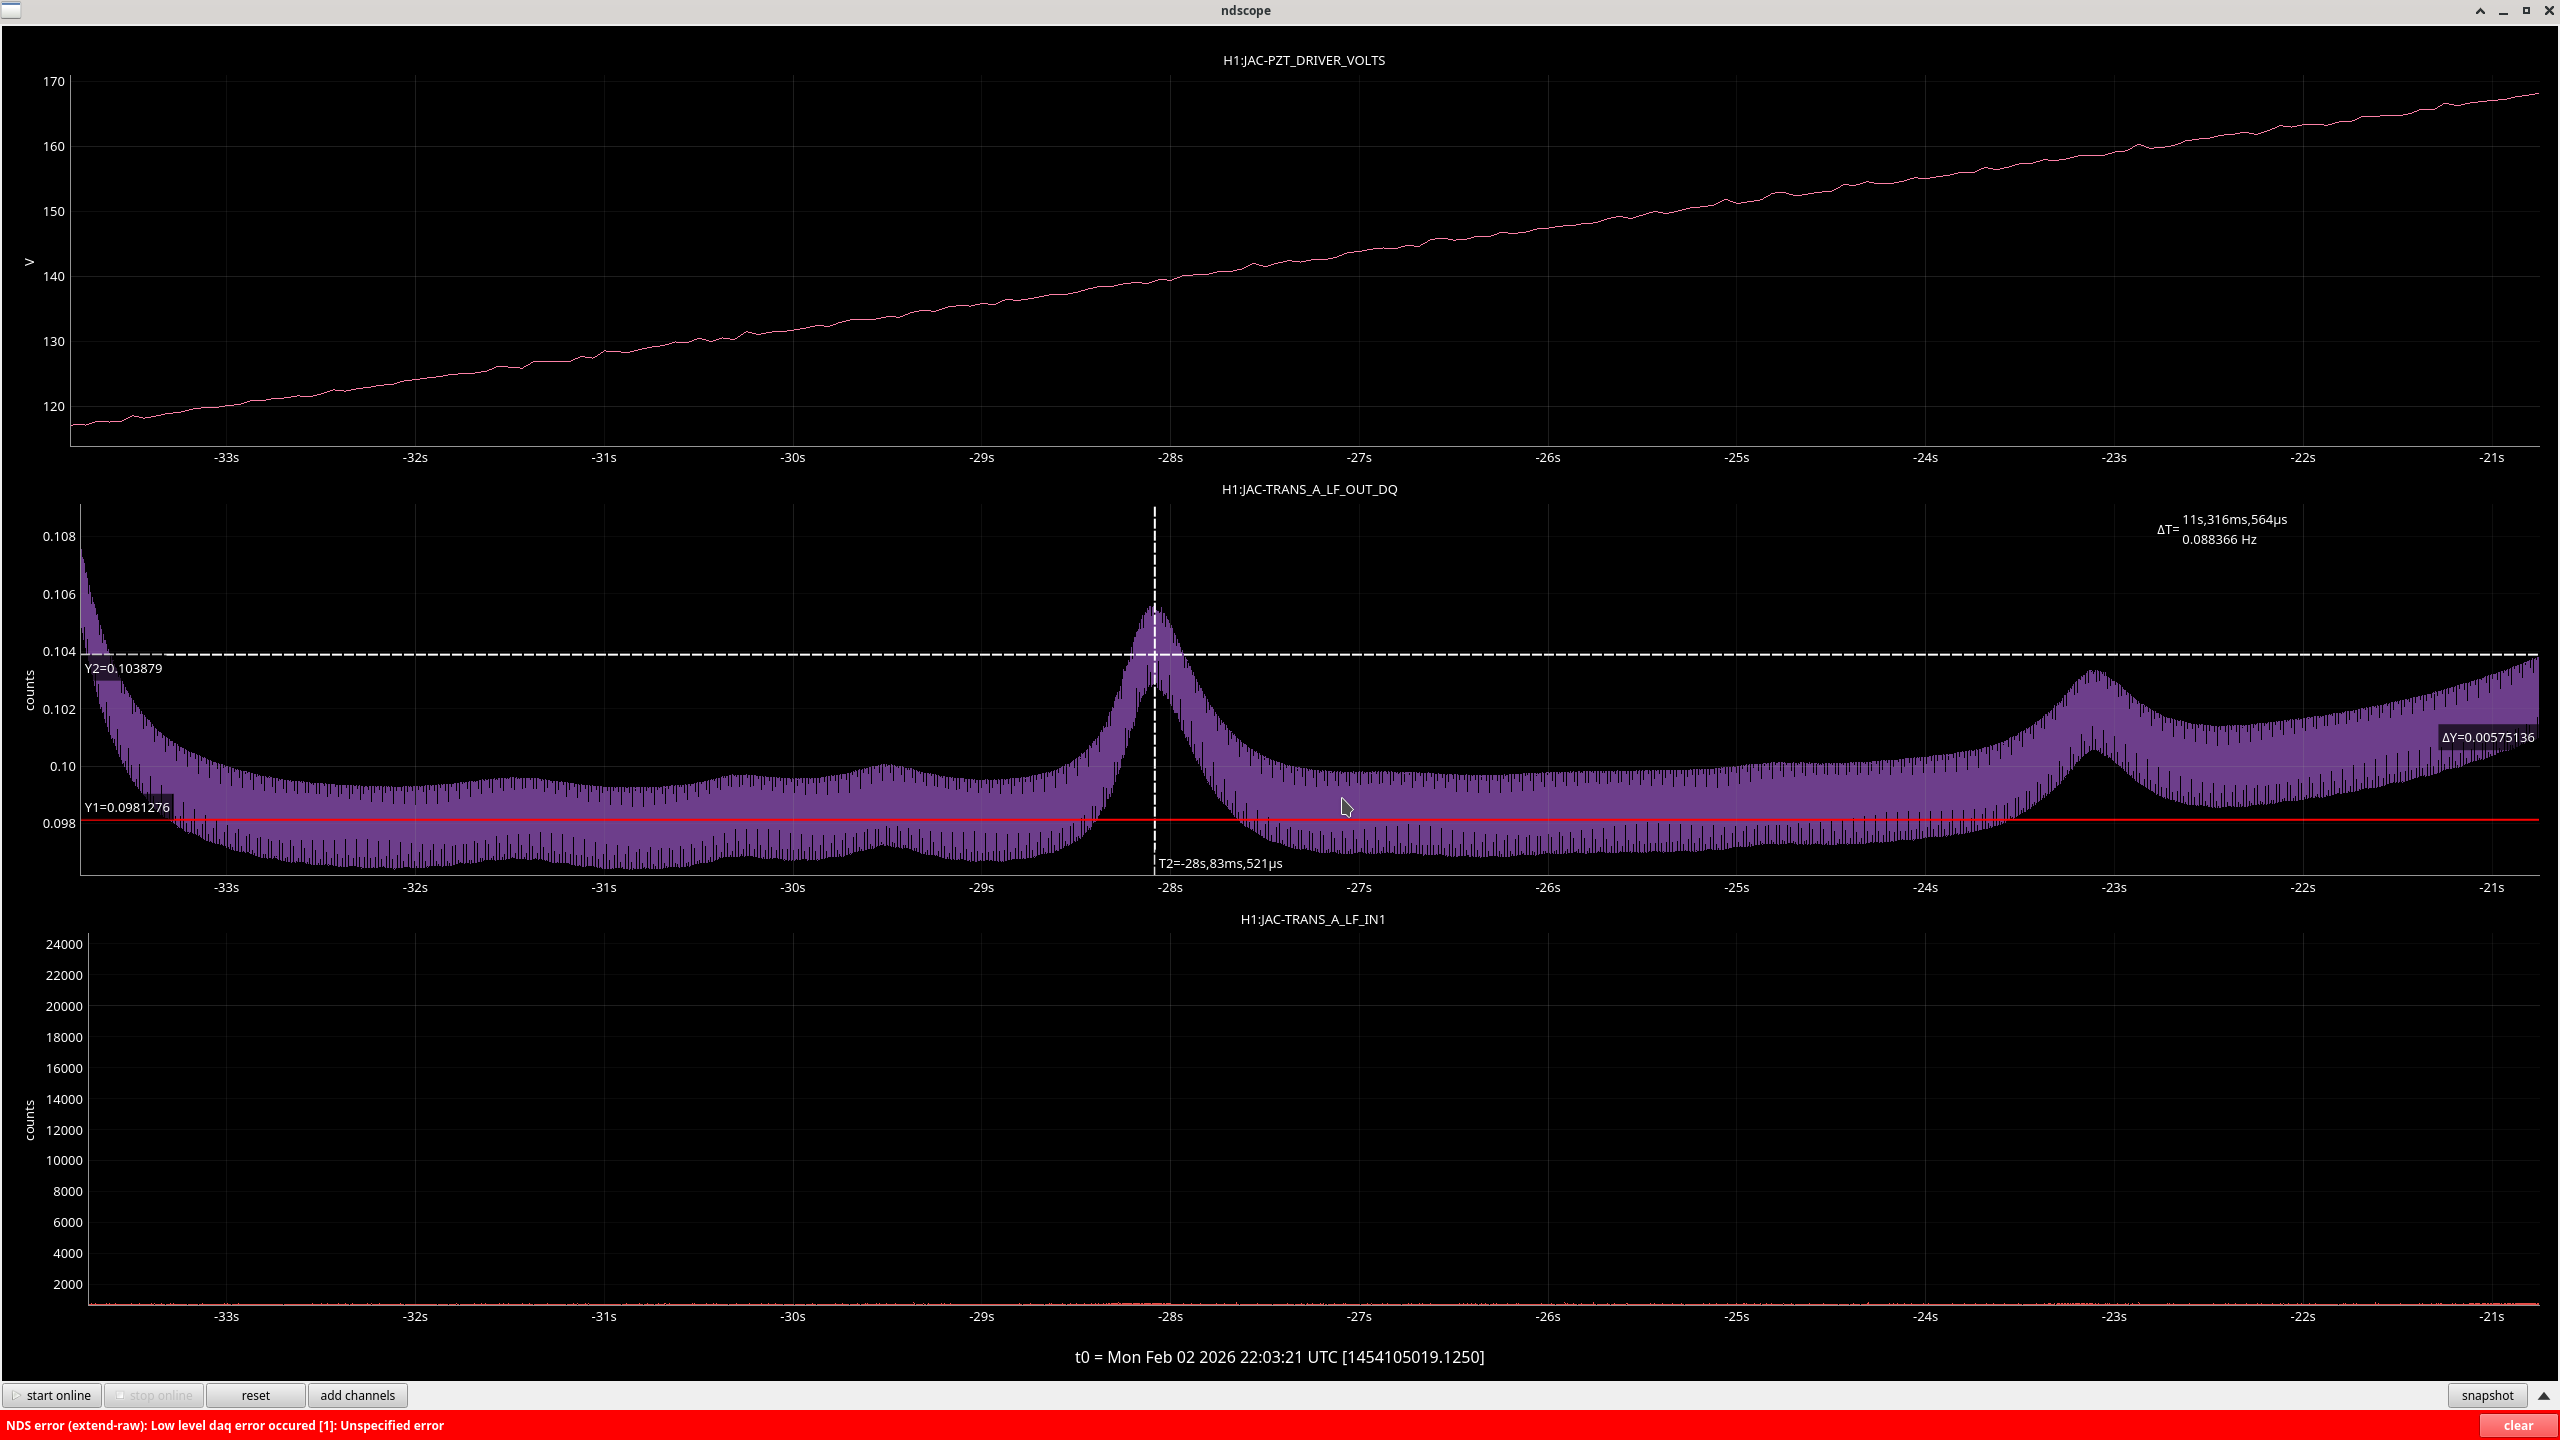
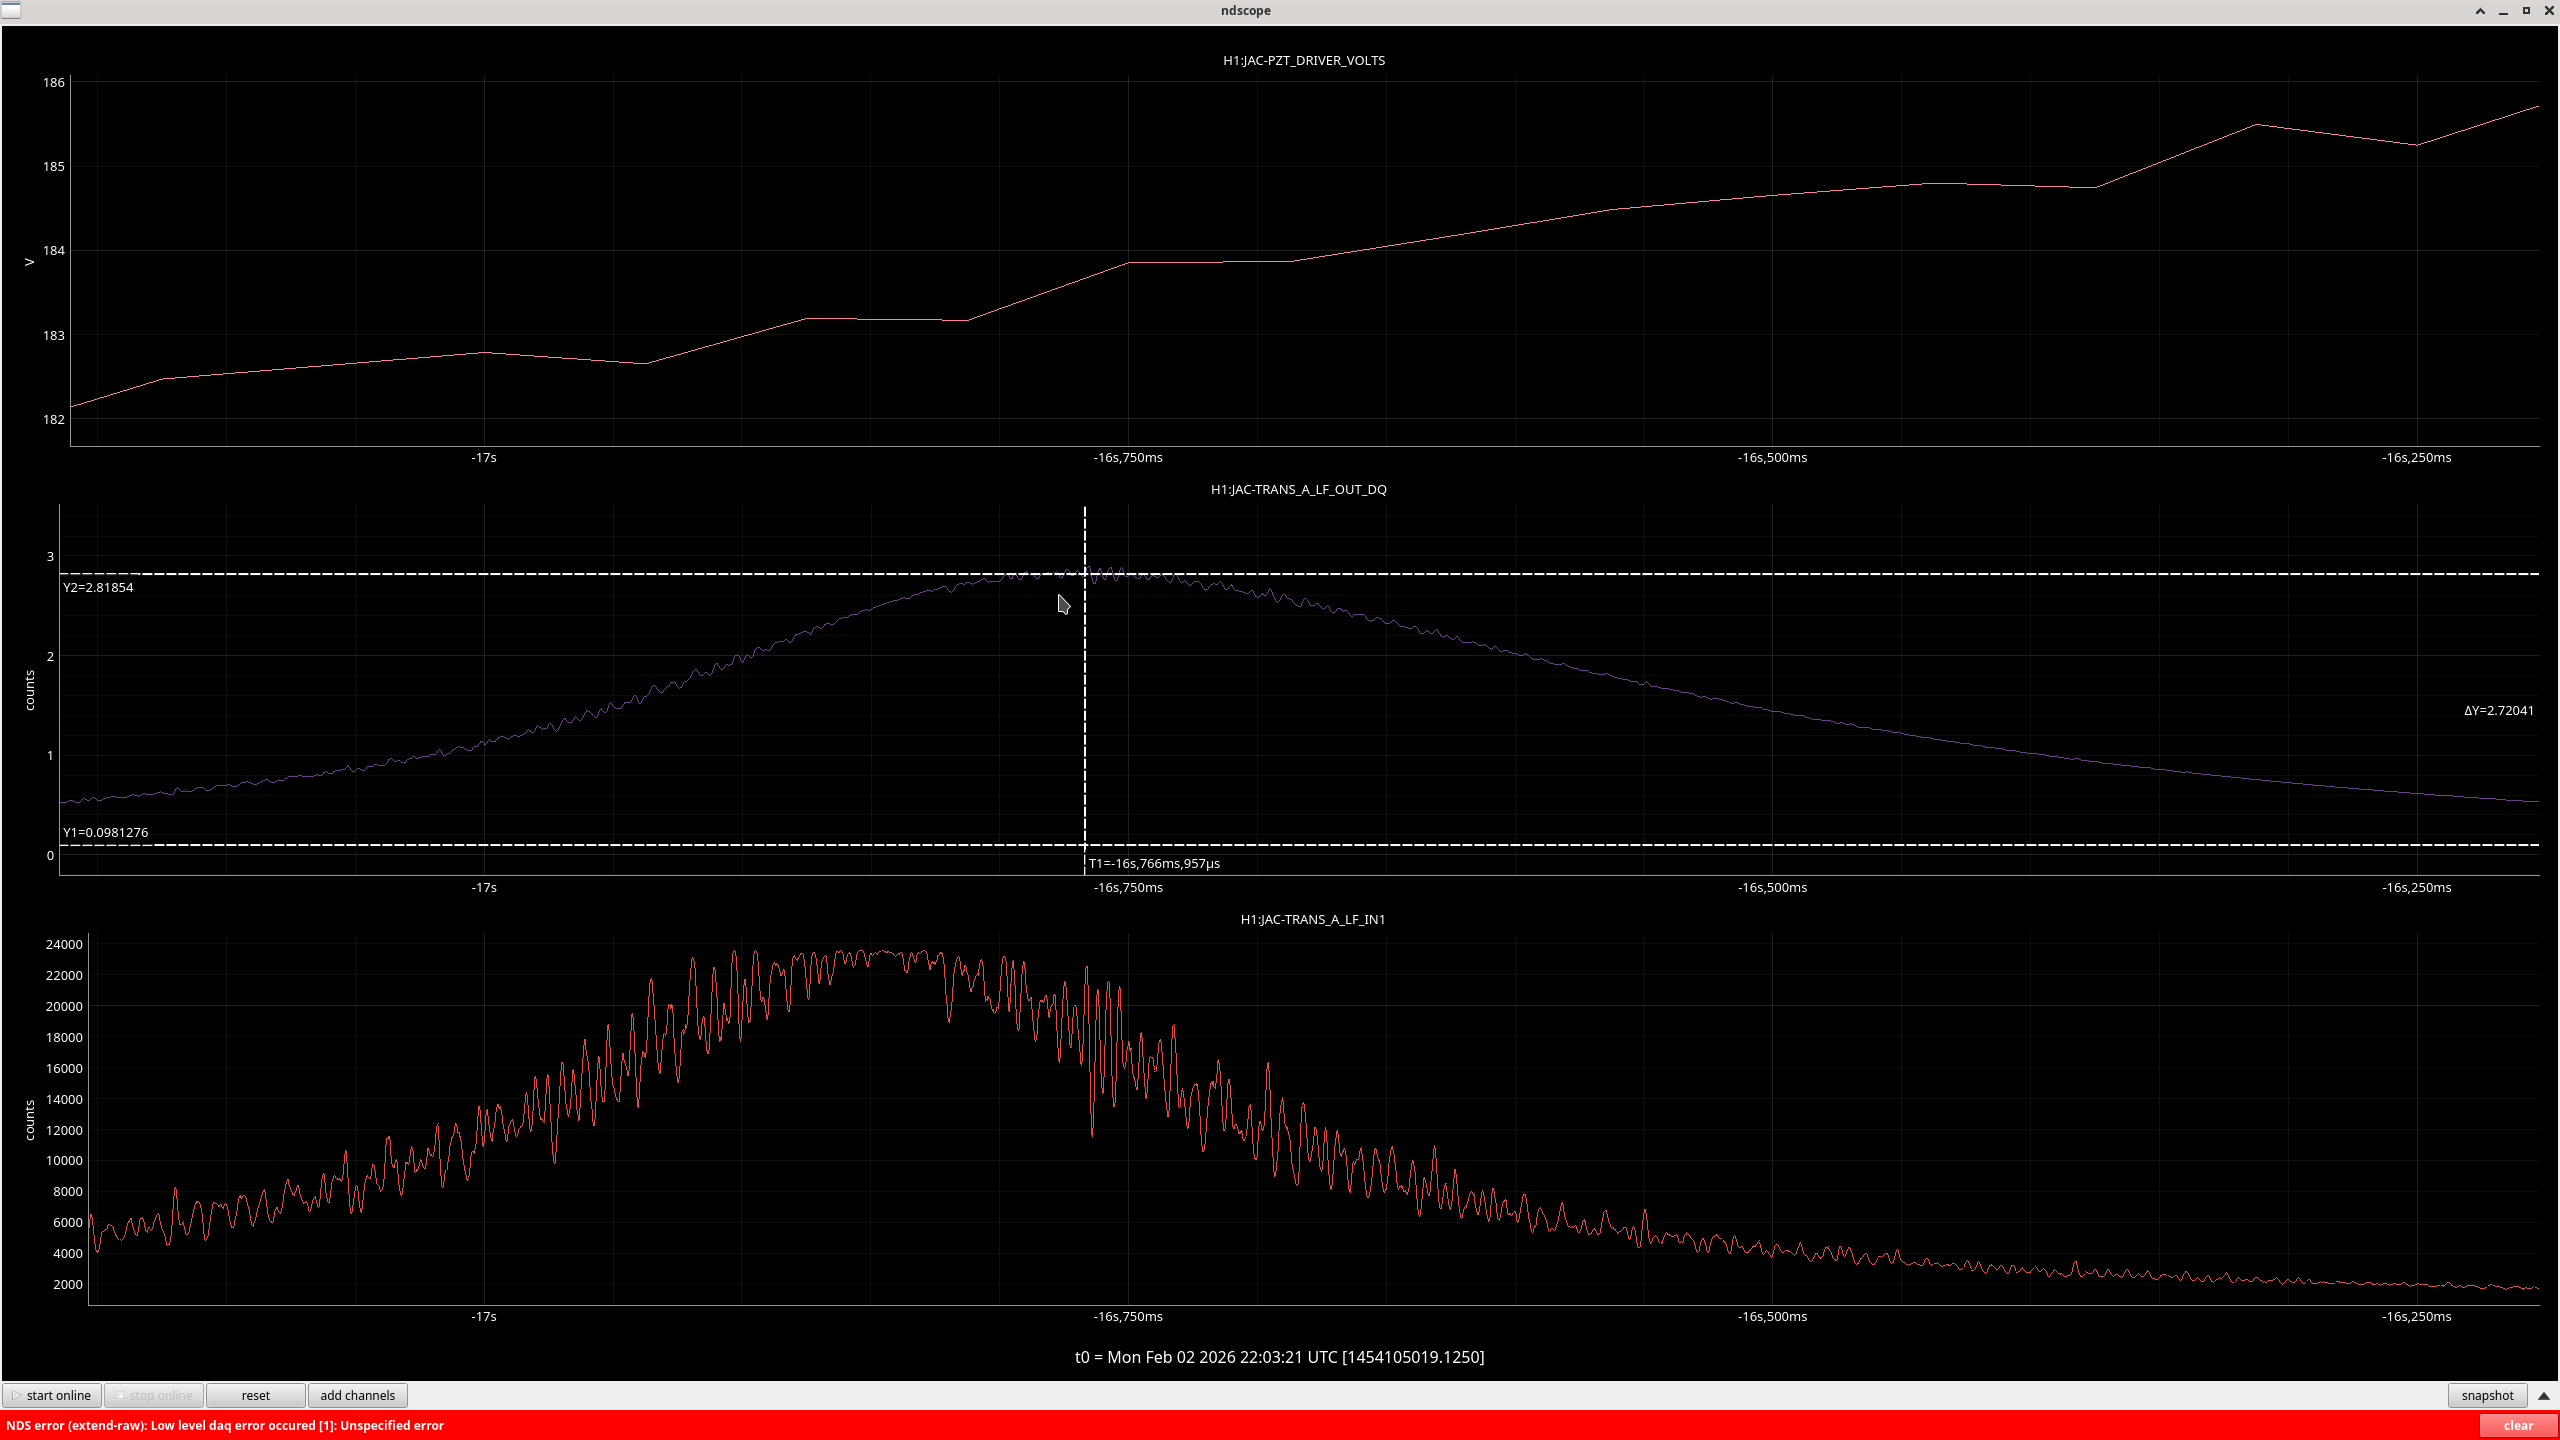
We took an OMC scan at 1W input power, shown here. Roughly calibrated into MHz with the known FSR.
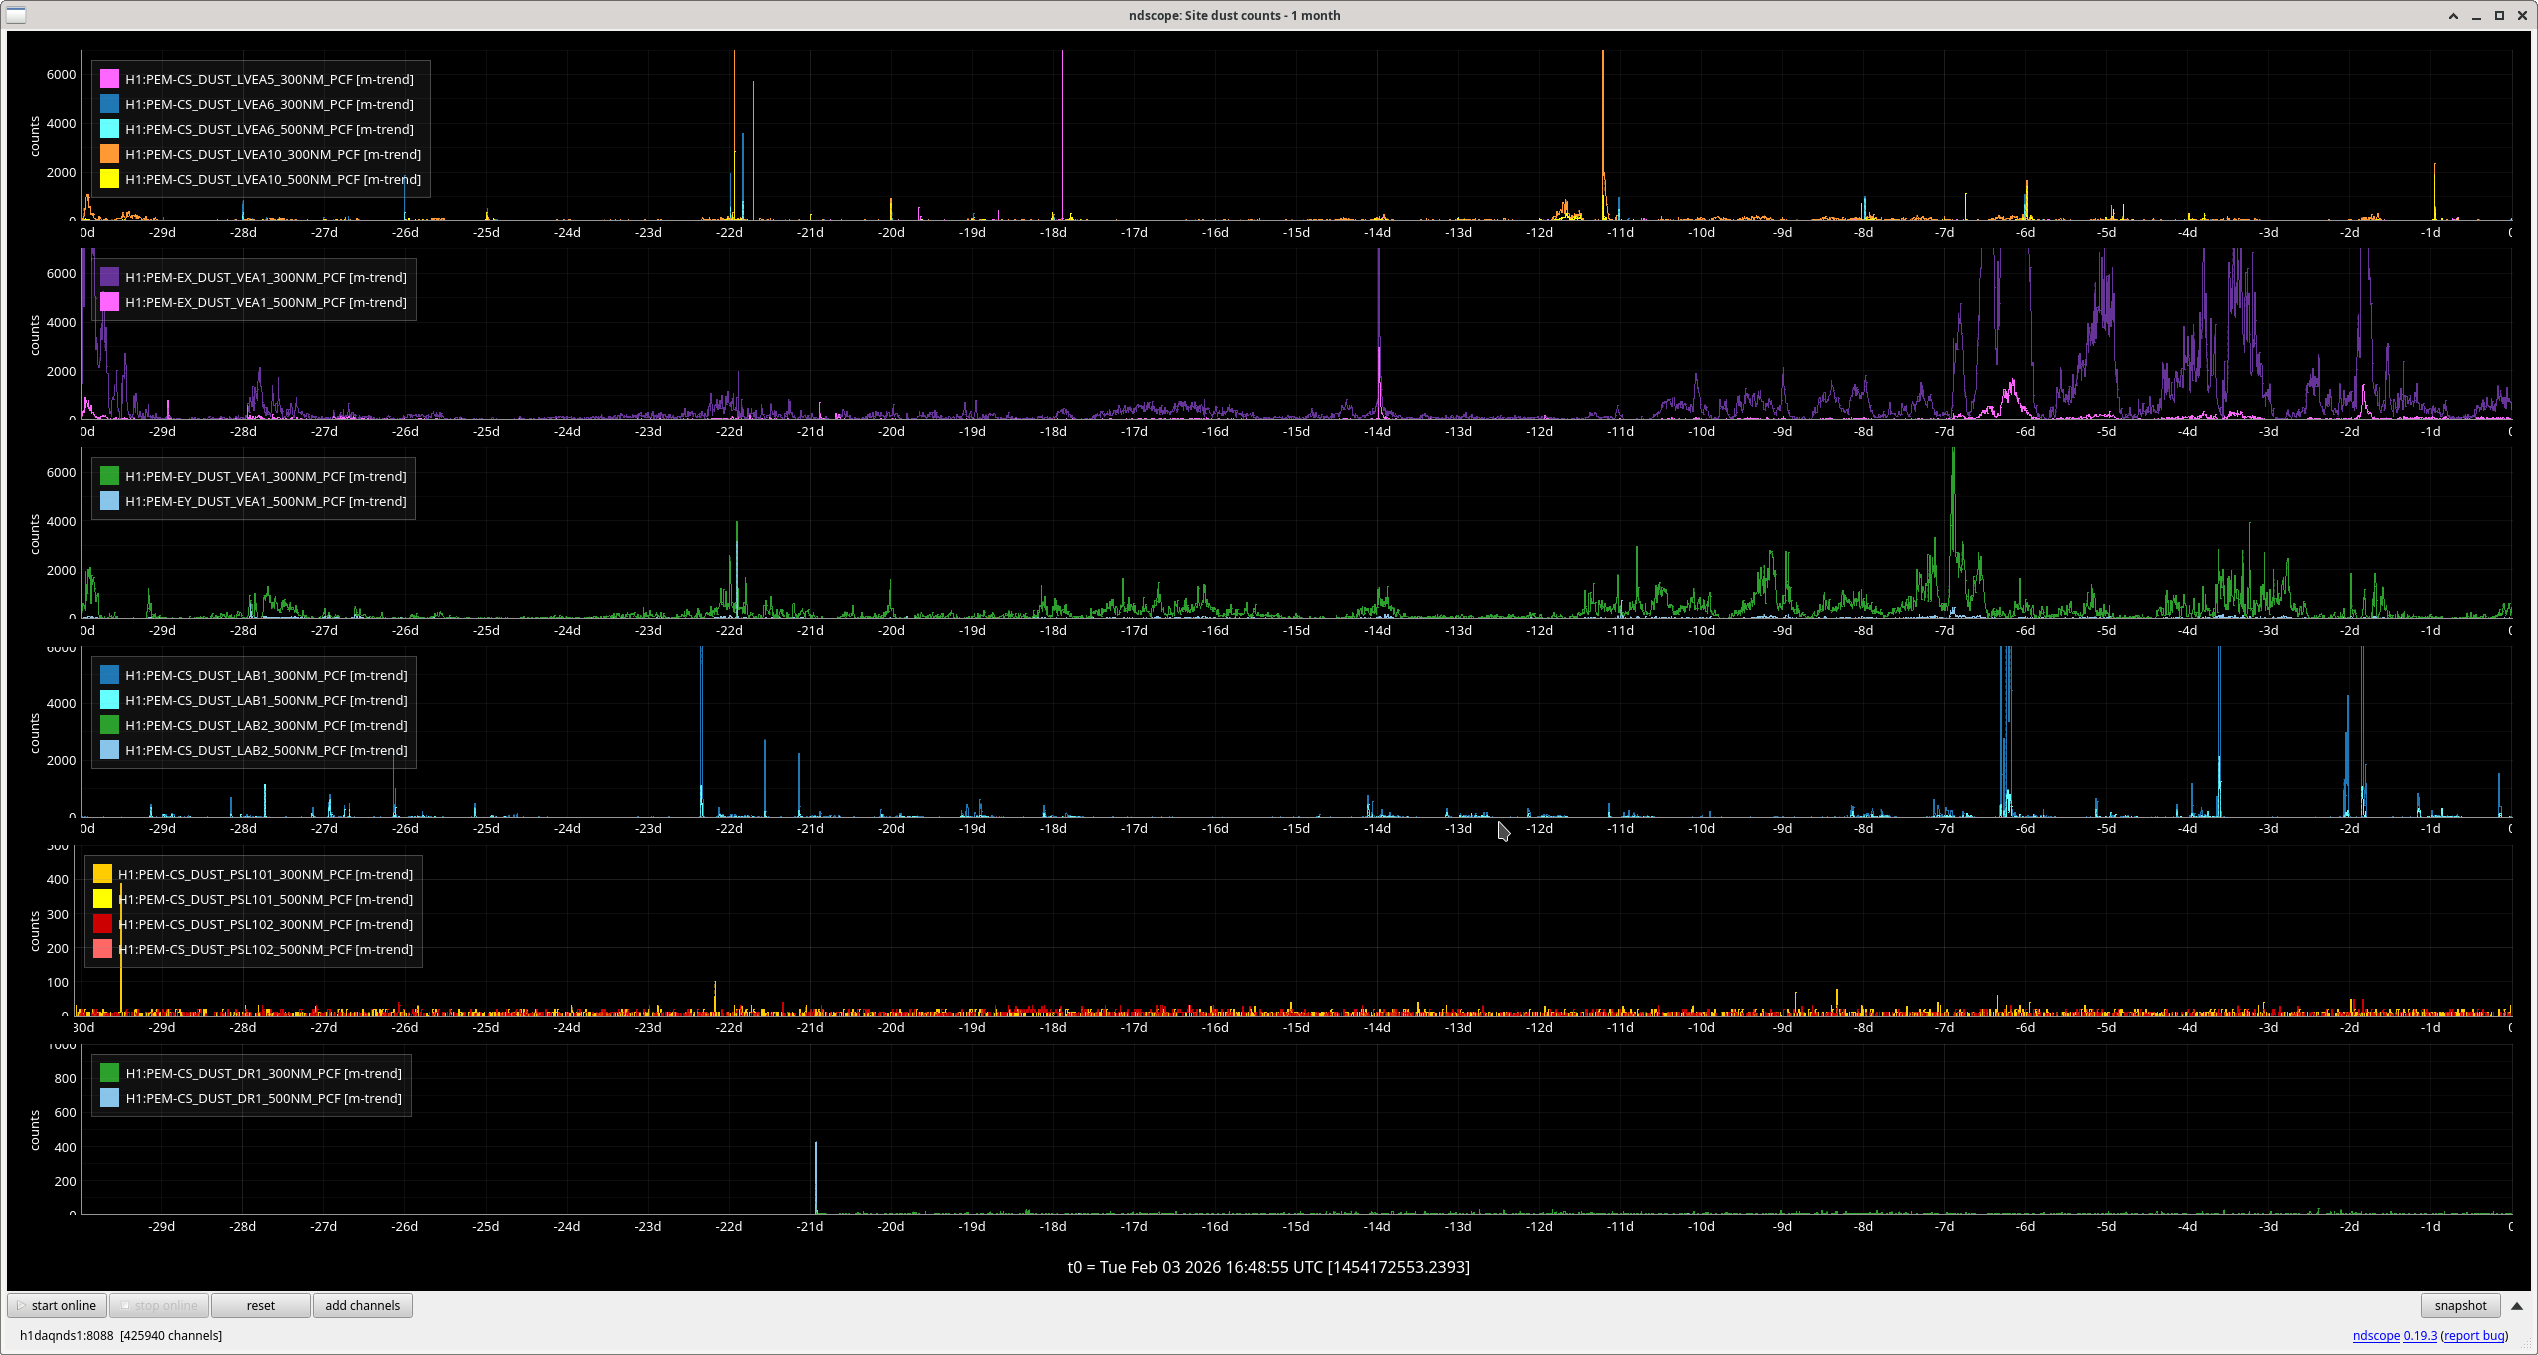
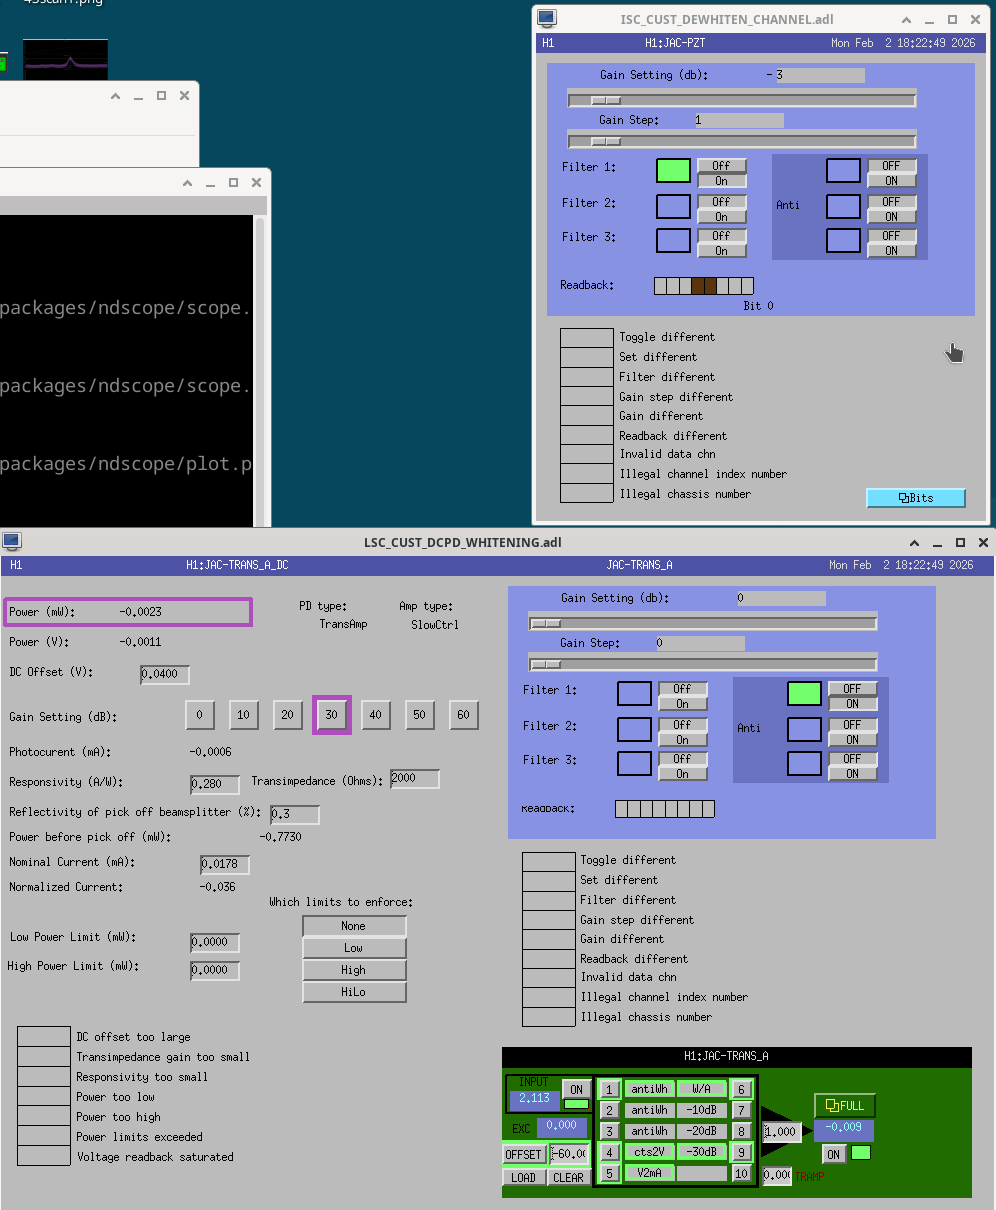
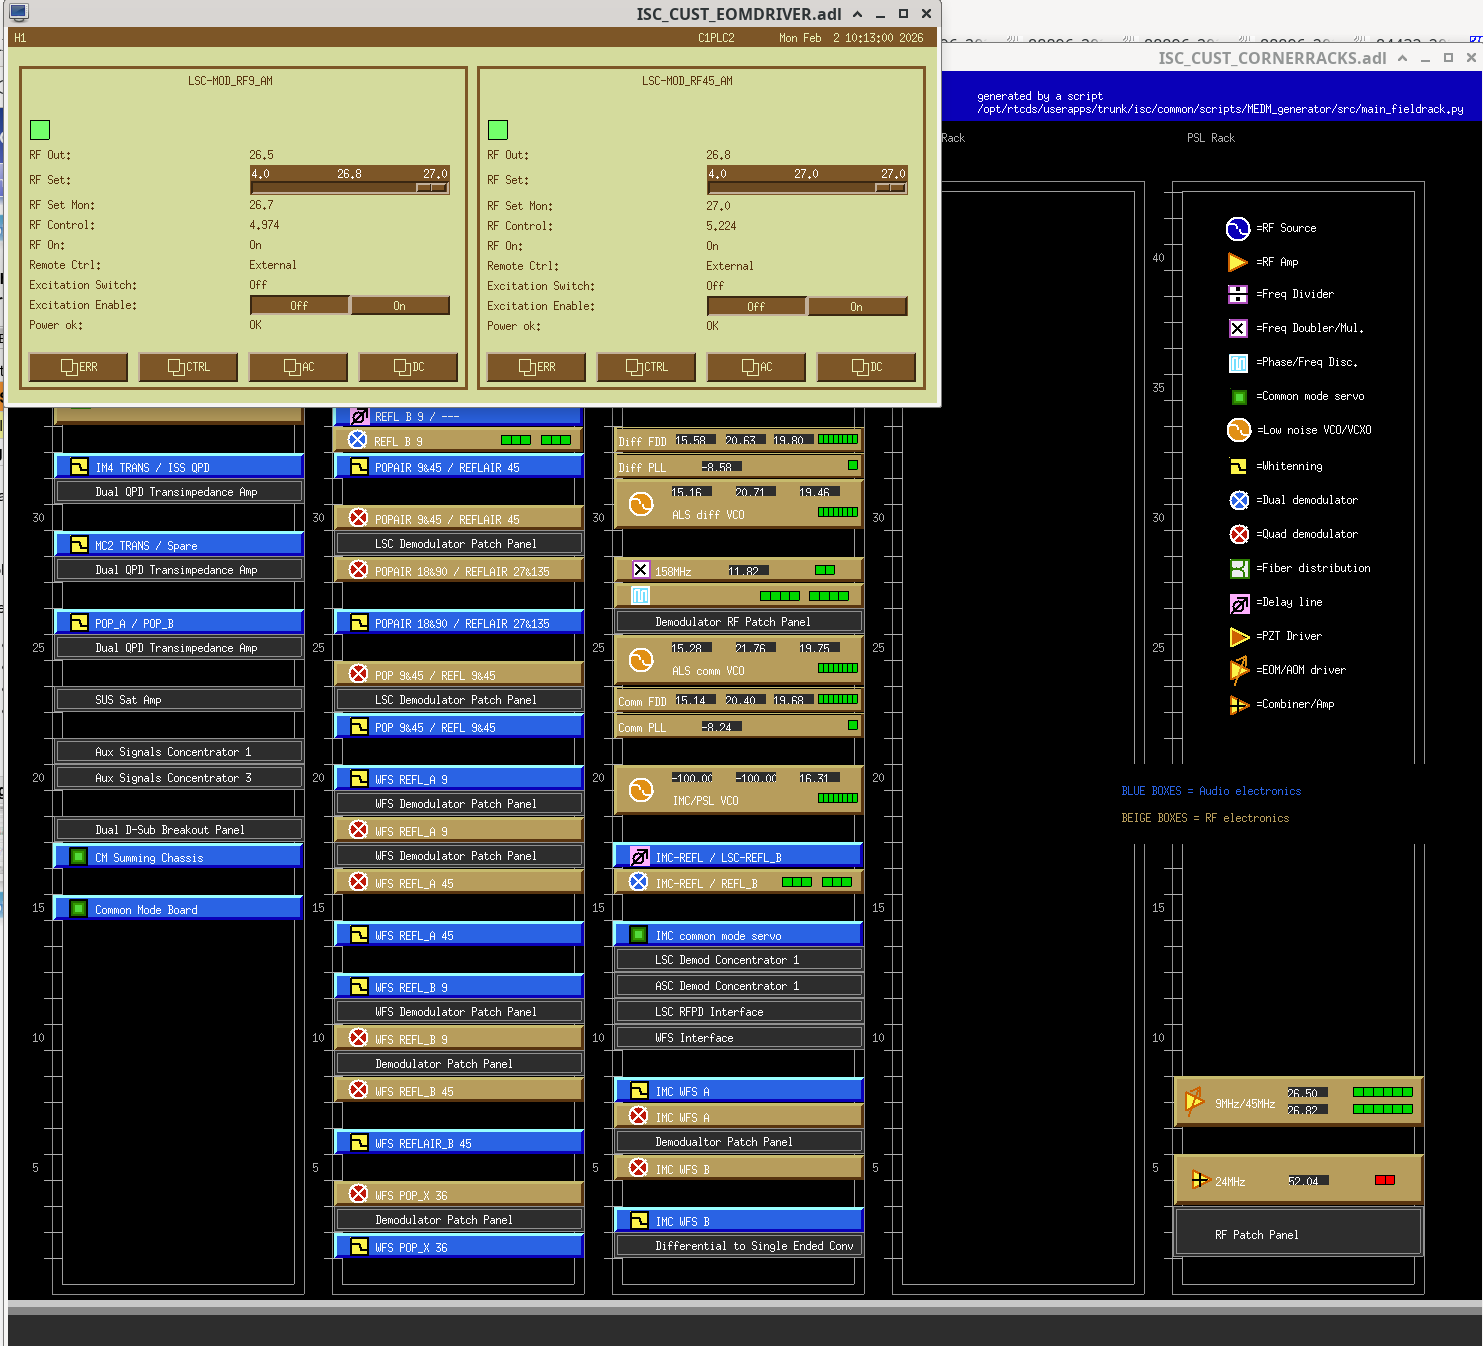
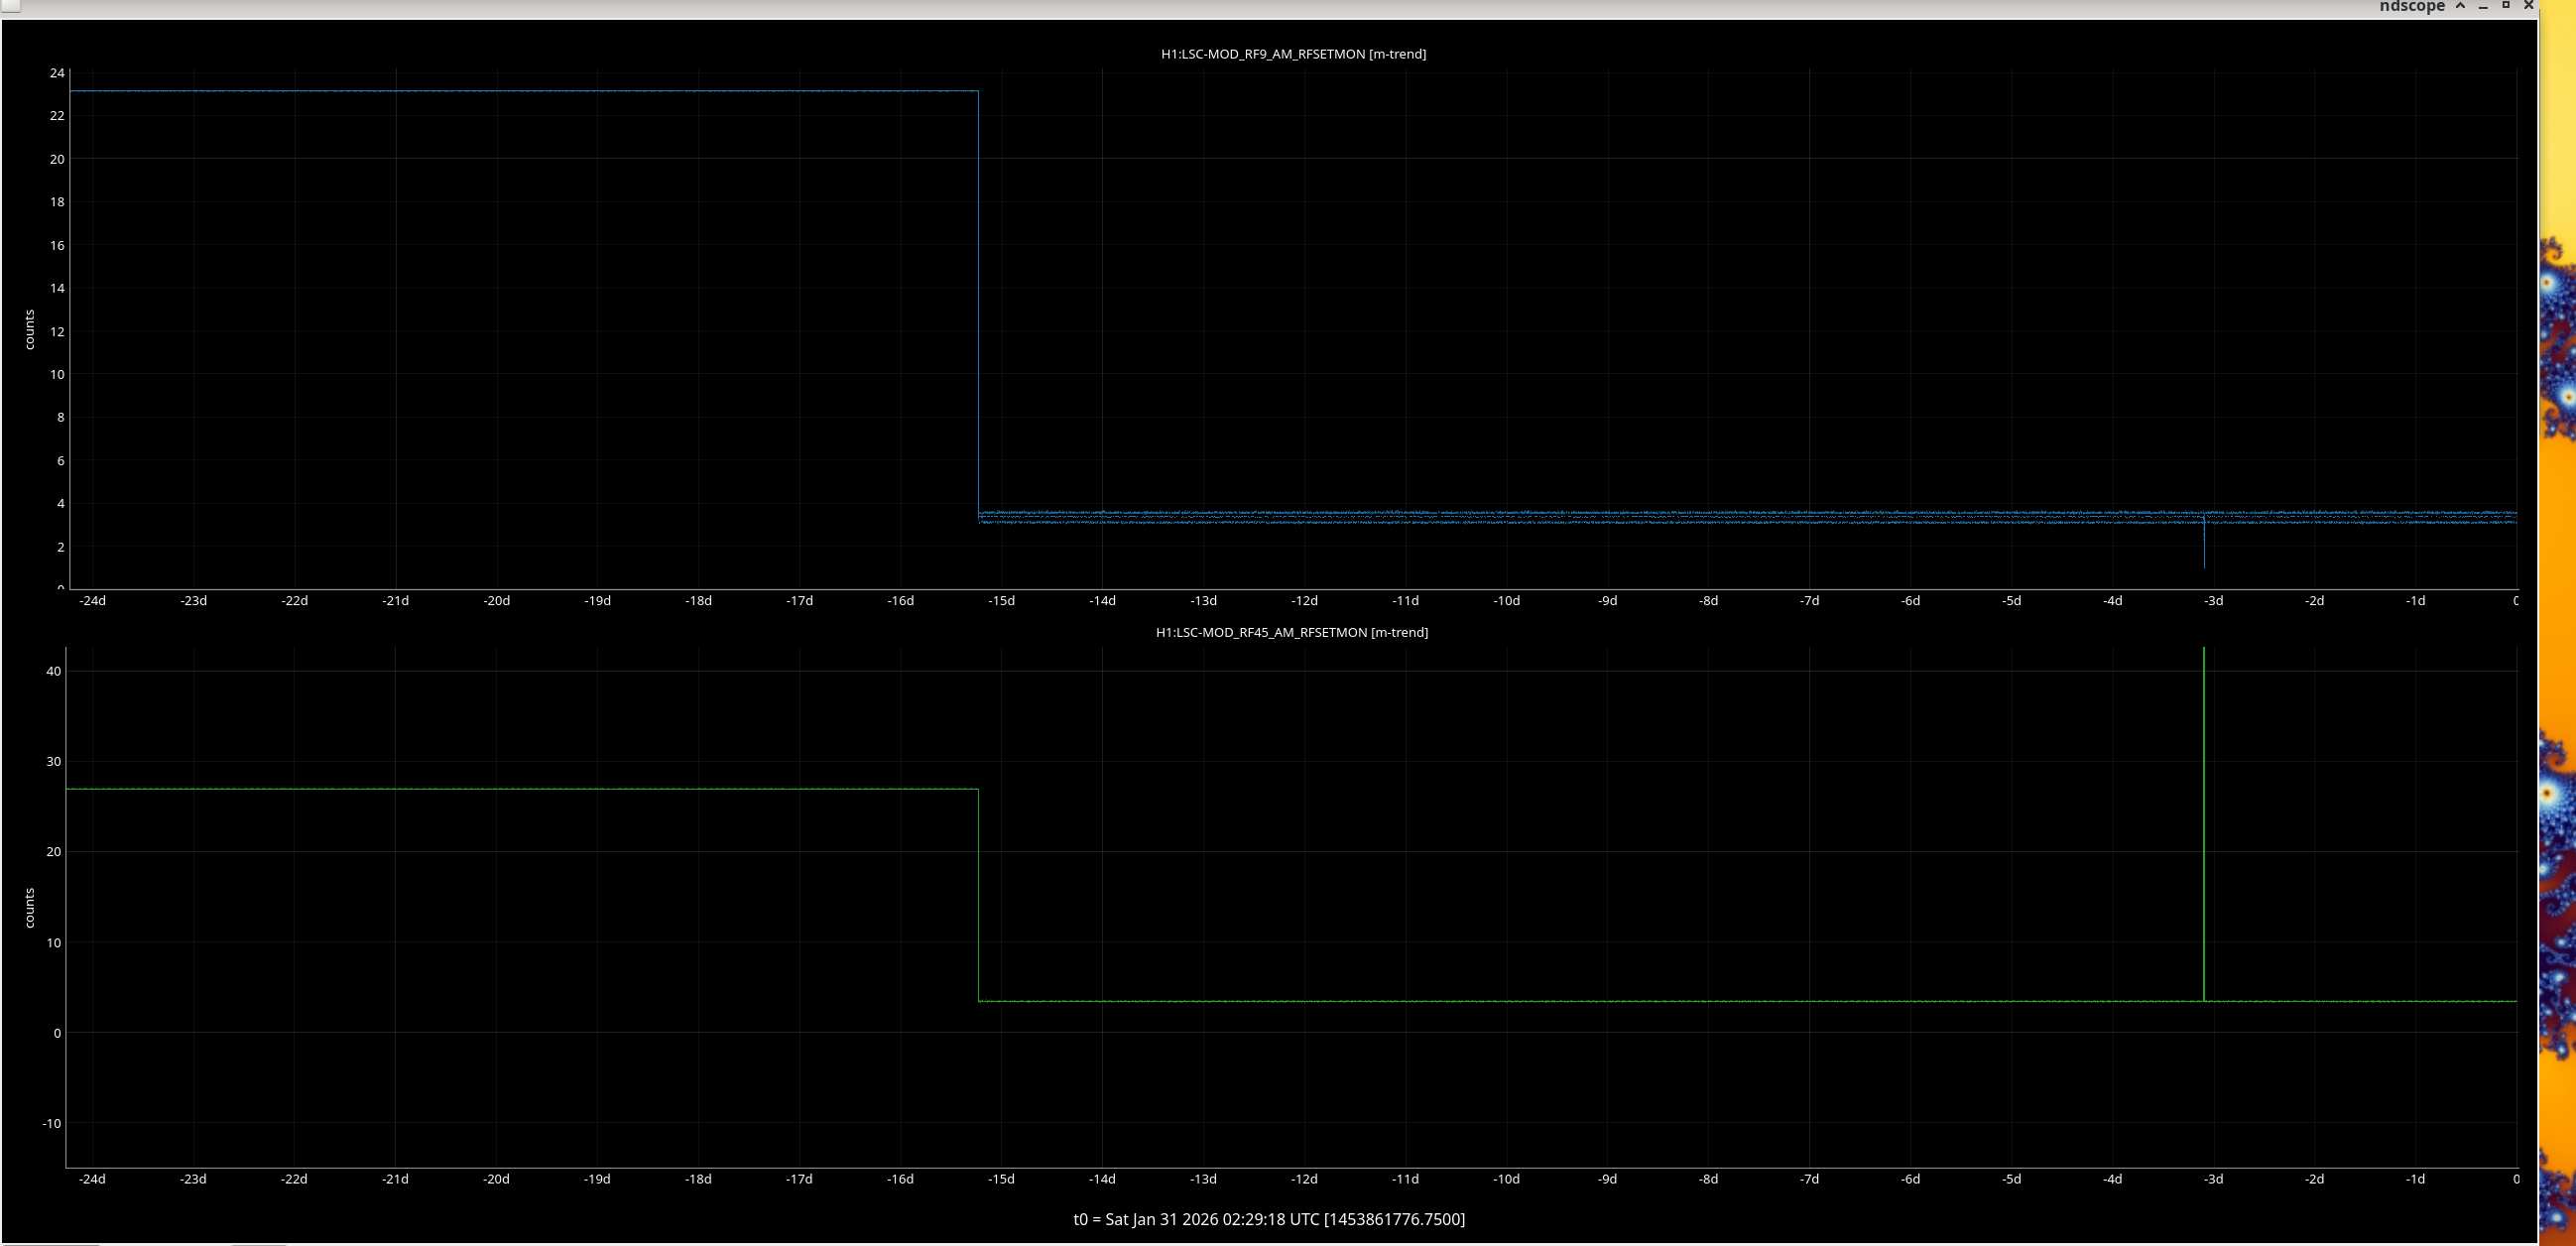
We cannot identify the 45MHz or 9MHz peaks, but after checking we realied that these RF driver powers were lowered 15 days ago. See image.
We will come back to this Monday.
Jason put back the rotation stage, locked it out and closed the light pipe.


PM1 issue was due to coil drive swap in Dec 2025 - https://alog.ligo-wa.caltech.edu/aLOG/index.php?callRep=88998
Nothing wrong with the BOSEMs. cable or suspension.