First ENDX Station Measurement:
During the Tuesday maintenace, the PCAL team( Rick Savage & Tony Sanchez) went to ENDX with Working Standard Hanford aka WSH(PS4) and took an End station measurement.
But the Upper PCAL BEAM had been move to the left by 5 mm last week. See alog https://alog.ligo-wa.caltech.edu/aLOG/index.php?callRep=72063.
We liked the idea of doing a calibration measurement with the beam off to the left just to try and see the effects of the offset on the calibration.
Because of limitations of our analysis tool which names files with a date stamp, the folder name for this non nominal measurement is tD20230821 even though it actually took place on Tuesday 2023-08-22.
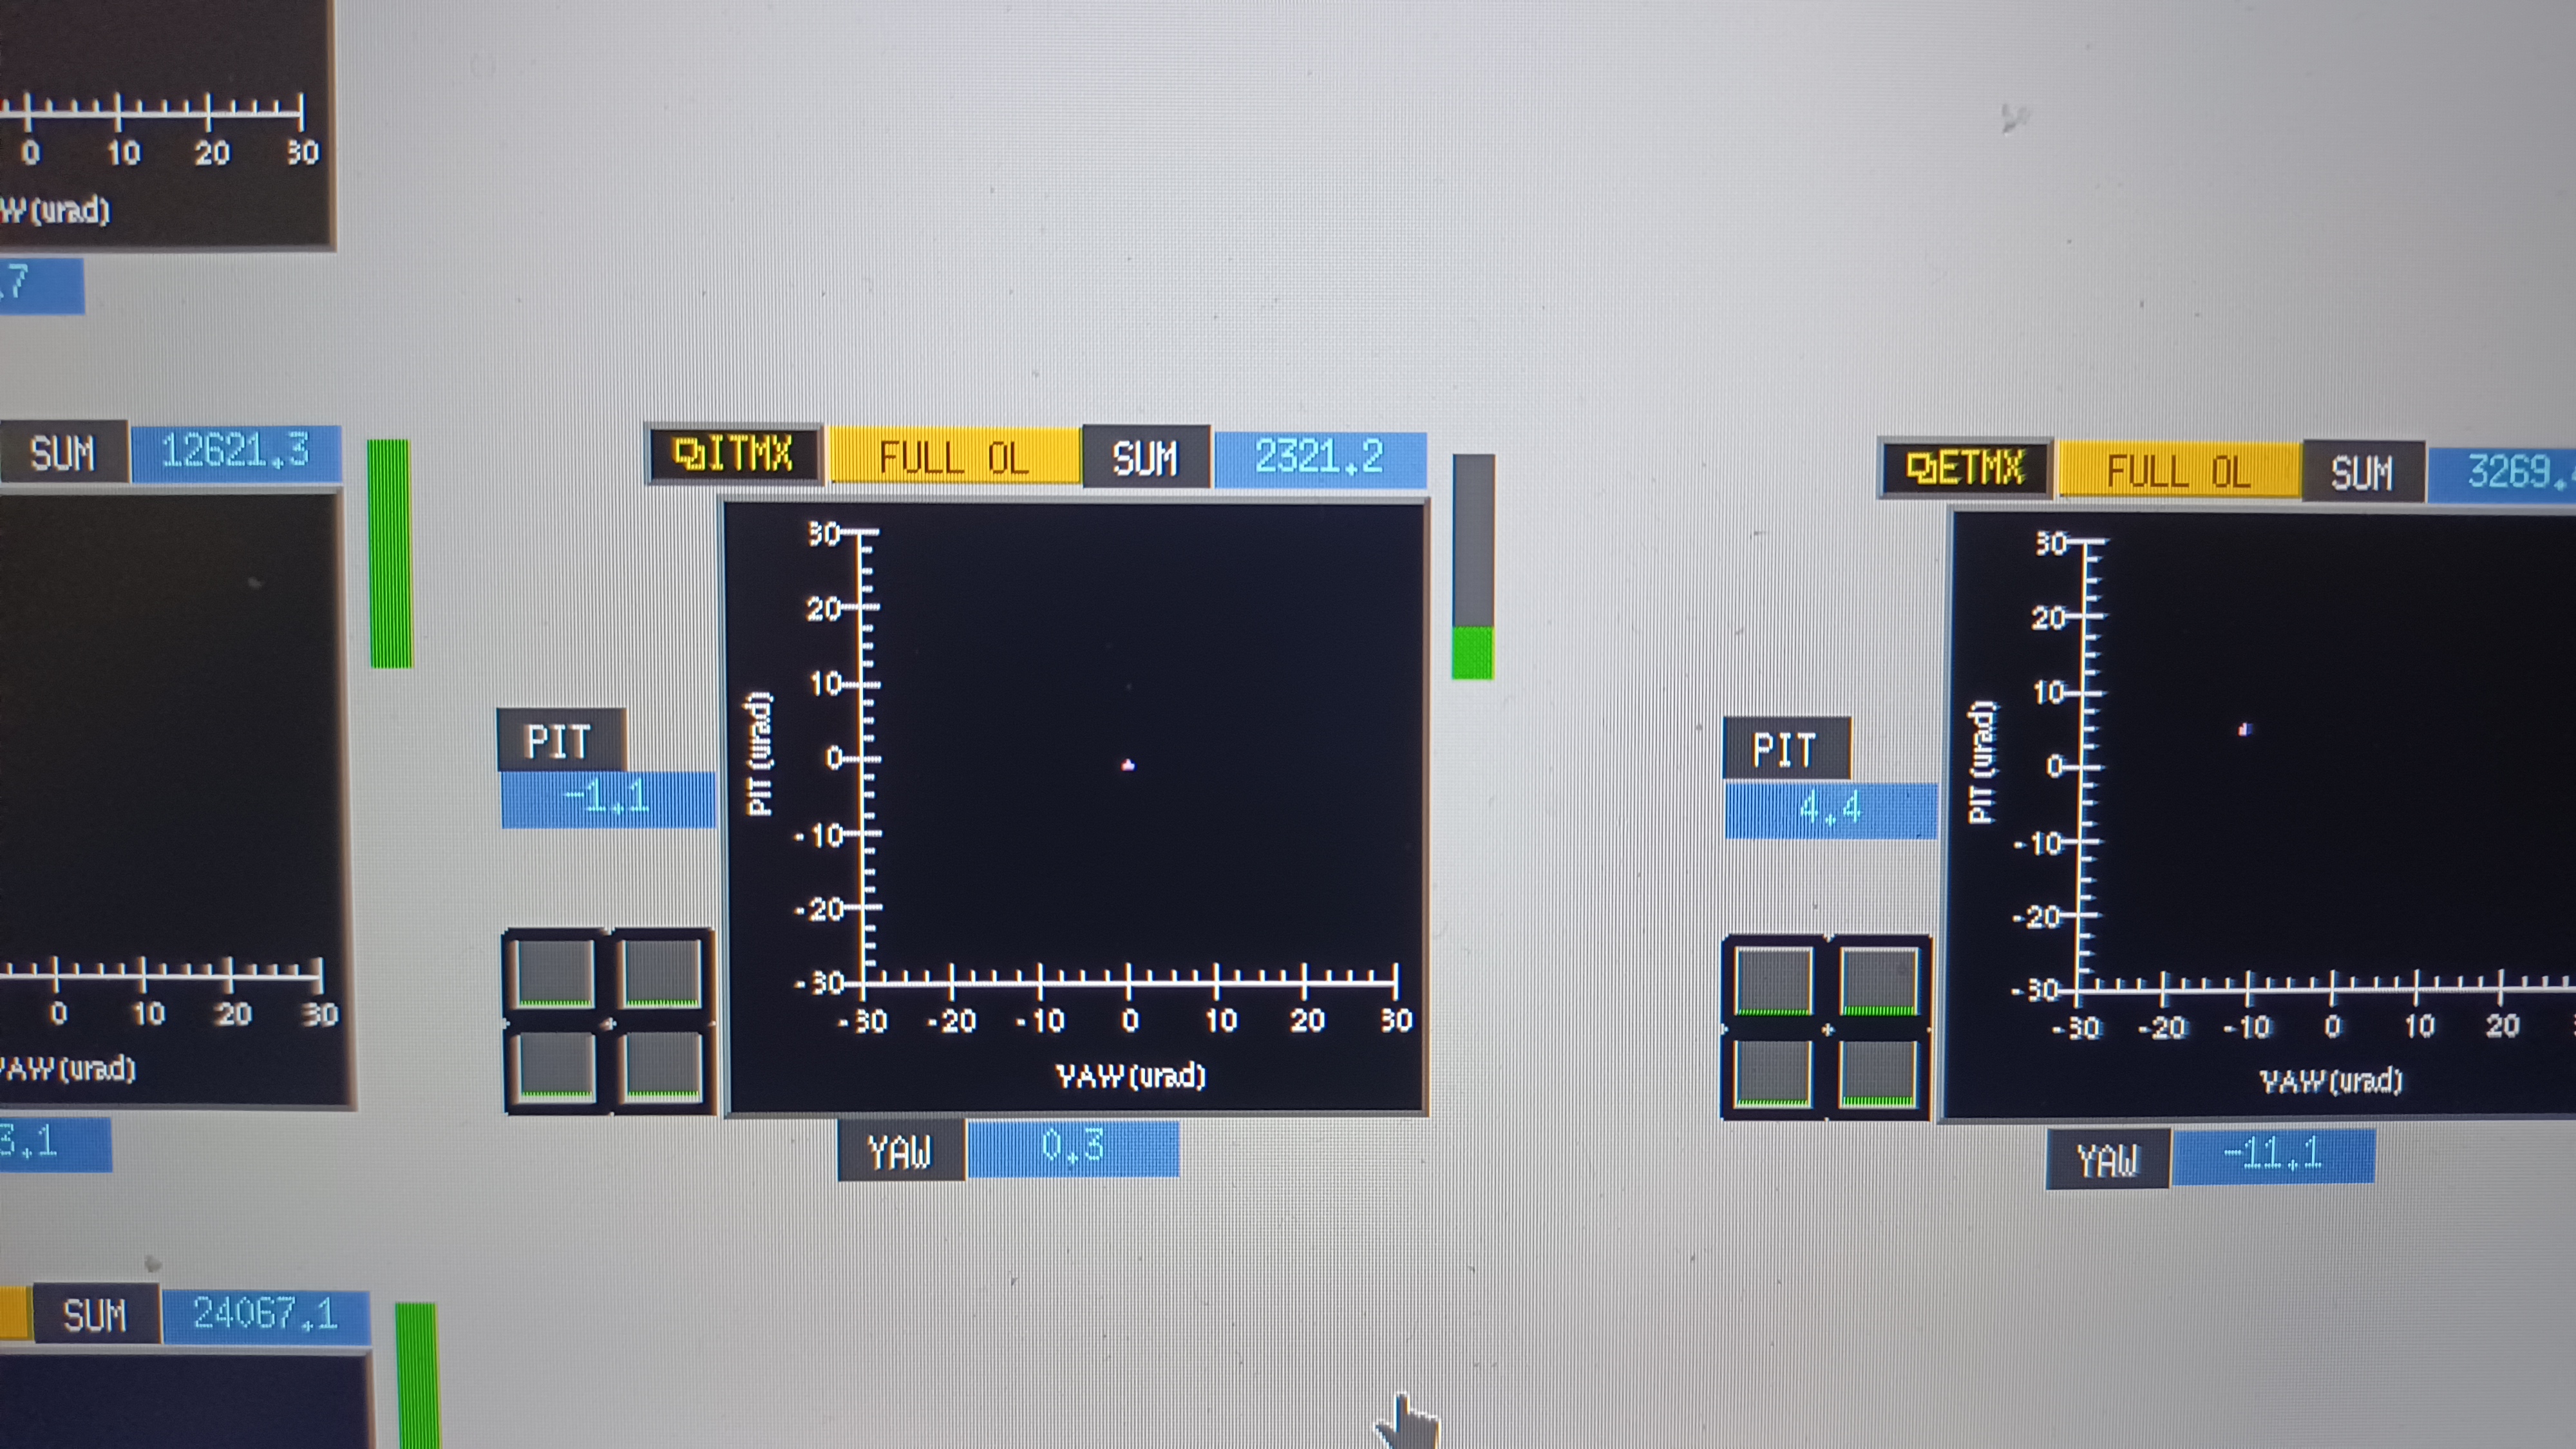
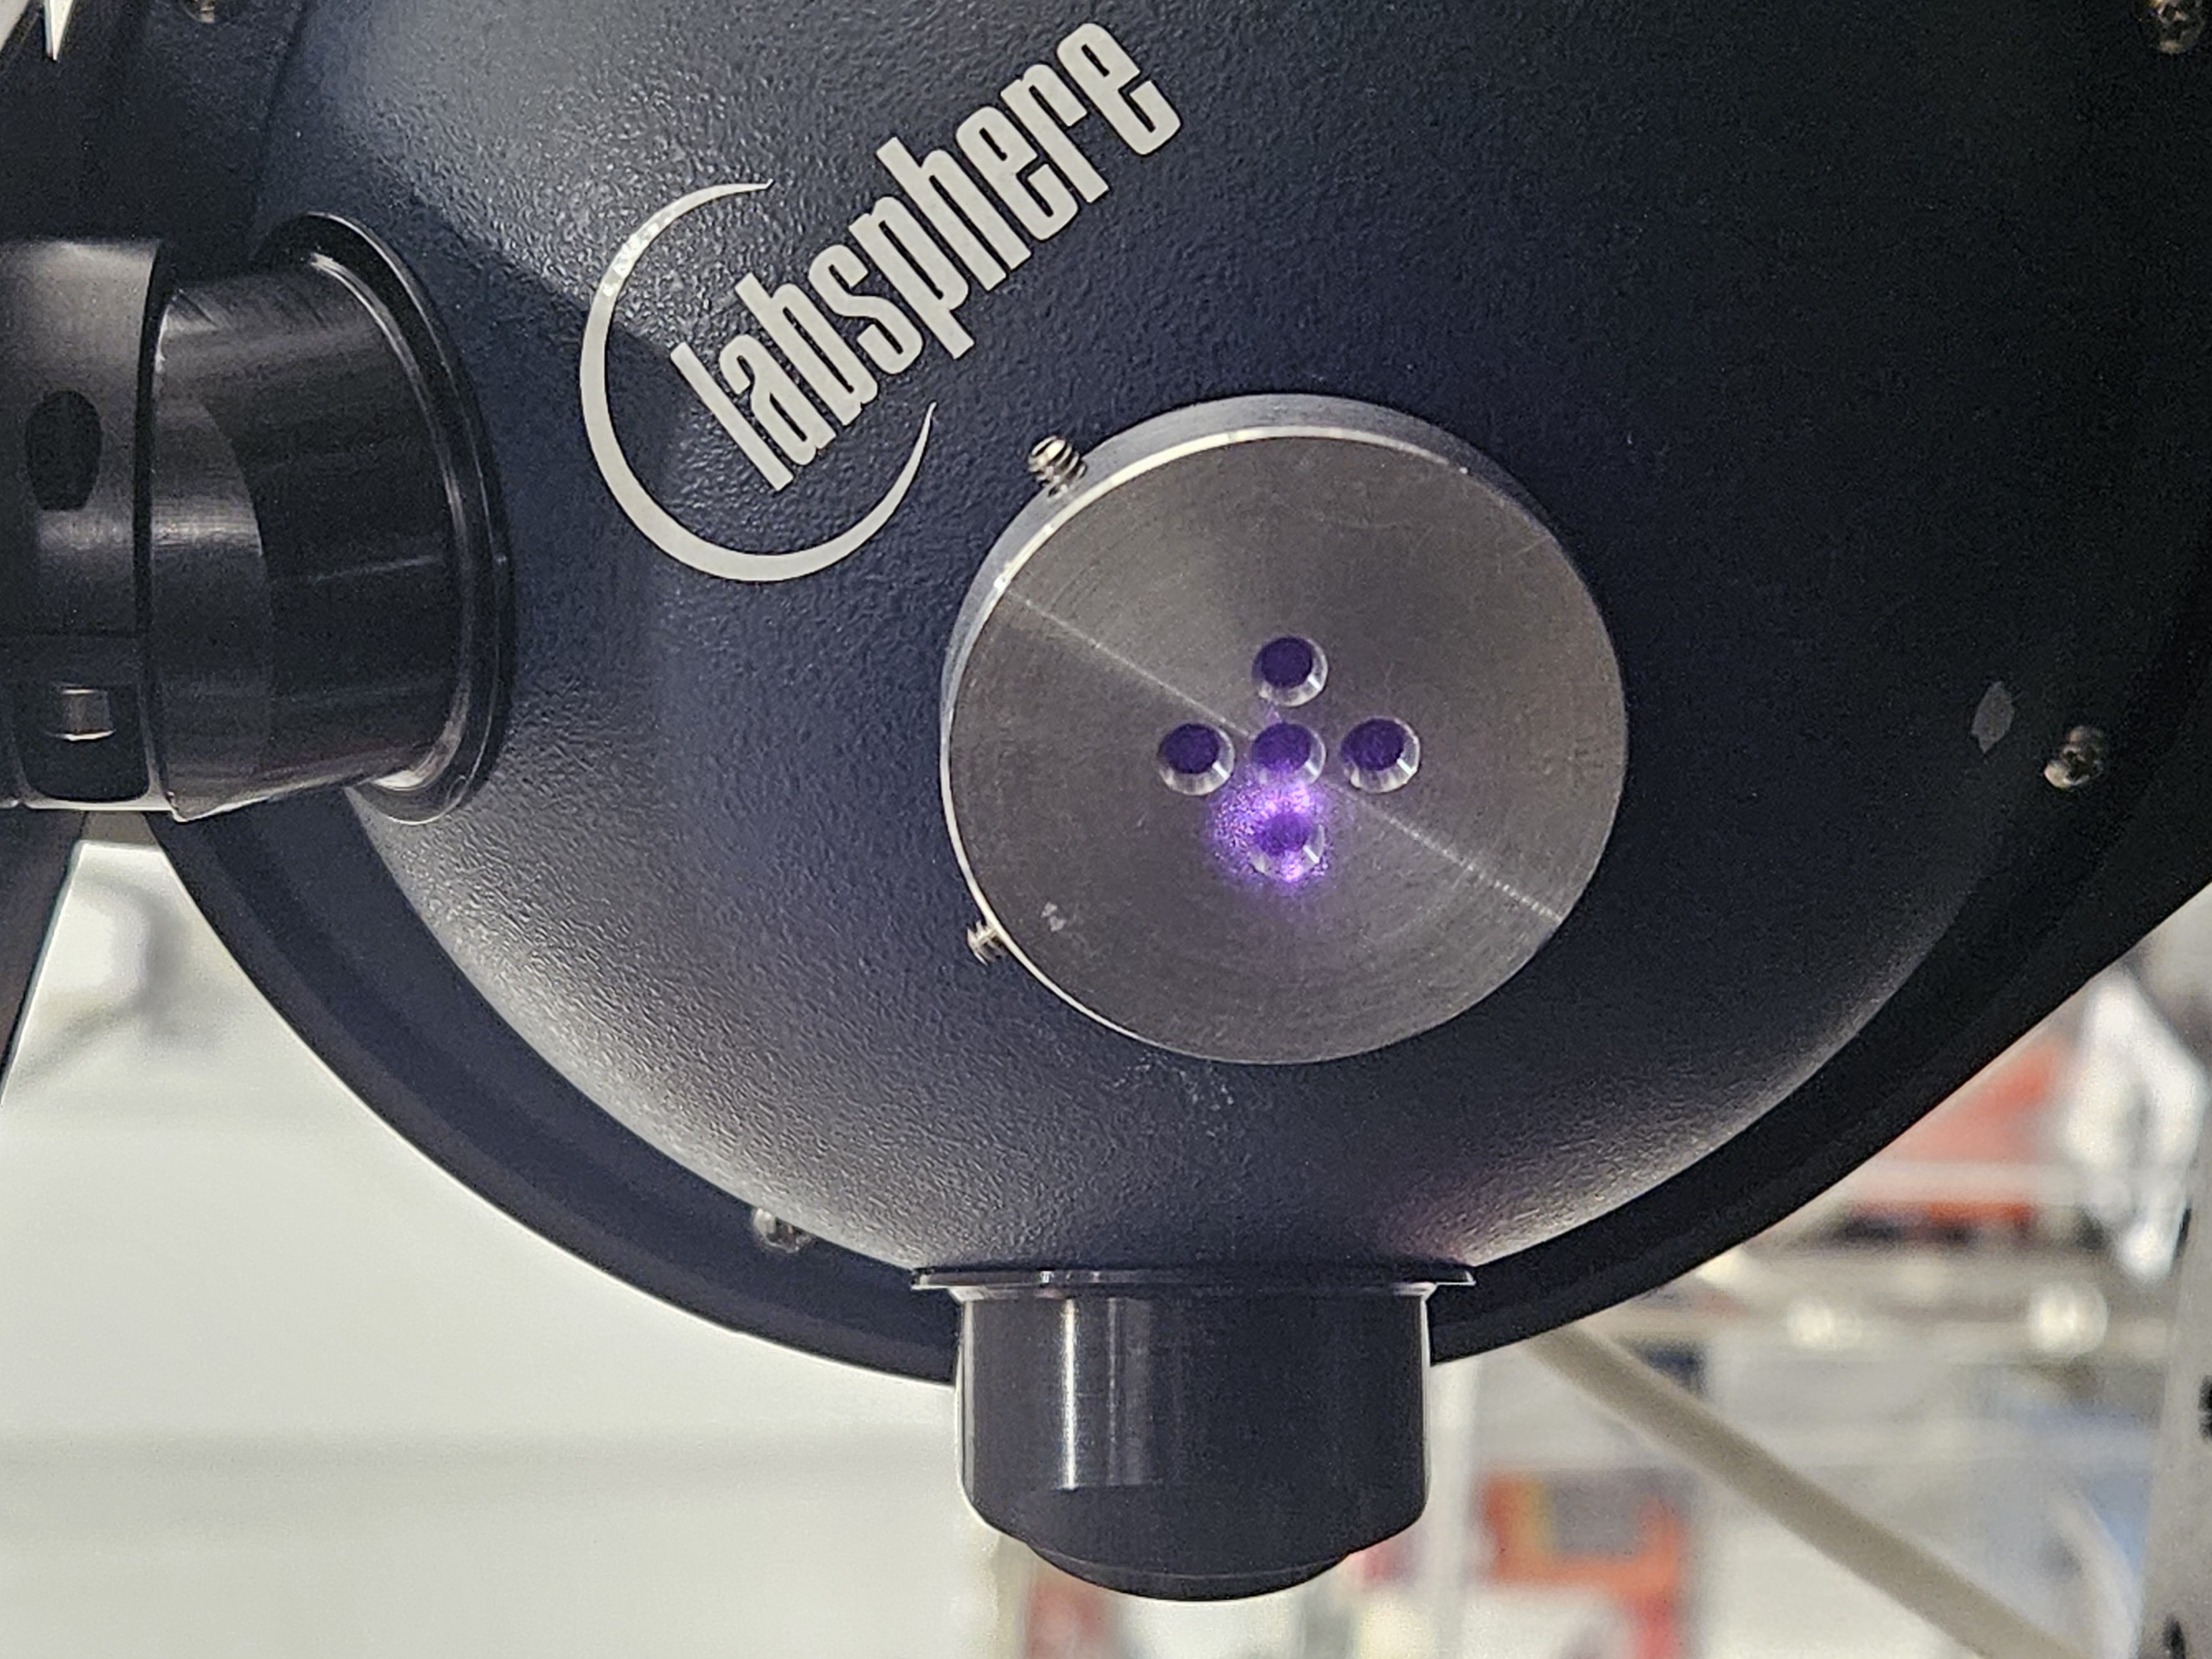
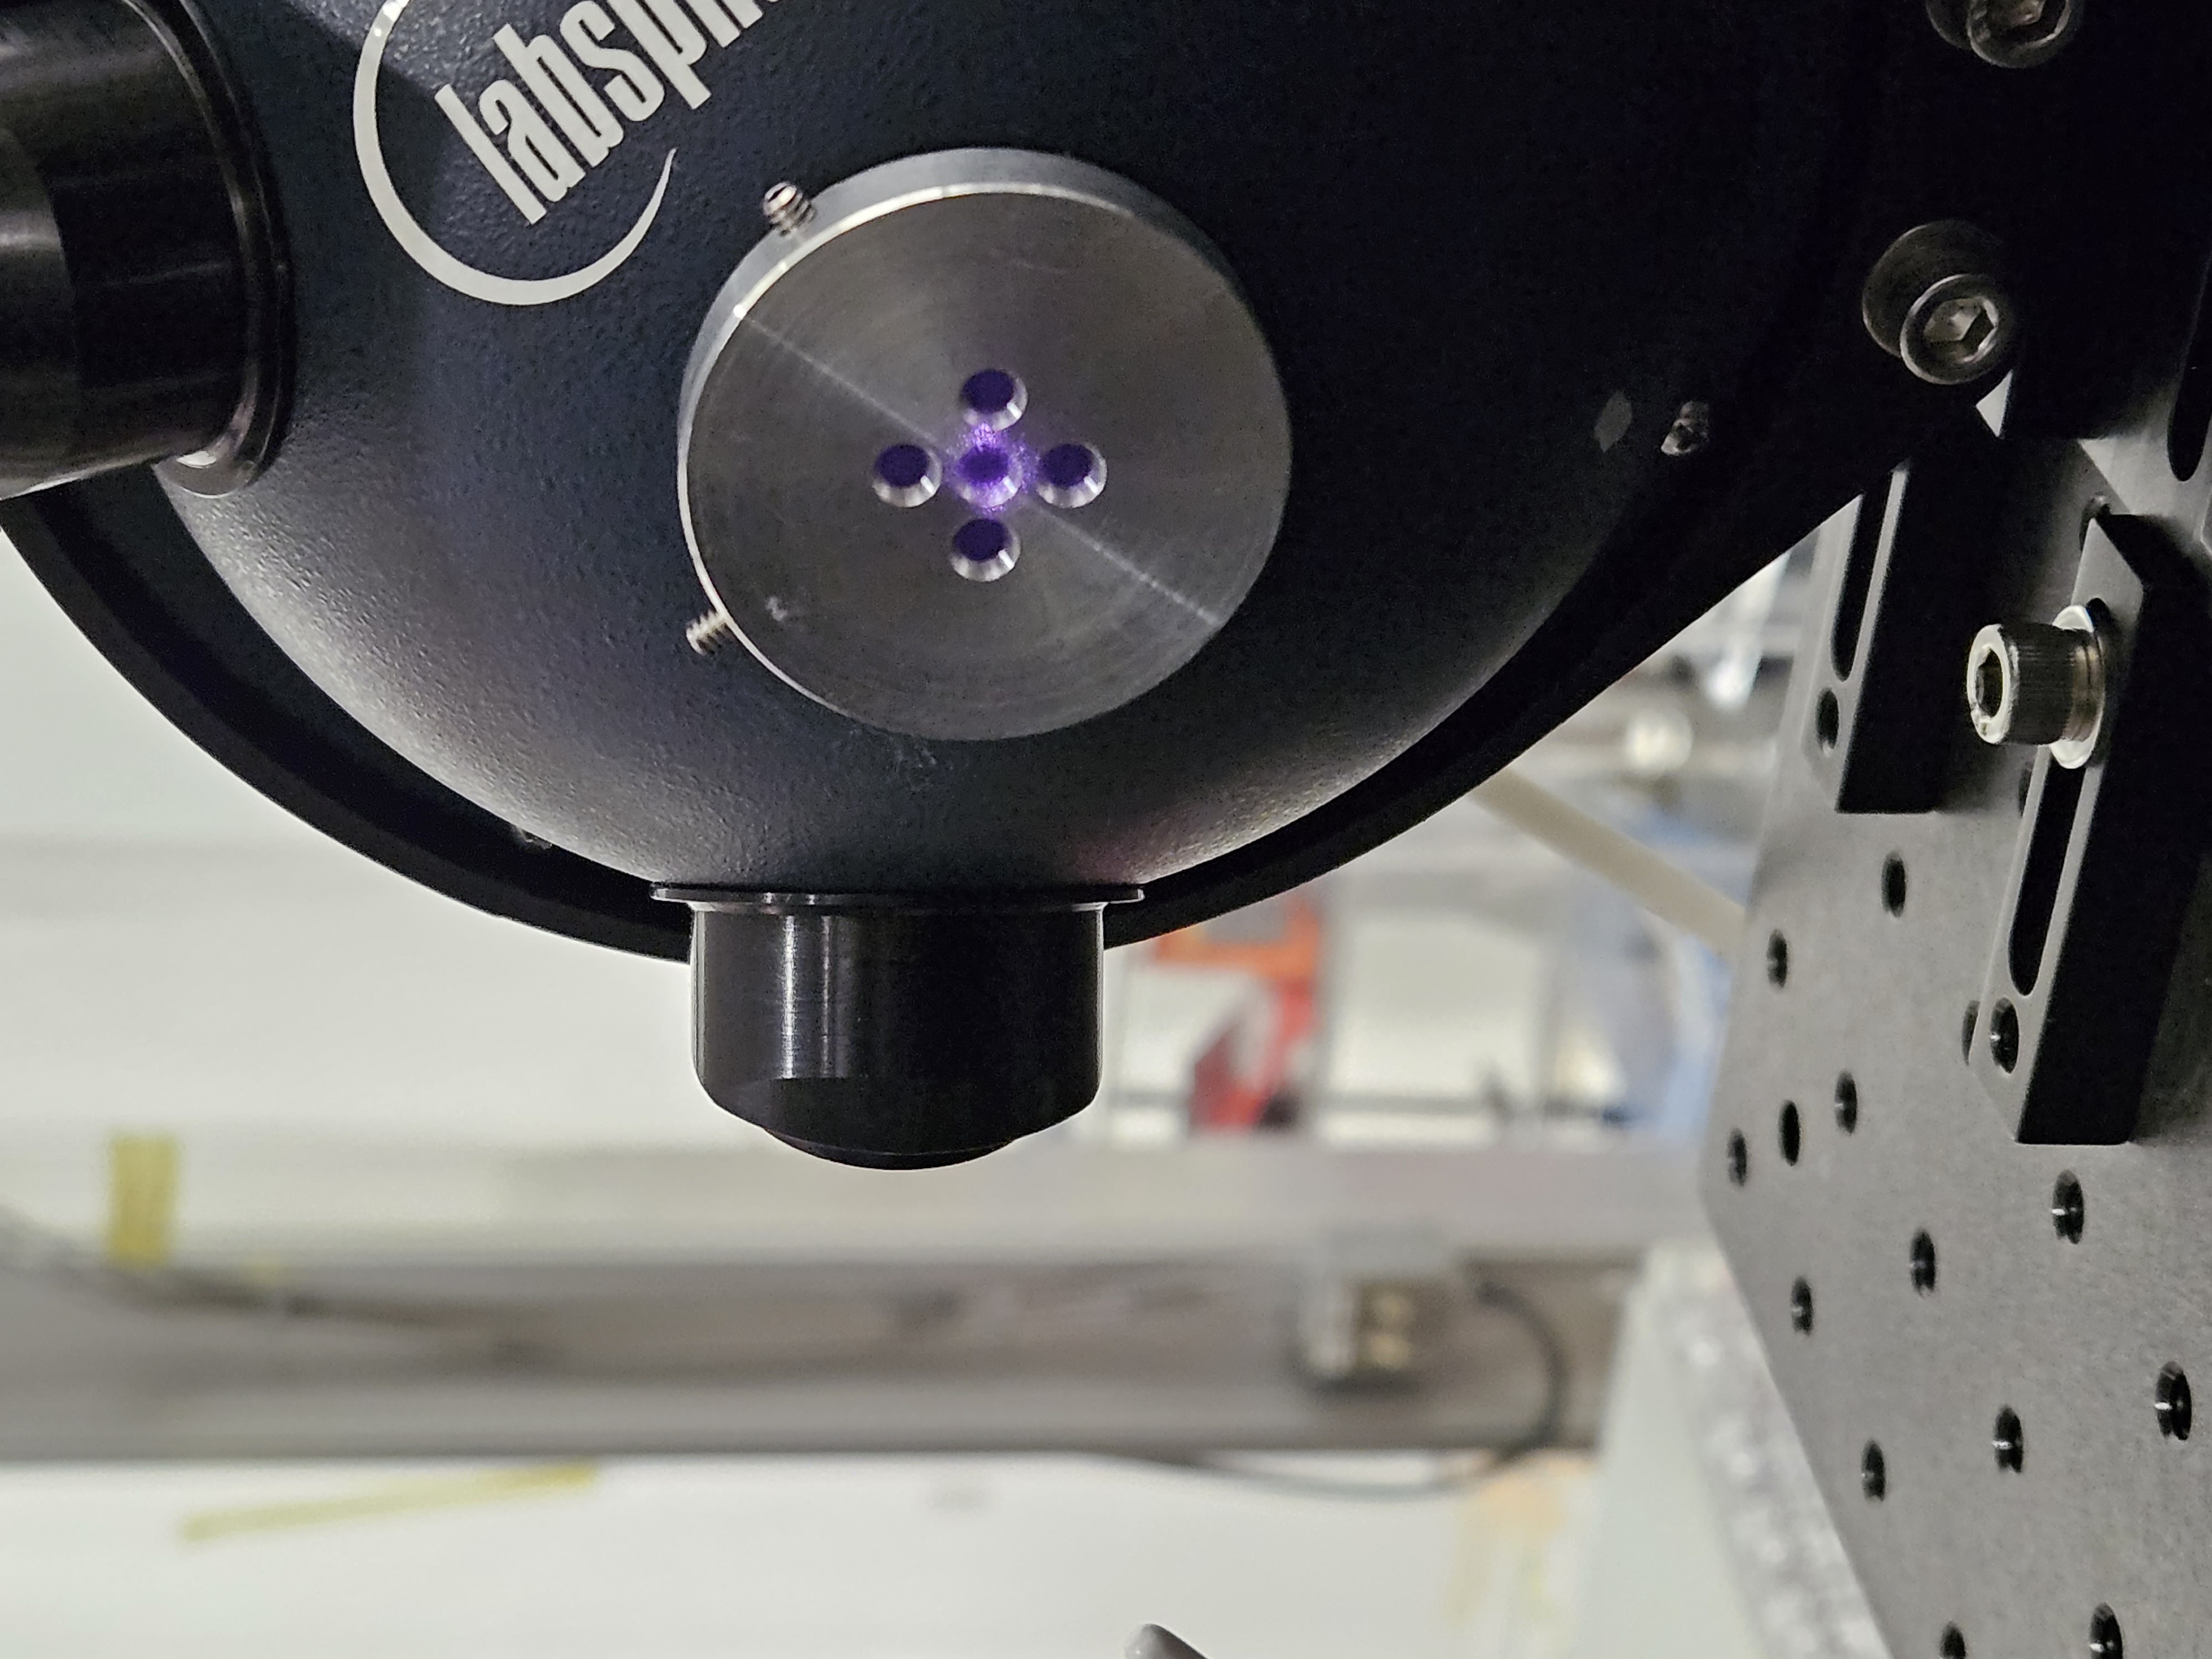
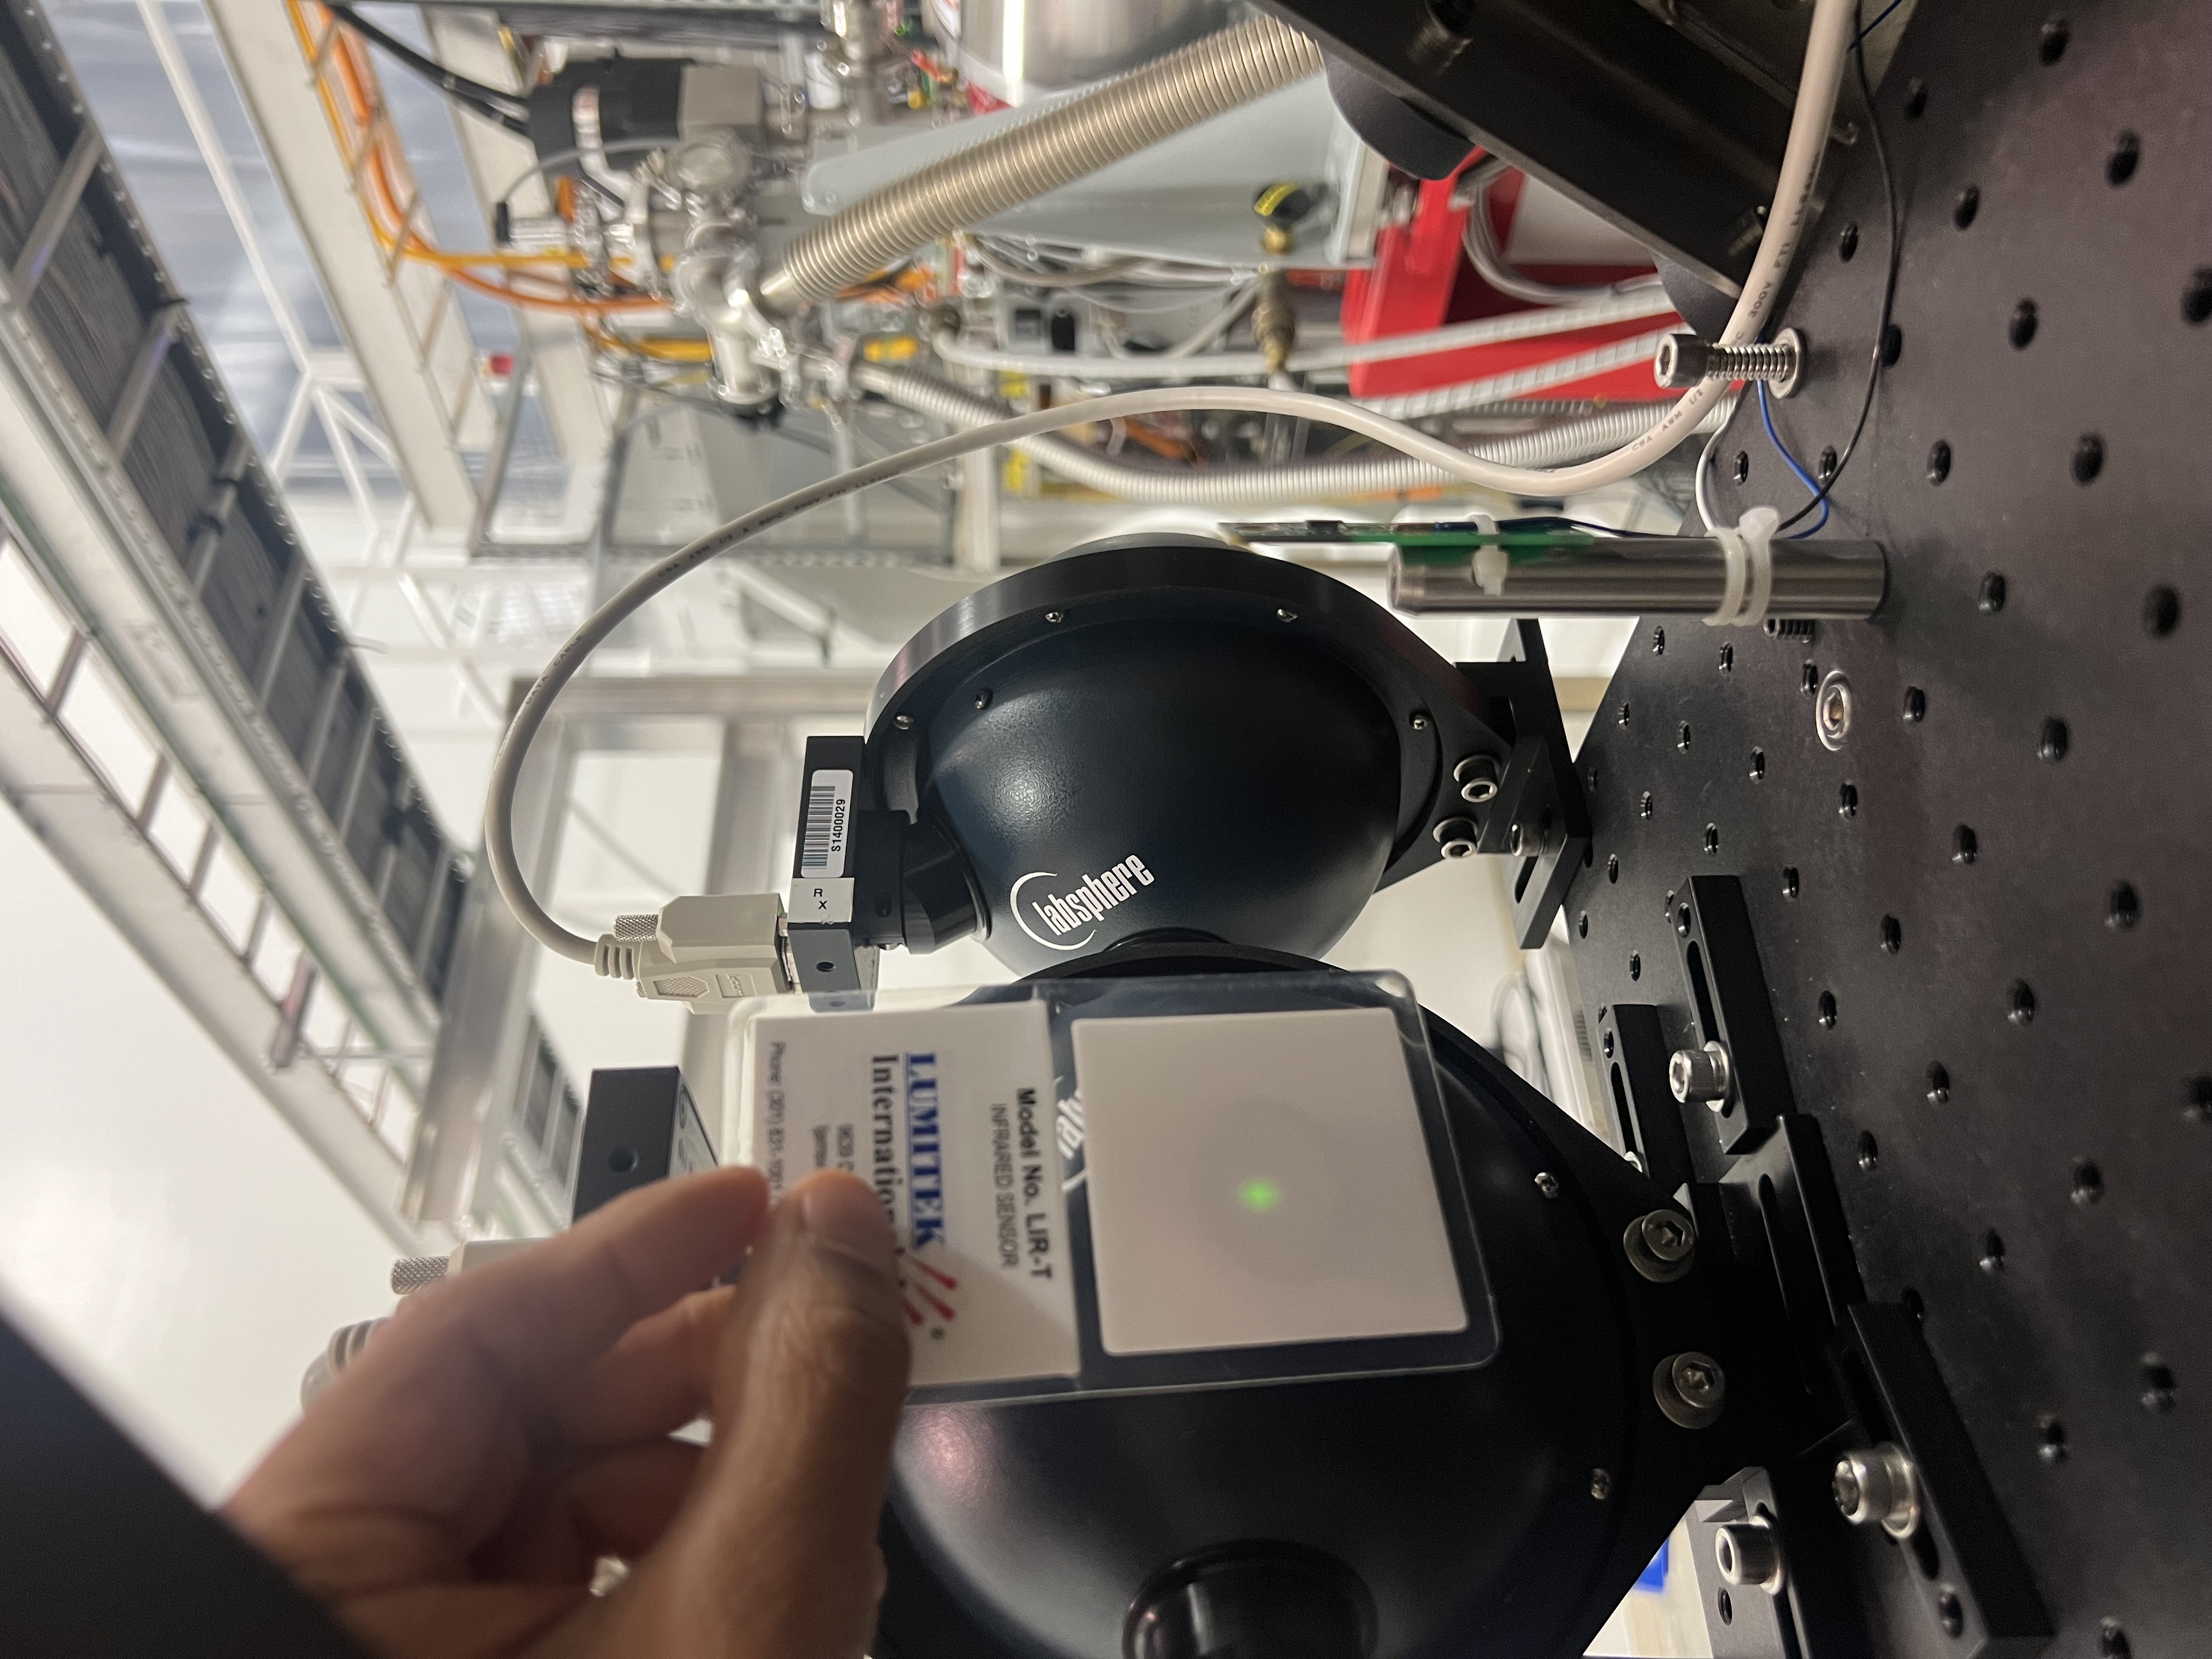
Beam Spot Picture of the Upper Beam 5 mm to the Left on the apature
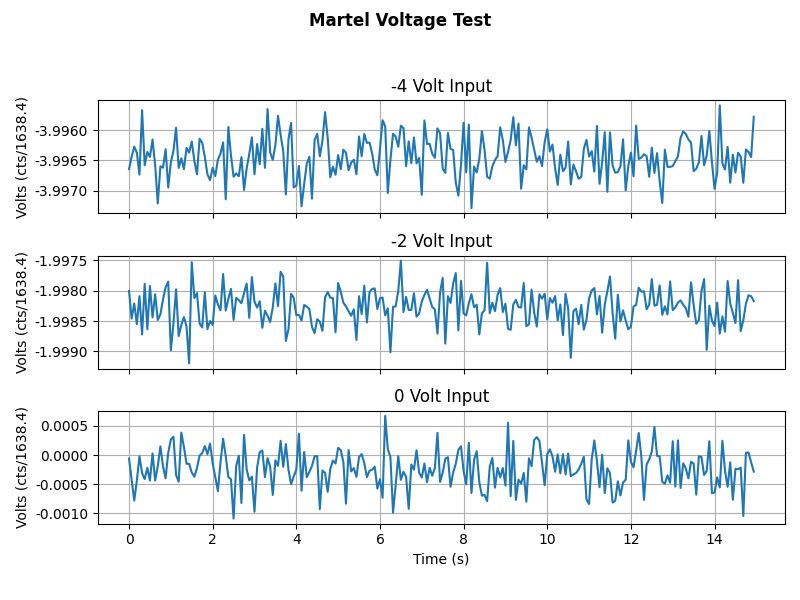
Martel_Voltage_Test.png
Document***
WS_at_TX.png
WS_at_RX.png
TX_RX.png
LHO_ENDX_PD_ReportV2.pdf
https://svn.ligo.caltech.edu/svn/aligocalibration/trunk/Projects/PhotonCalibrator/measurements/LHO_EndX/tD20230821/
We then Moved the PCAL BEAM back to the center, which is its NOMINAL position.
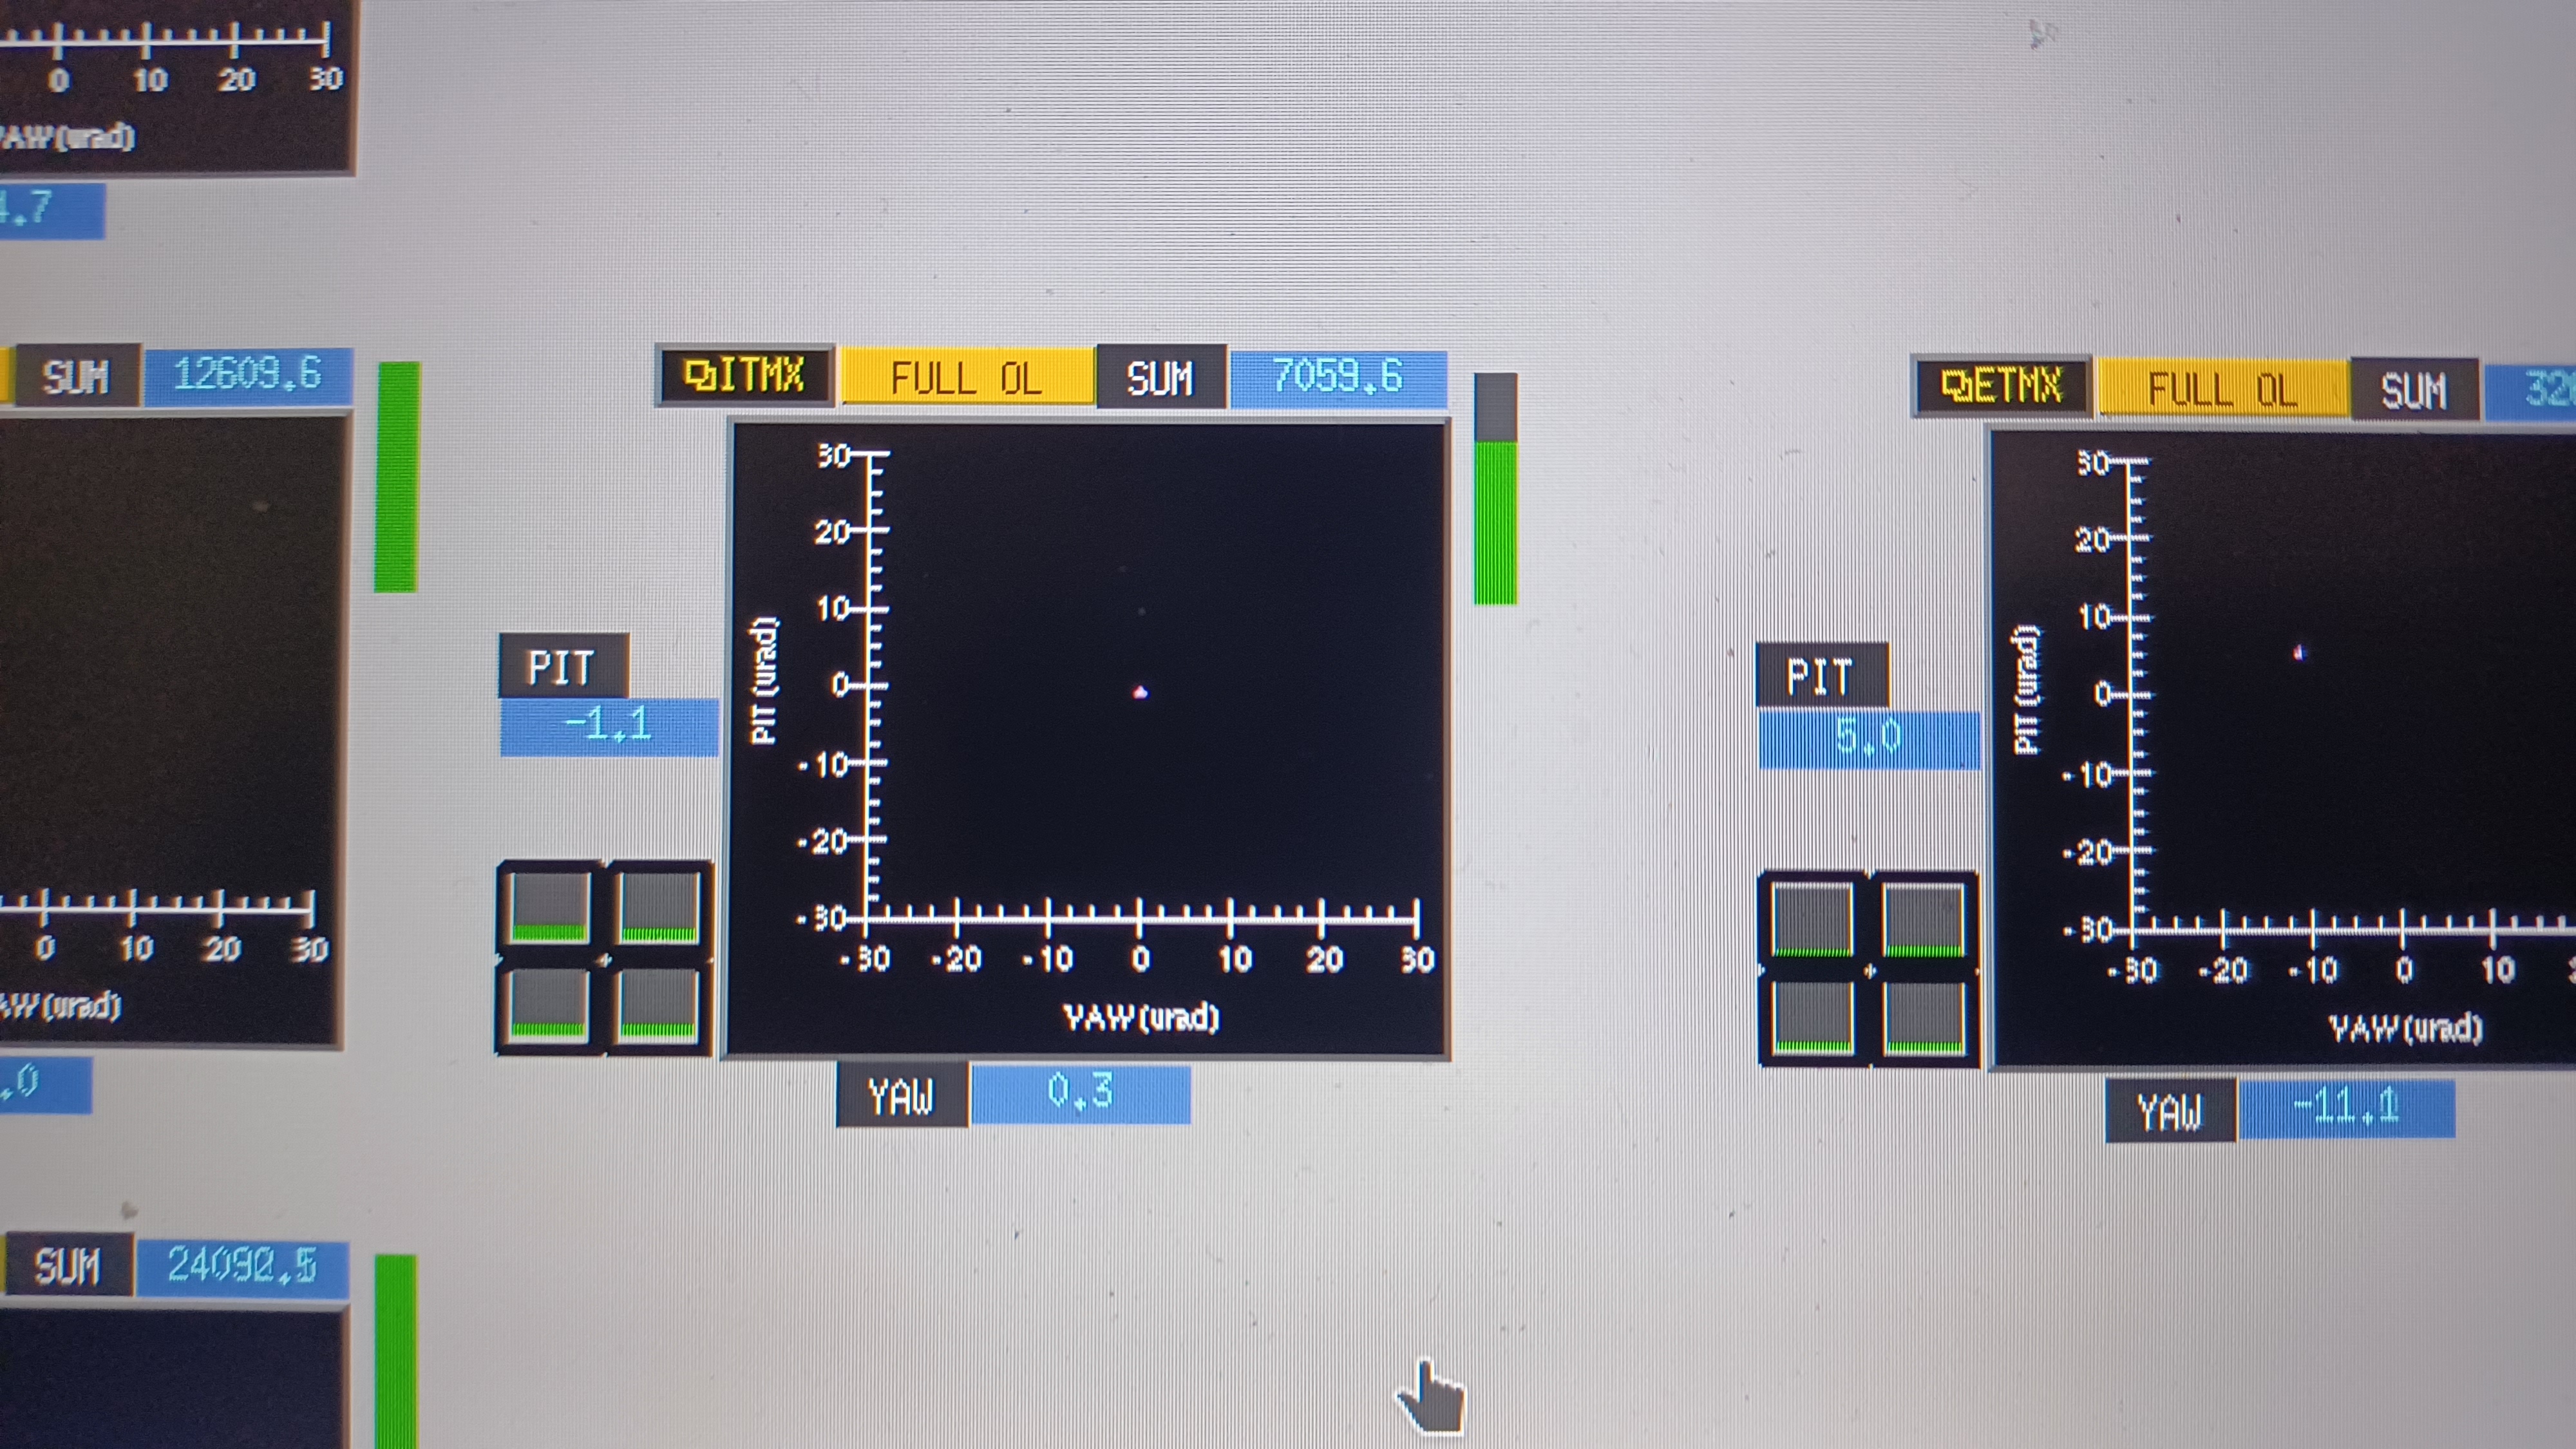
We took pictures of the beam spot.
Second NOMINAL End Station Measurement:
Then we did another ENDX Station measurement as we would normally do which is appropriately documented as tD20230822.
The second ENDX Station Measurement was carried out according to the procedure outlined in Document LIGO-T1500062-v15, Pcal End Station Power Sensor Responsivity Ratio Measurements: Procedures and Log, and was completed by noon.
We took pictures of the Beam Spot .
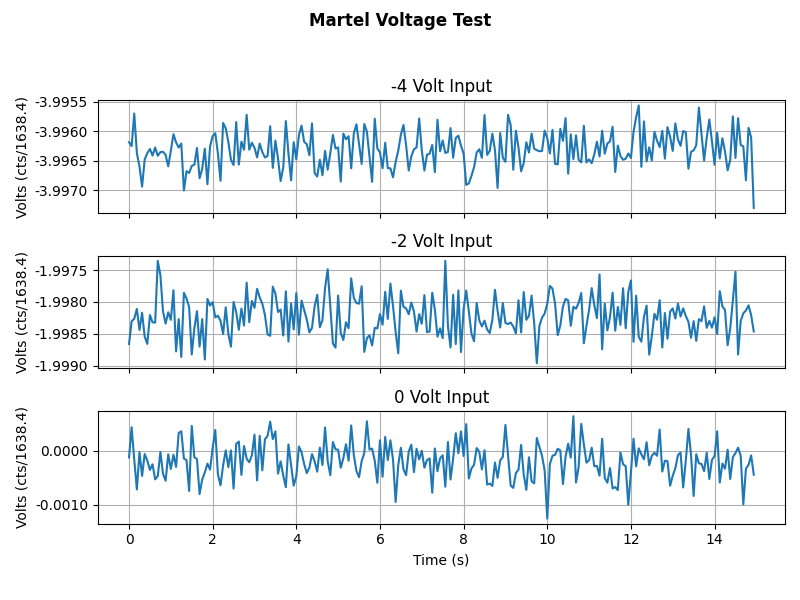
Martel:
We started by setting up a Martel Voltage source to apply some voltage into the PCAL Chassis's Input 1 channel and we record the times that a -4.000V, -2.000V and a 0.000V signal was sent to the Chassis. The analysis code that we run after we return uses the GPS times, grabs the data and created the Martel_Voltage_Test.png graph. We also did a measurement of the Martel's voltages in the PCAL lab to calculate the ADC conversion factor, which is included on the document .
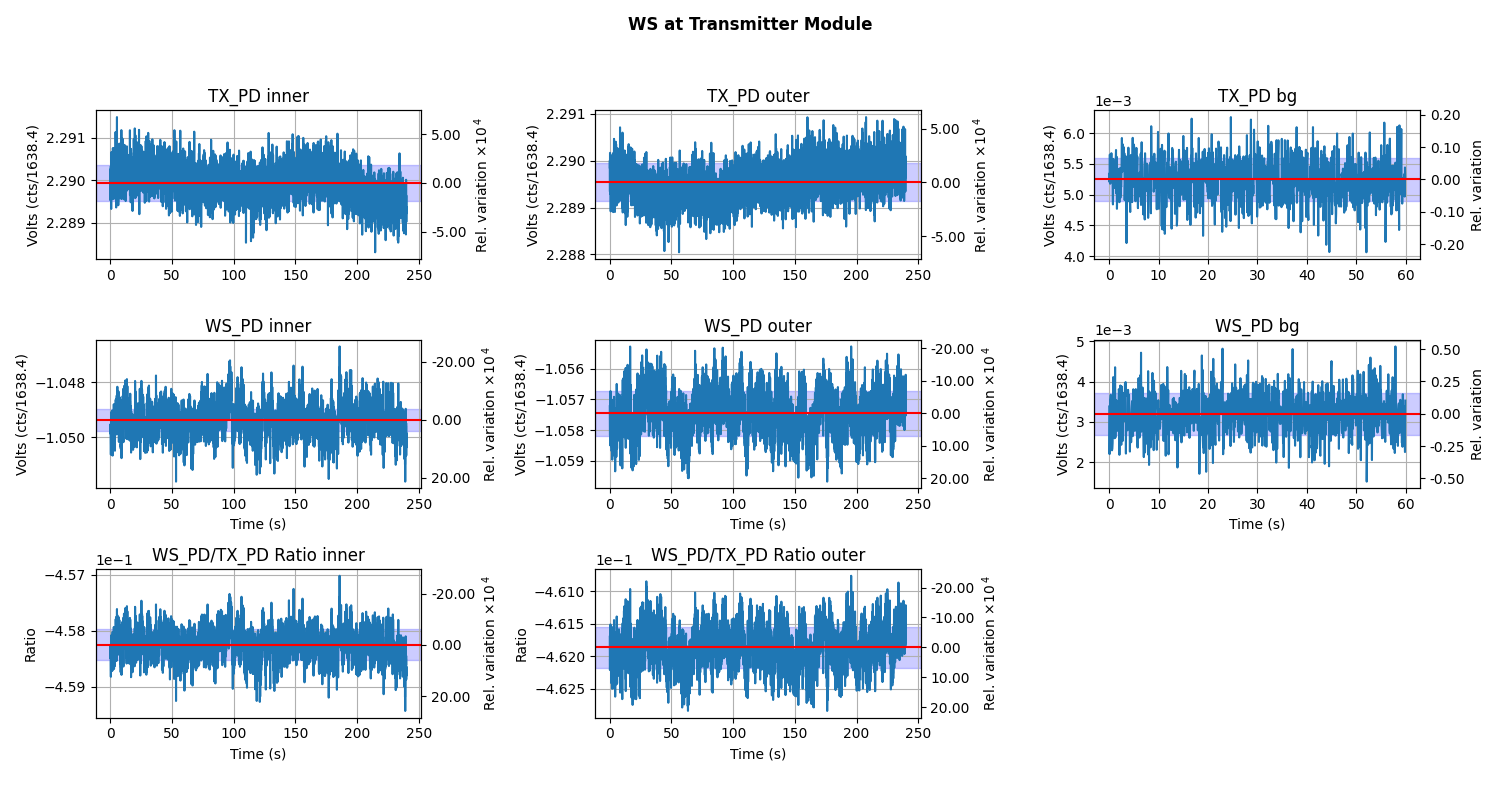
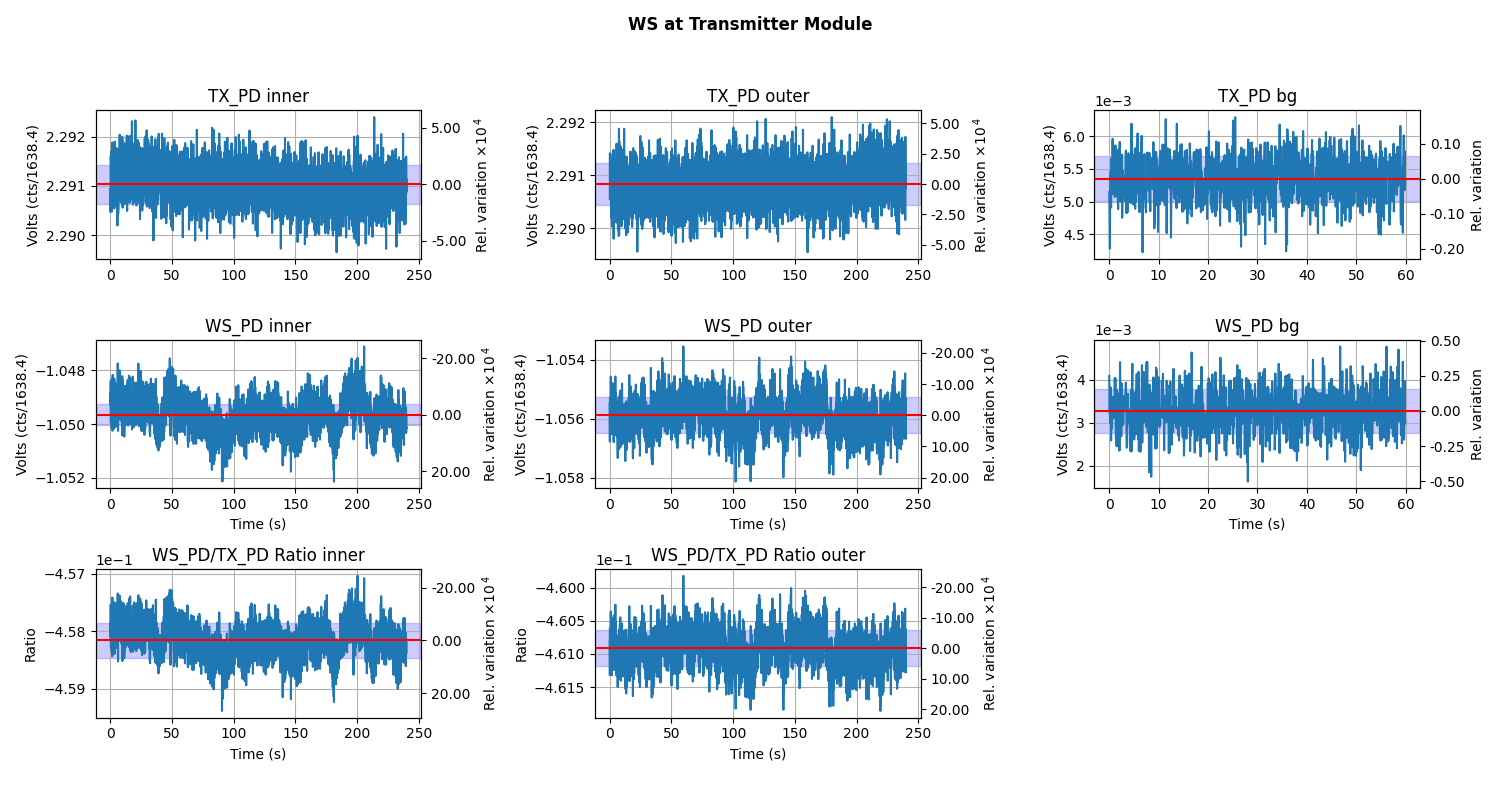
After the Martel measurement the procedure walks us through the steps required to make a series of plots while the Working Standard(PS4) is in the Transmitter Module. These plots are shown in WS_at_TX.png.
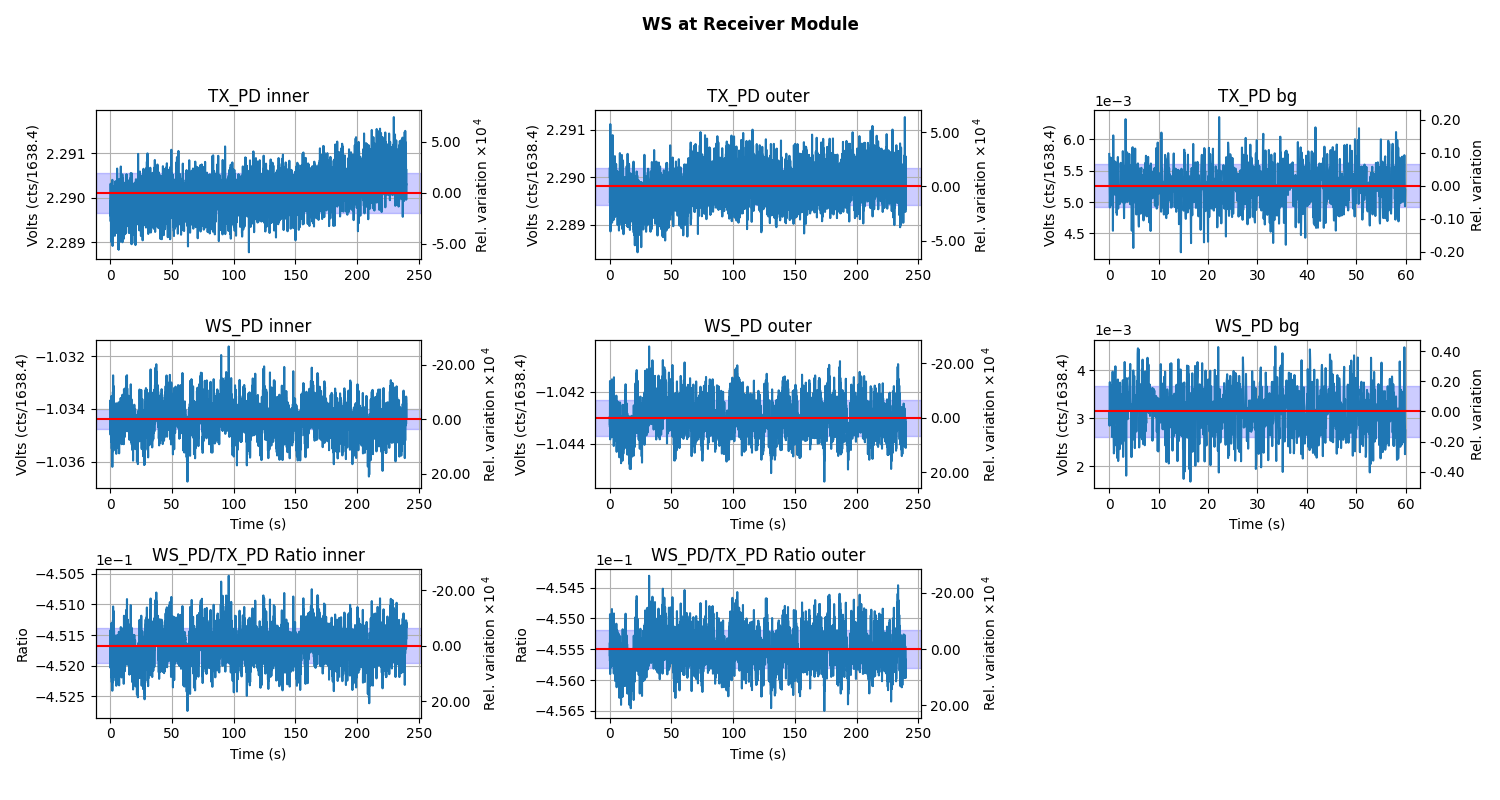
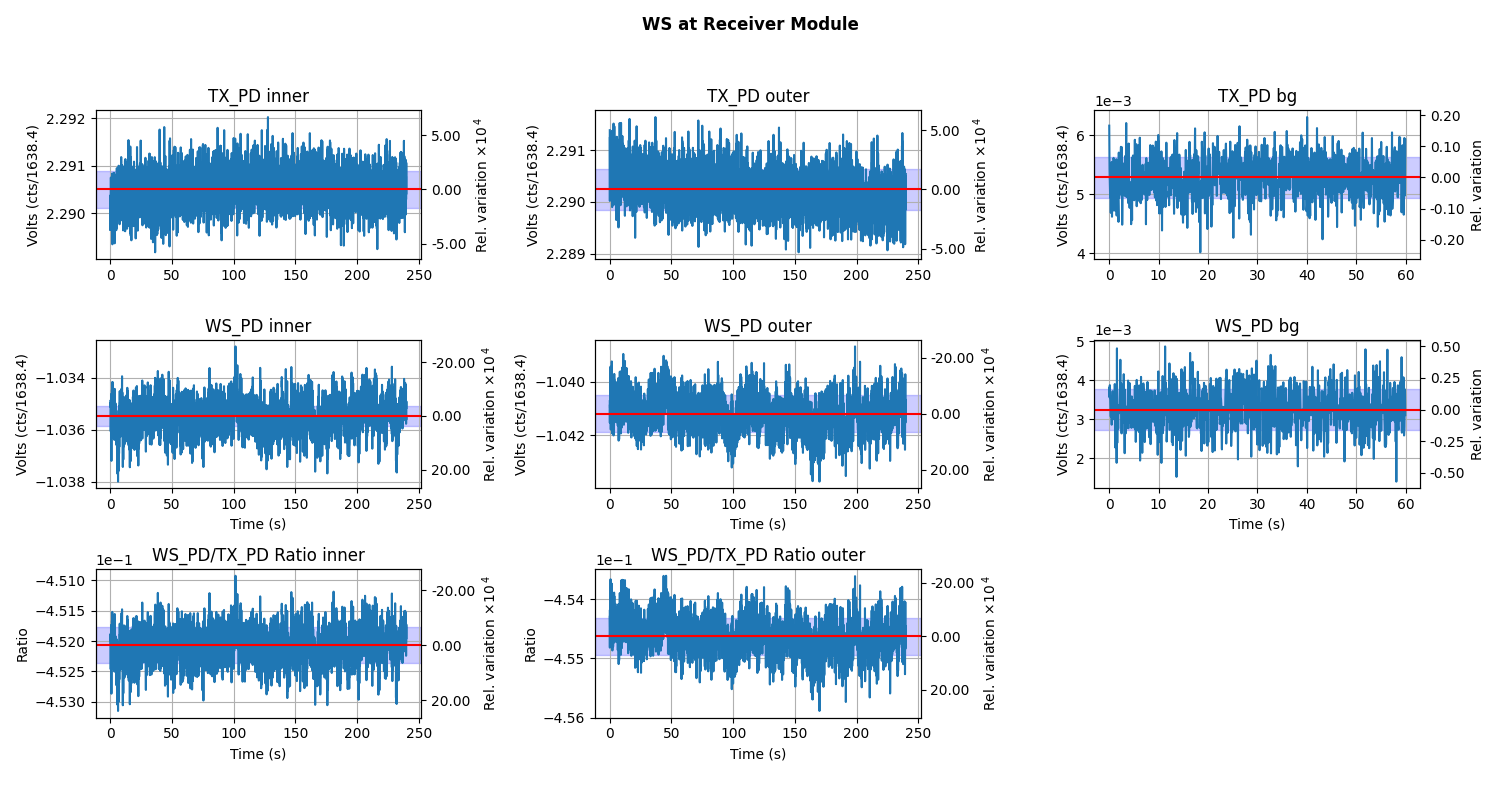
Next steps include: The WS in the Receiver Module, These plots are shown in WS_at_RX.png.
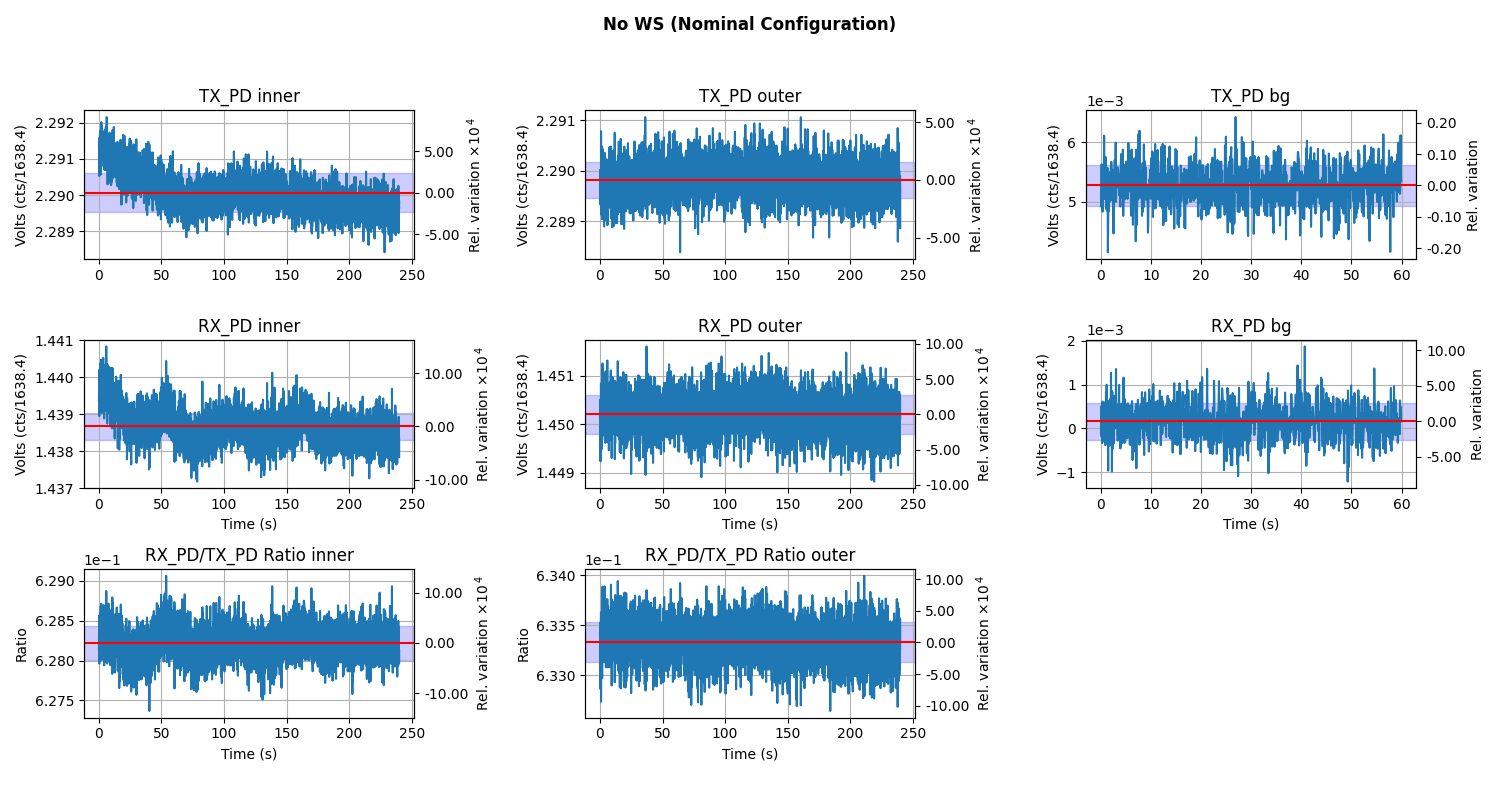
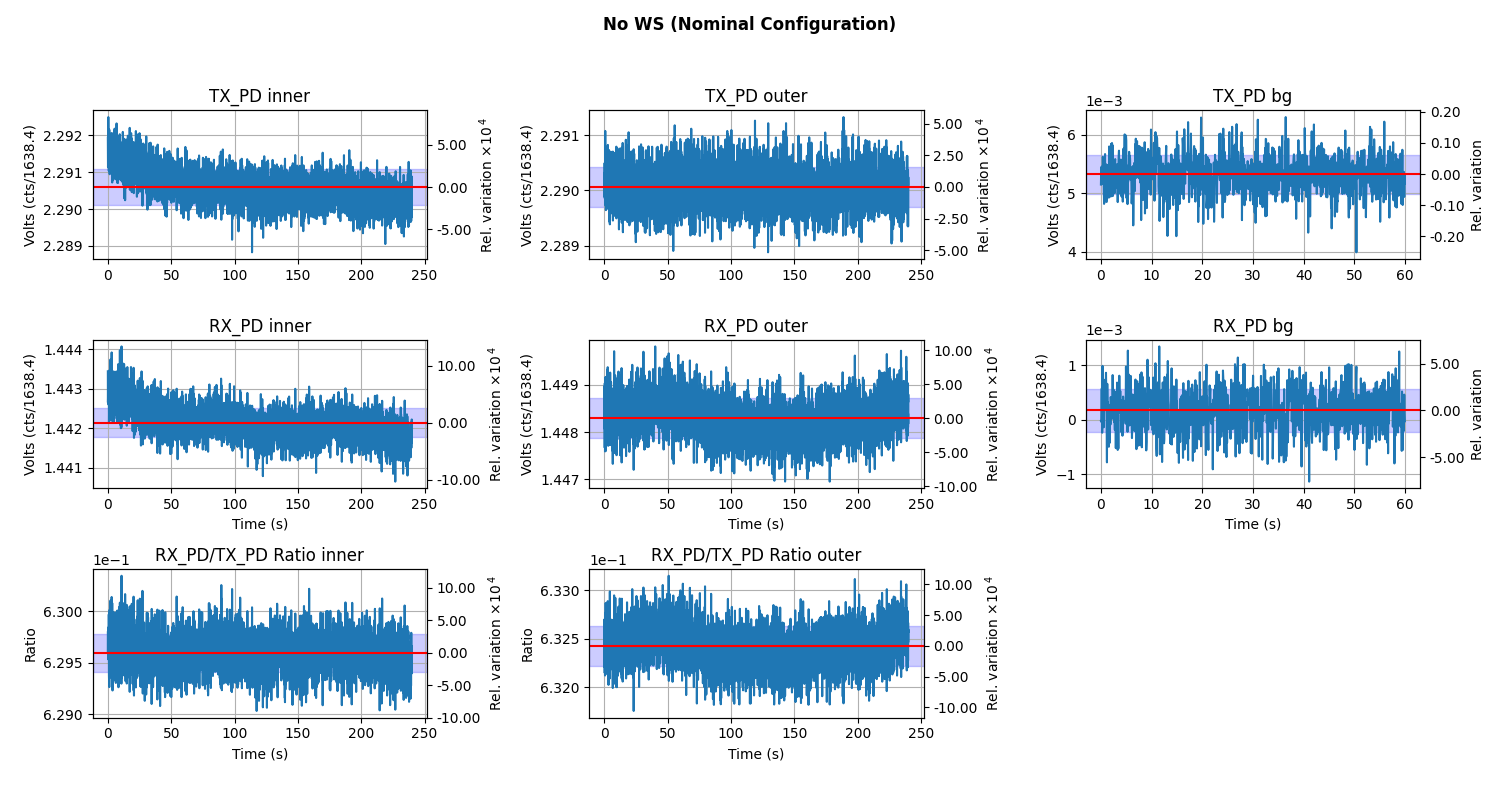
Followed by TX_RX.png which are plots of the Tranmitter module and the receiver module operation without the WS in the beam path at all.
All of this data is then used to generate LHO_ENDX_PD_ReportV2.pdf which is attached, and a work in progress in the form of a living document.
All data and Analysis has been commited to the SVN.
https://svn.ligo.caltech.edu/svn/aligocalibration/trunk/Projects/PhotonCalibrator/measurements/LHO_EndX/tD20230822/
PCAL Lab Responsivity Ratio Measurement:
A WSH/GSHL (PS4/PS5)BackFront Responsivity Ratio Measurement was ran, analyzed, and pushed to the SVN.
The analysis of this measurement produces 4 PDF files which we use to vet the data for problems.
raw_voltages.pdf
avg_voltages.pdf
raw_ratios.pdf
avg_ratios.pdf
All data and Analysis has been commited to the SVN.
https://svn.ligo.caltech.edu/svn/aligocalibration/trunk/Projects/PhotonCalibrator/measurements/LabData/PS4_PS5/
I switched the order of the lab Measurements this time to have the Front Back Last this time to see is it changed the relative difference between FB and BF measurements.
PCAL Lab Responsivity Ratio Measurement:
A WSH/GSHL (PS4/PS5)FrontBack Responsivity Ratio measurement was ran, analyzed, and pushed to the SVN.
The analysis of this measurement produces 4 PDF files which we use to vet the data for problems.
raw_voltages2.pdf
avg_voltages2.pdf
raw_ratios2.pdf
avg_ratios2.pdf
This adventure has been brought to you by Rick Savage & Tony Sanchez.


