We've assembled the whole EOM assembly including the pivot base/plate assy and the strain relief post and confirmed that the EOM face/side/bottom plates are isolated from the pivot base/plate.
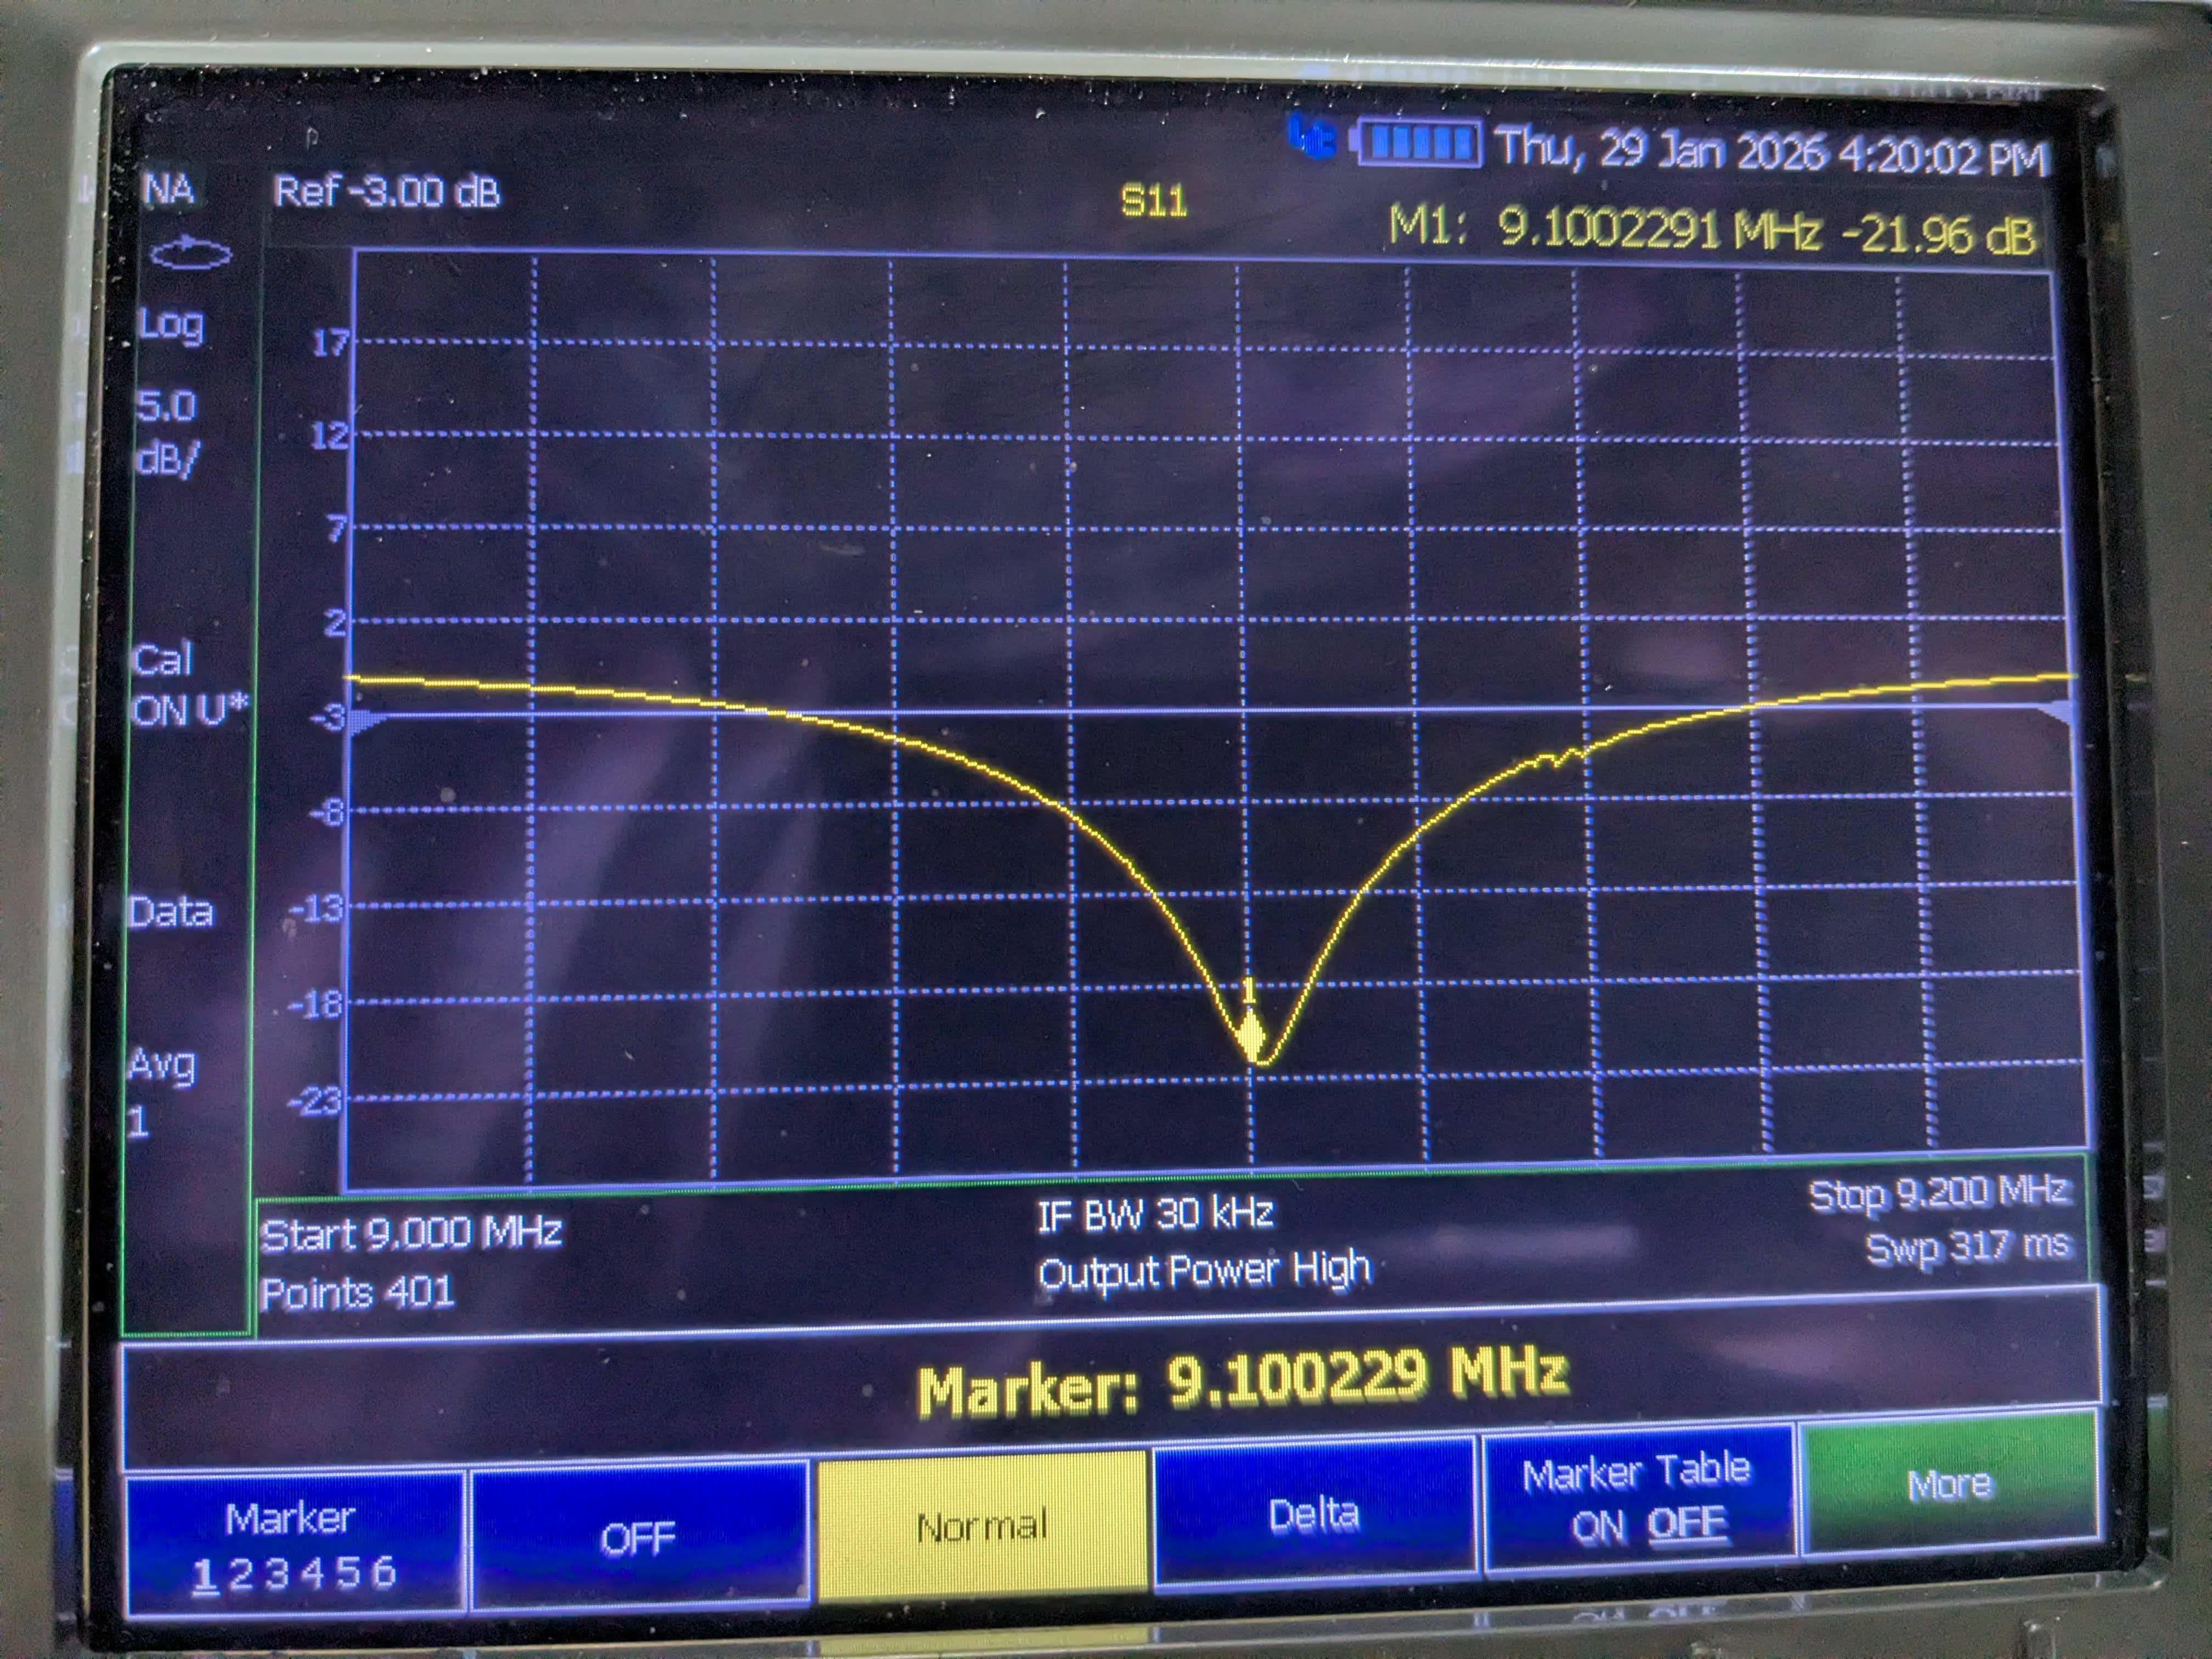
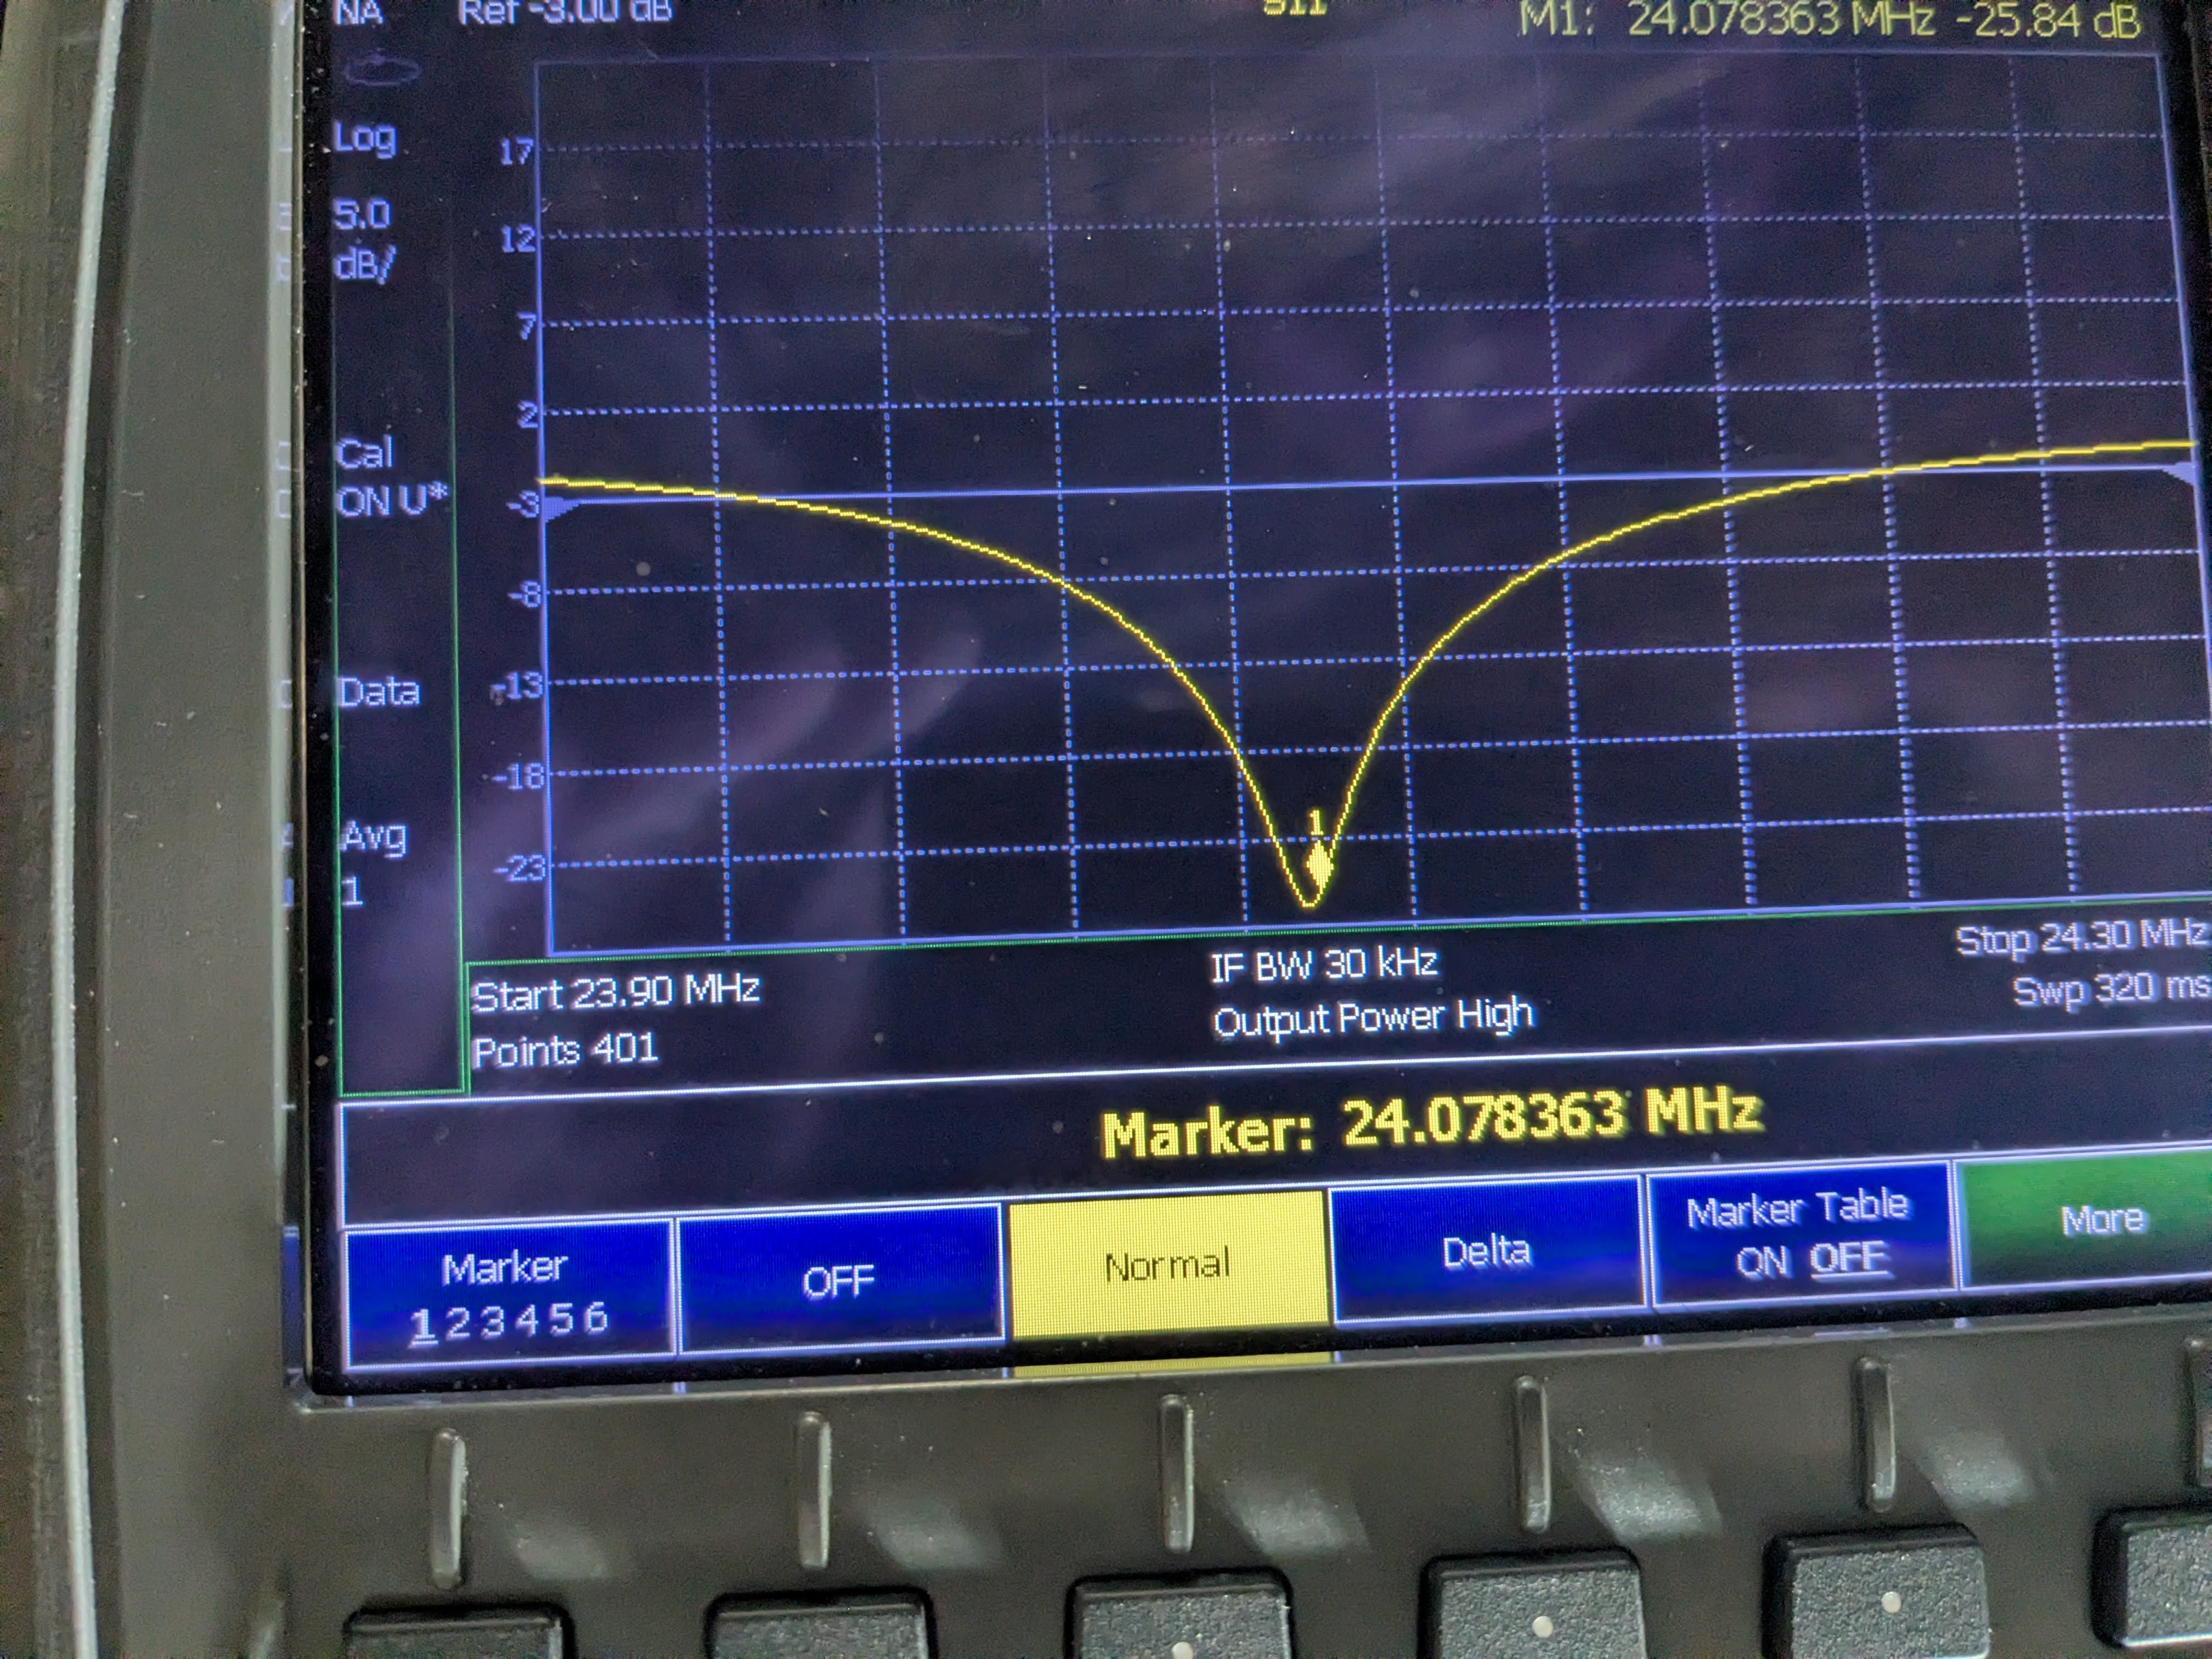
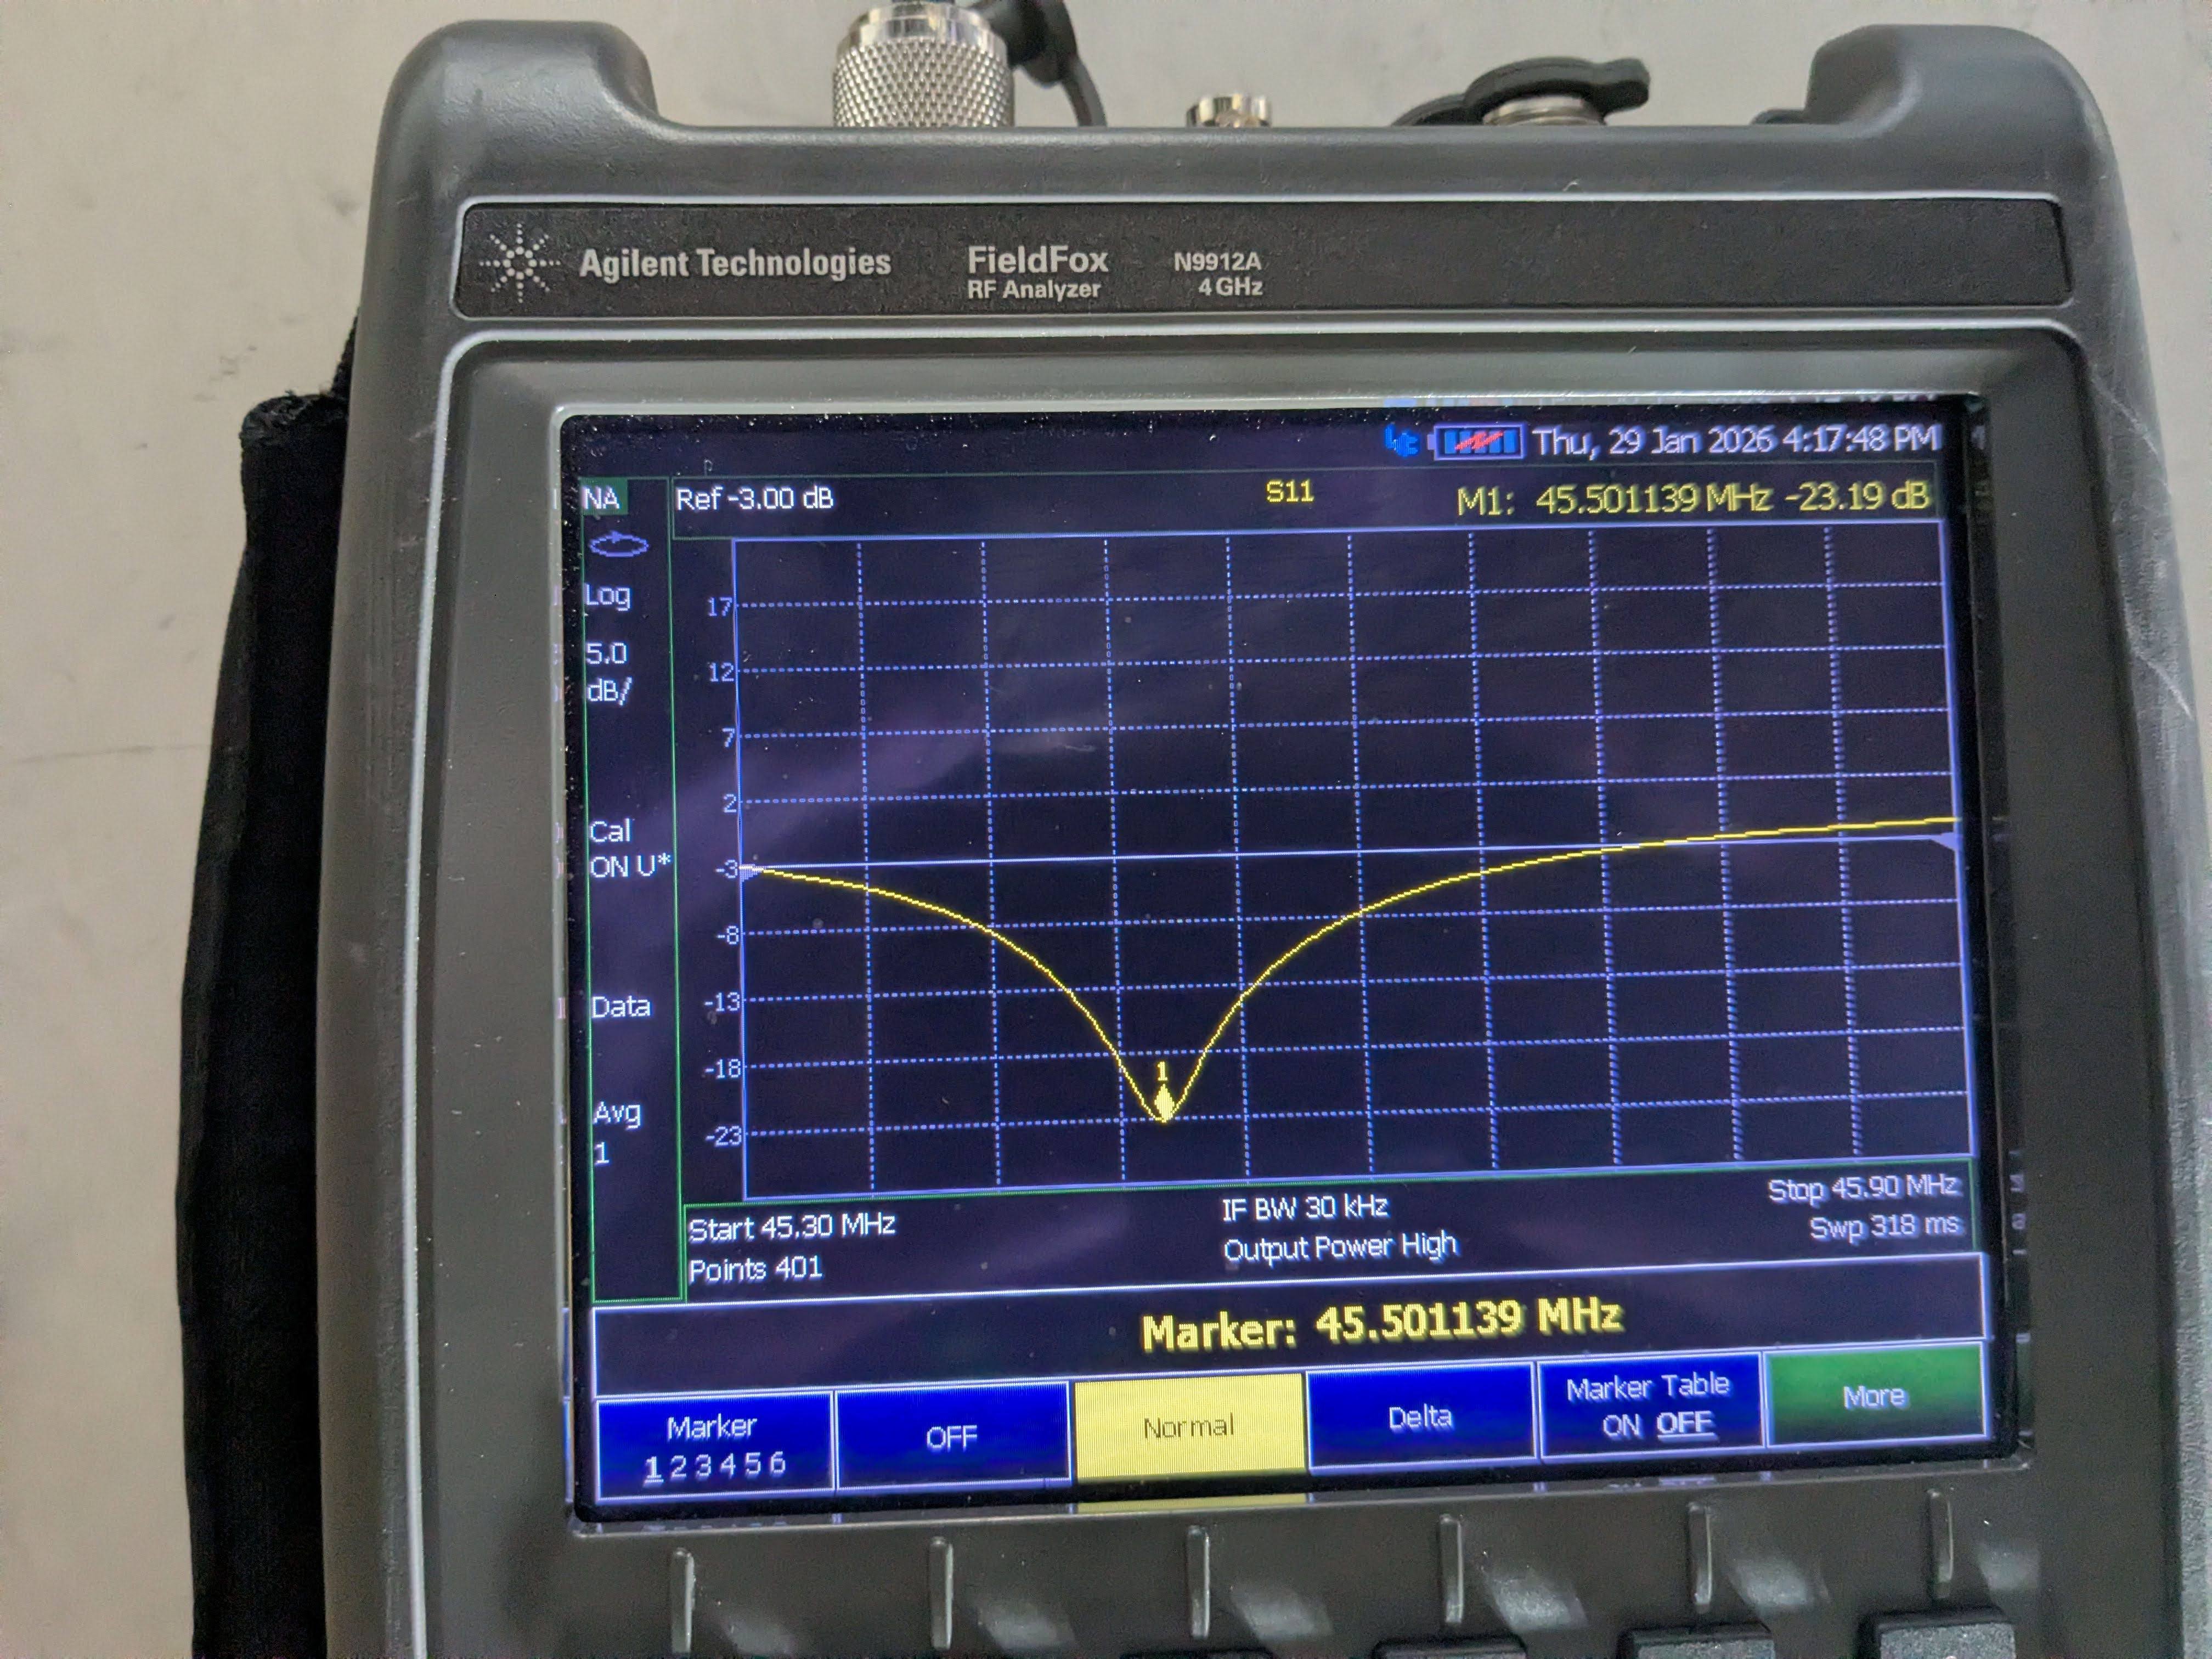
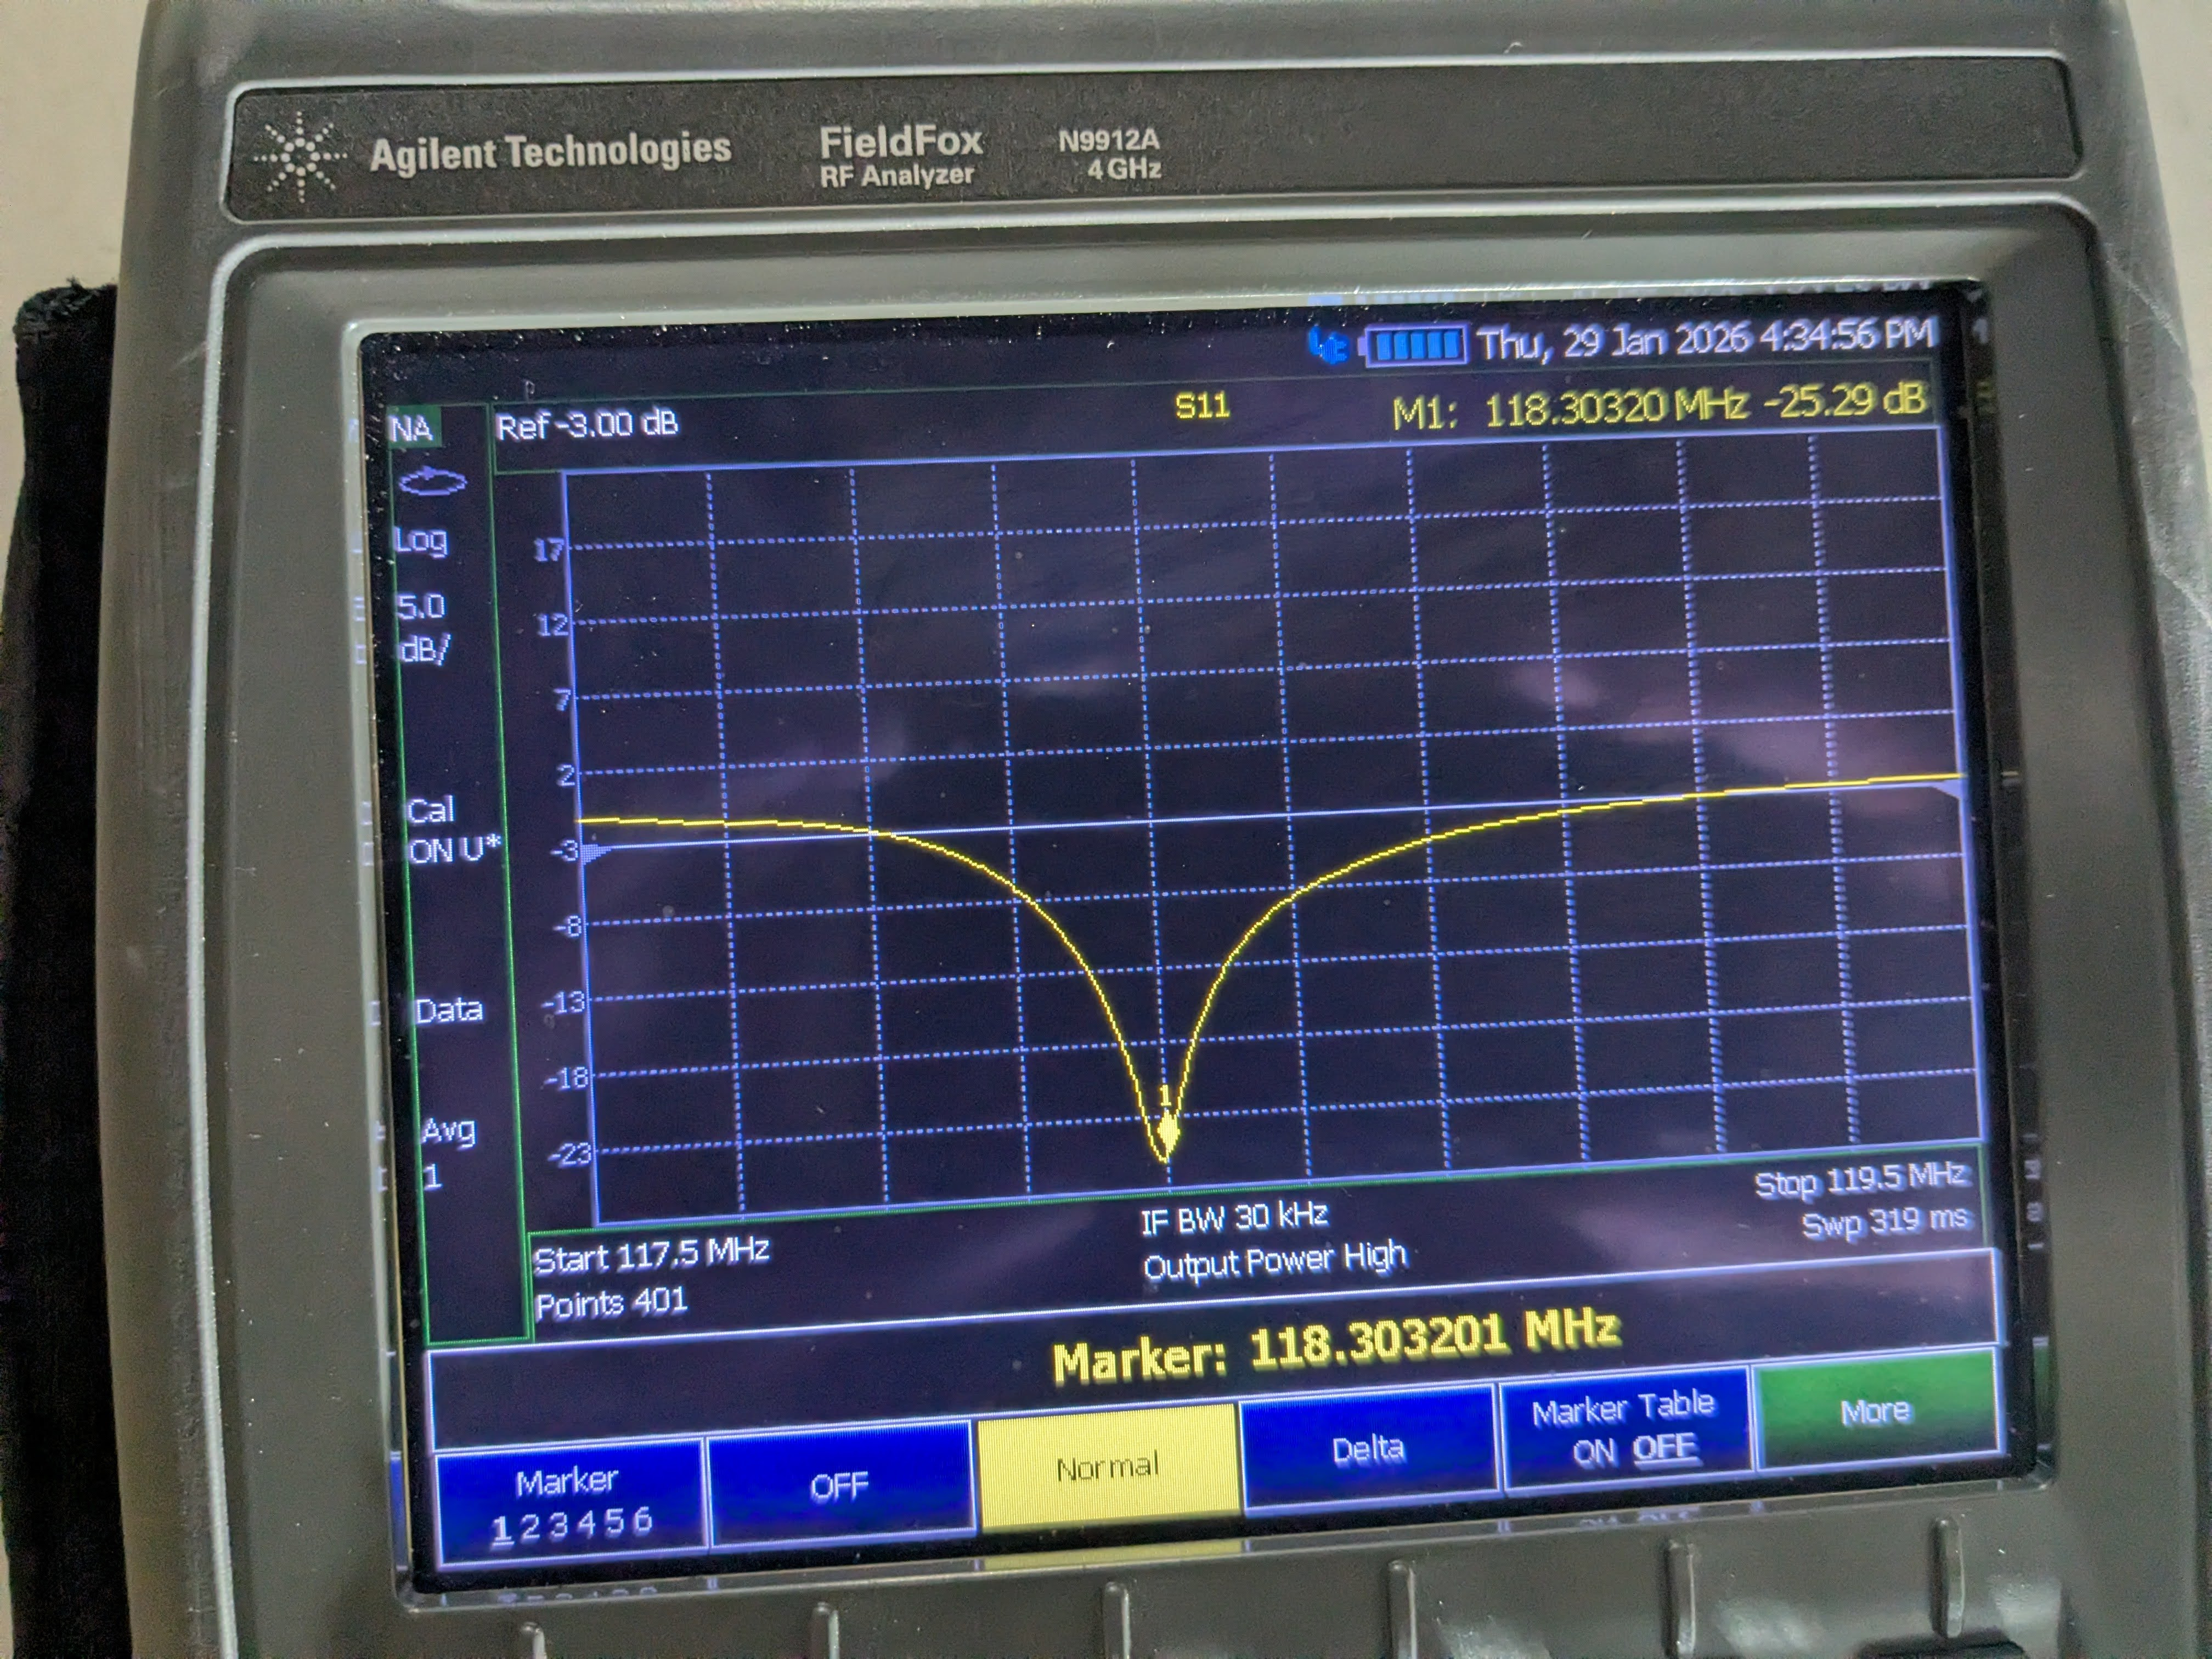
We've tuned the EOM such that S11 parameter at the modulation frequencies are all within 1dB of the bottom of the dip.
We still saw that the frequency shifted for 118 and 45MHz when we tapped the EOM body around, even though there was no appreciable change in 24 and 9MHz. Each jump was small, like 5kHz or 10kHz or nothing sometimes, but they jumped. Surprisingly, at least for 118MHz peak, after the frequency jumped in one direction due to my tapping on the side plate (e.g. the input side), I tapped the other side plate (e.g. the output side plate) and the frequency jumped back into the opposite direction. This was very consistent.
This means that my expectation was wrong. An expectation that somehow something (like coil wires) is caught by something else (like the core by the friction), and that tapping things will release these "something"s into lower potential state and that eventually they all settle.
Realizing this, we stopped tapping, we just tuned as good as we could and stopped.
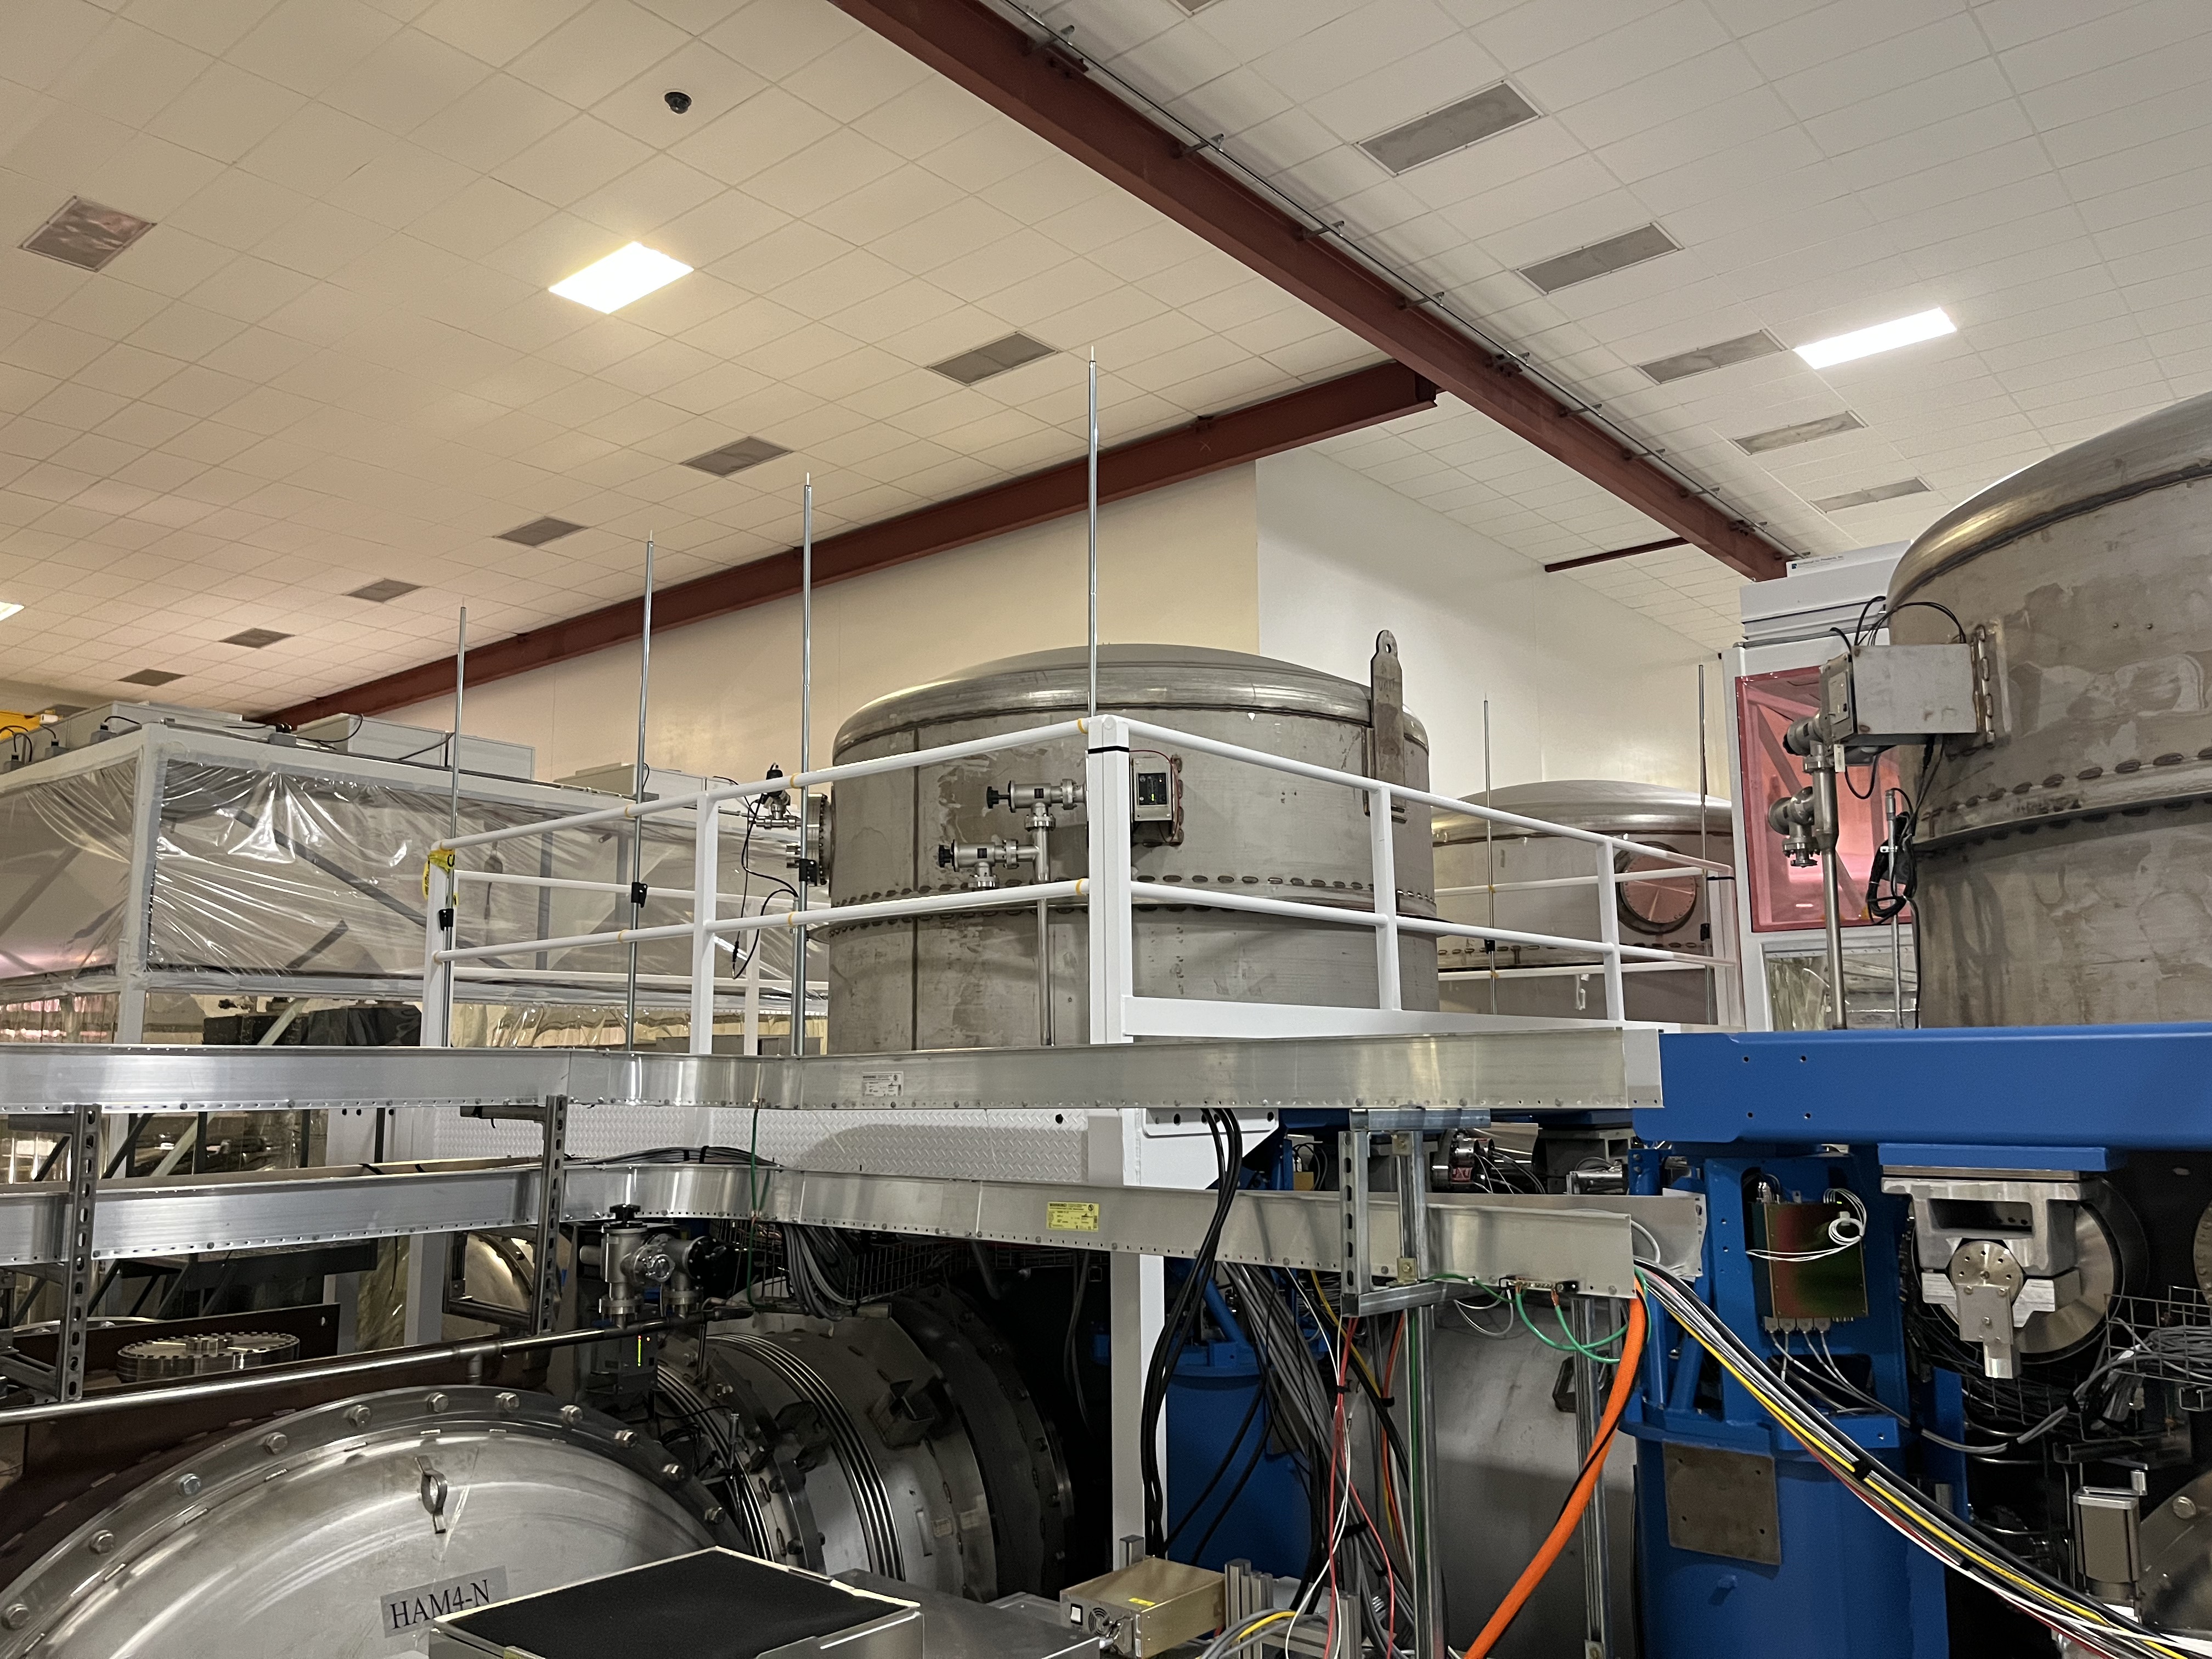
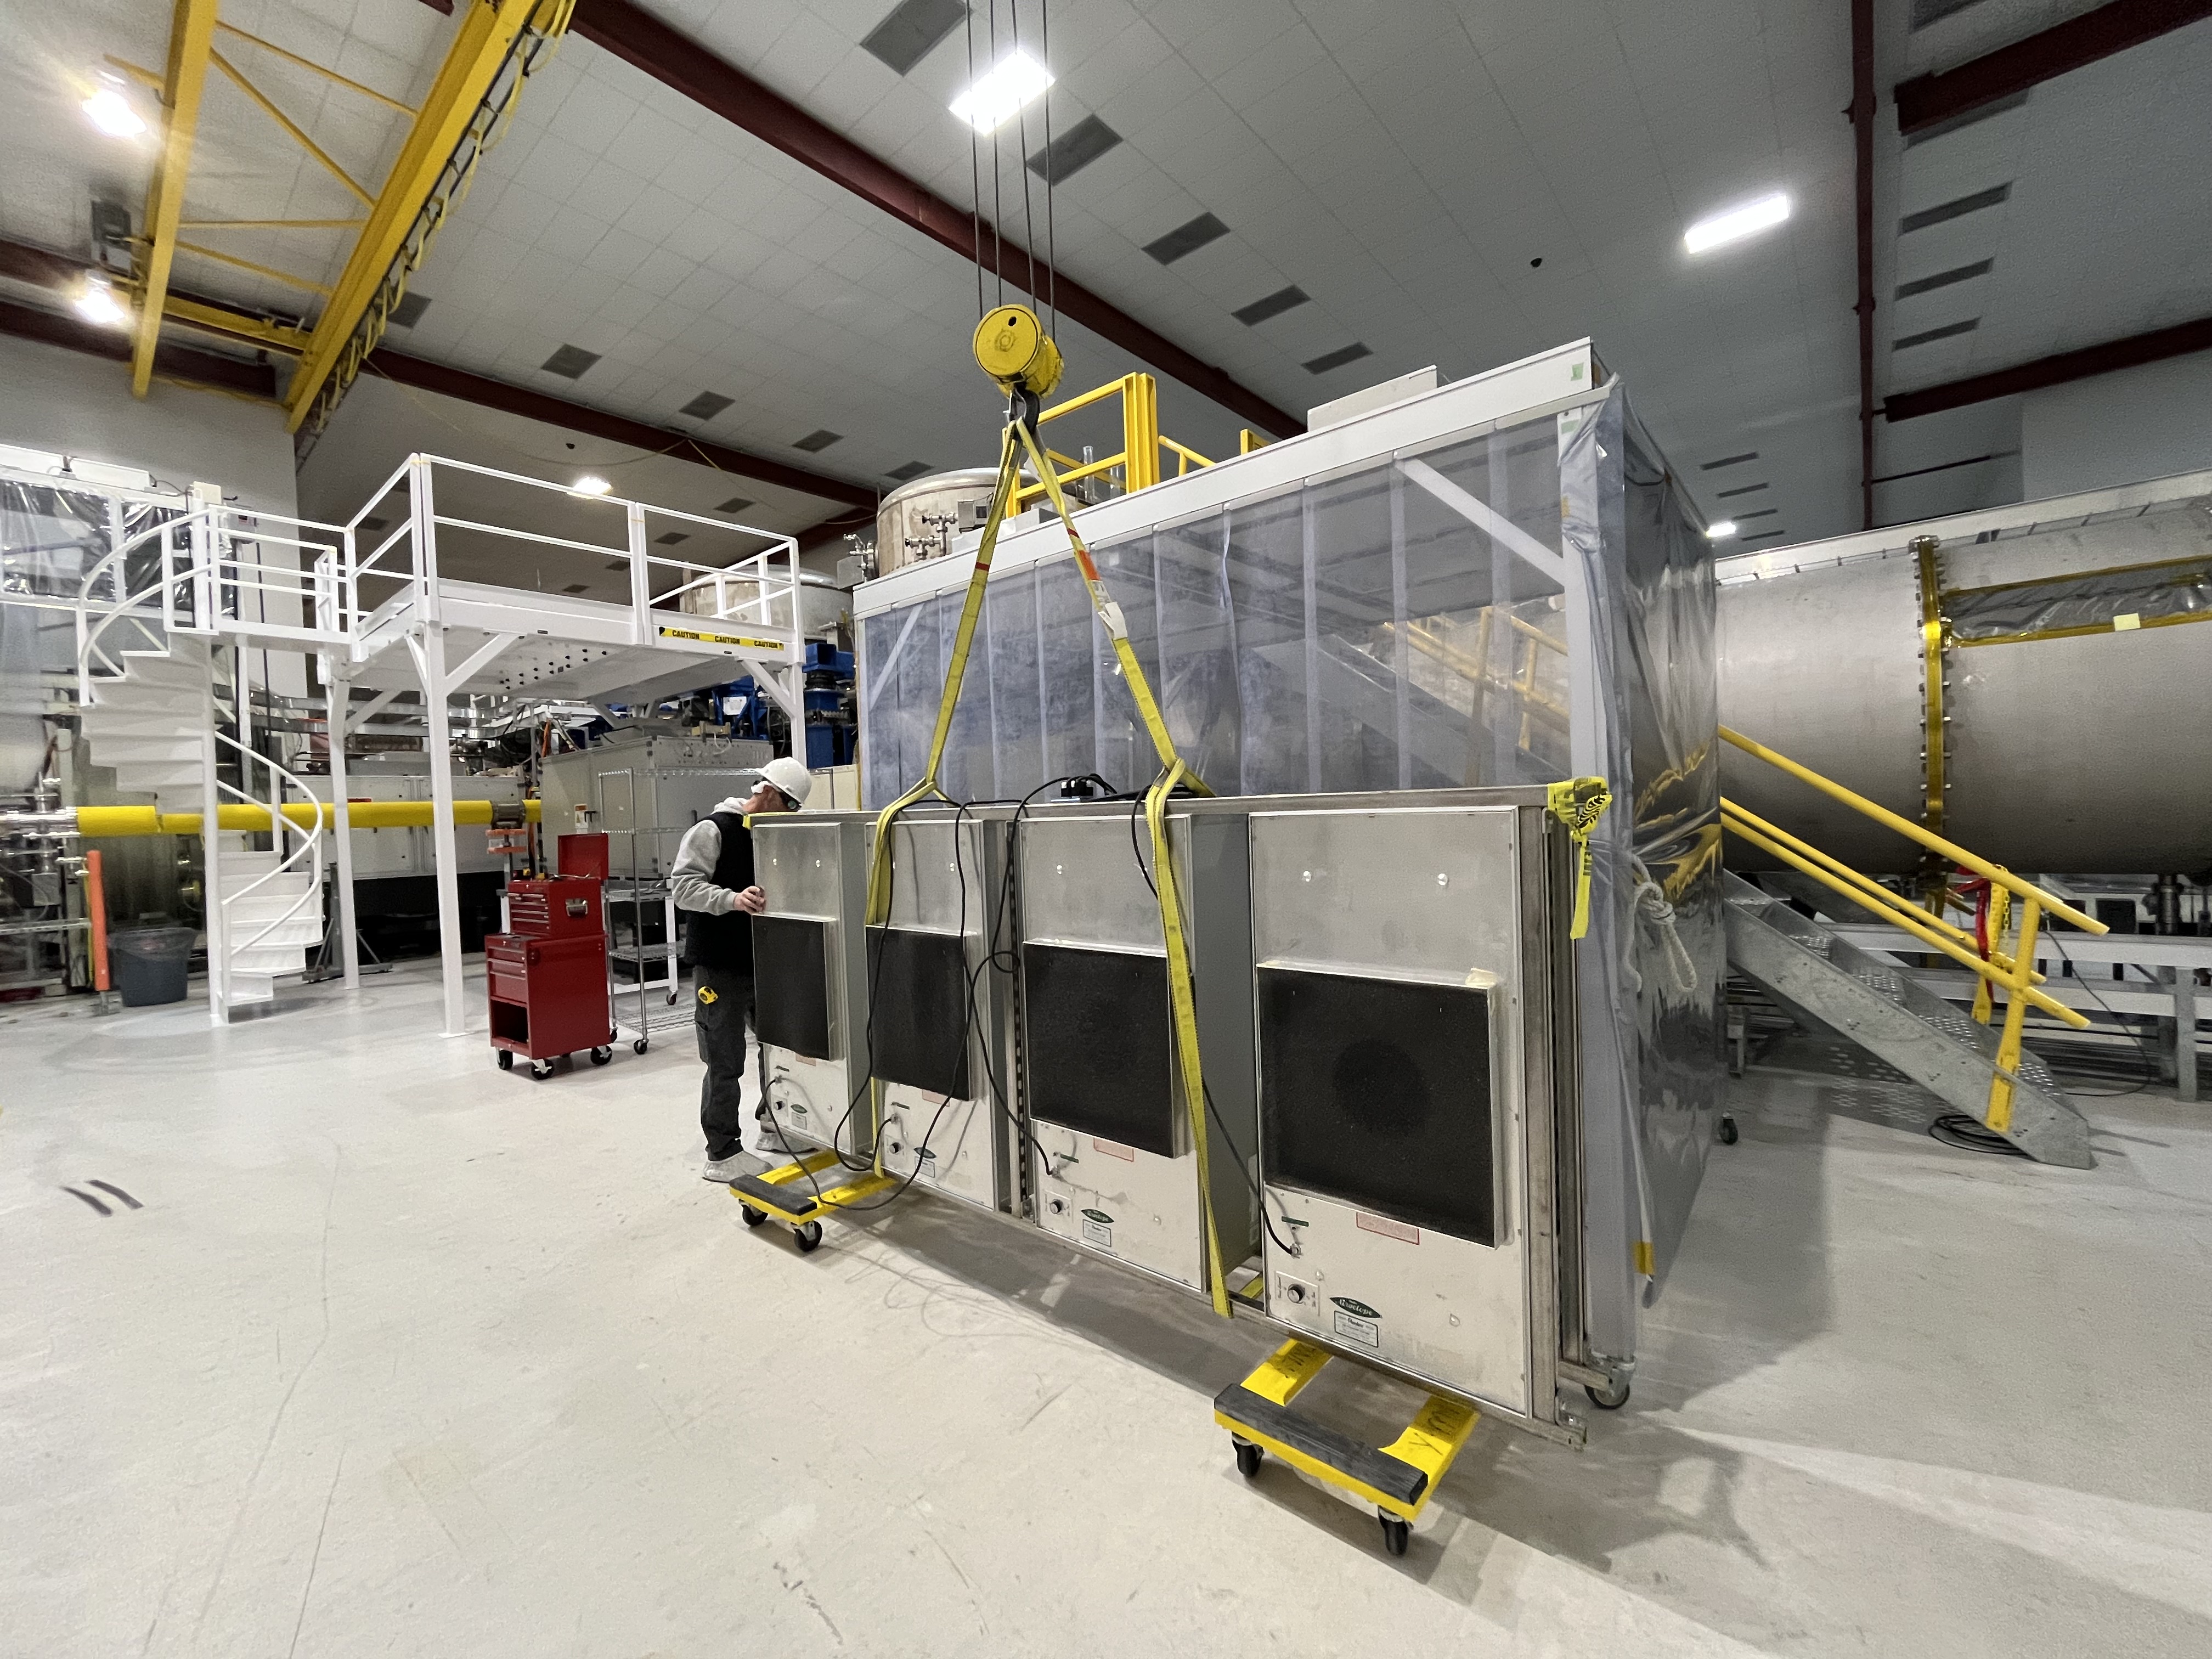
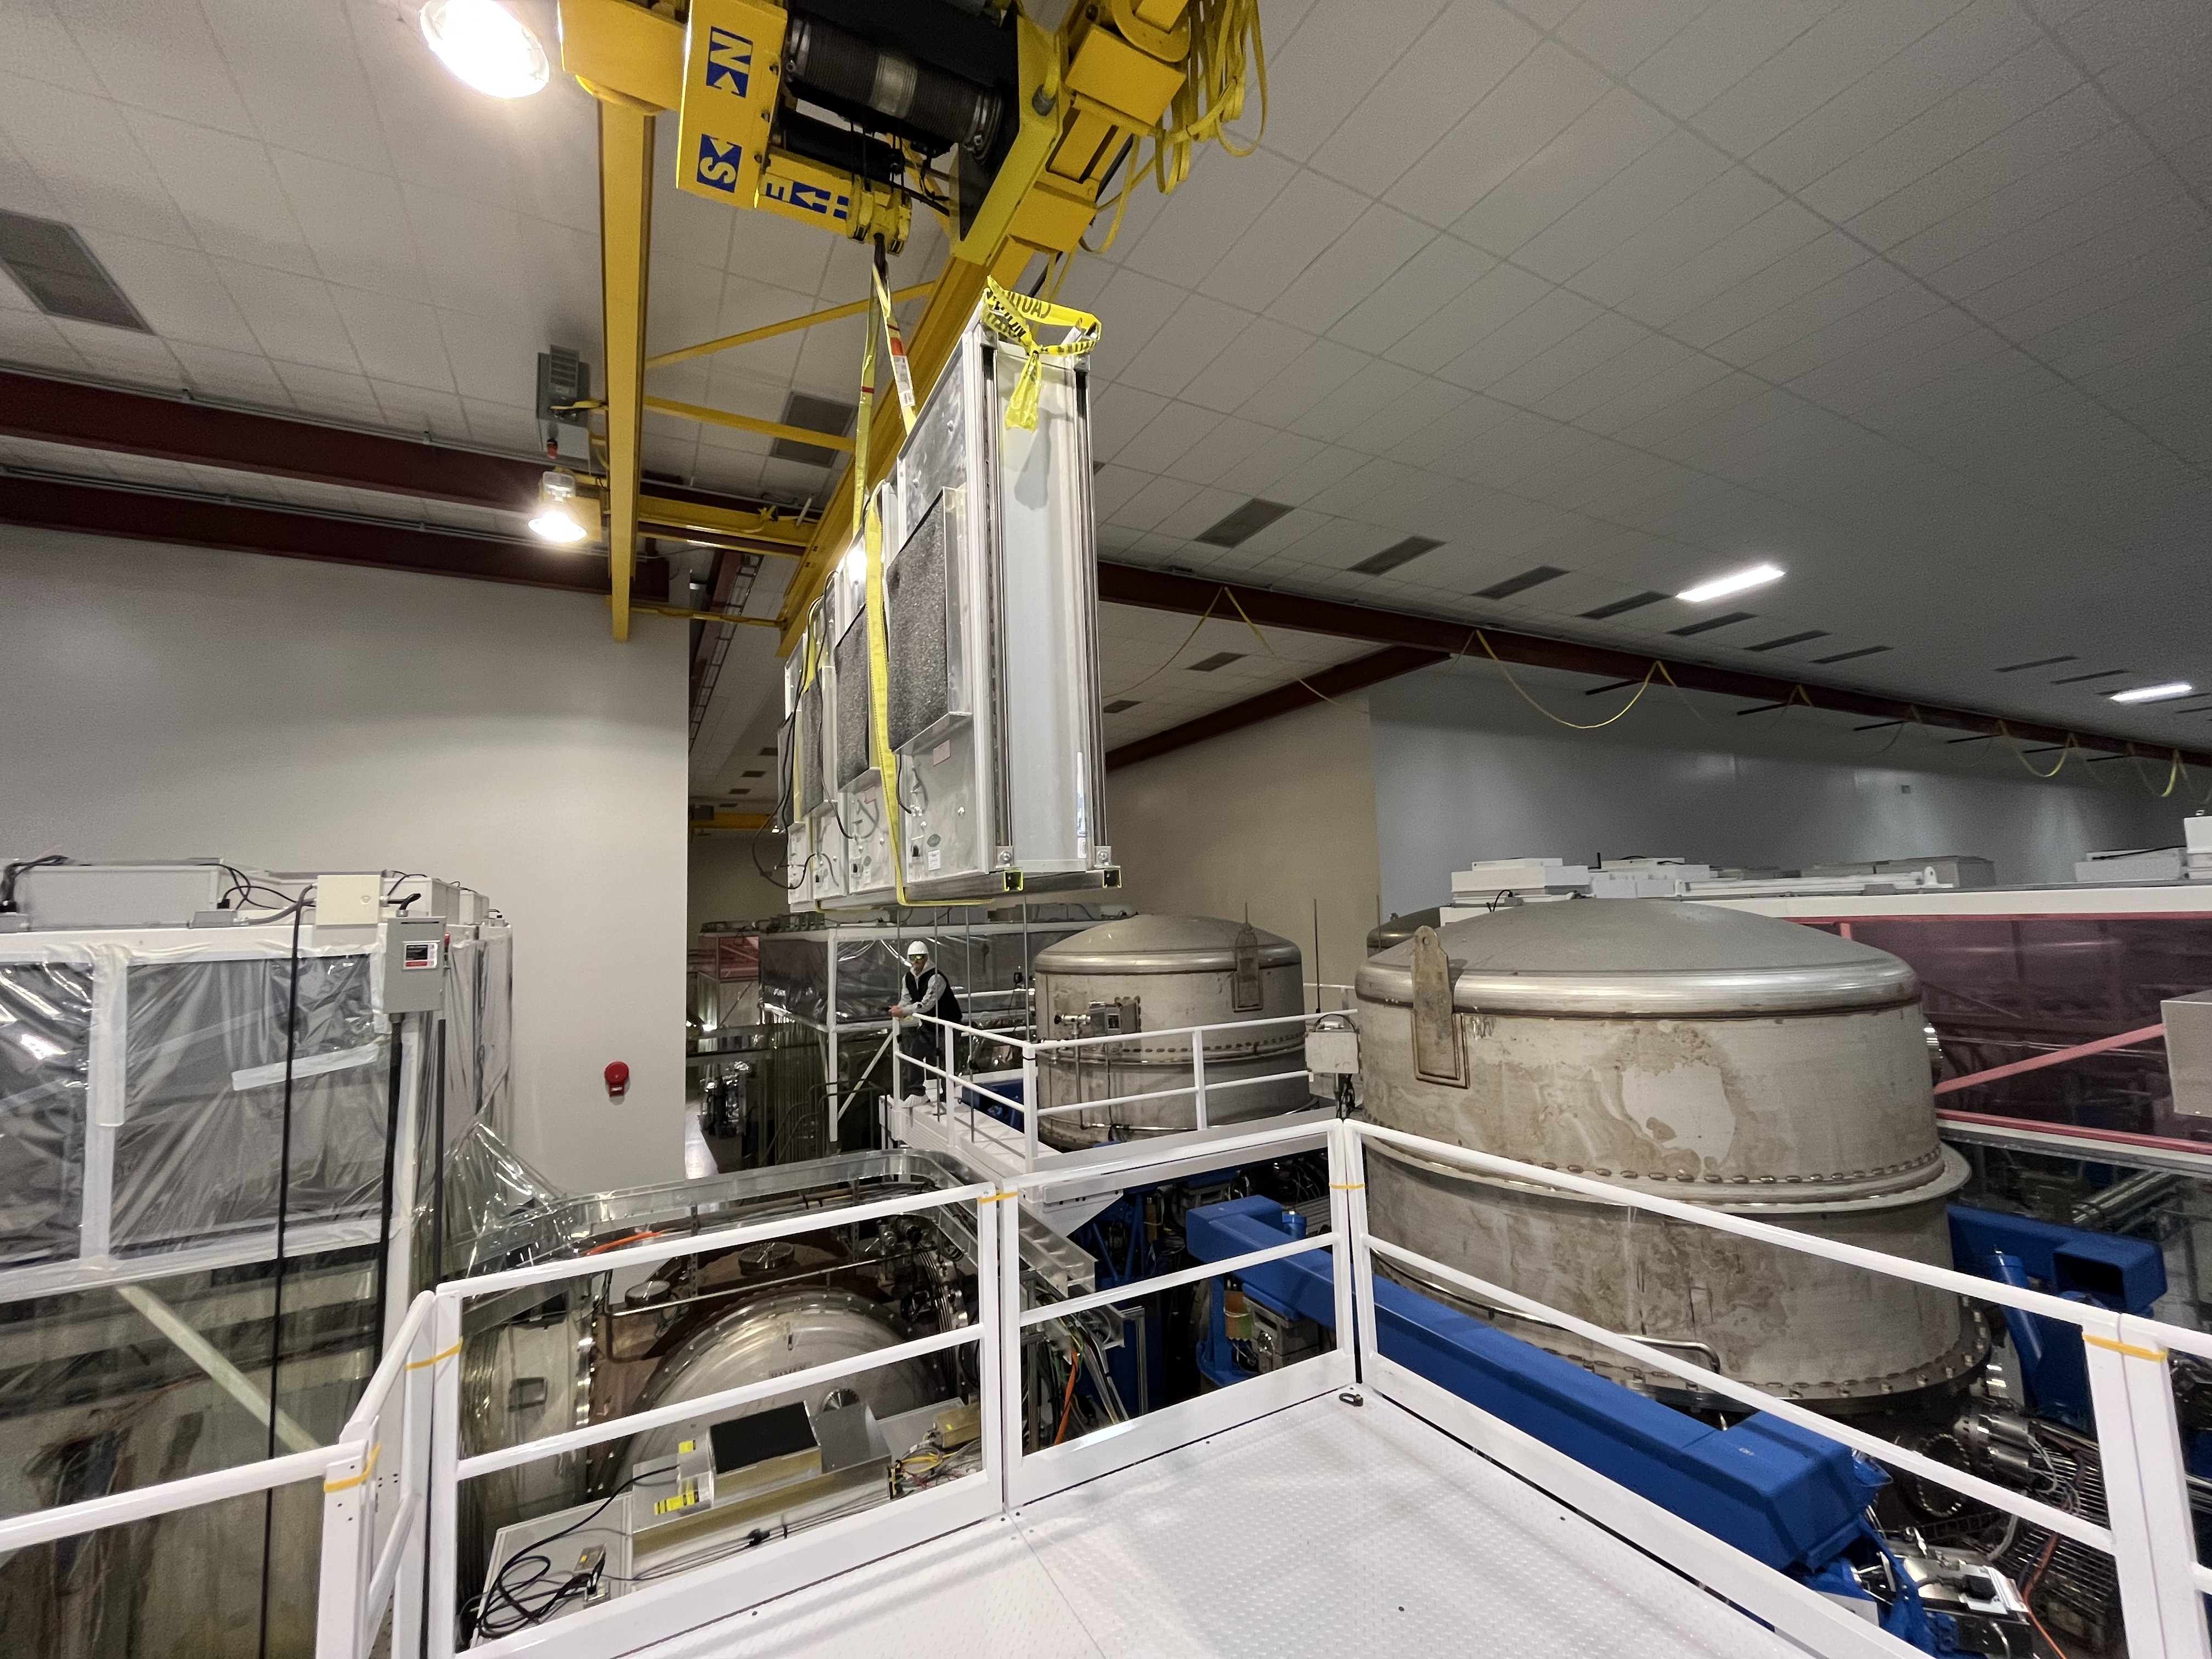
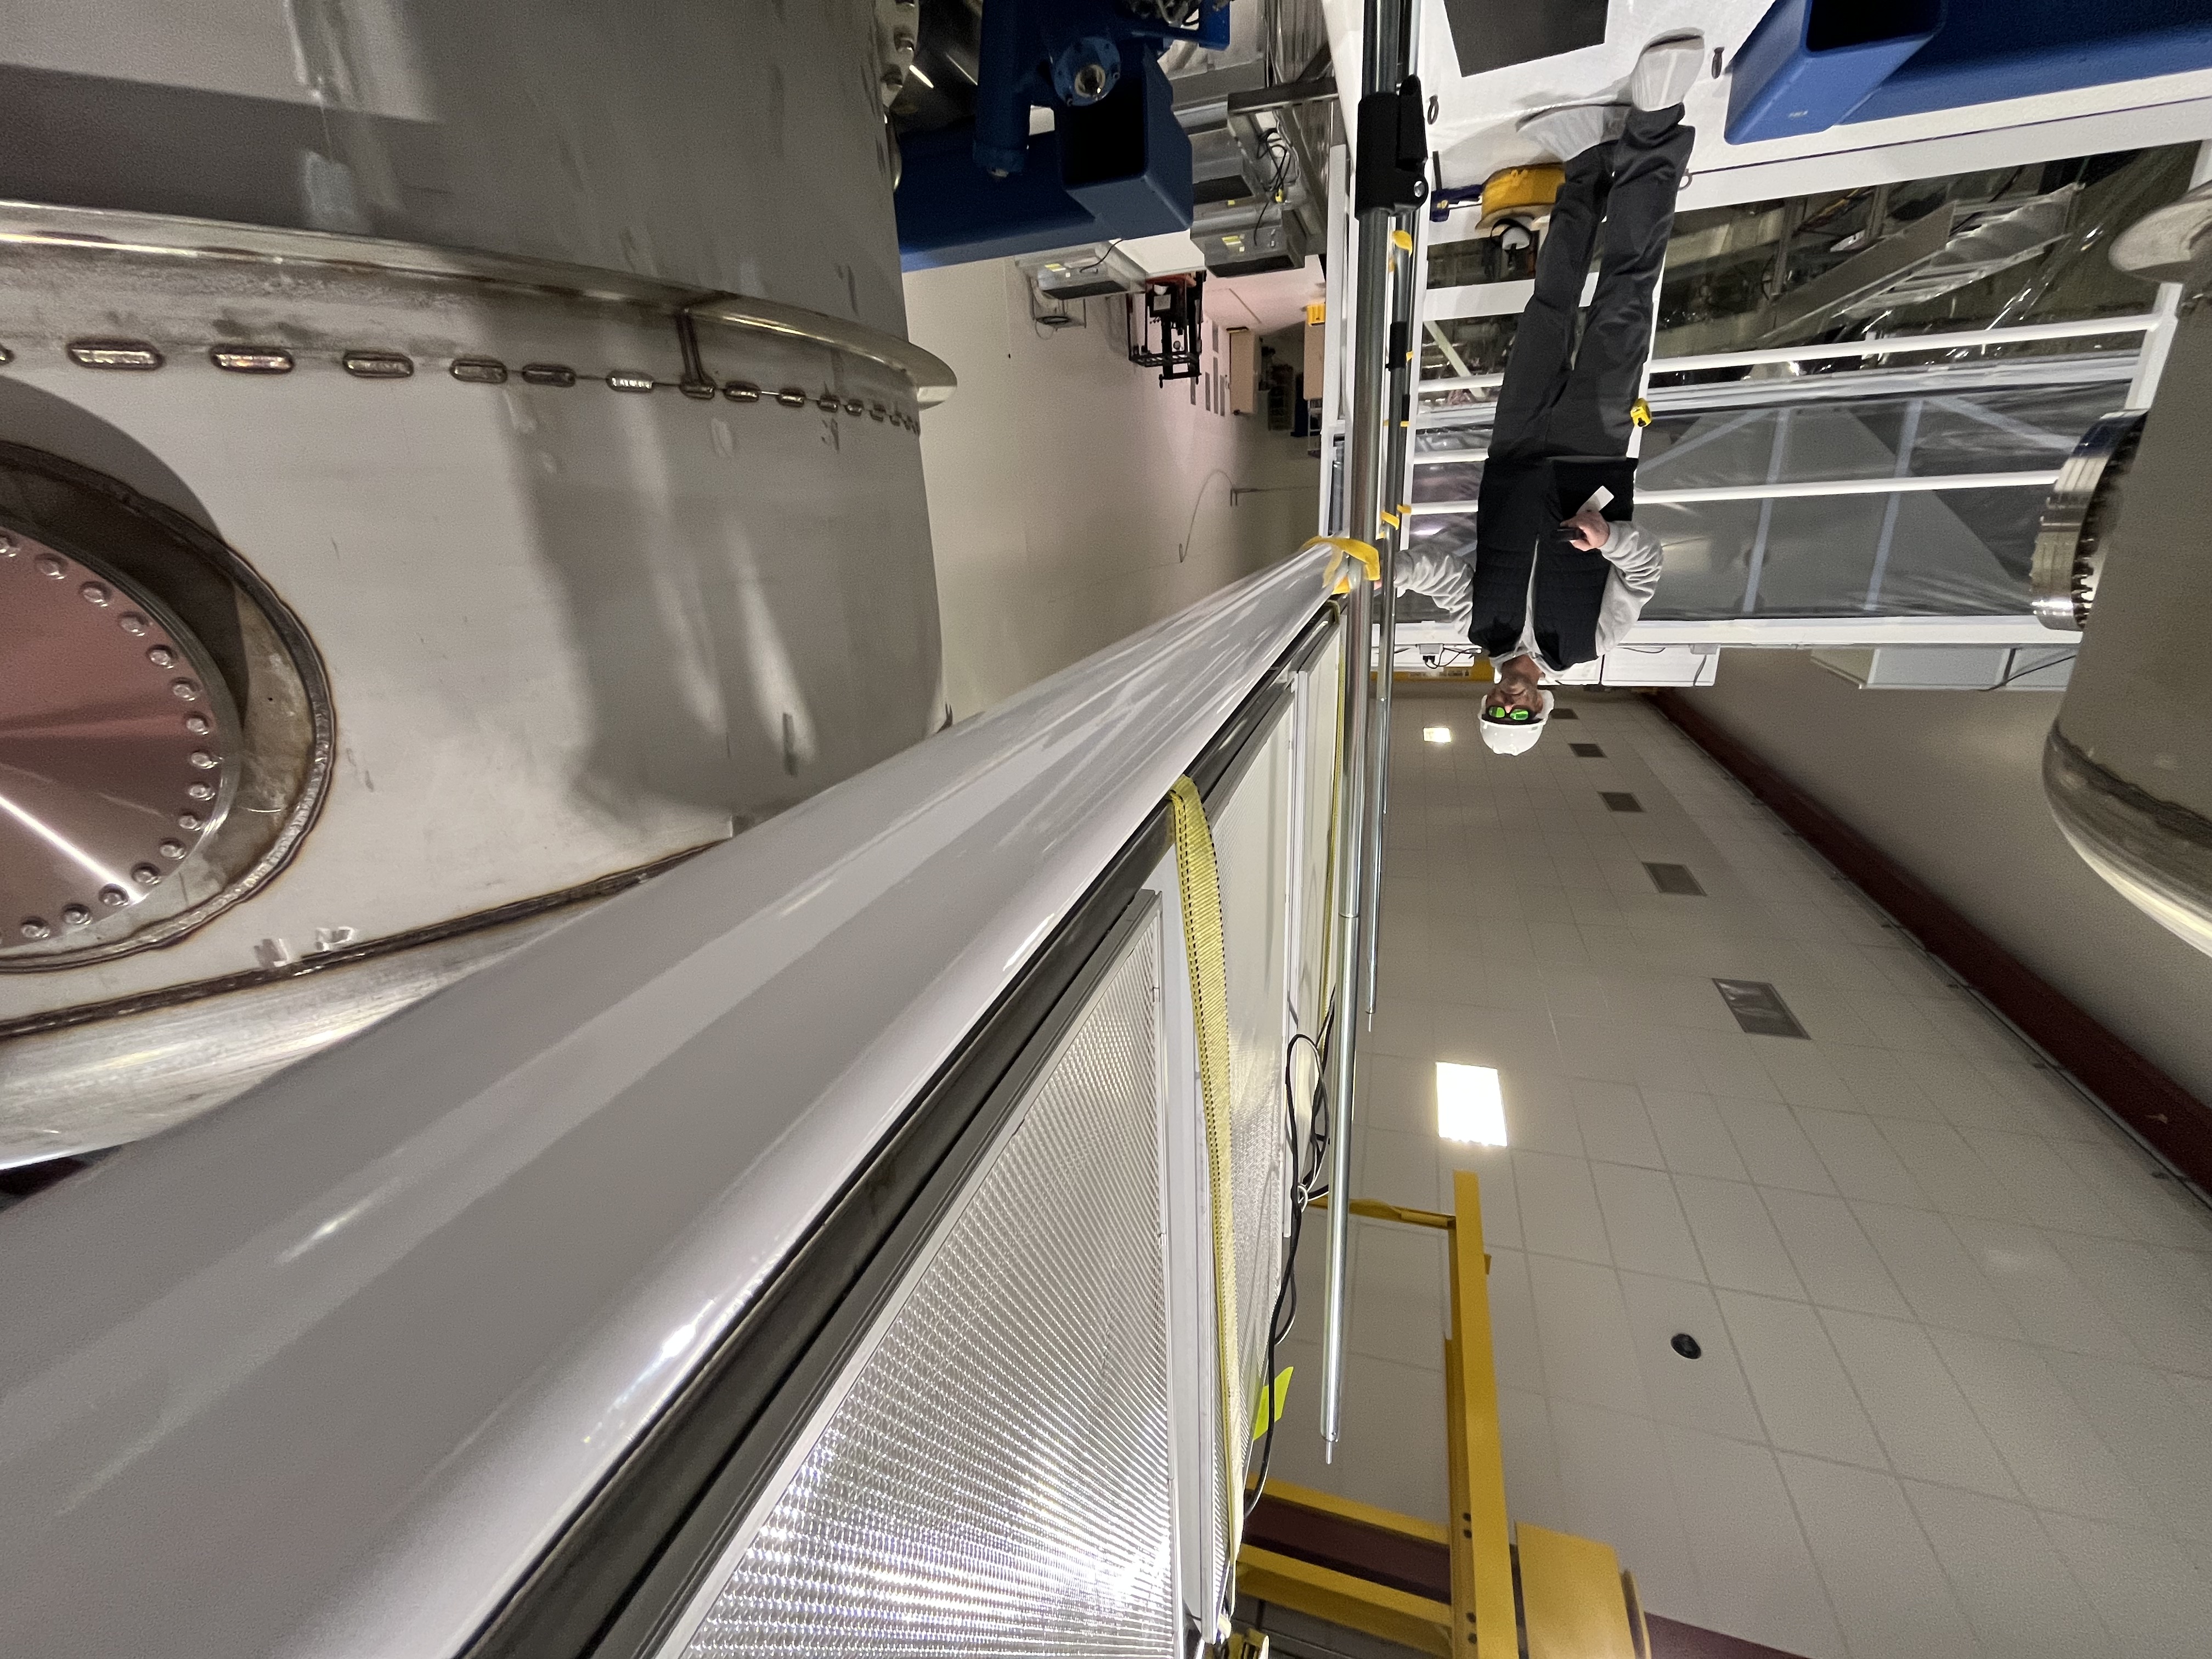
Tools and parts were wrapped and bagged. EOM assy was wrapped in a foil. These things will be transported to HAM1 tomorrow.
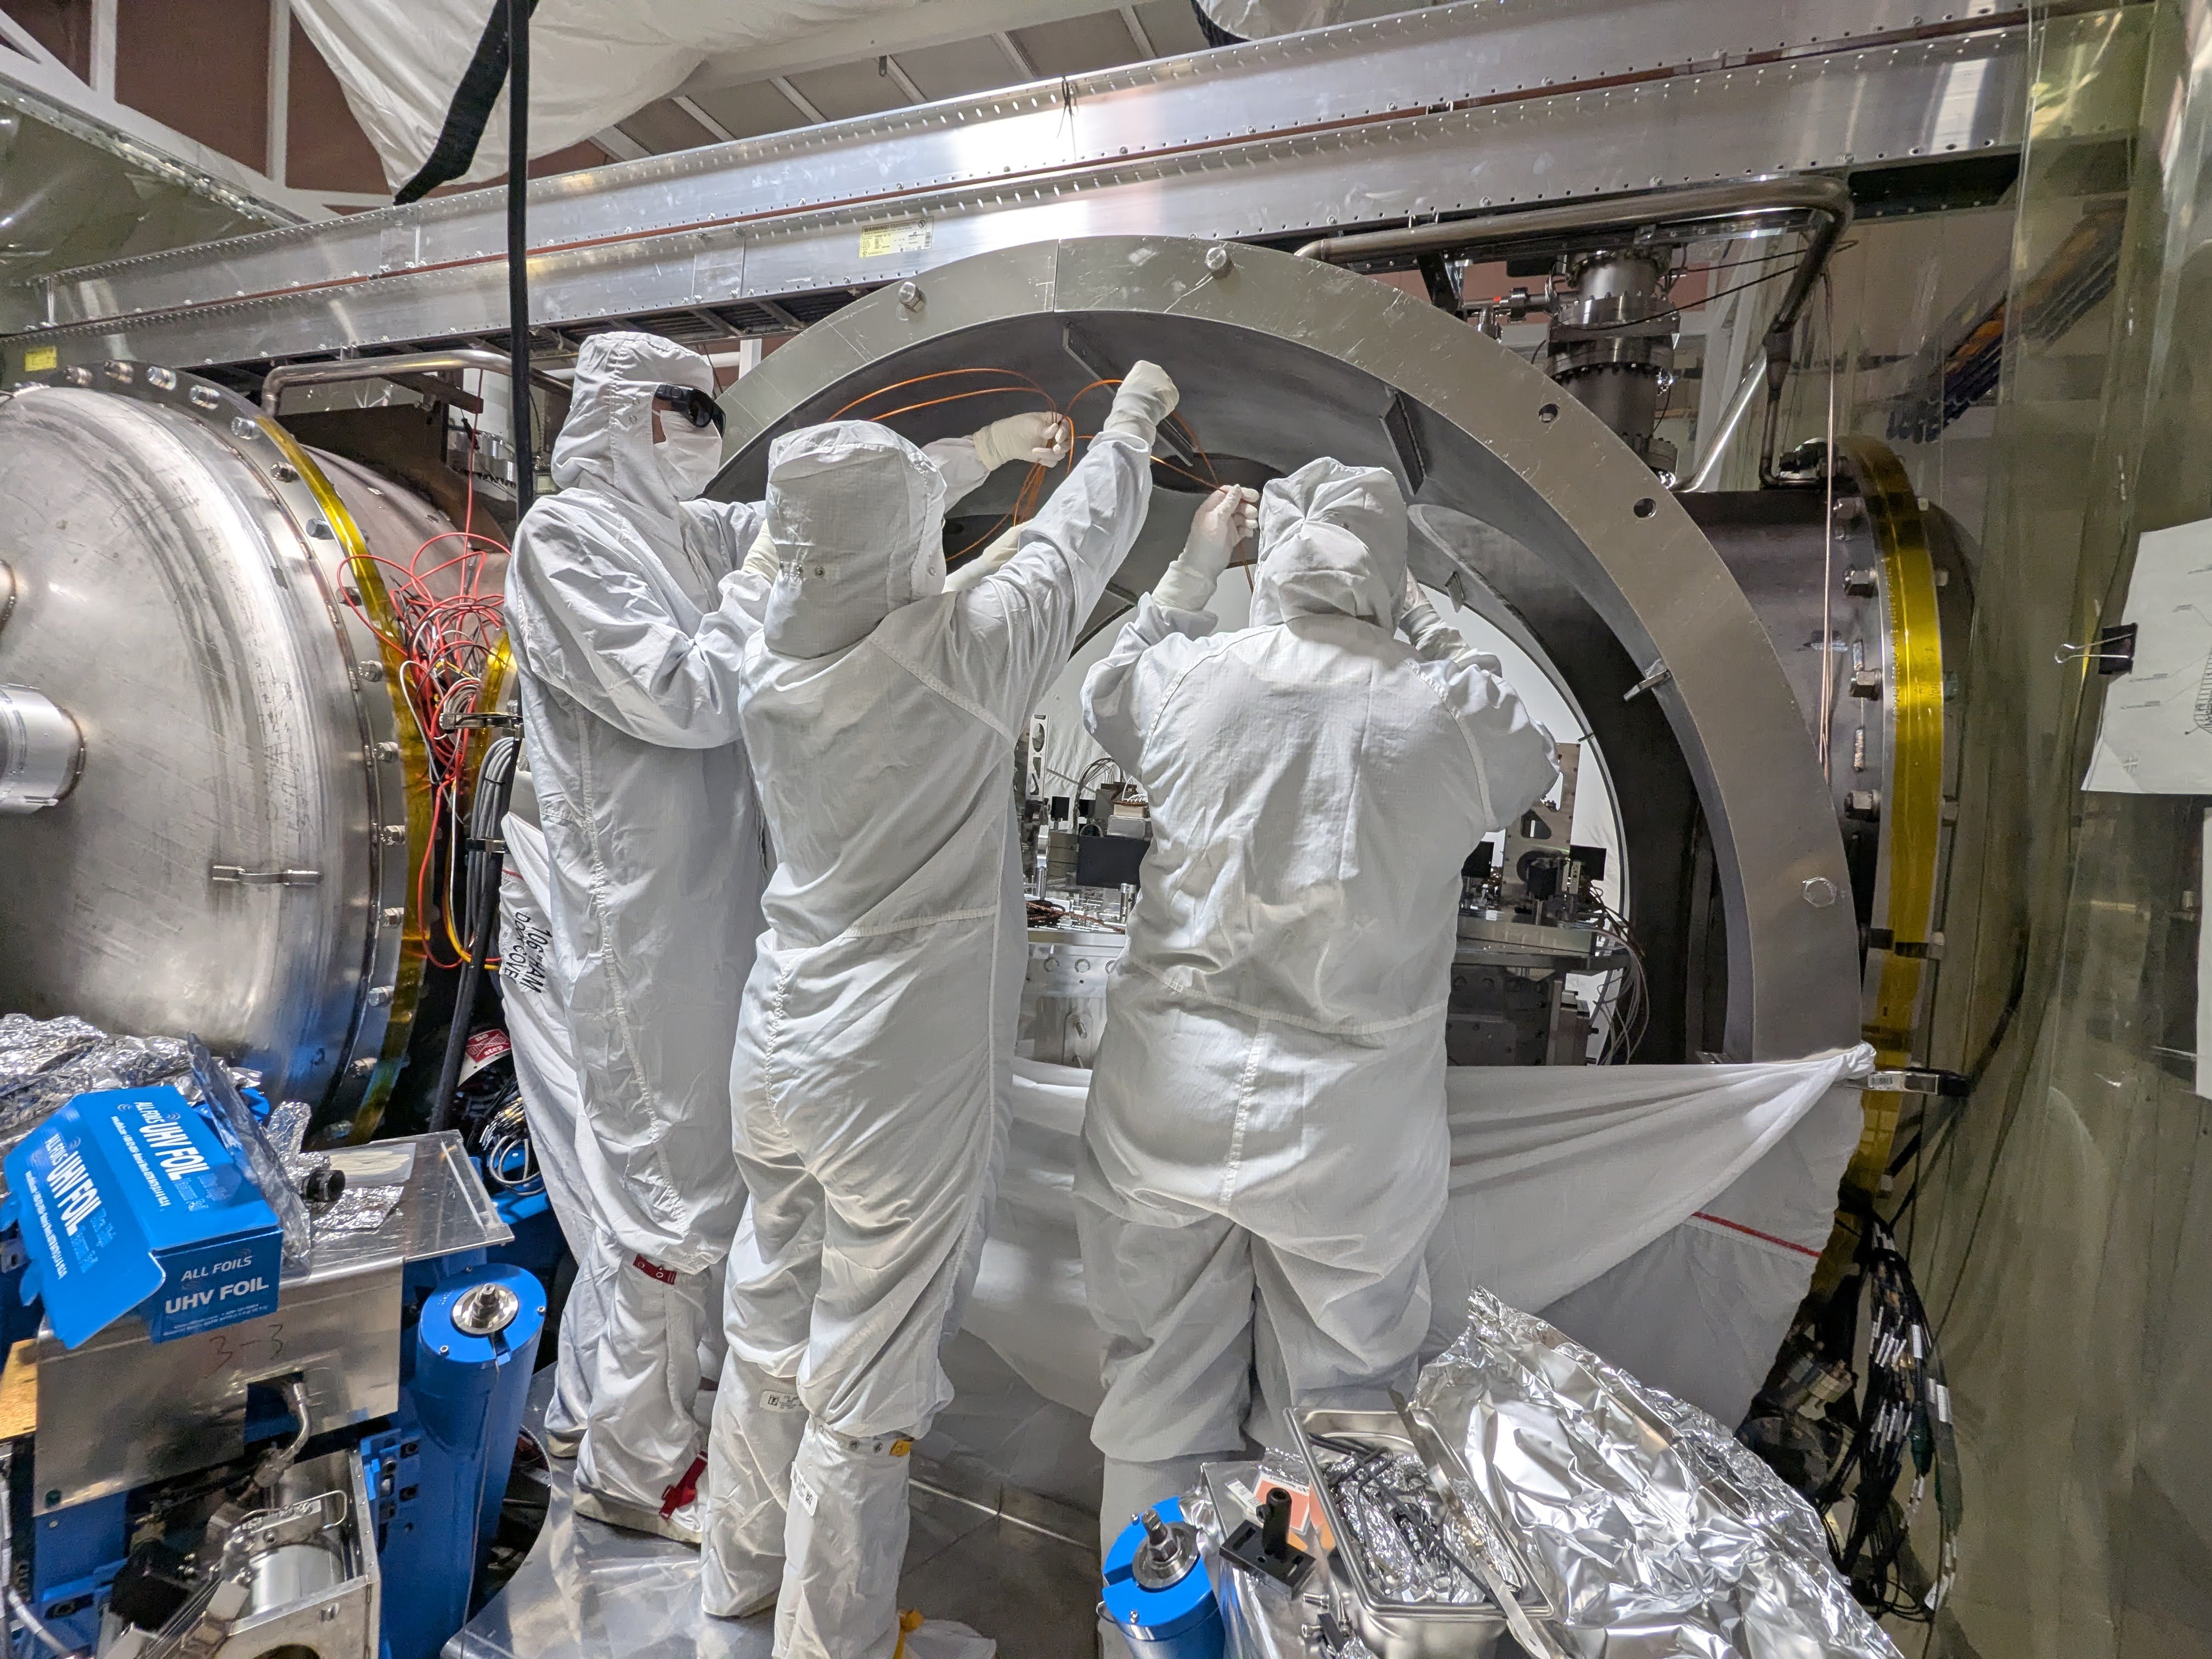
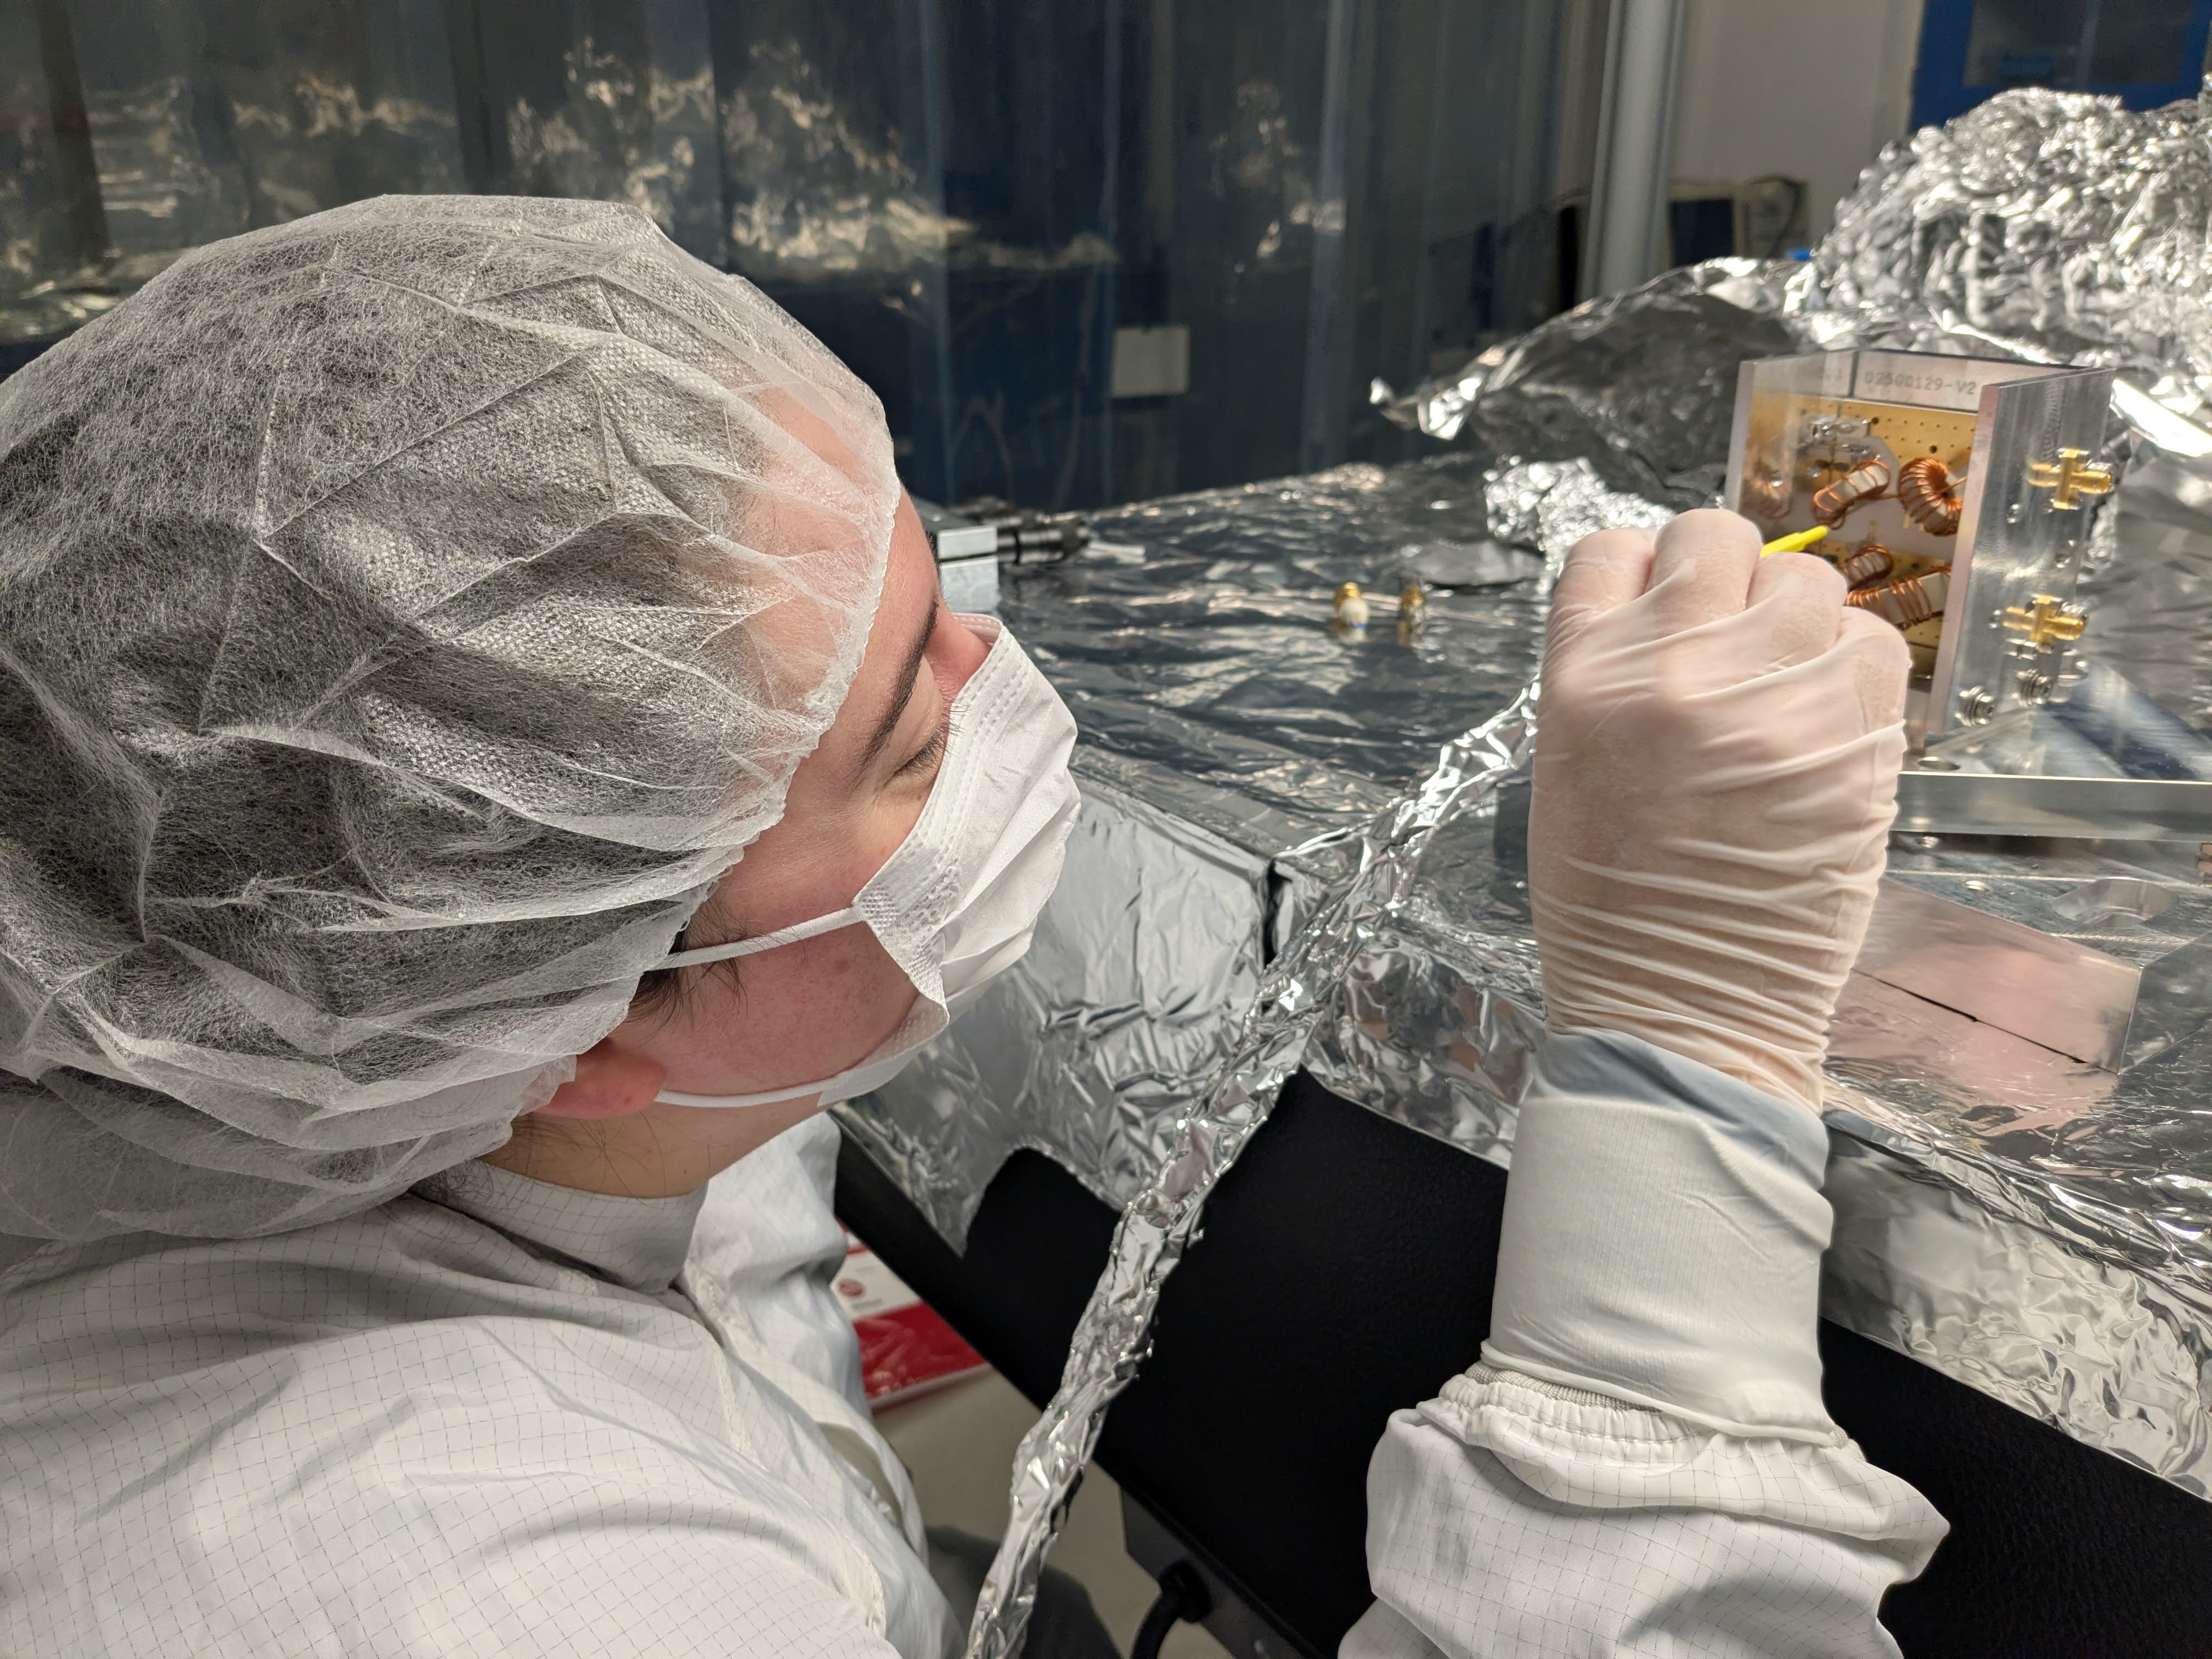
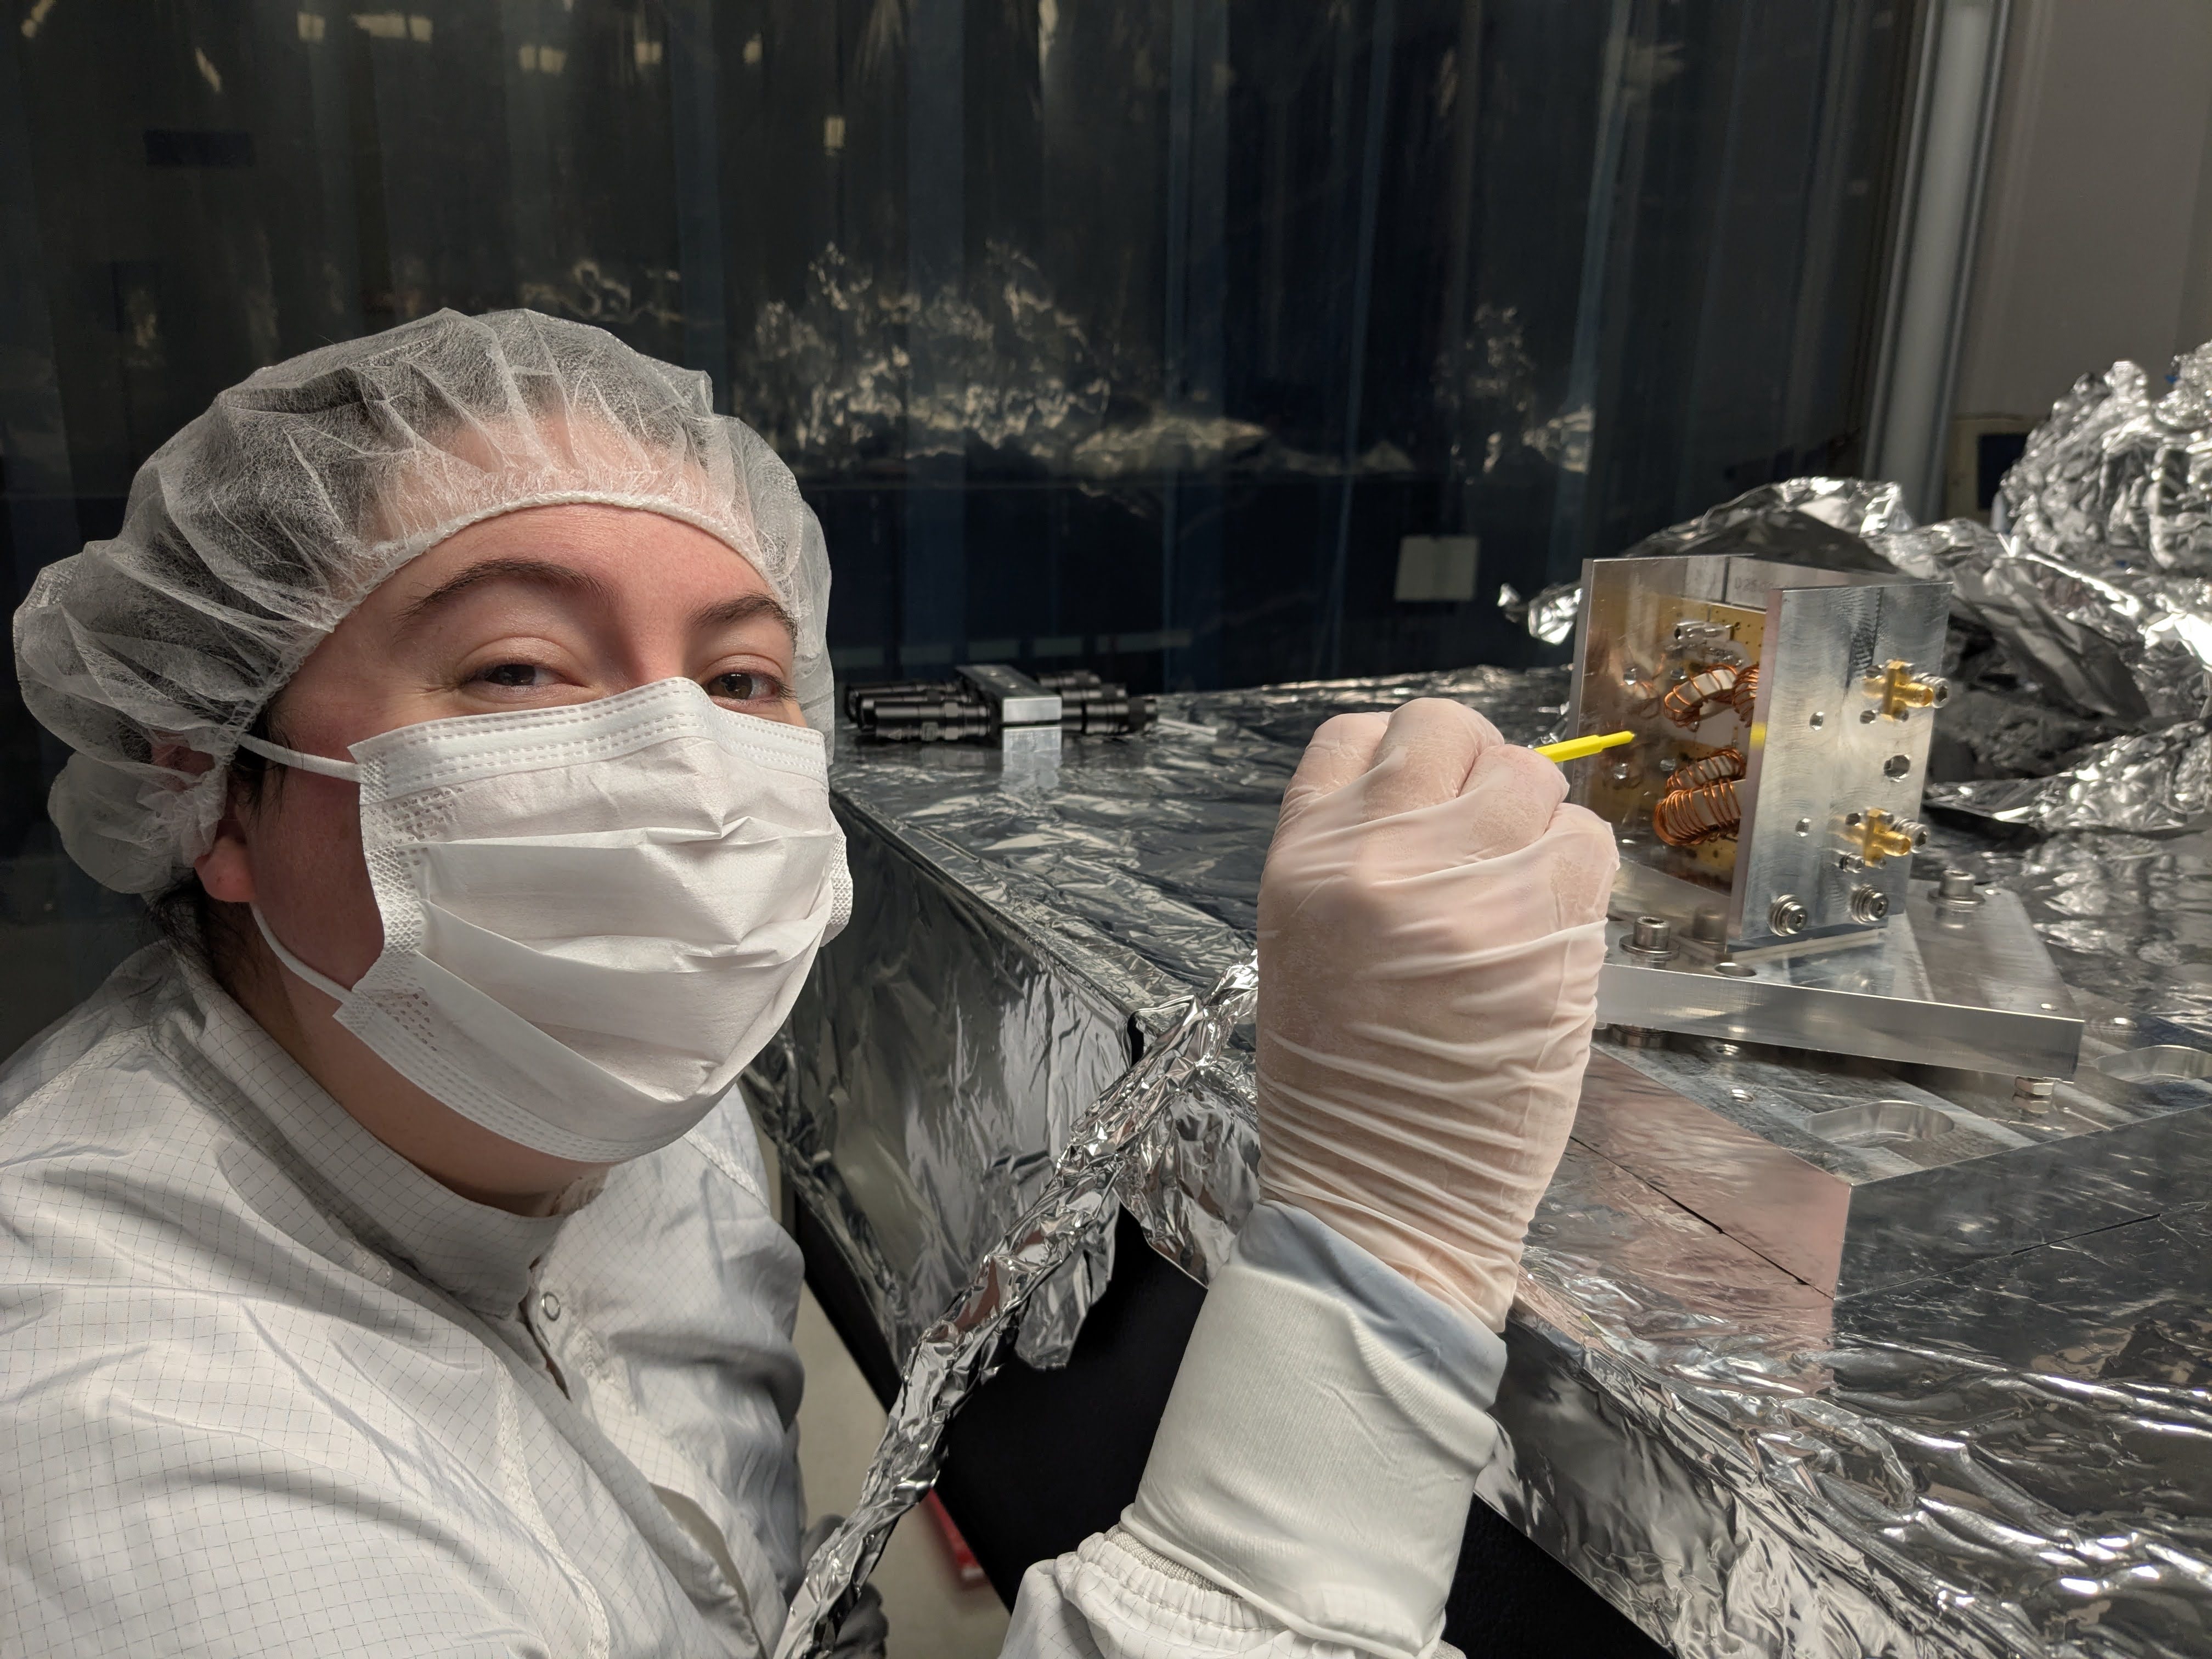
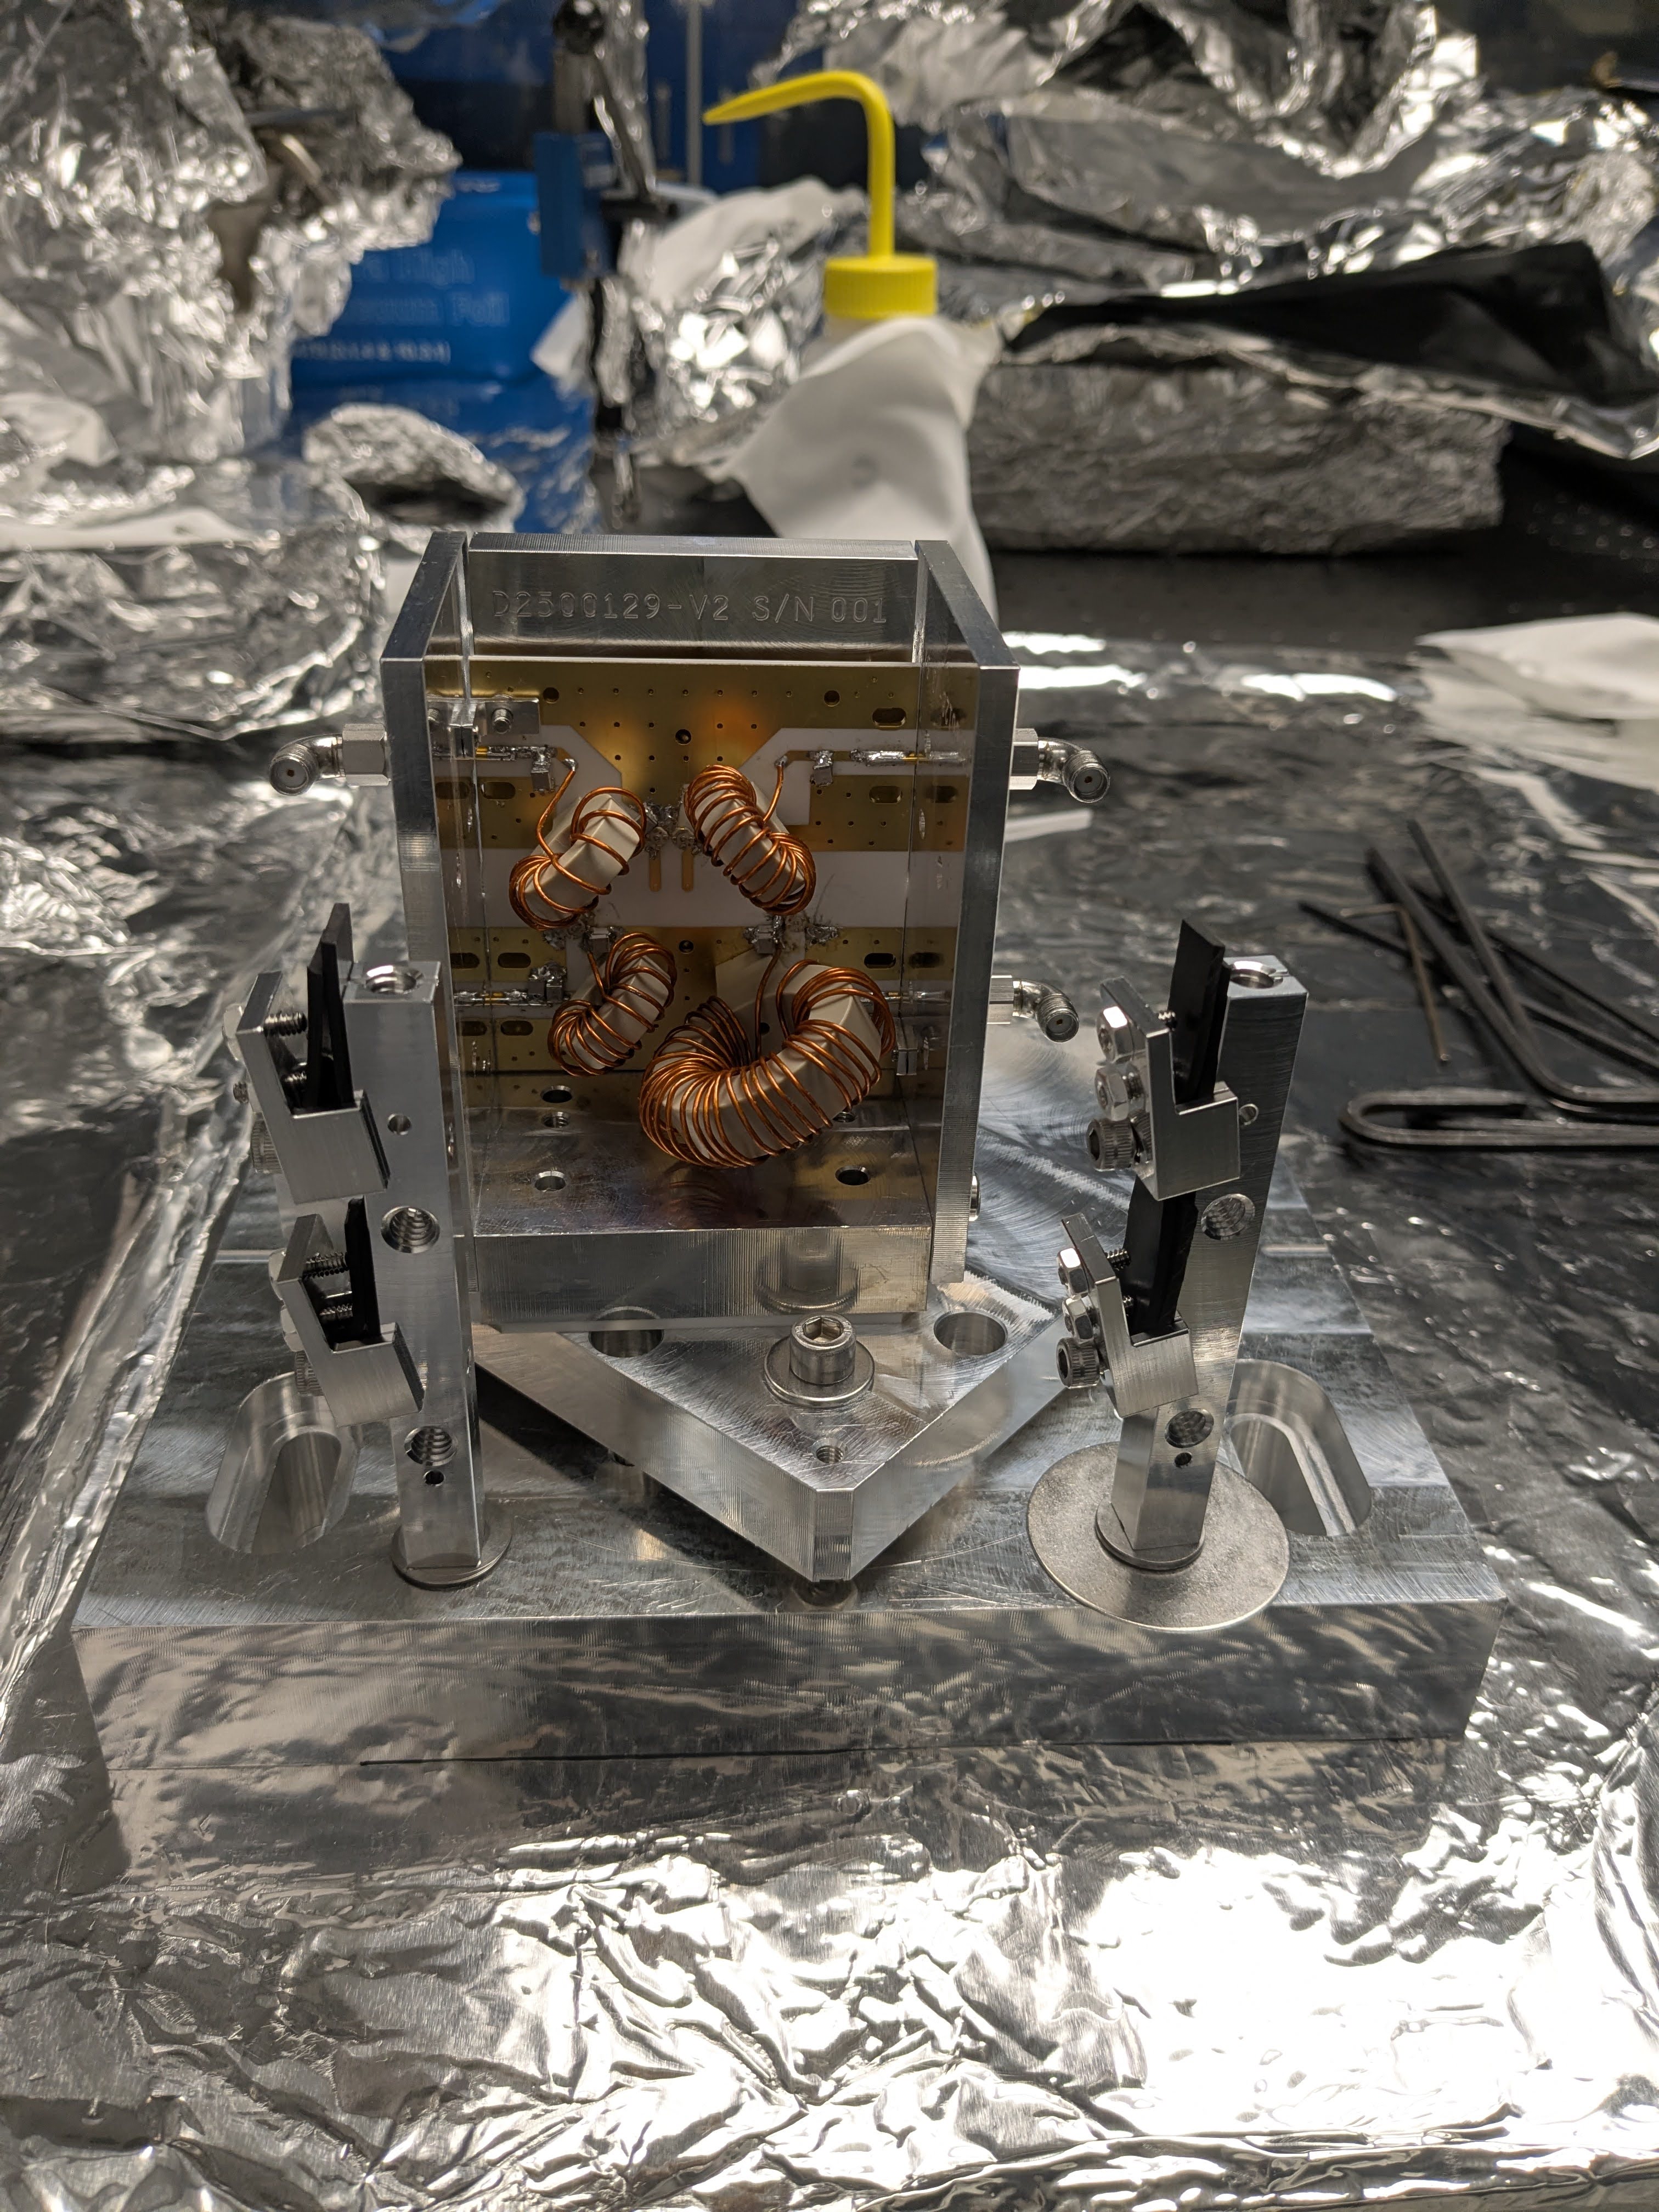
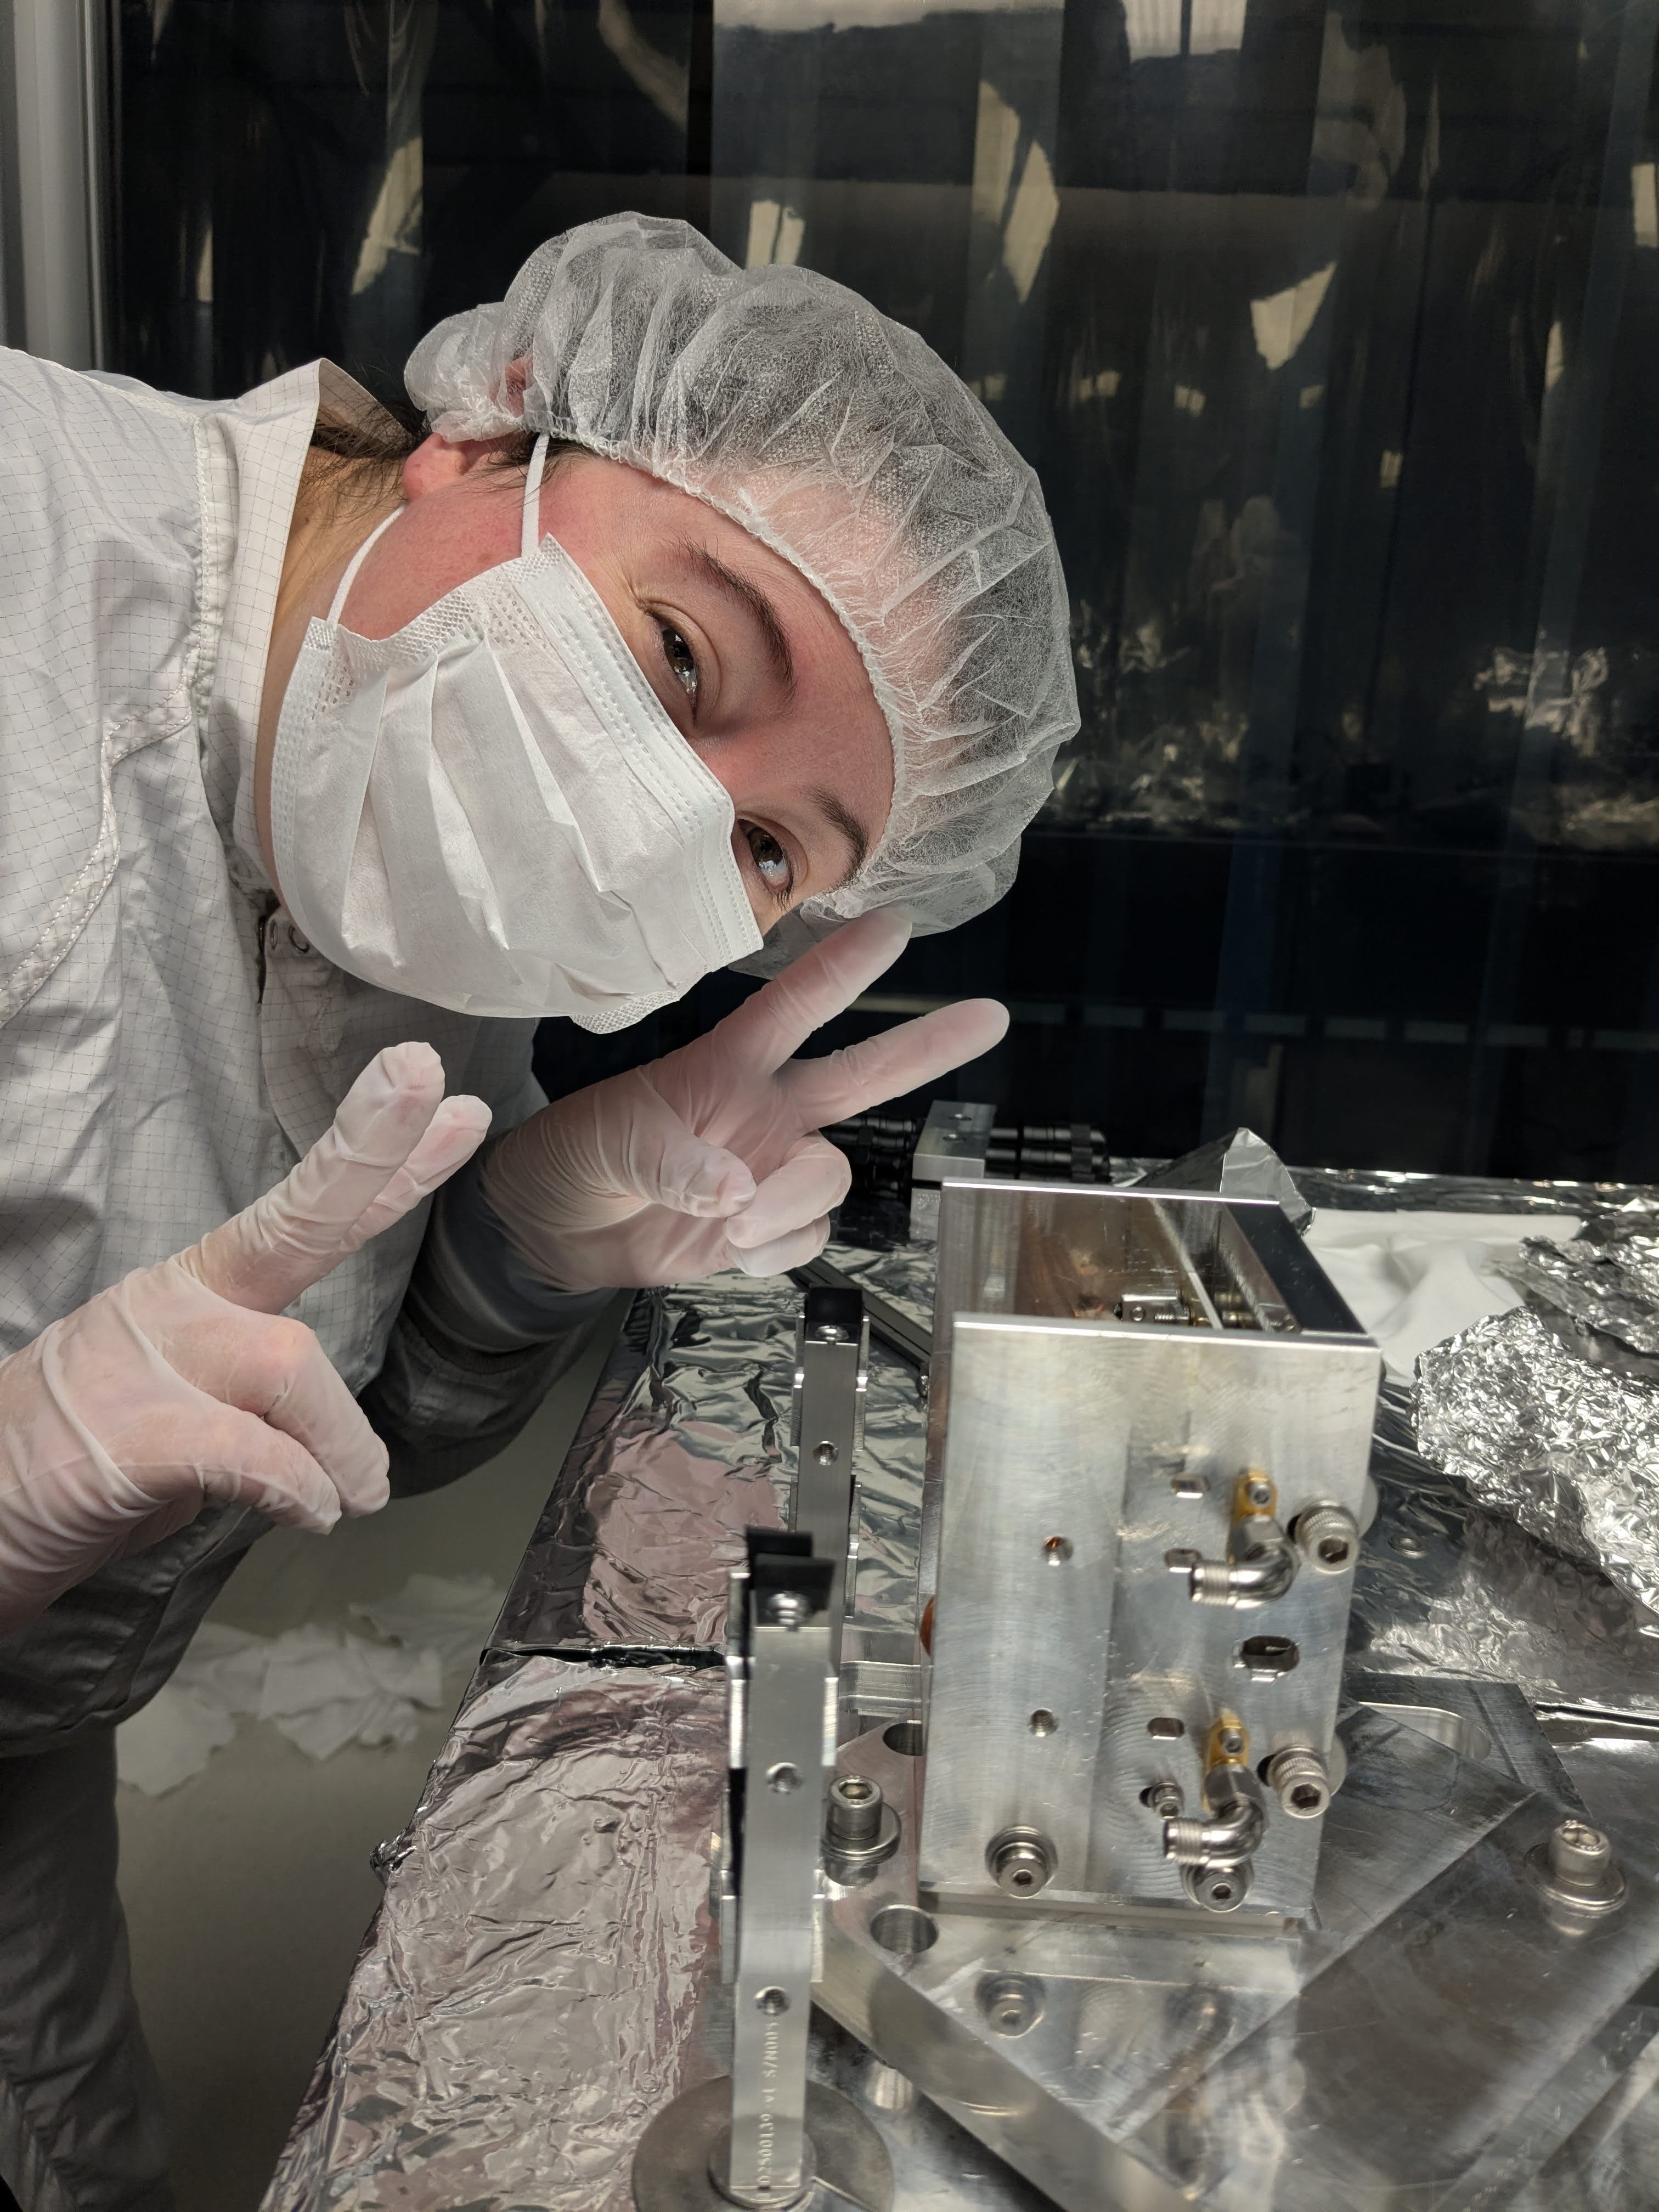
In the first two attachment, Elenna is tuning the trickiest frequency (118MHz).
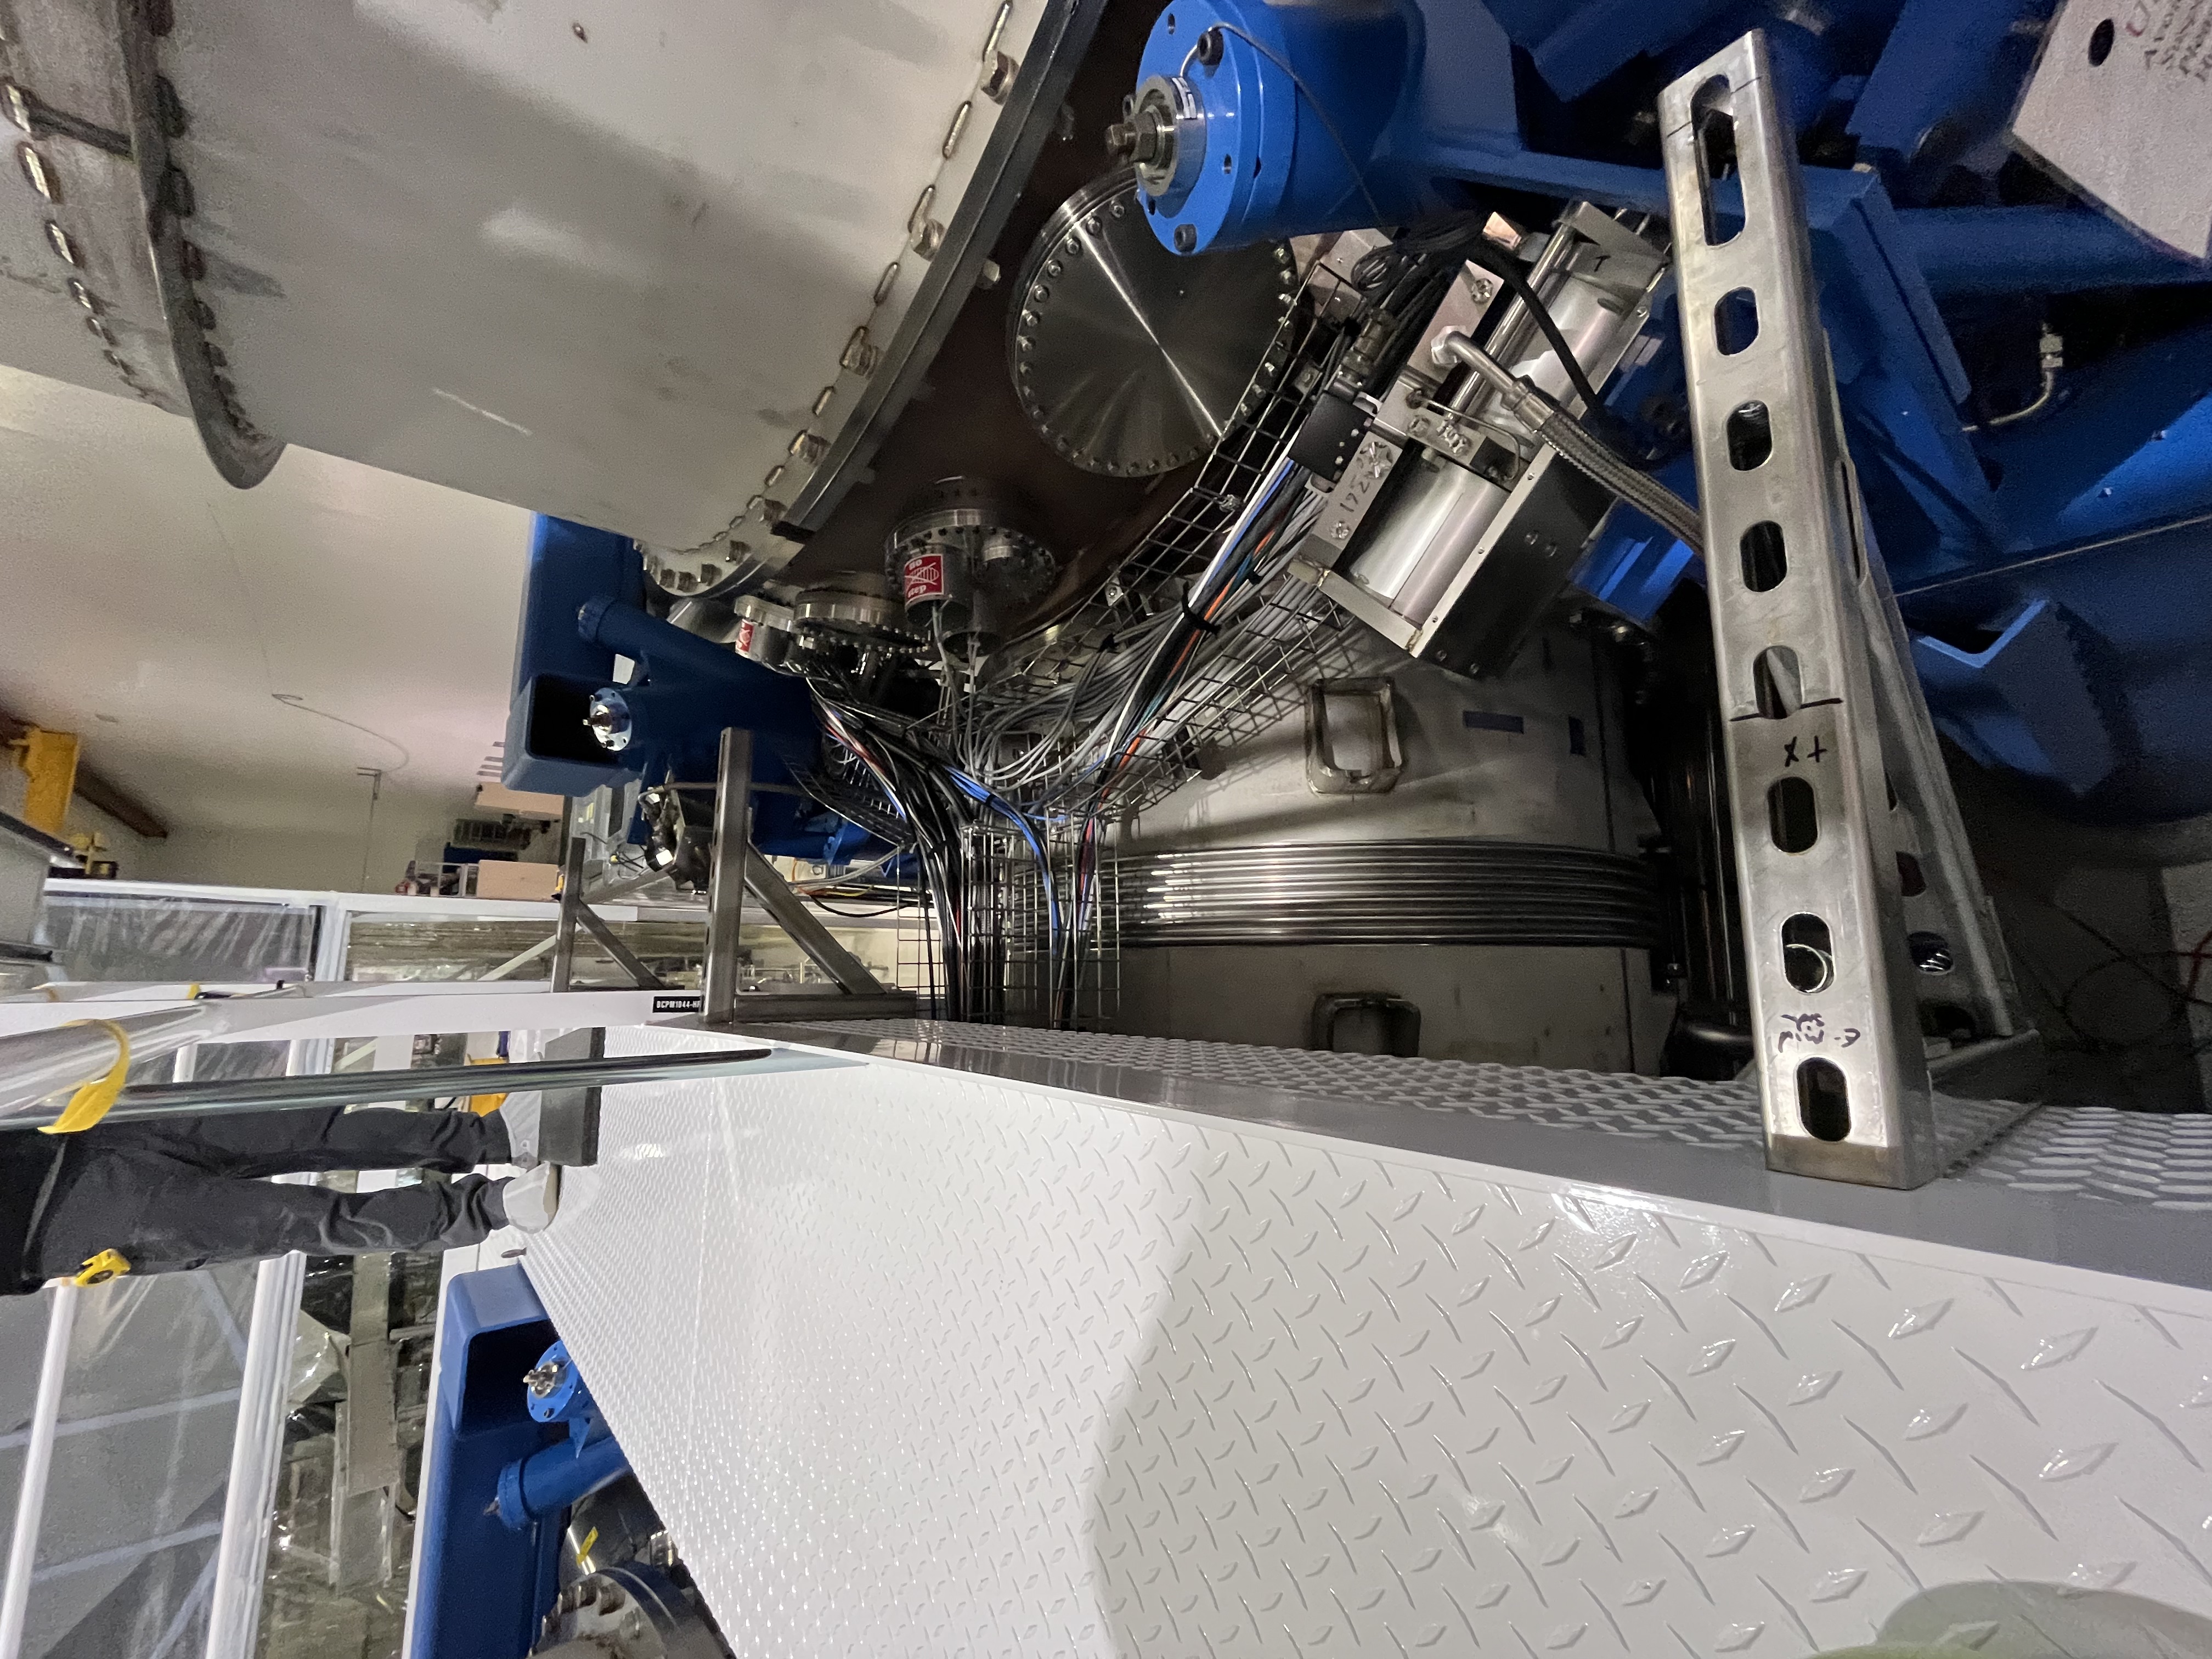
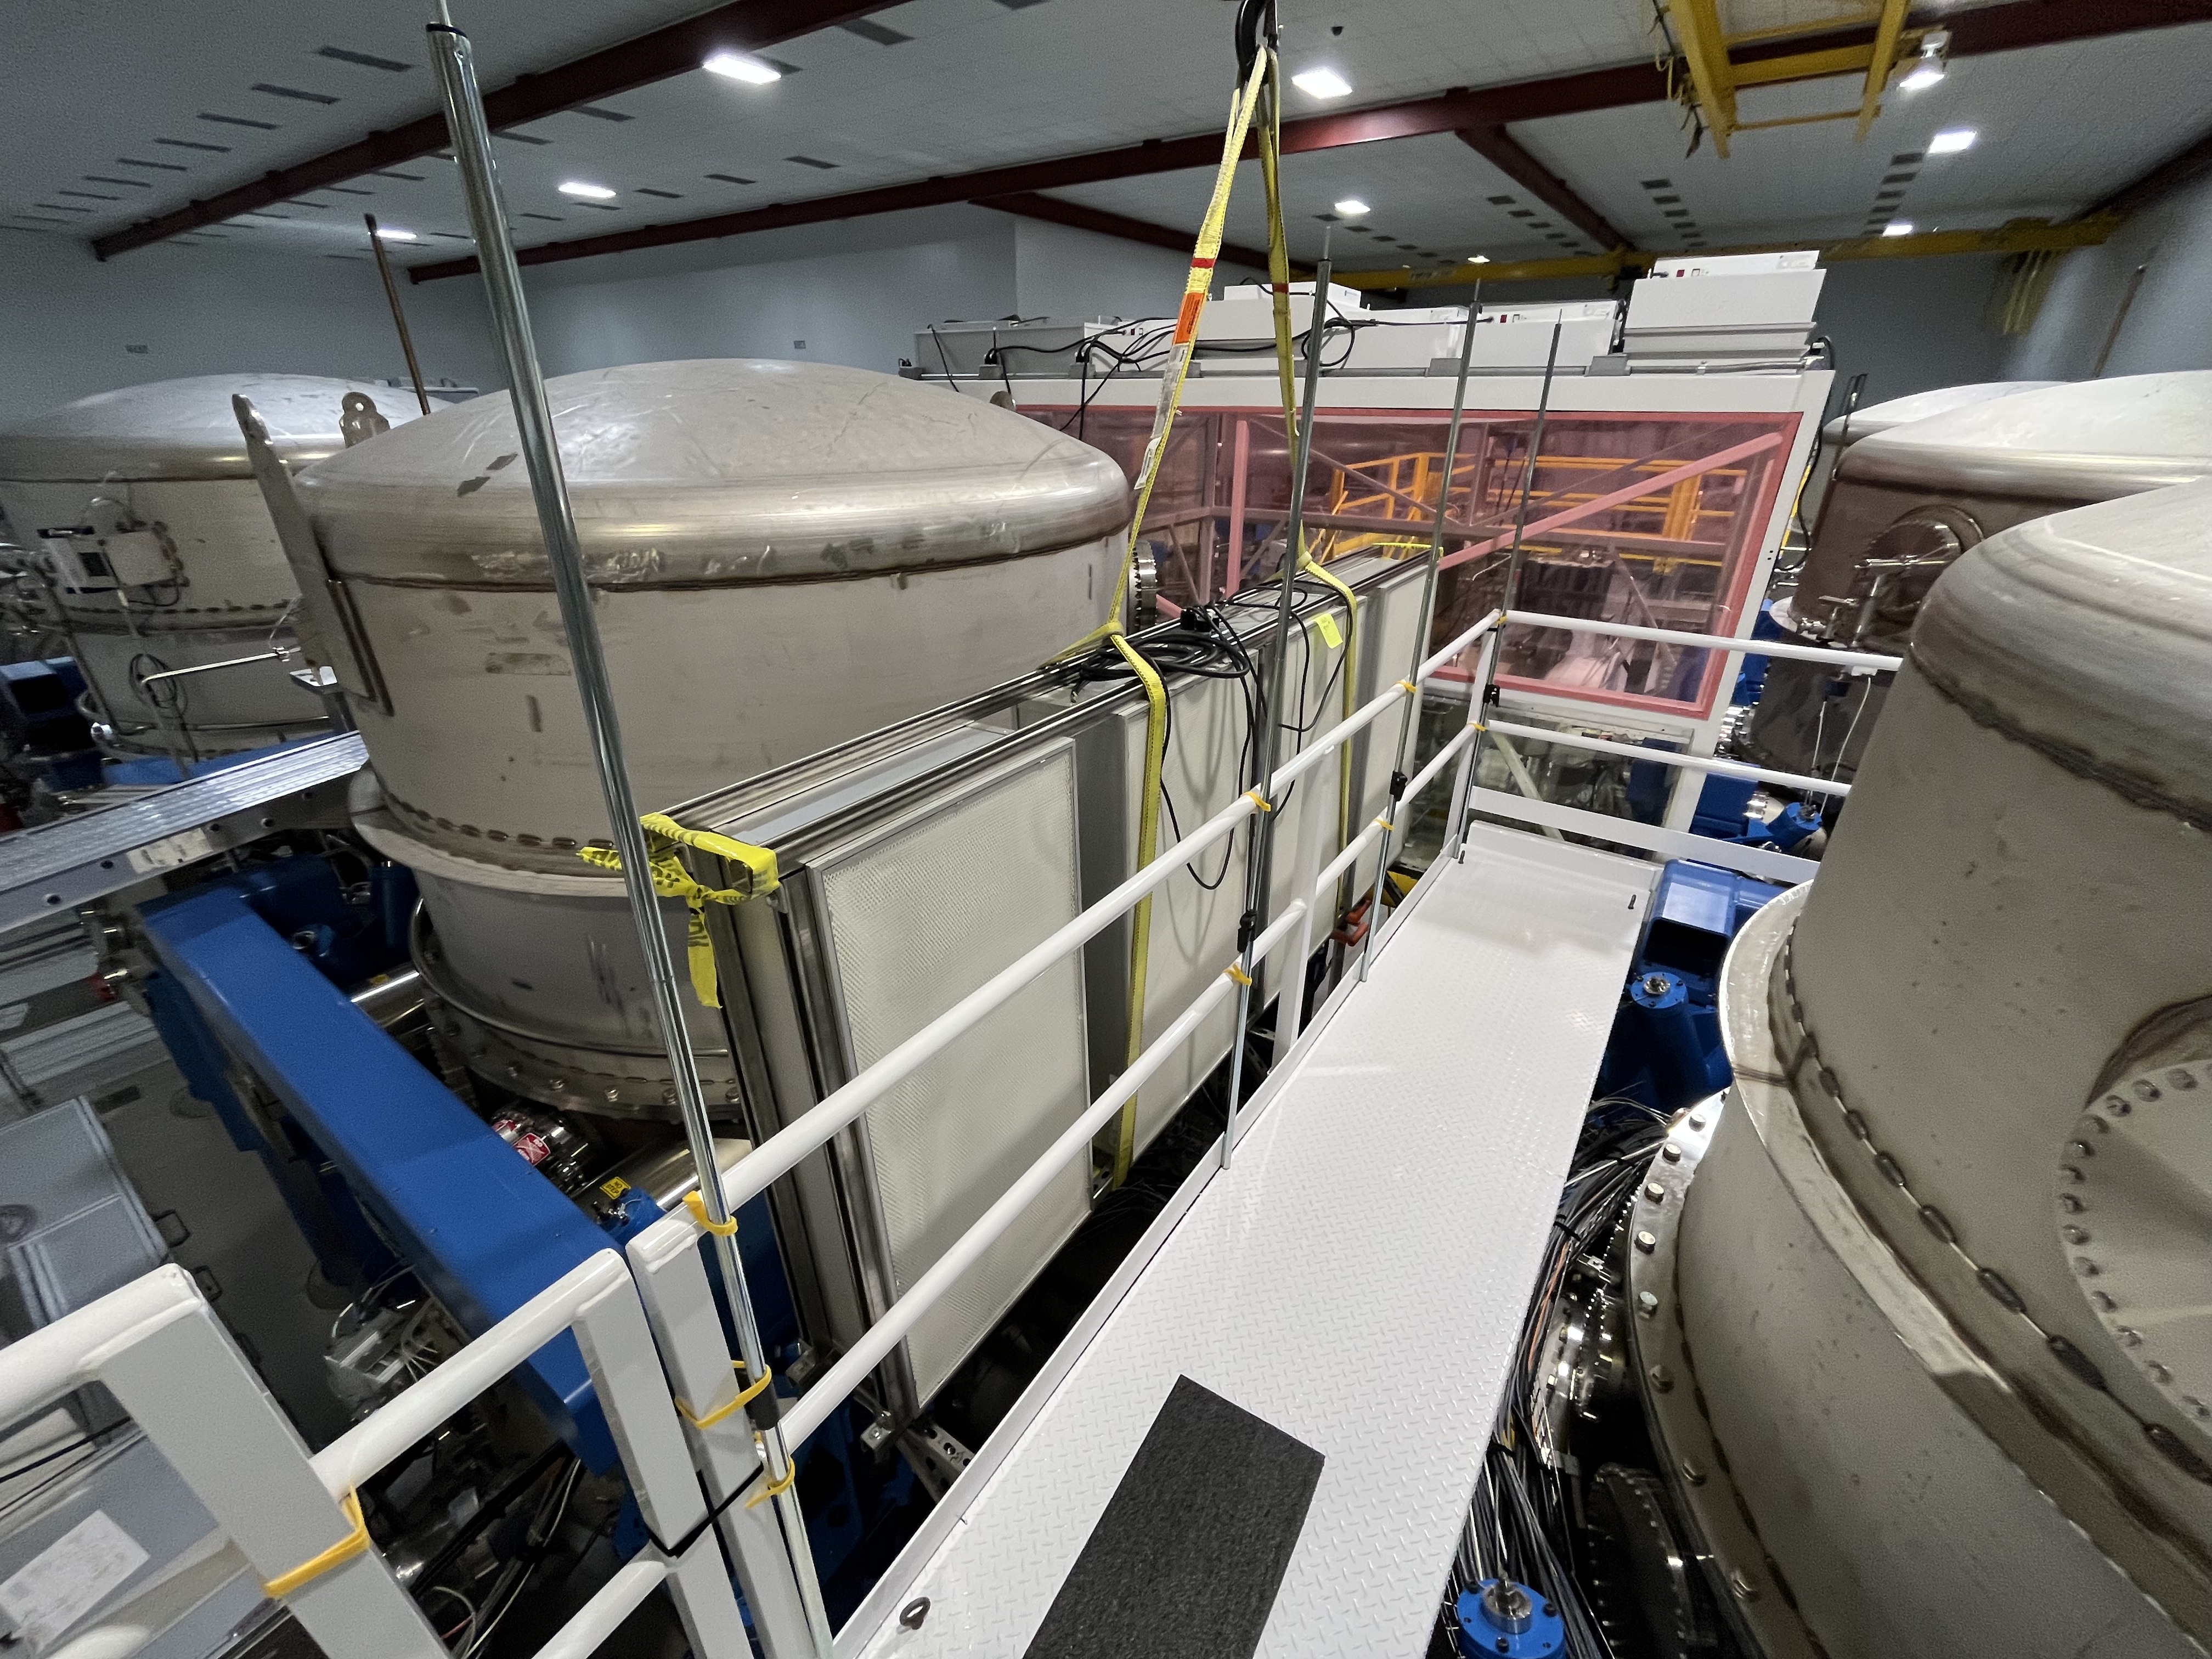
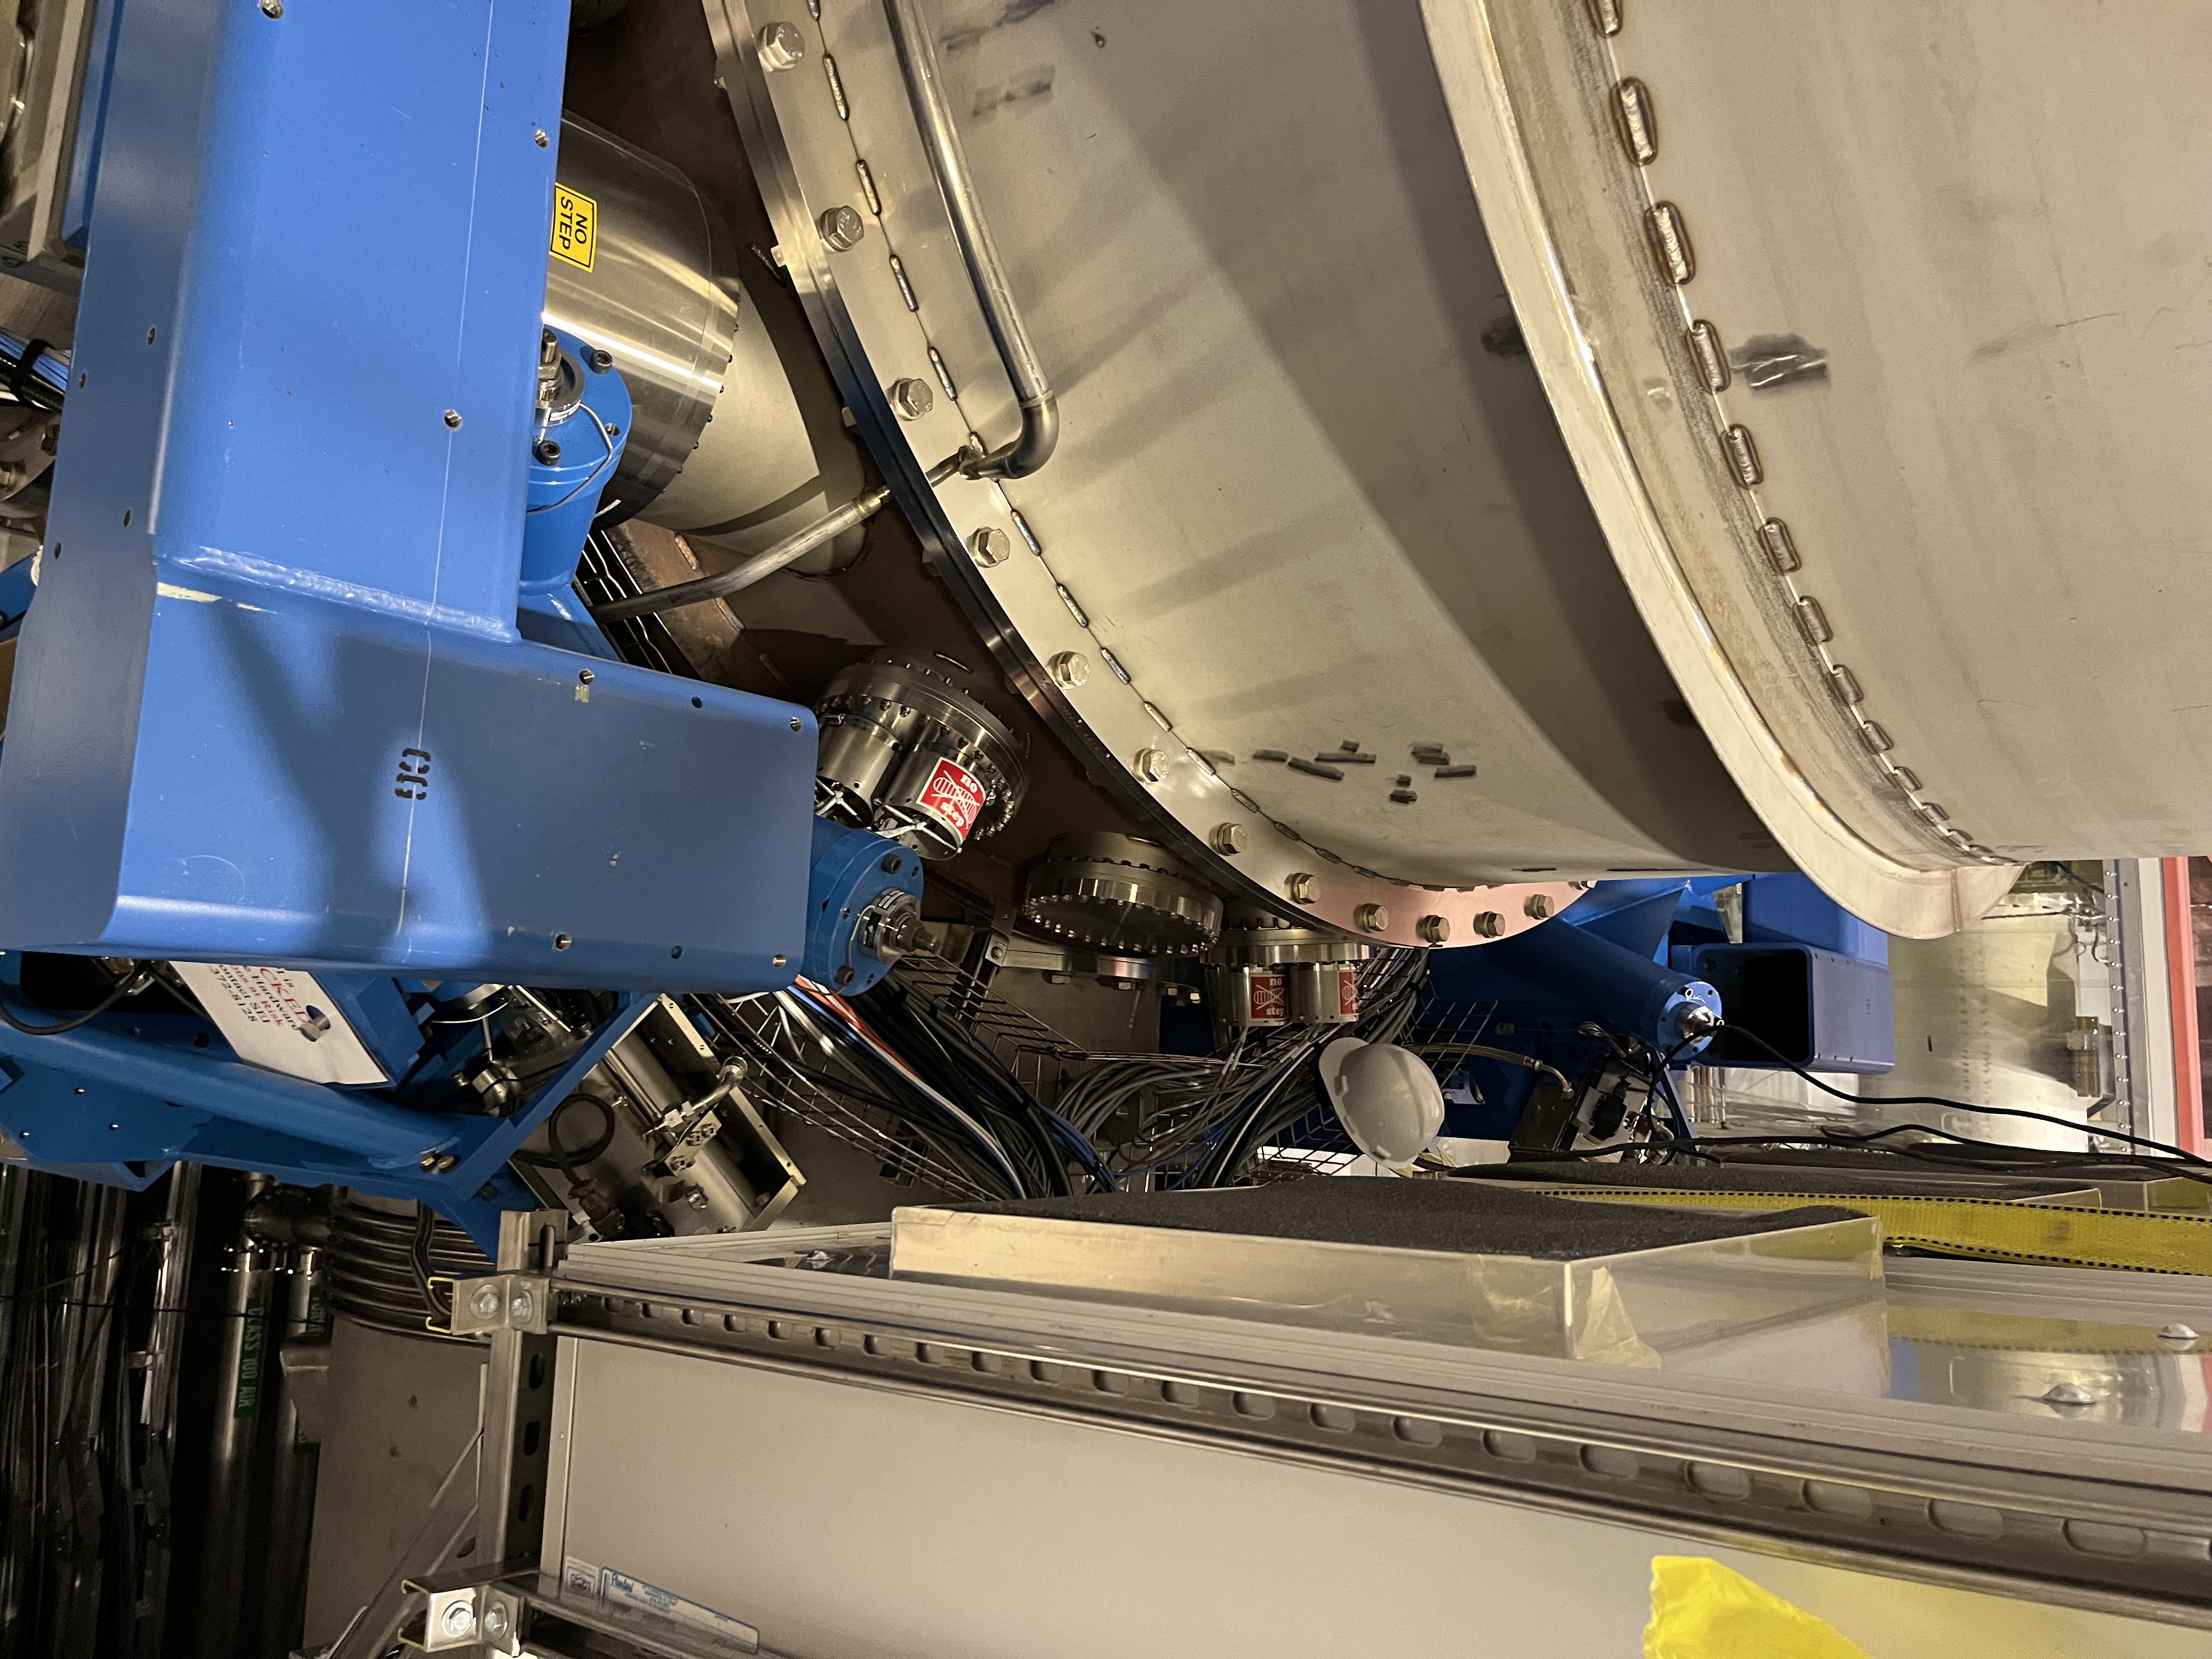
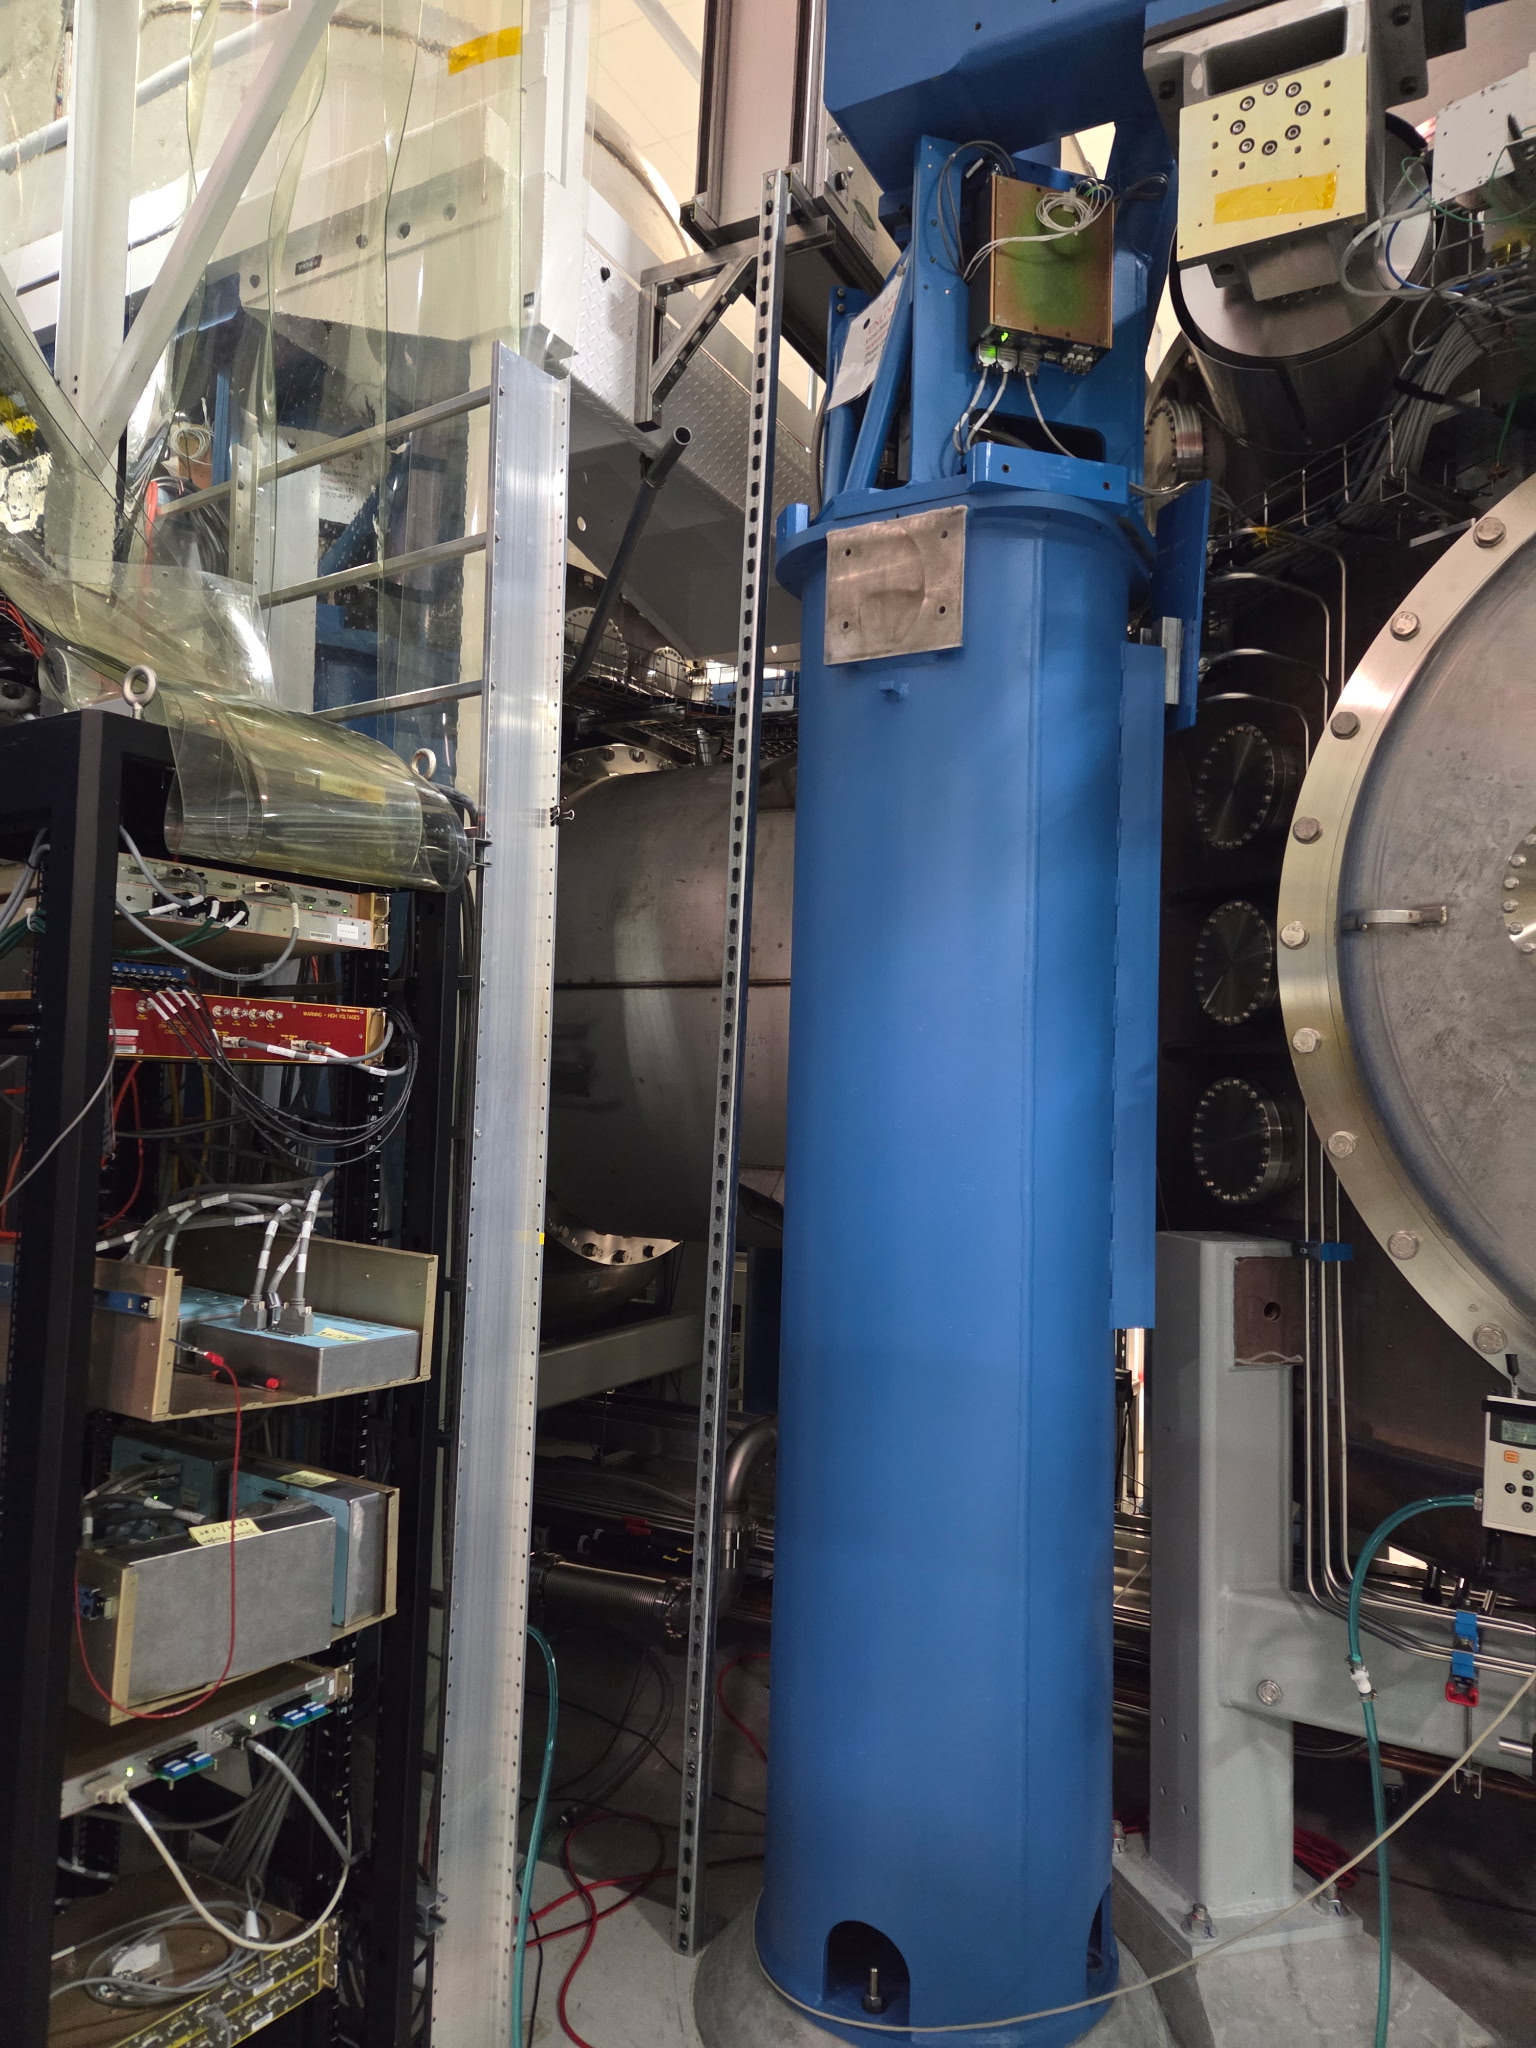
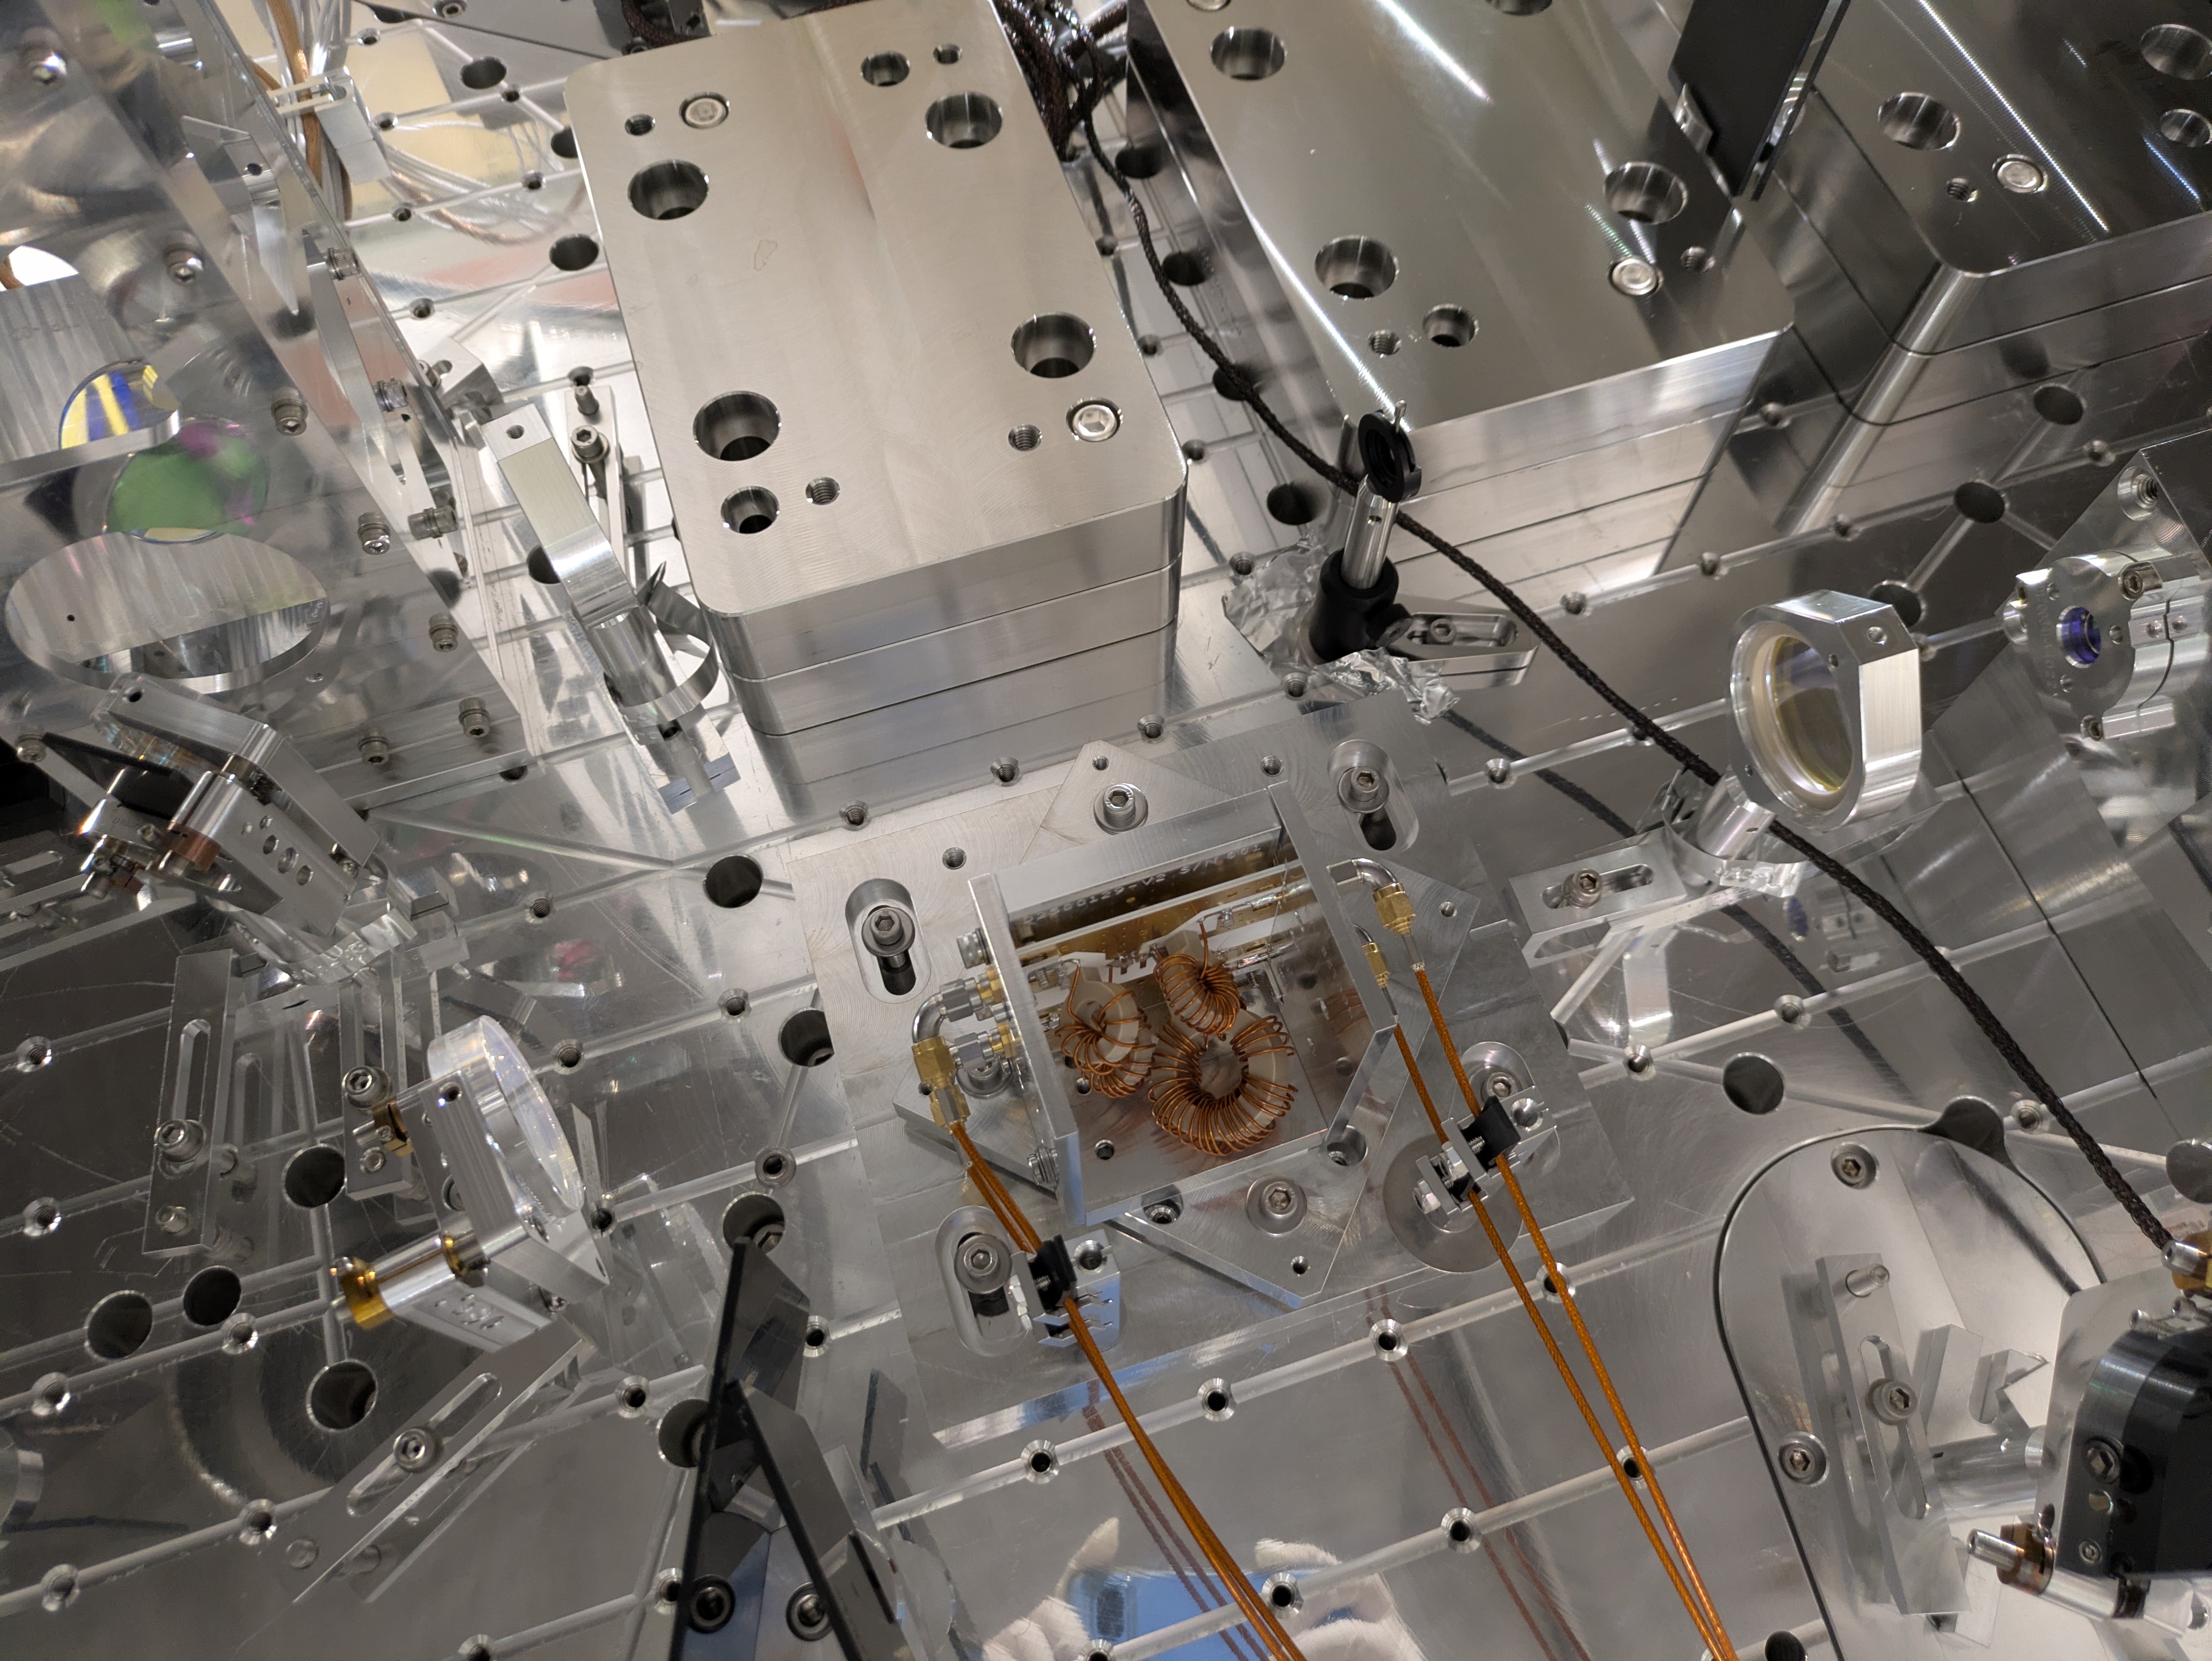
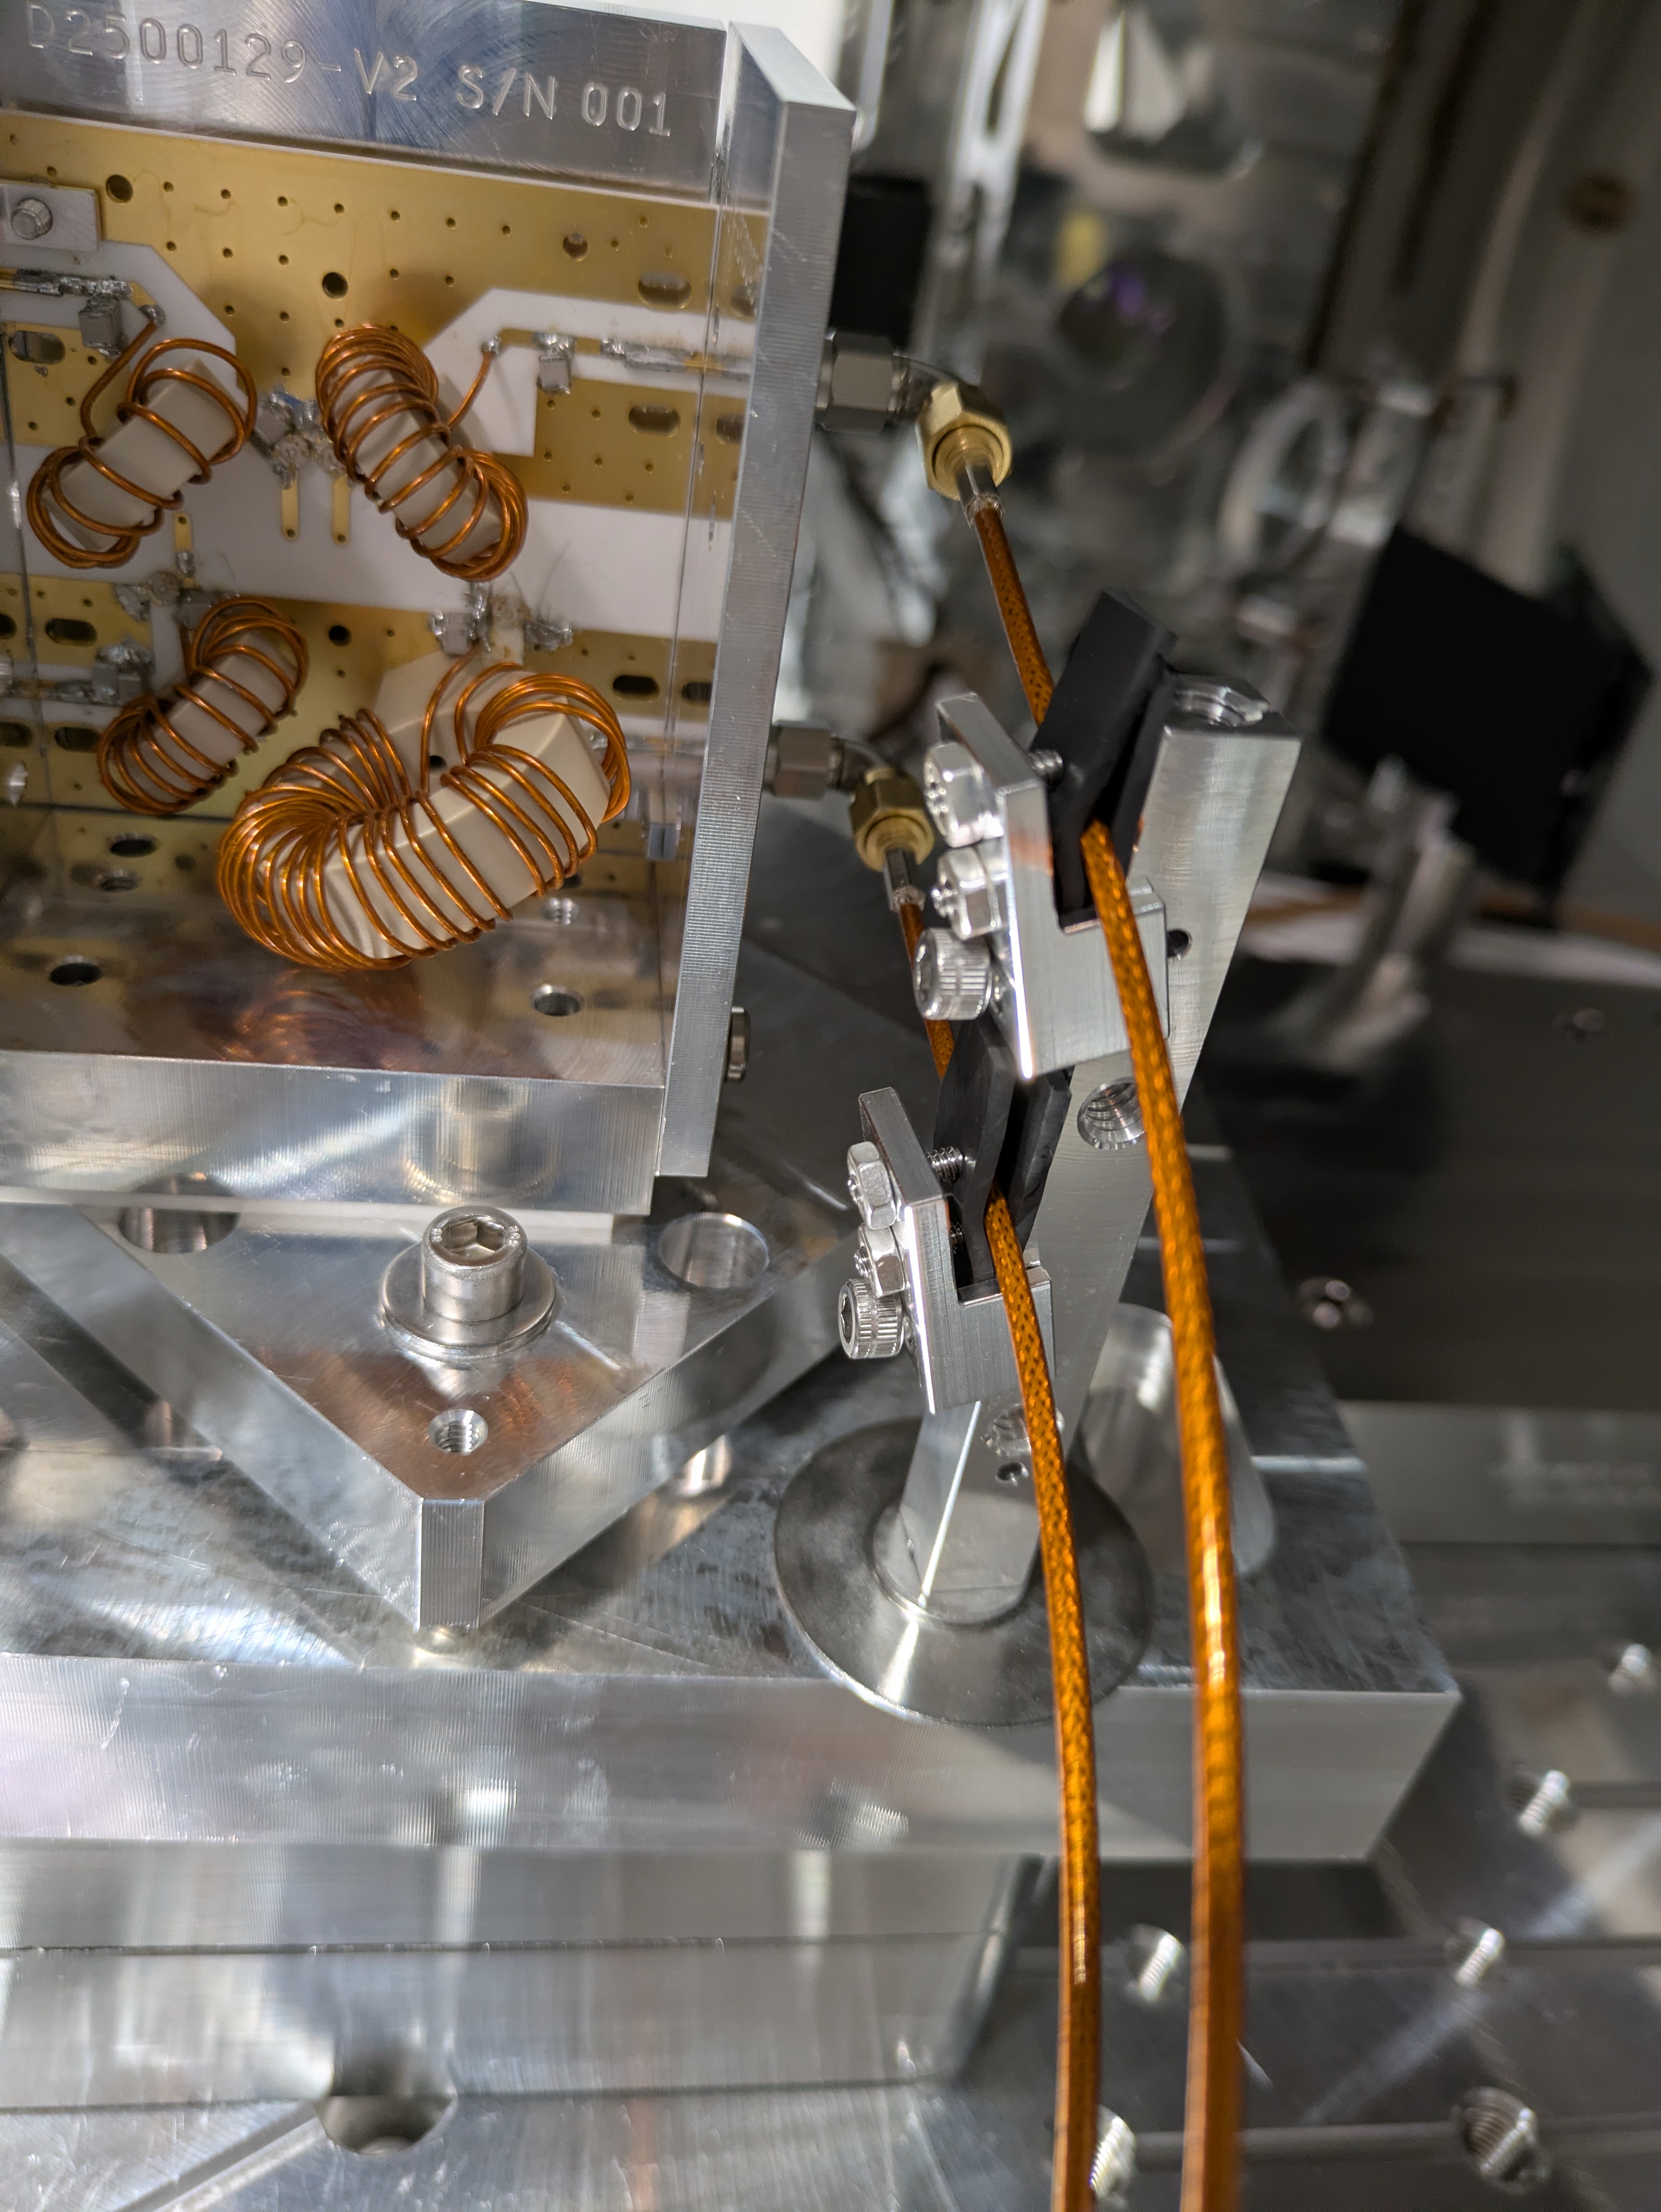
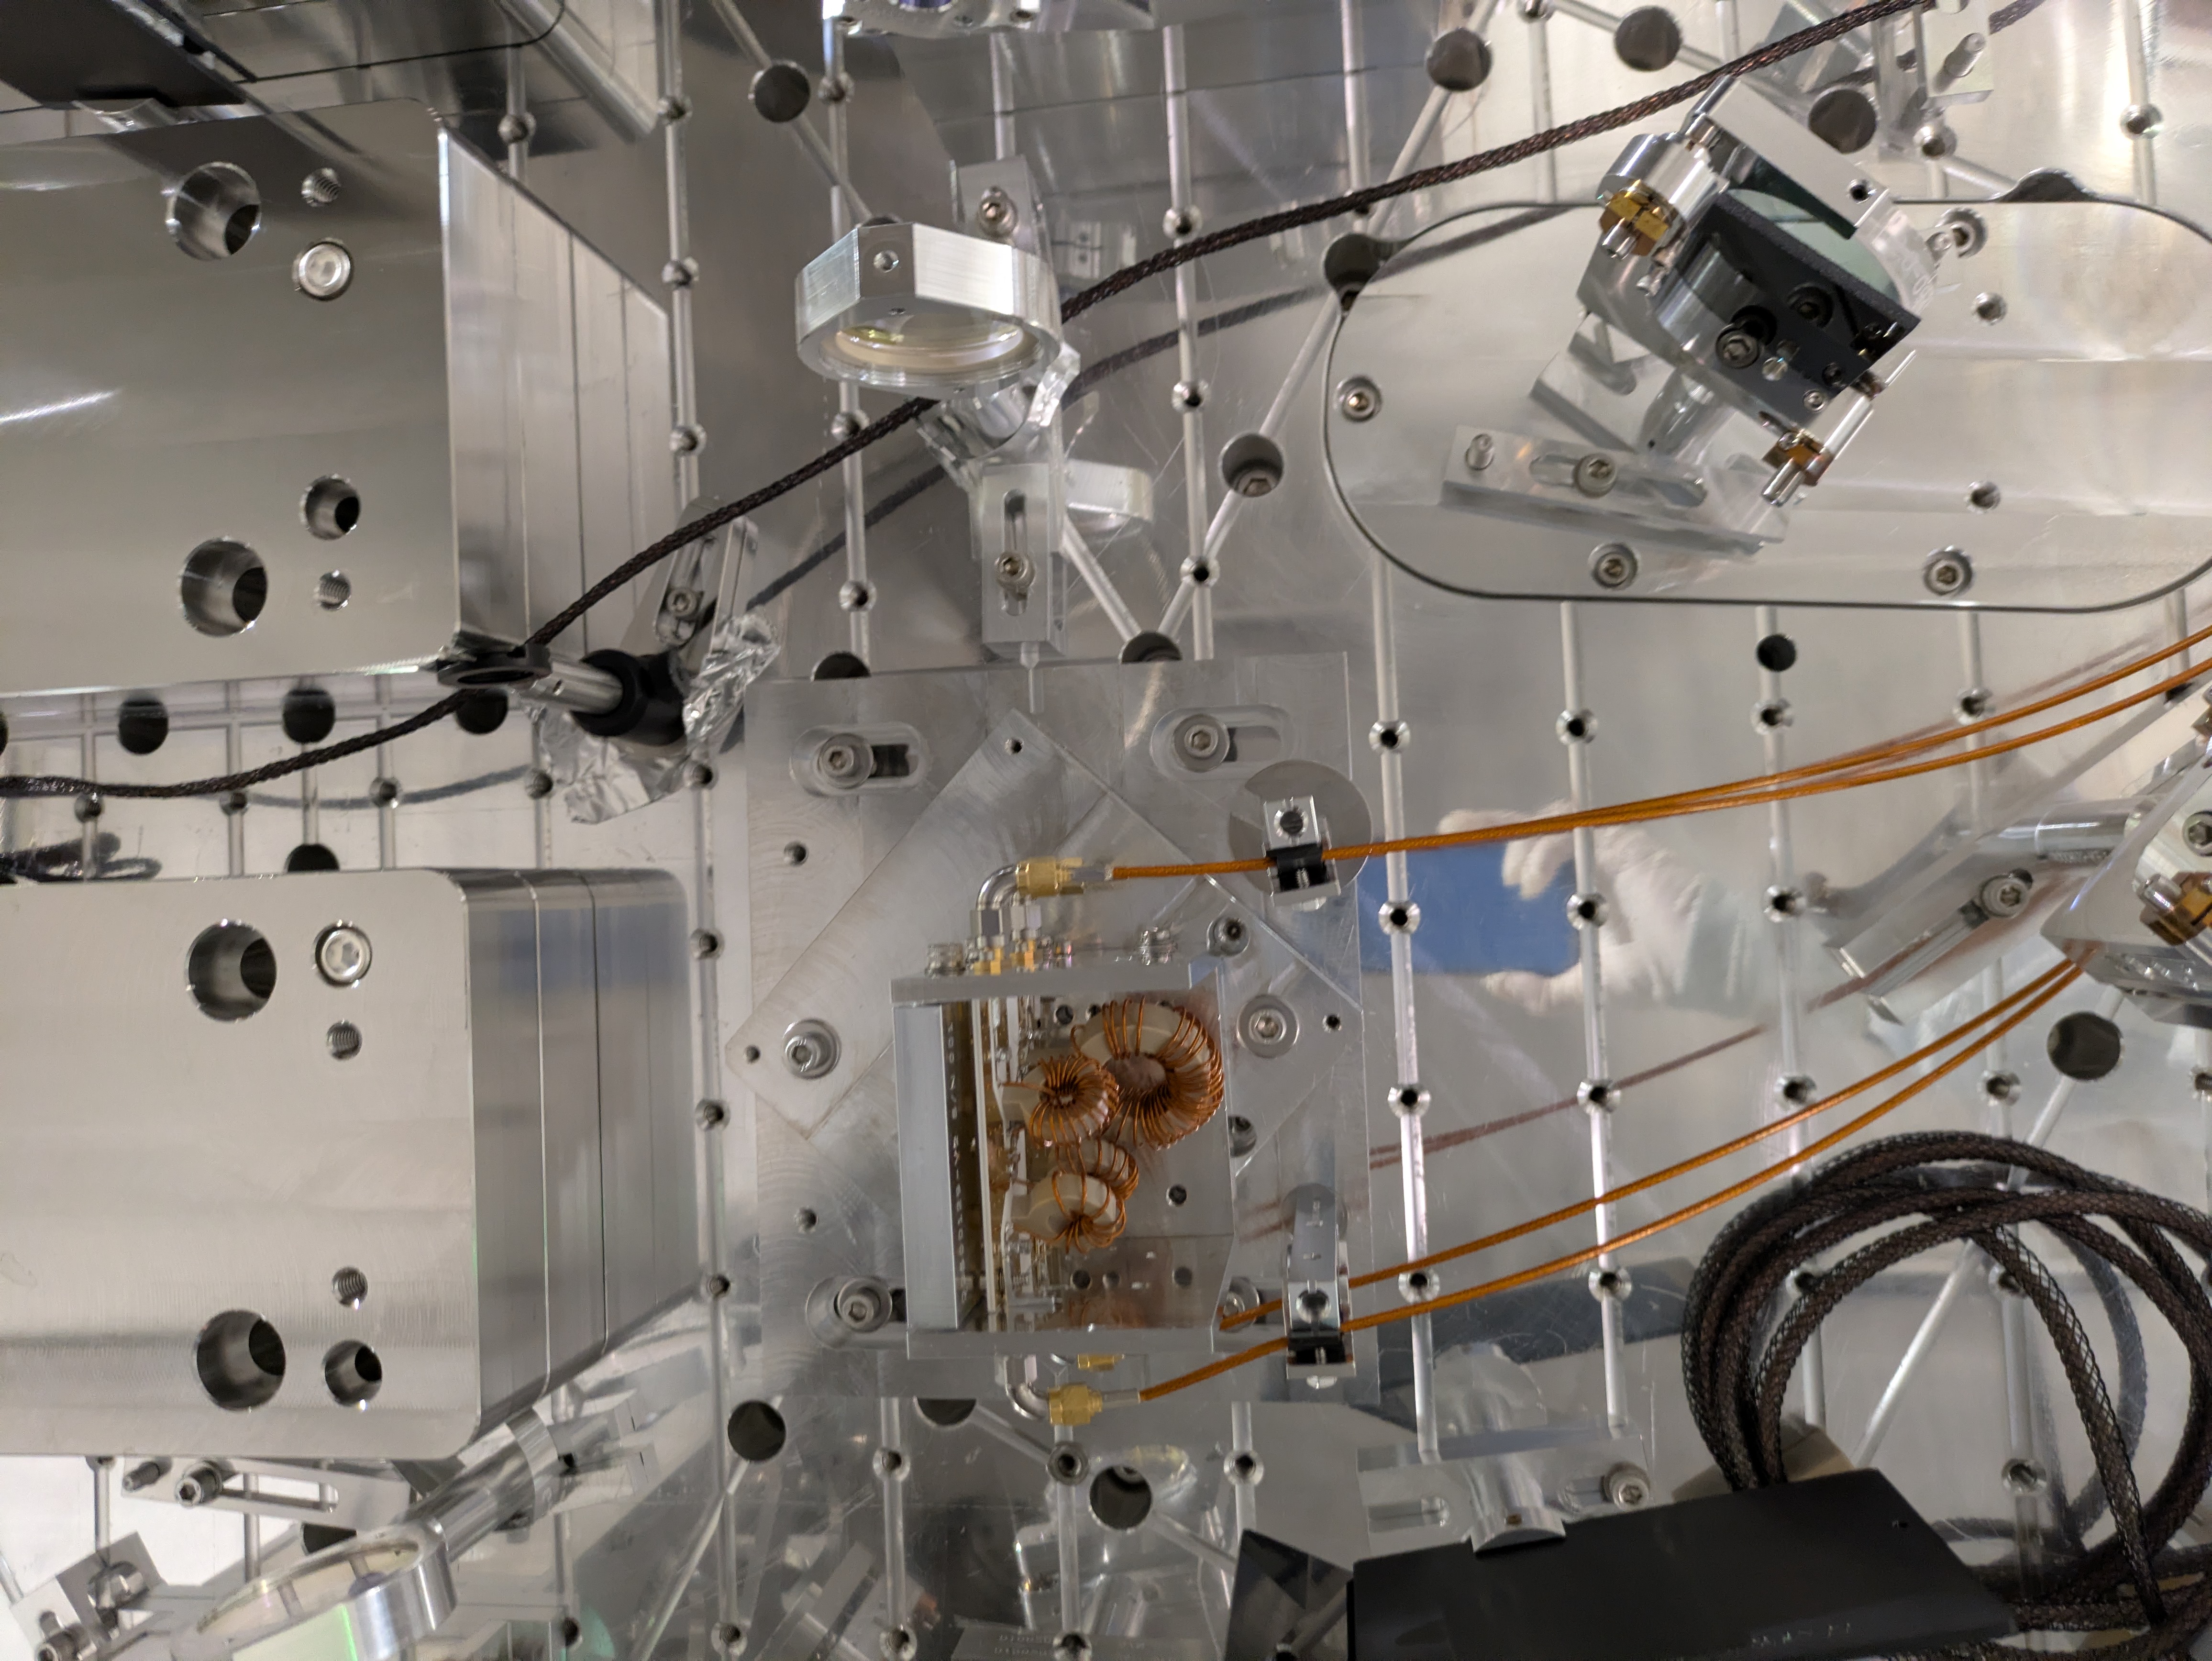
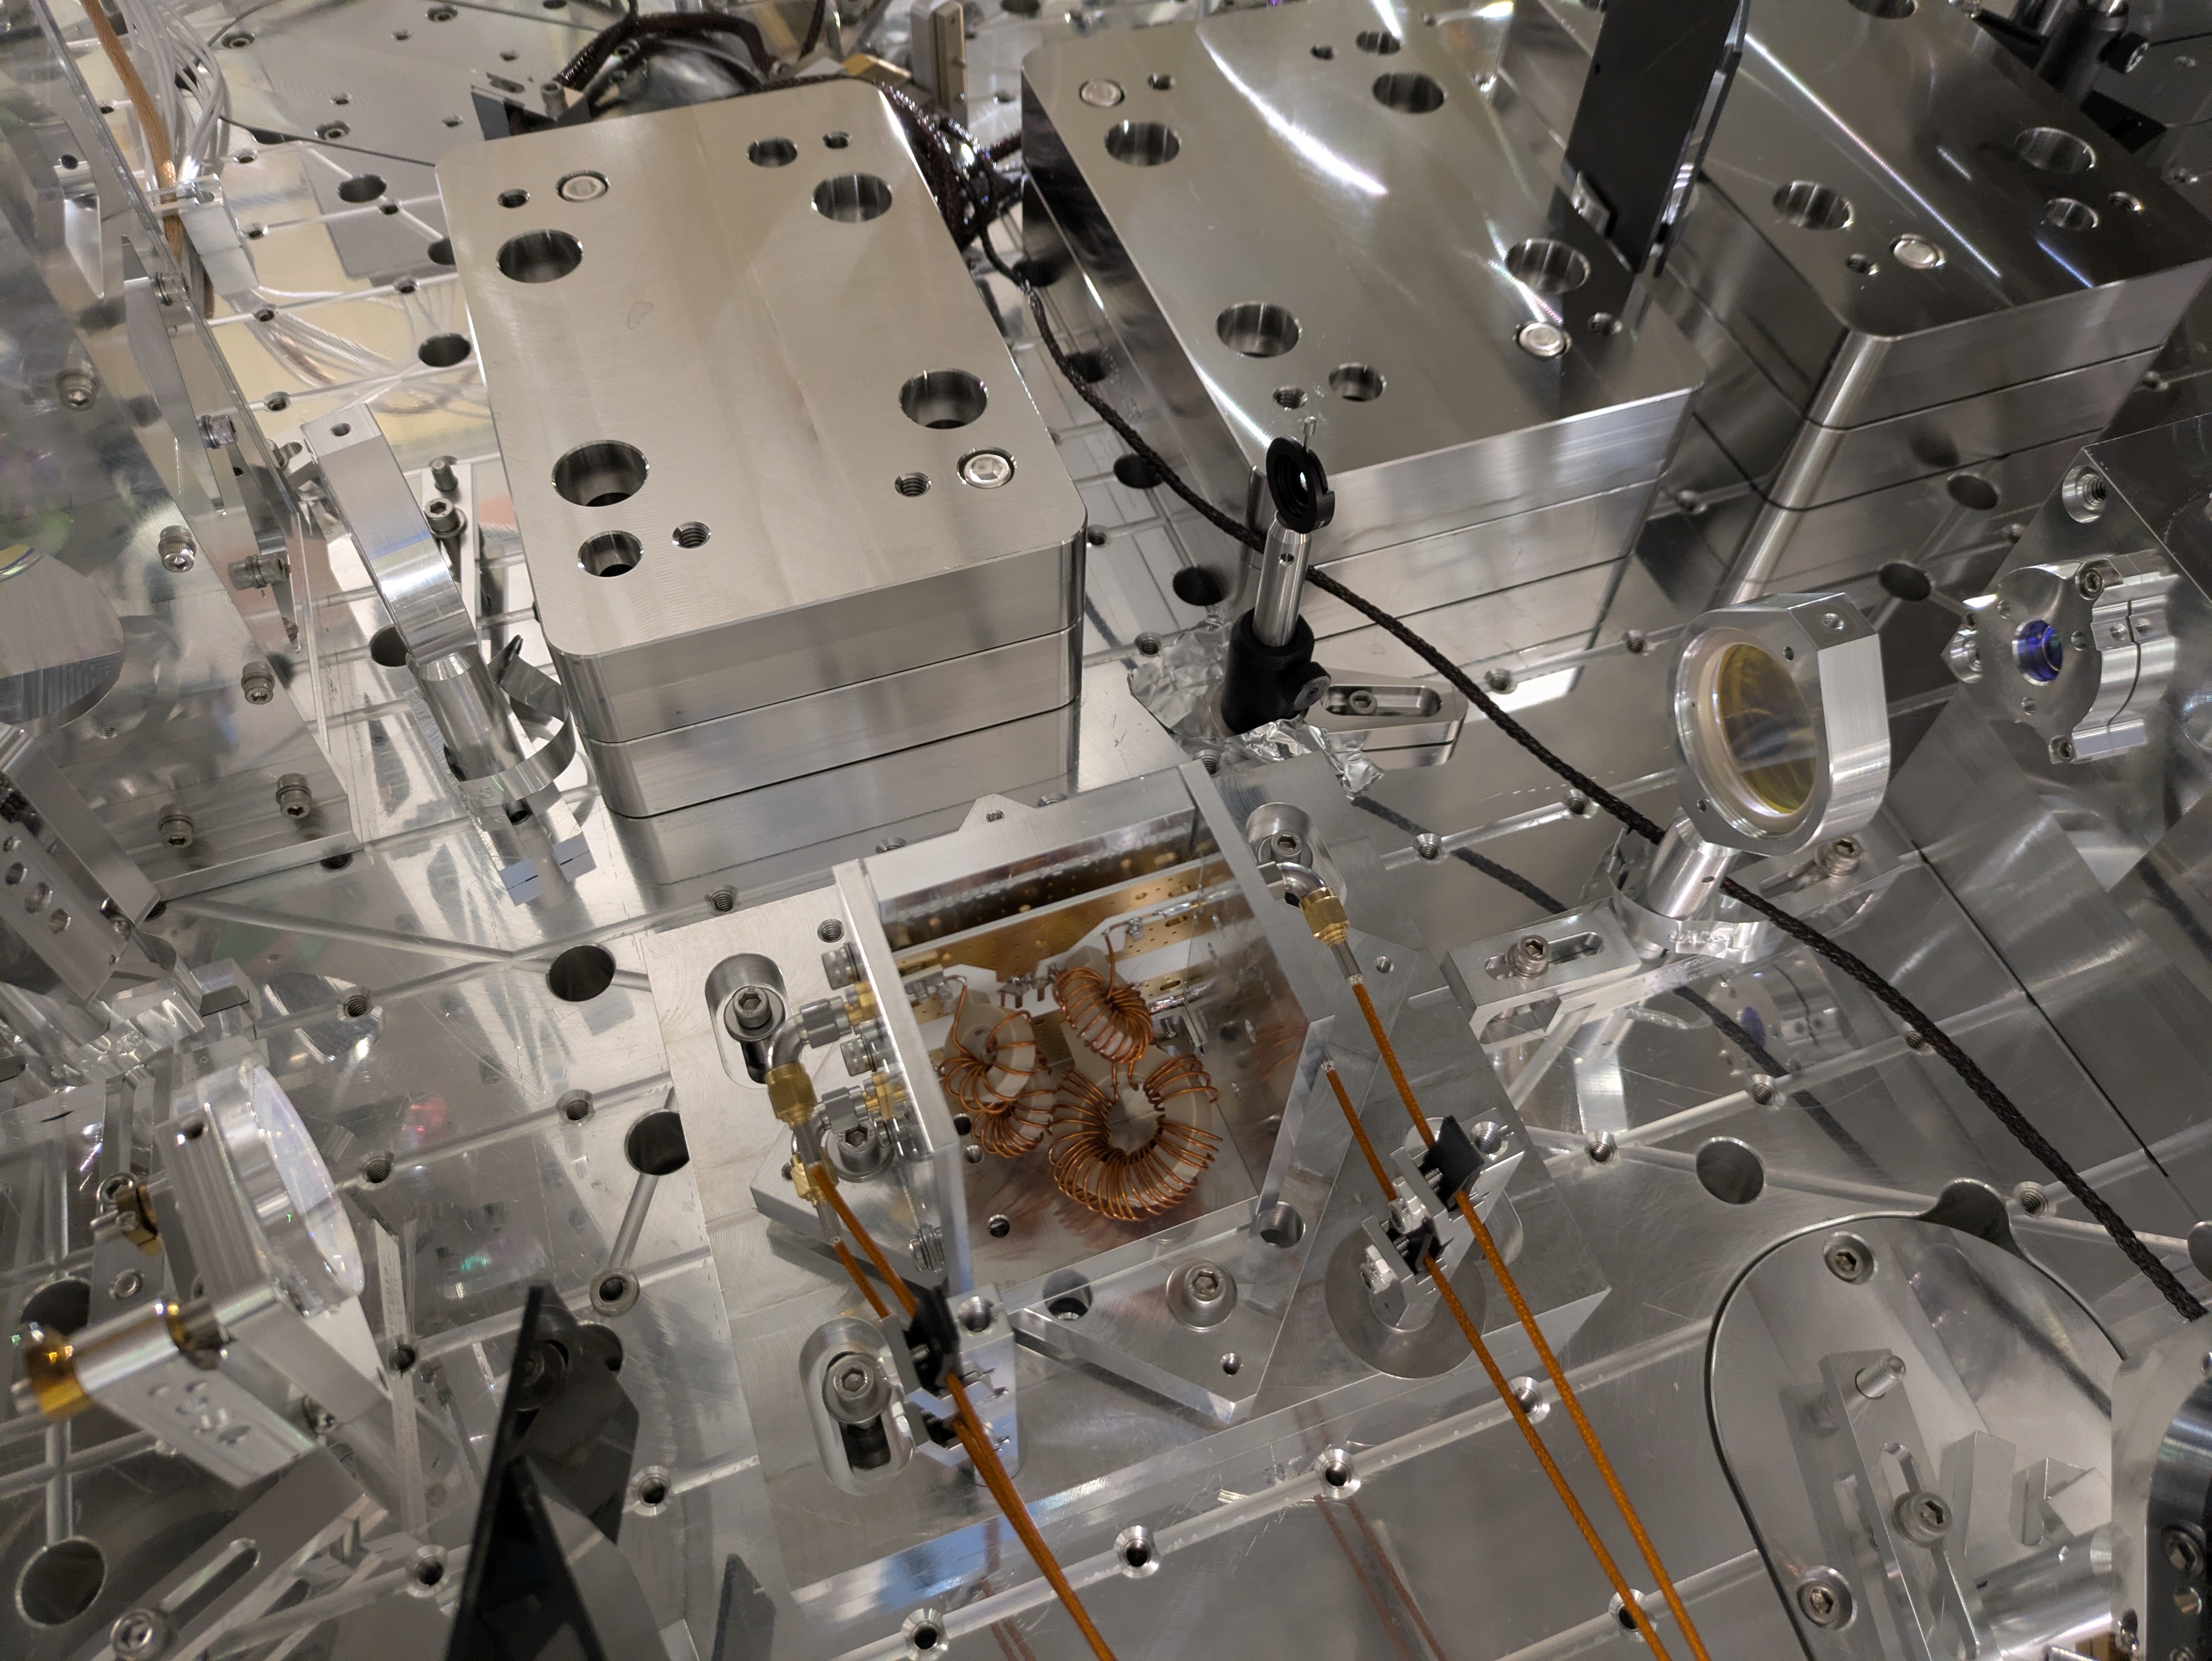
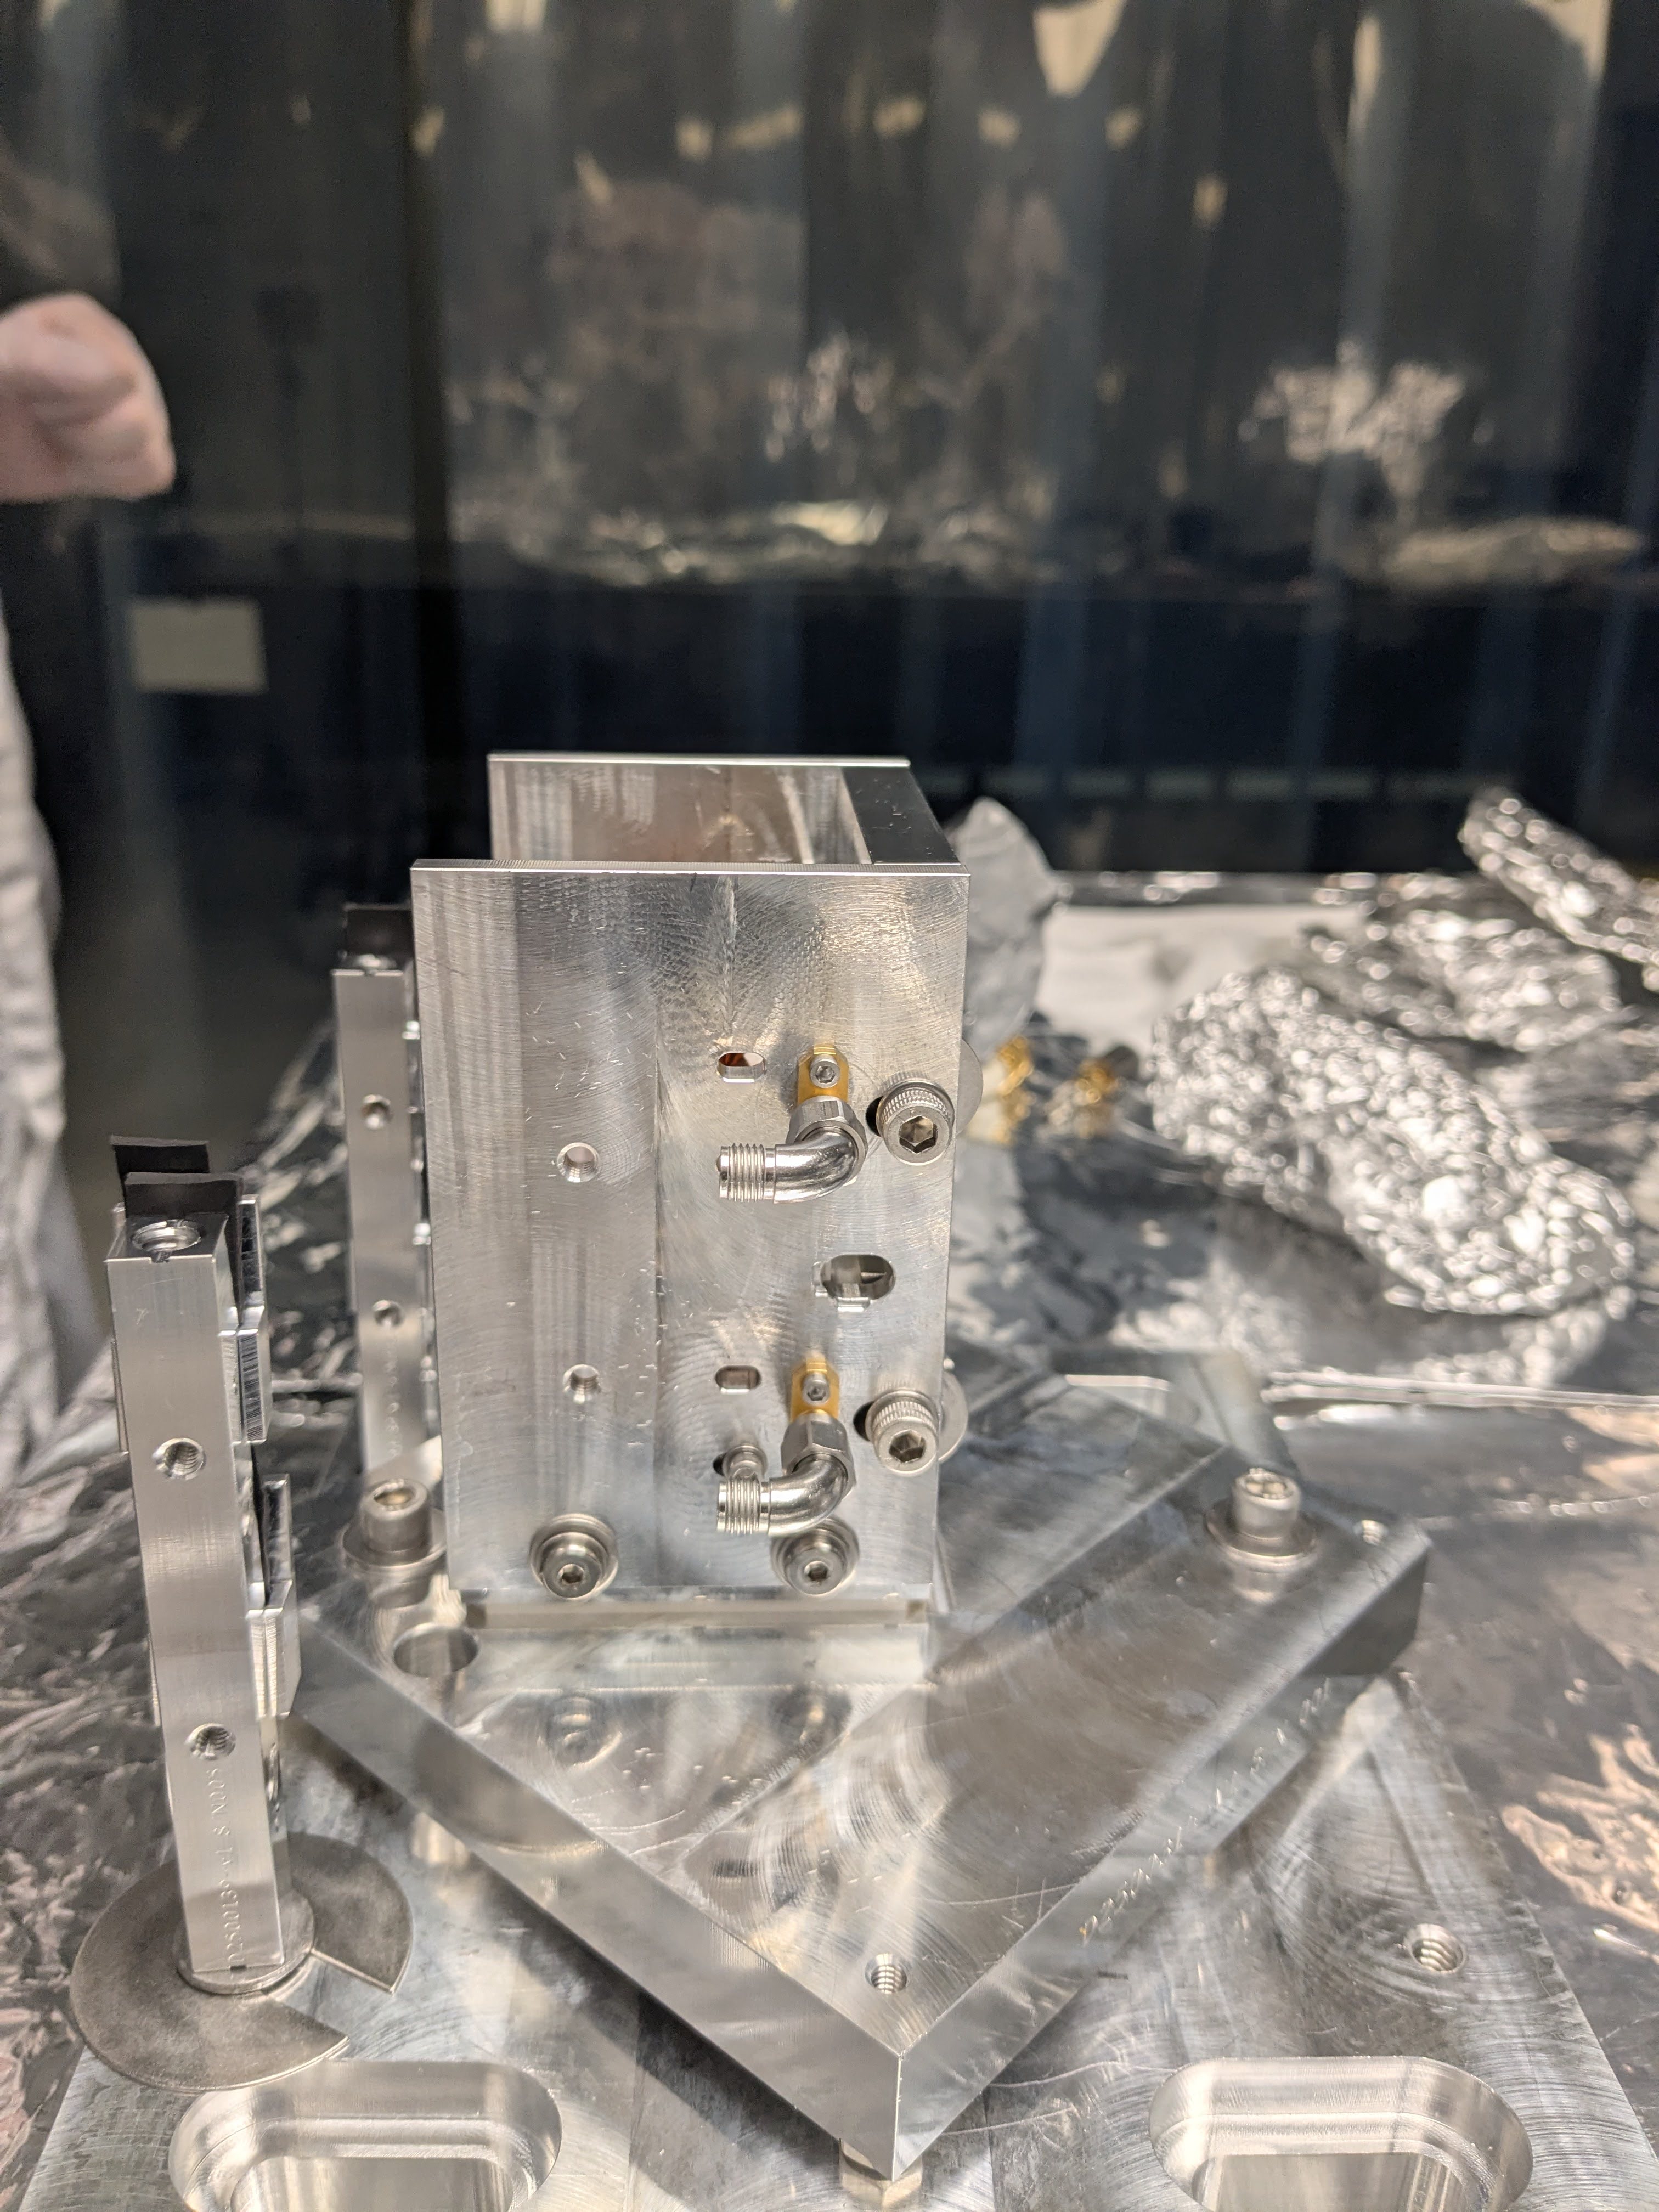
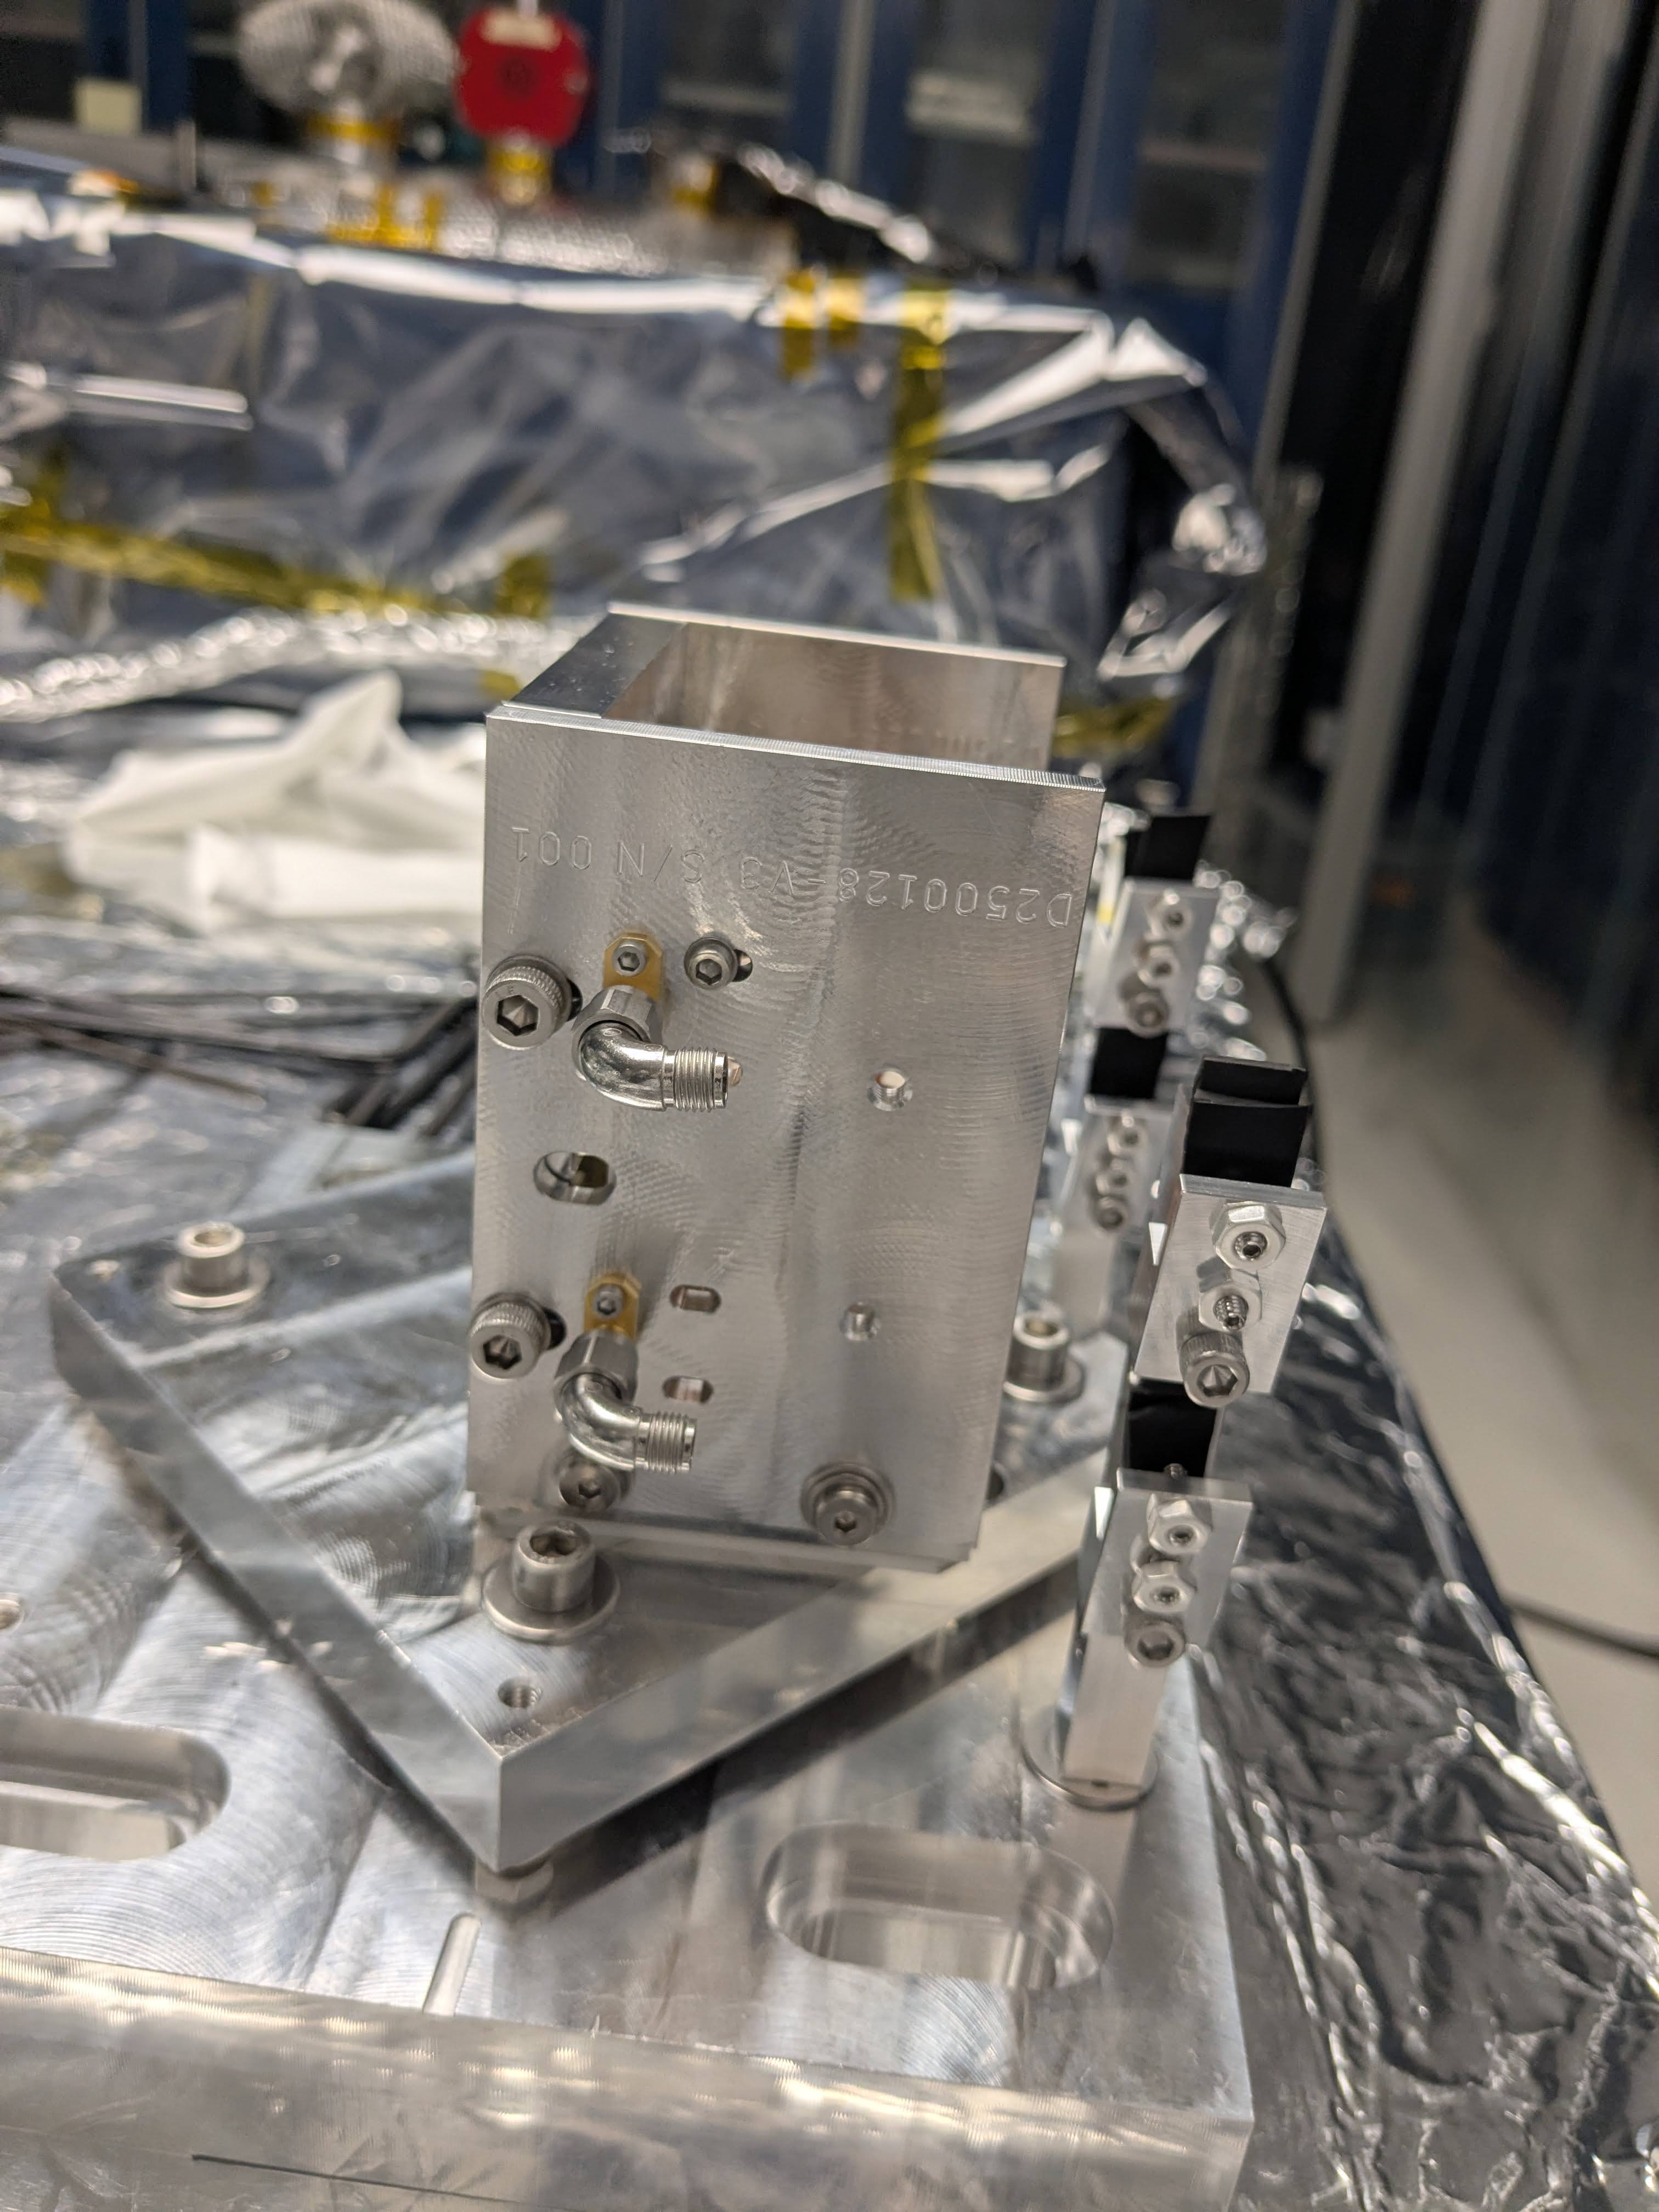
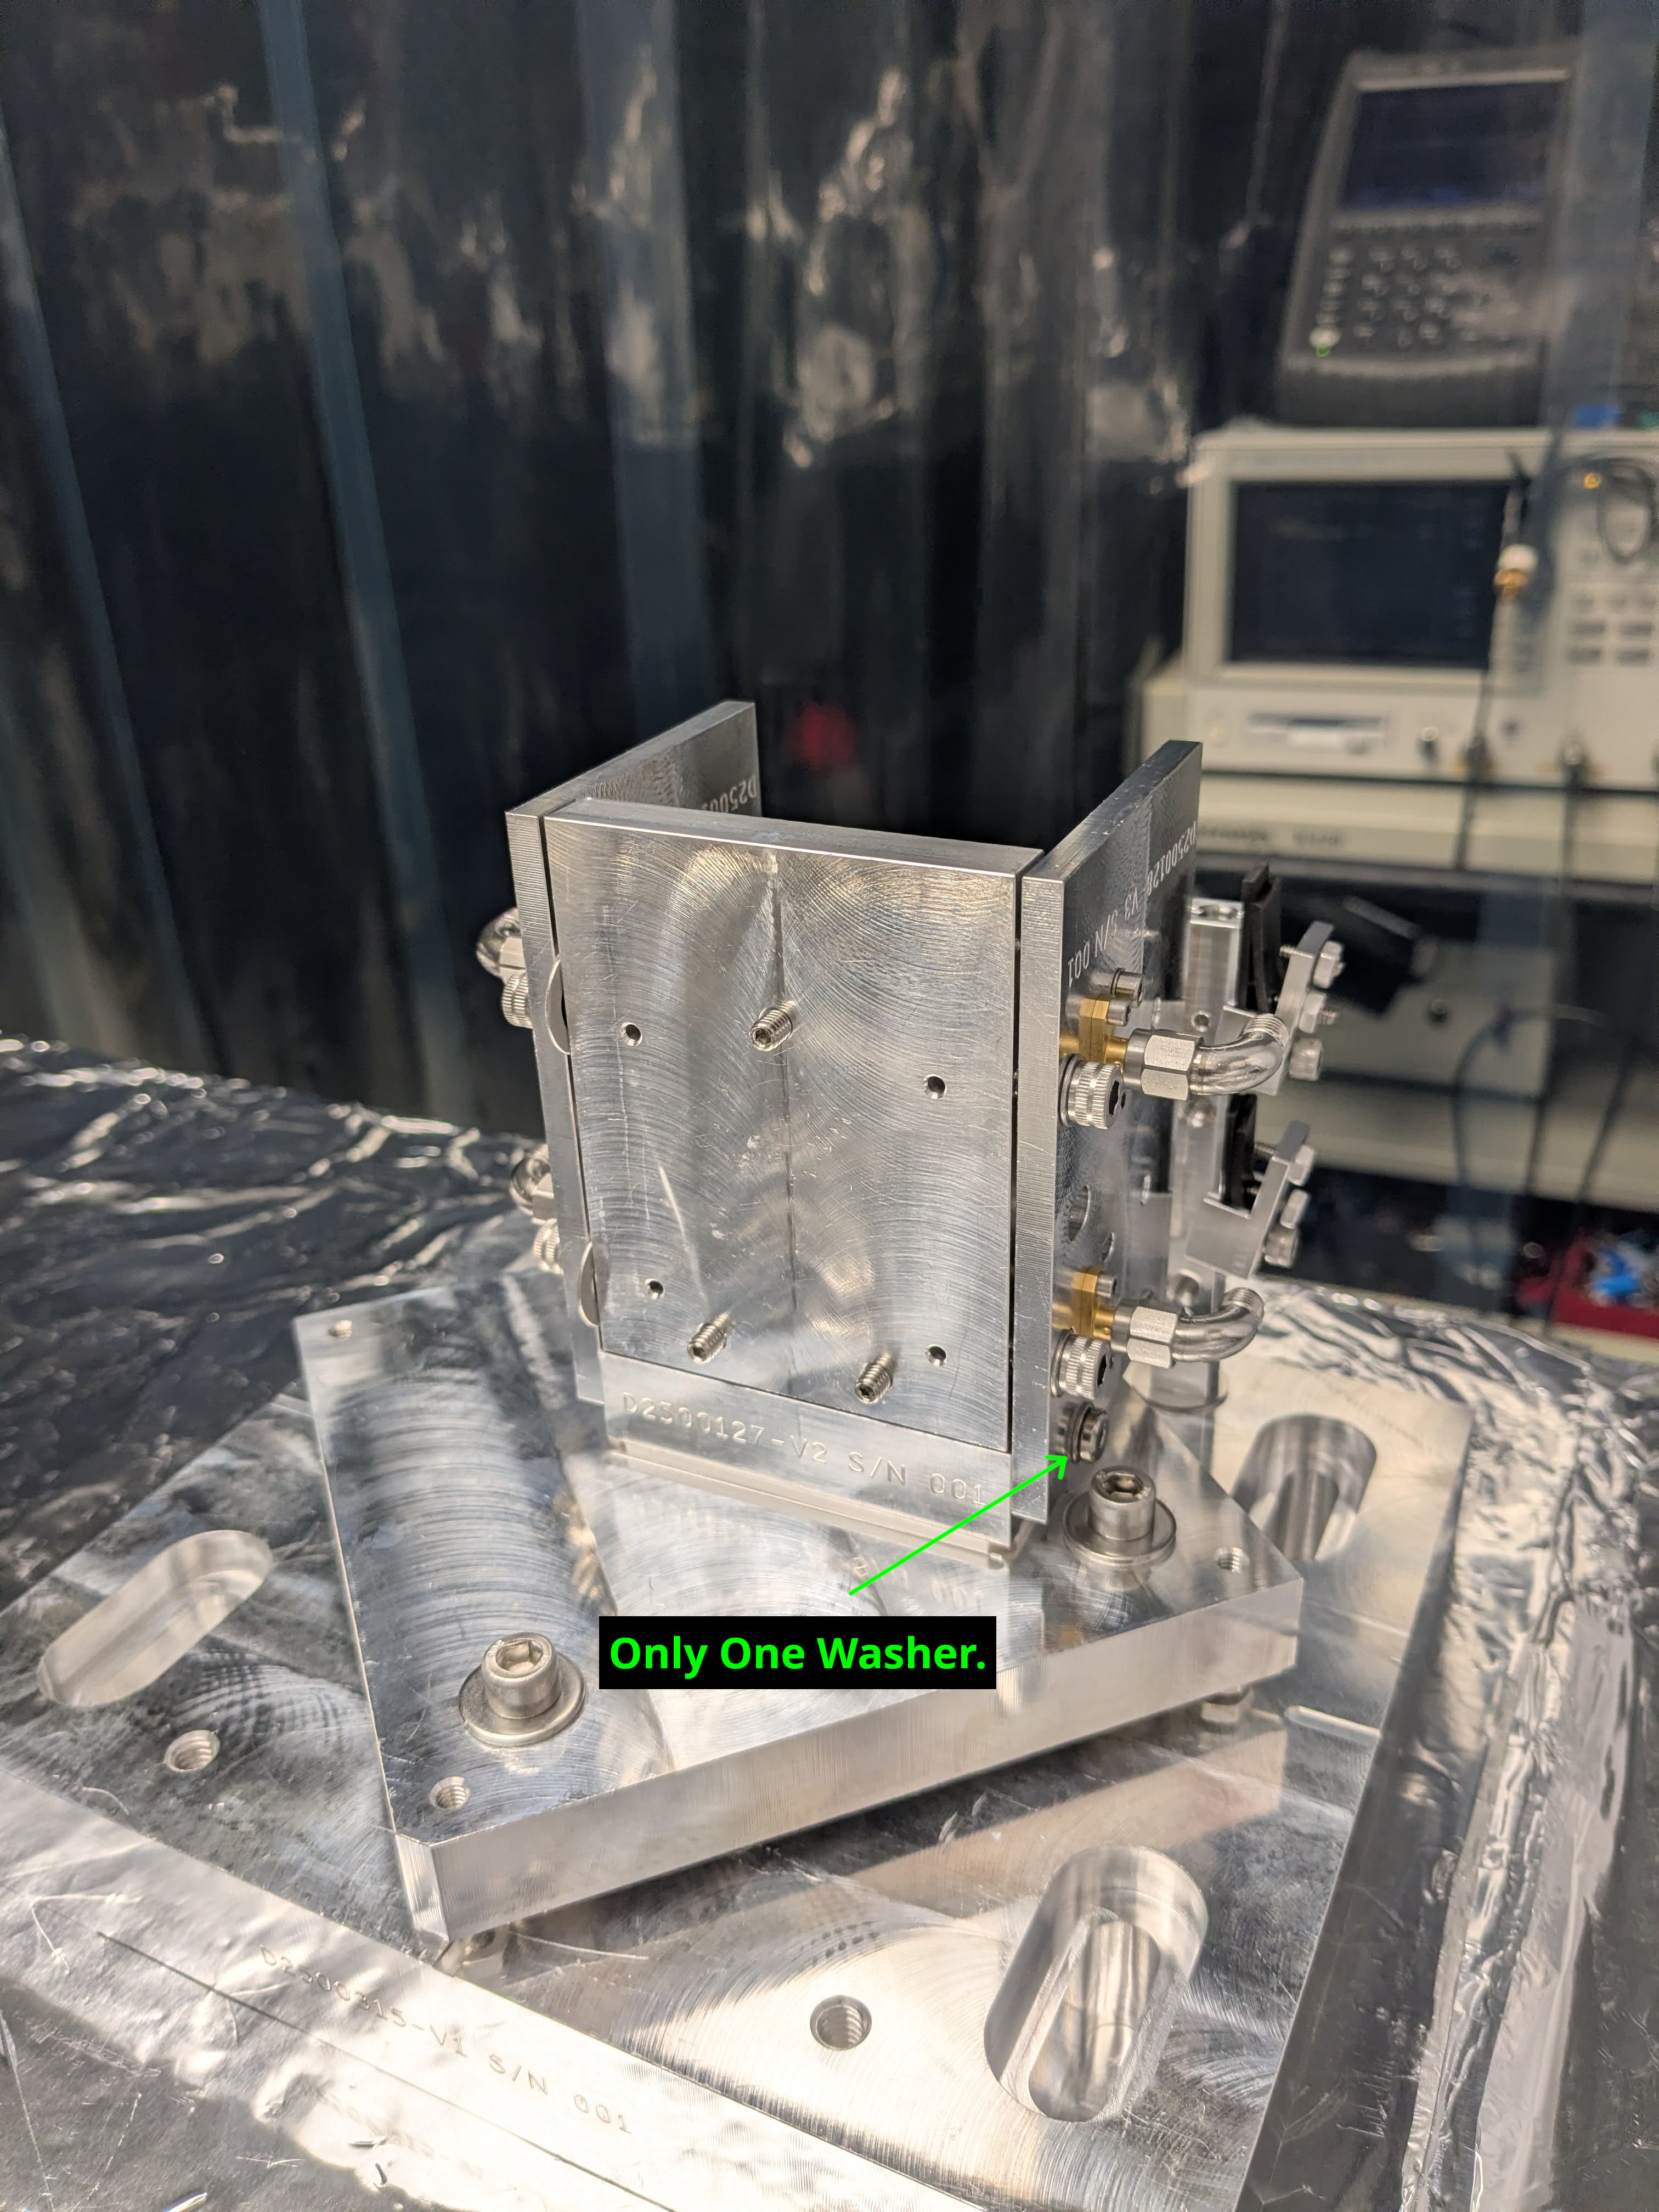
Following pictures show the fully assembled unit from the back (+Y), input (-X), output (+X) and front (-Y). In front.jpg, note that I'm only using one washer for the low profile 10-32 socket head cap screw. I used to use two, but the screw still stuck out just enough to make things tedious and inconvenient when lowering the pivot plate over the pivot base. Though the screw is 0.5" long and not the initially specified 10-32 x 0.375", with one washer it seems to work.
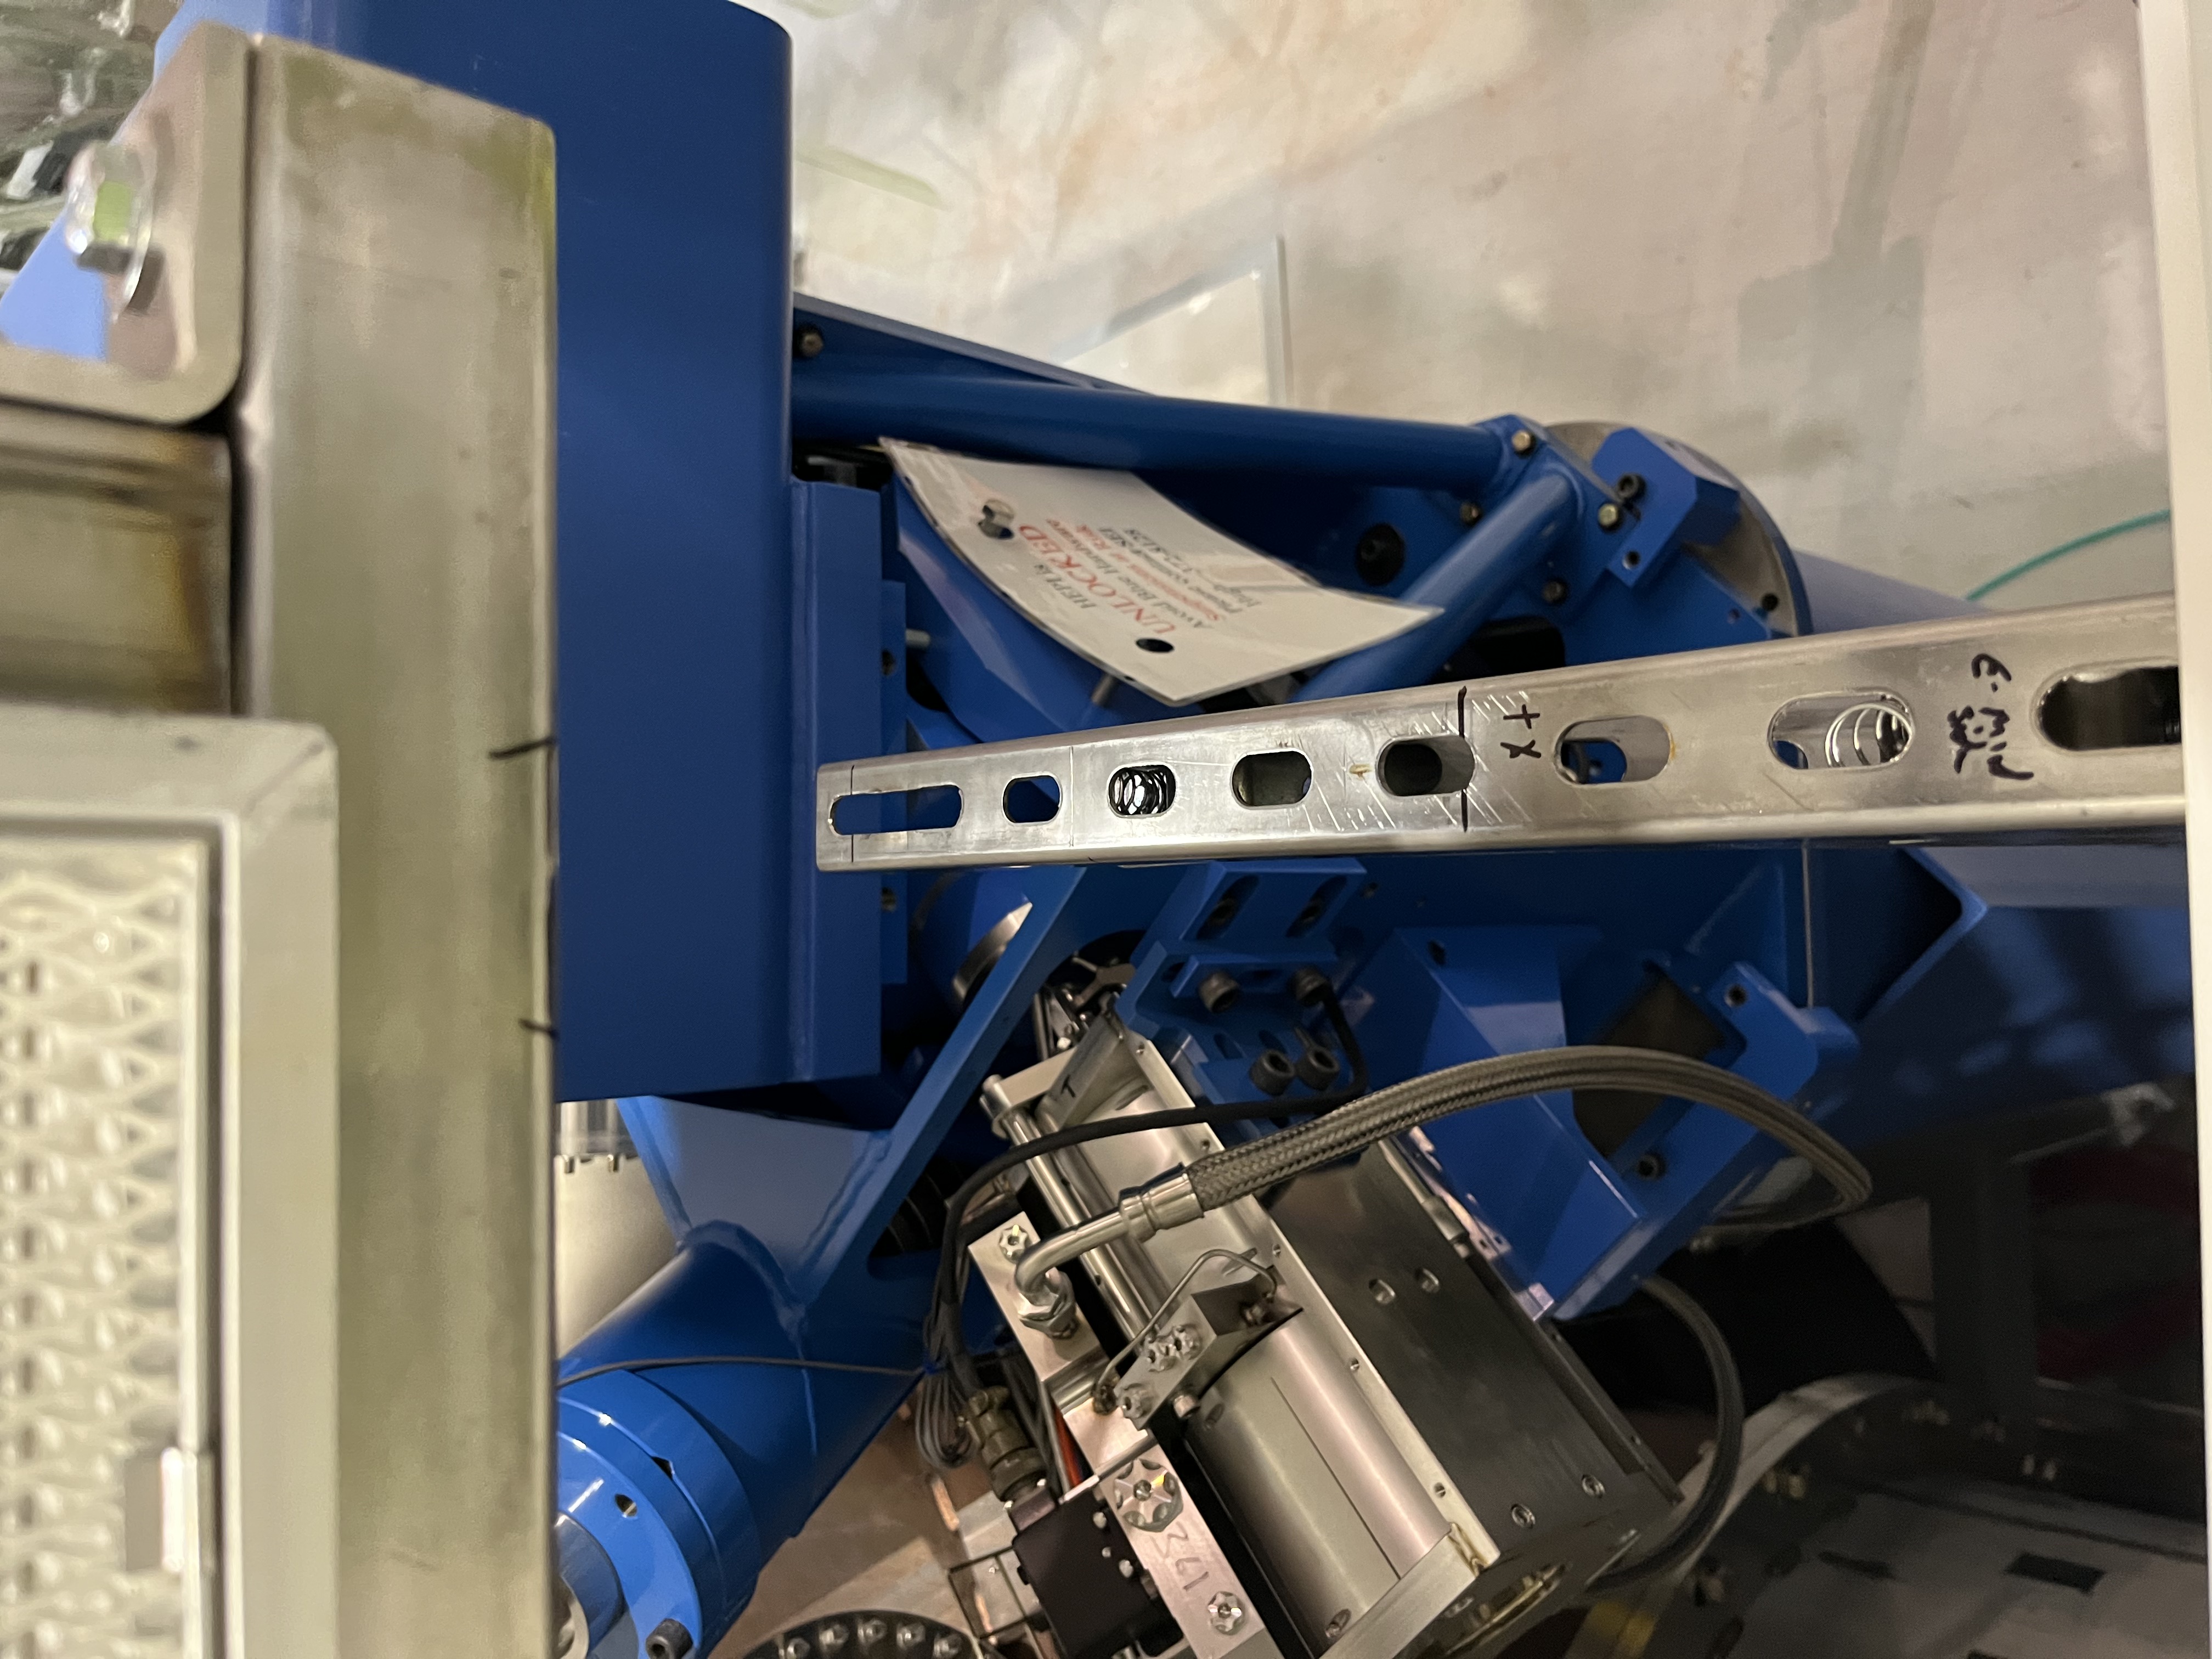
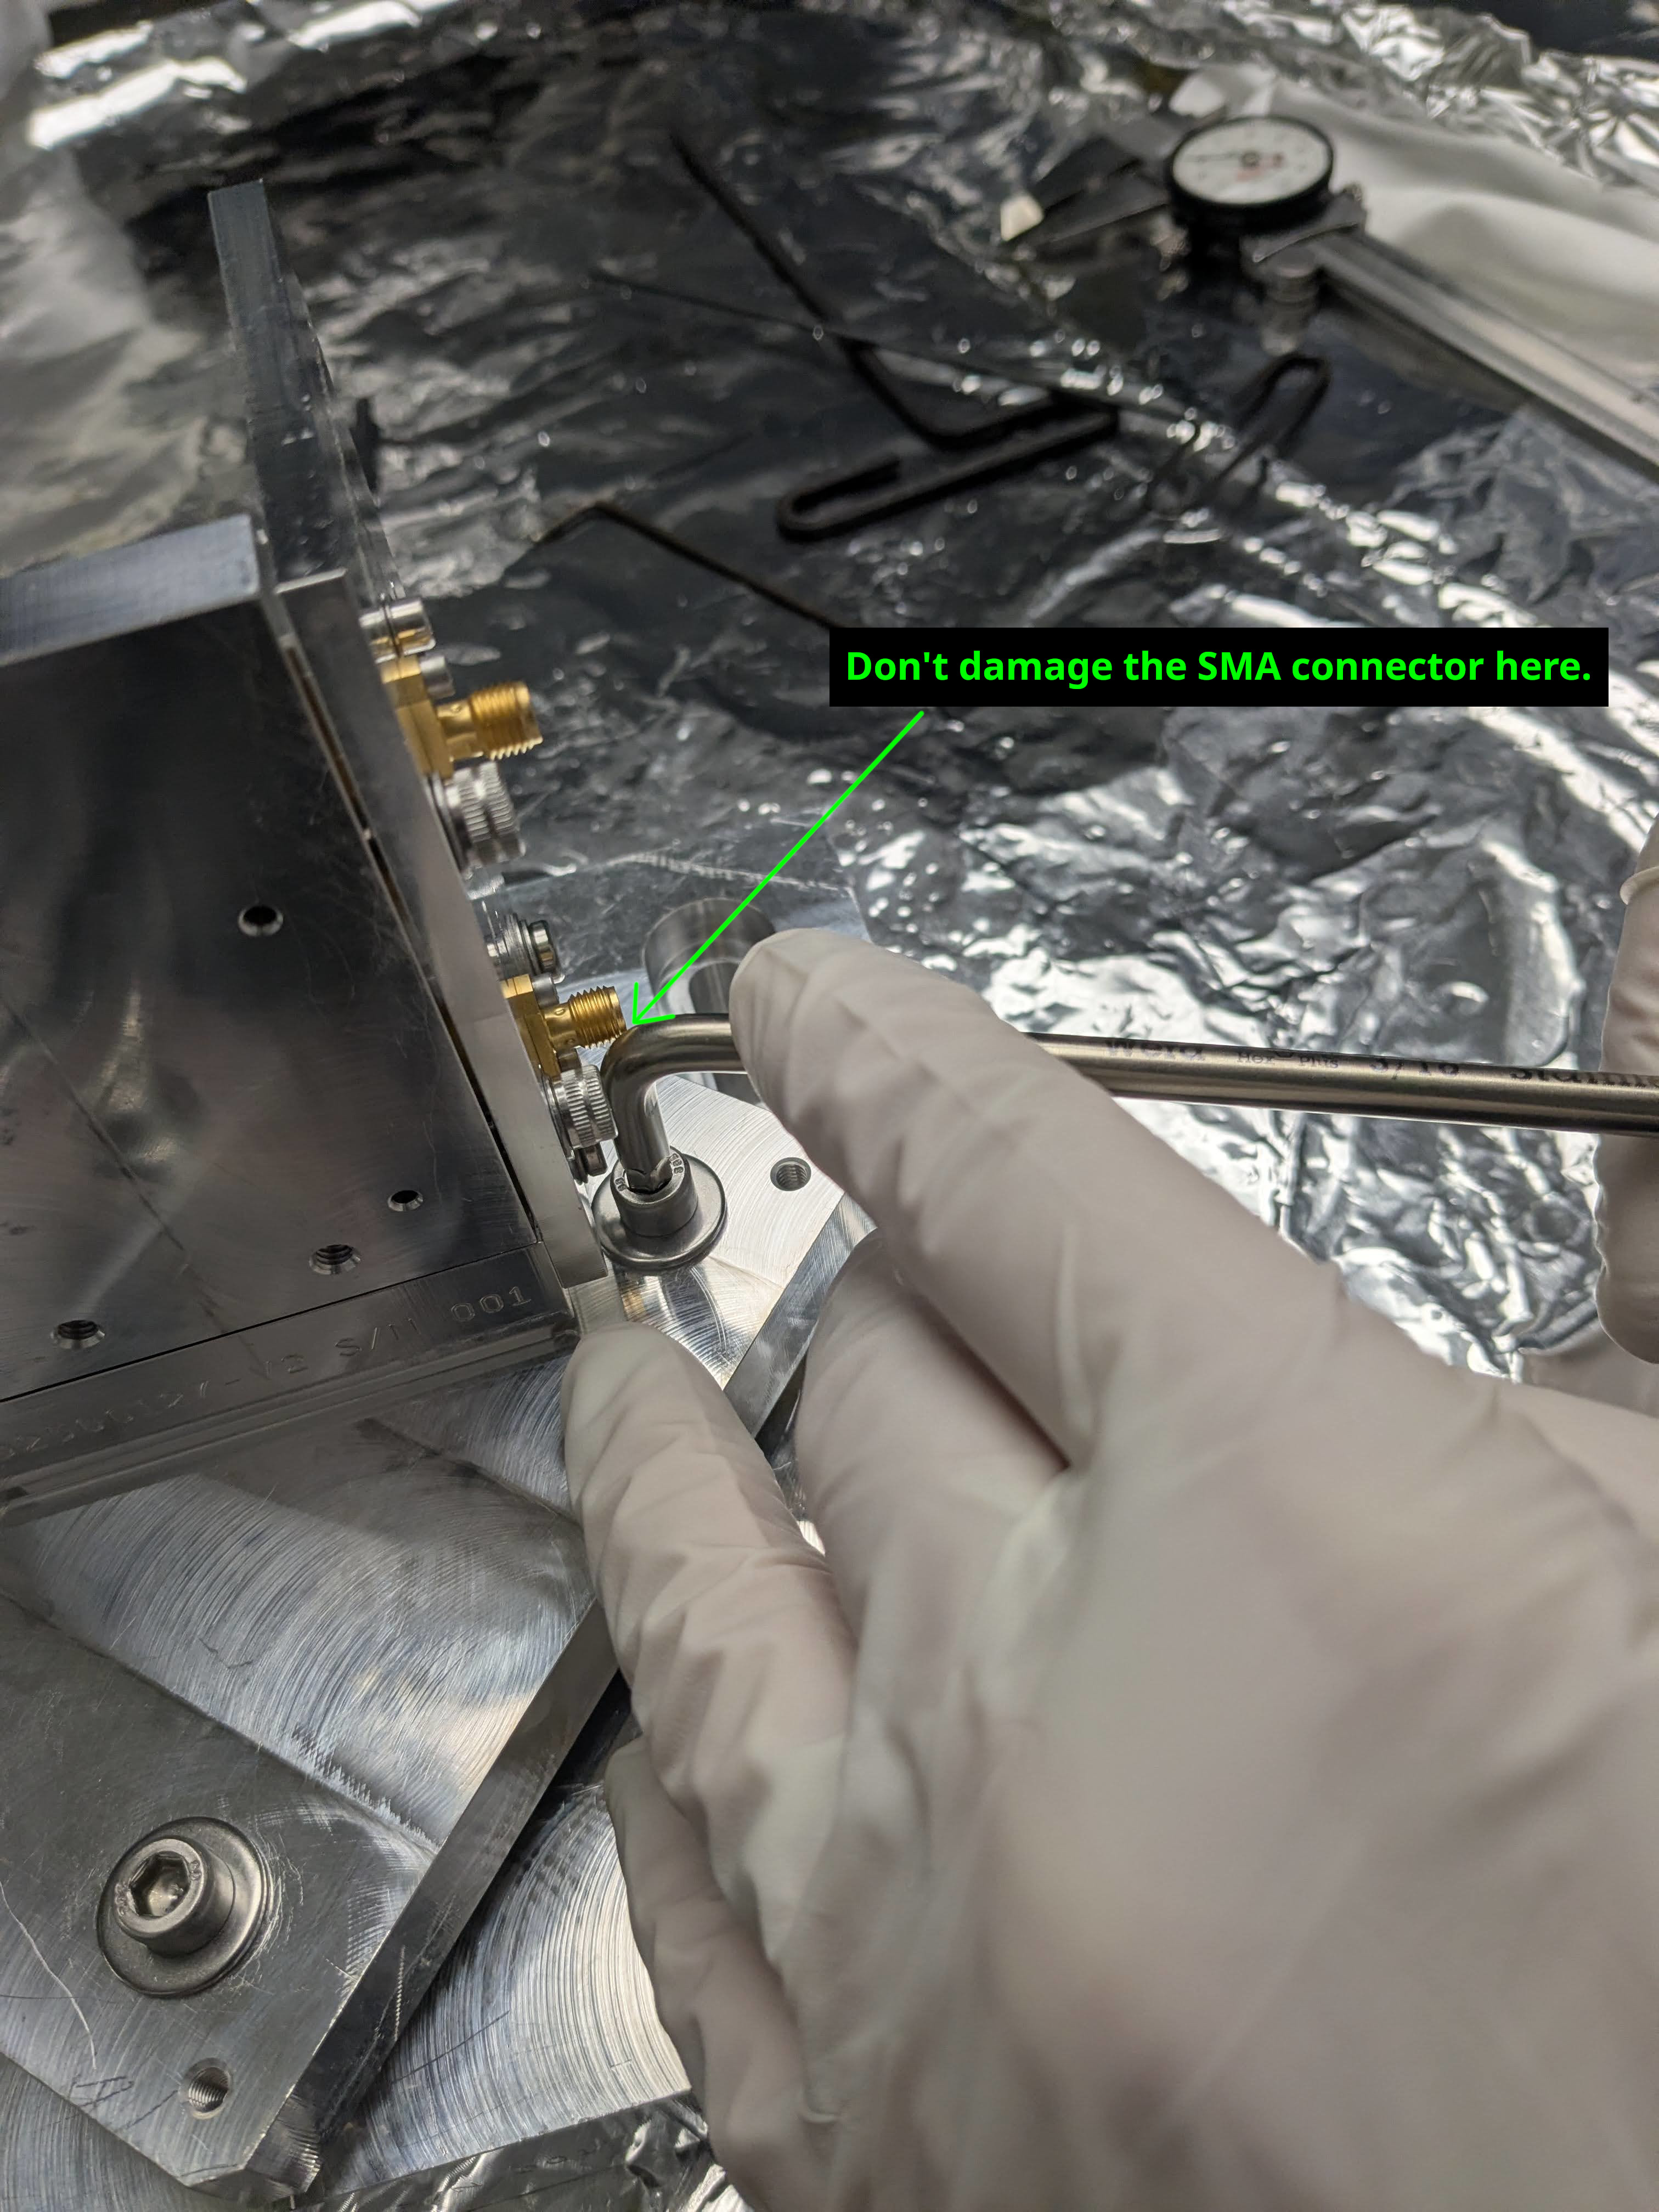
Next, look at one 1/4-20 screw below the above mentioned 10-32 in caution.jpg. When tightening/loosening that screw, don't use a T-handle wrench unless it's a ball end tool, because you WILL damage the SMA connector thread. Even if you use an L-shaped tool, if you don't pay attention you can damage it. Be careful.
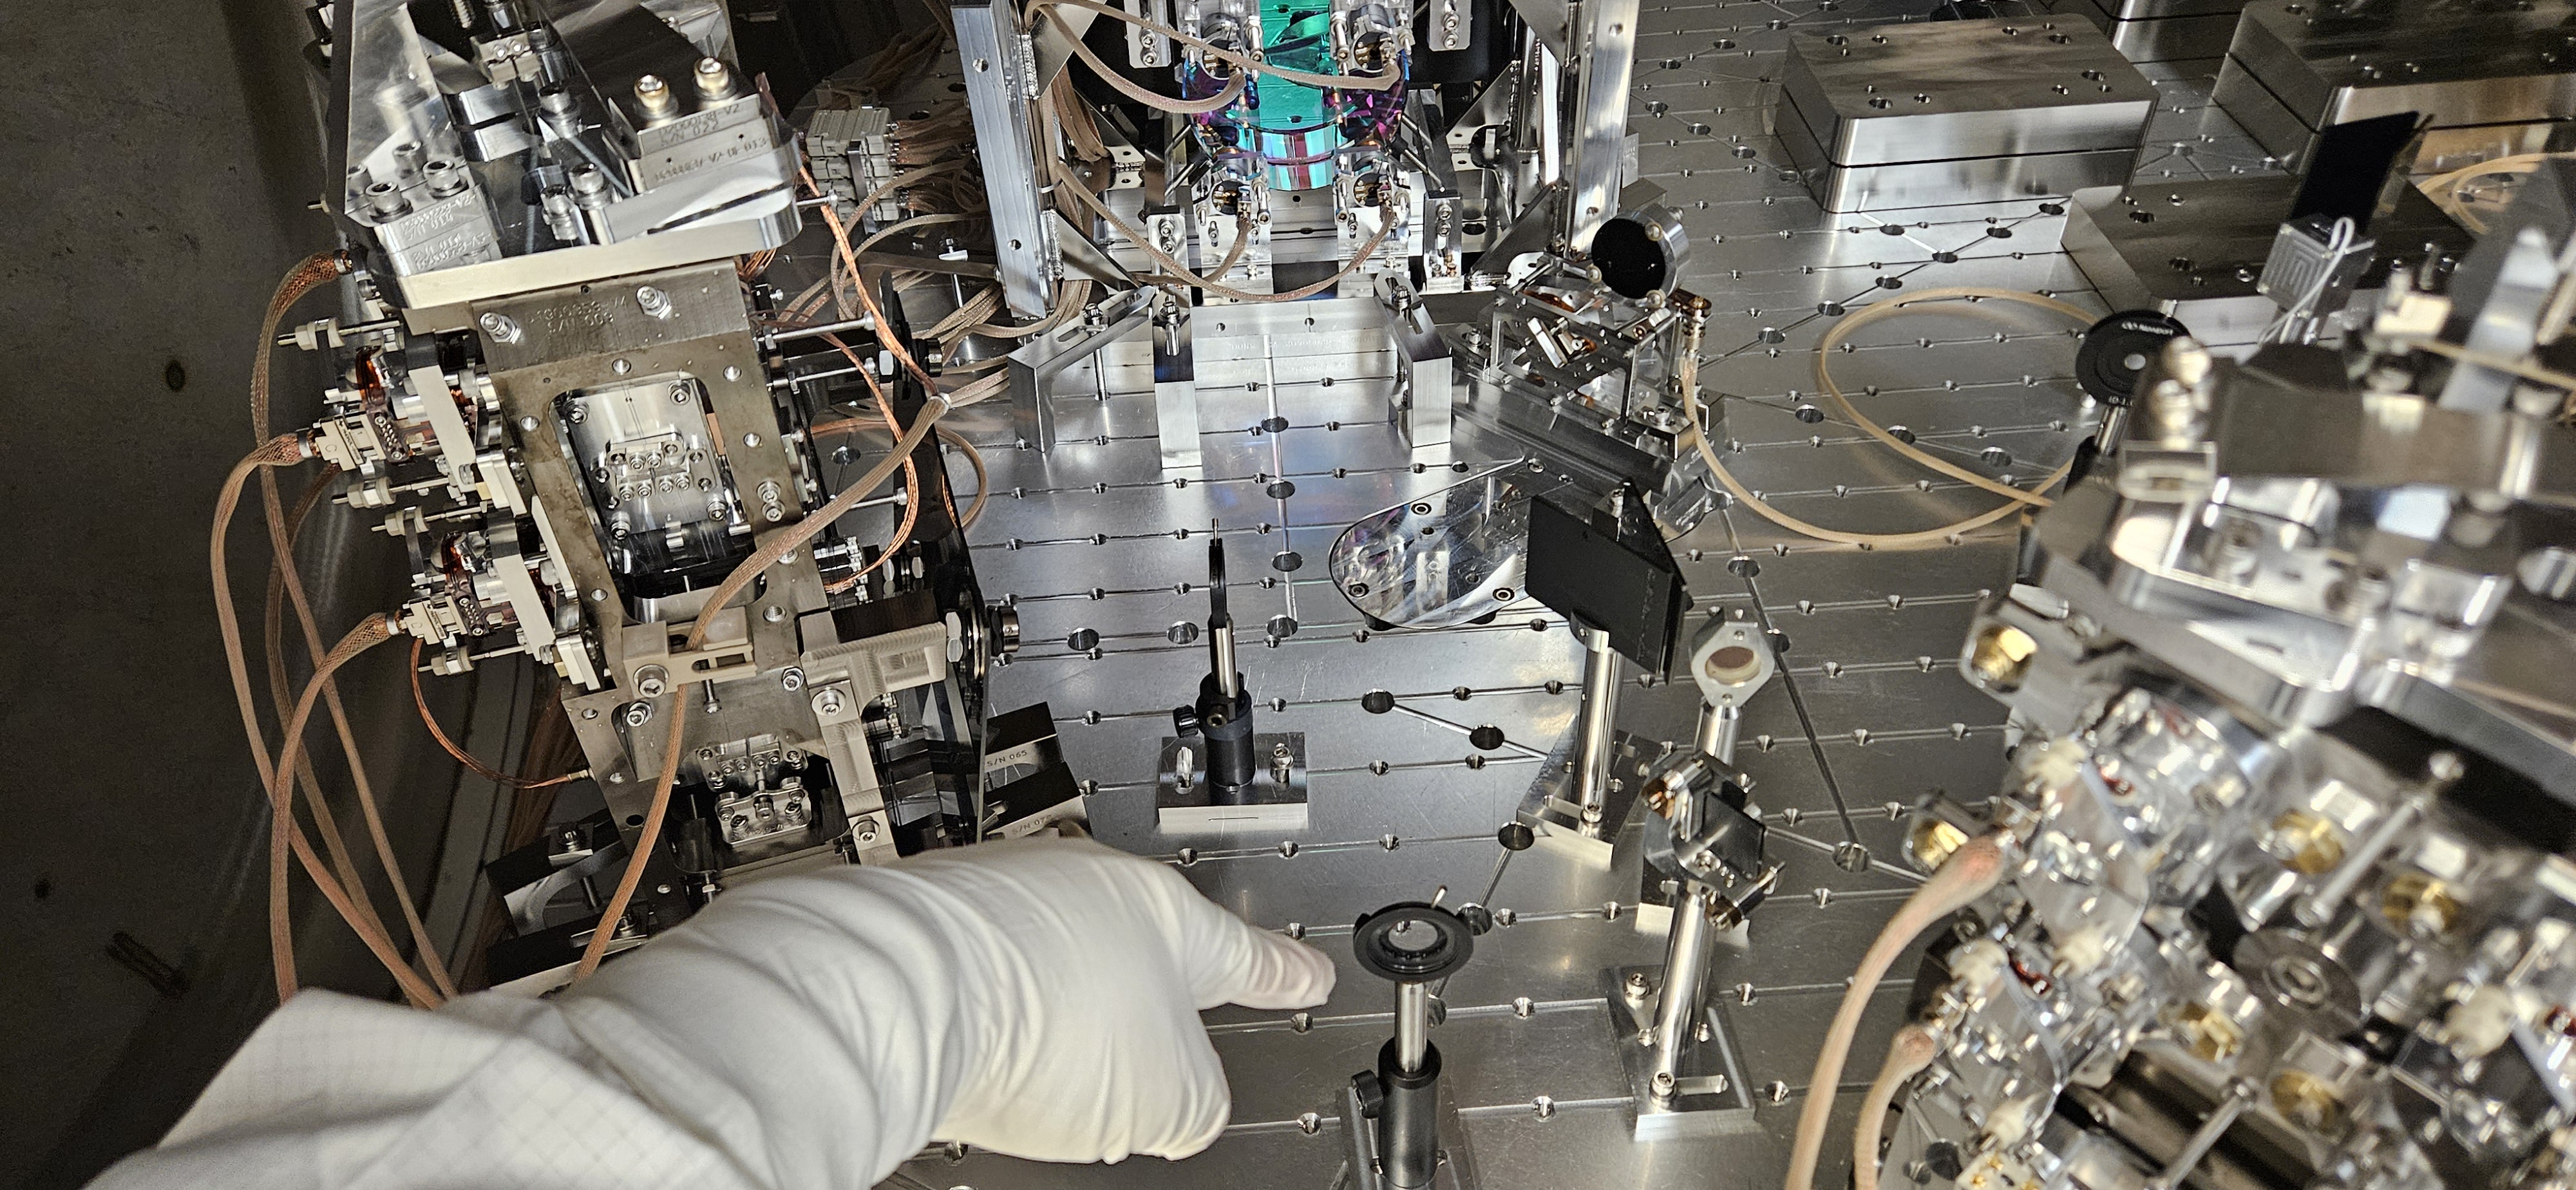
Last picture showcases a happy mood in the optics lab after the successful day.


