Ryan, Rahul, Fil, Dave:
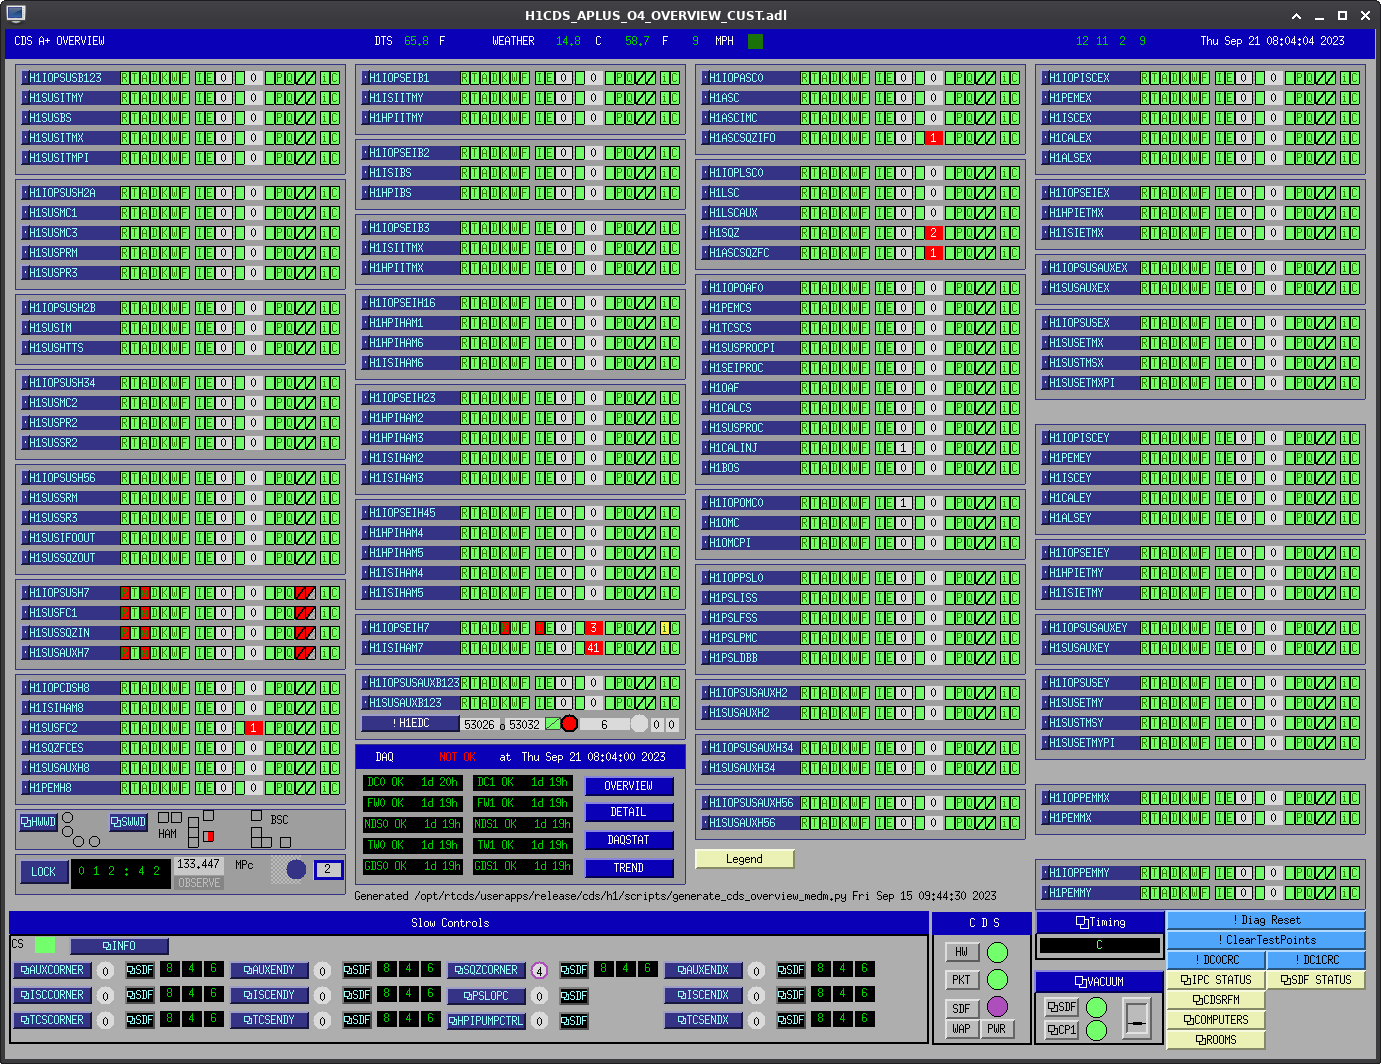
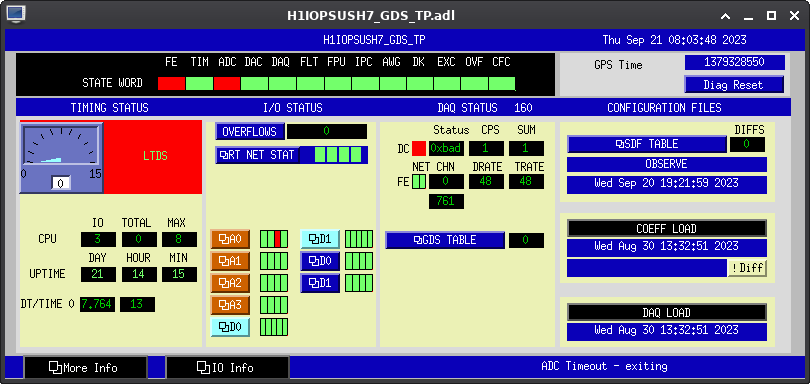
All h1sush7 models stopped running at:
PDT: 2023-09-21 03:48:52.000000 PDT
UTC: 2023-09-21 10:48:52.000000 UTC
GPS: 1379328550.000000
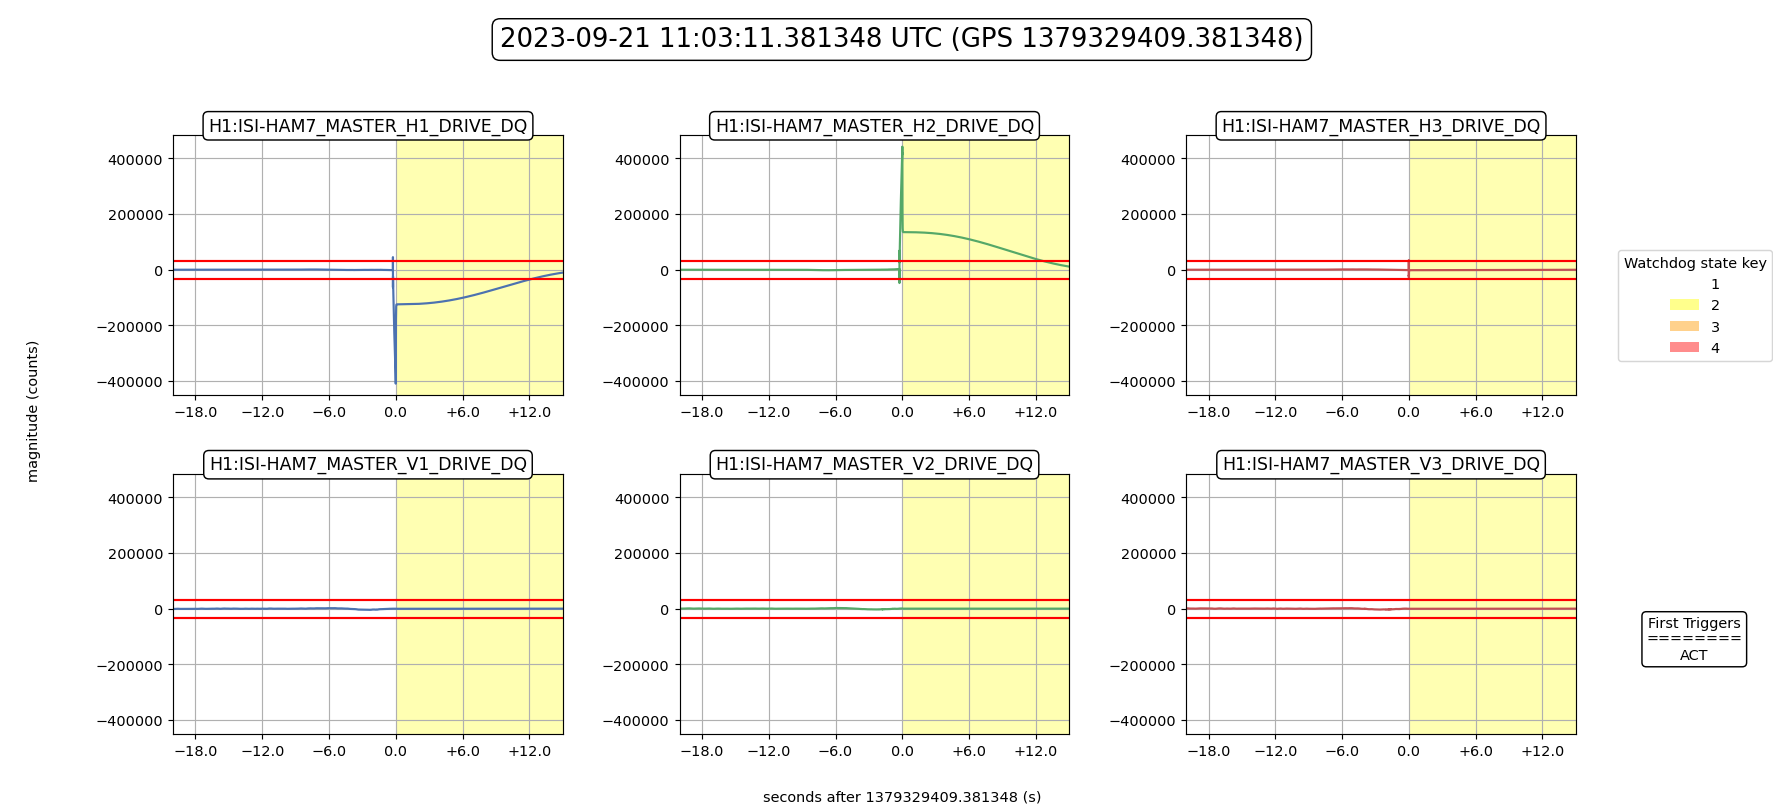
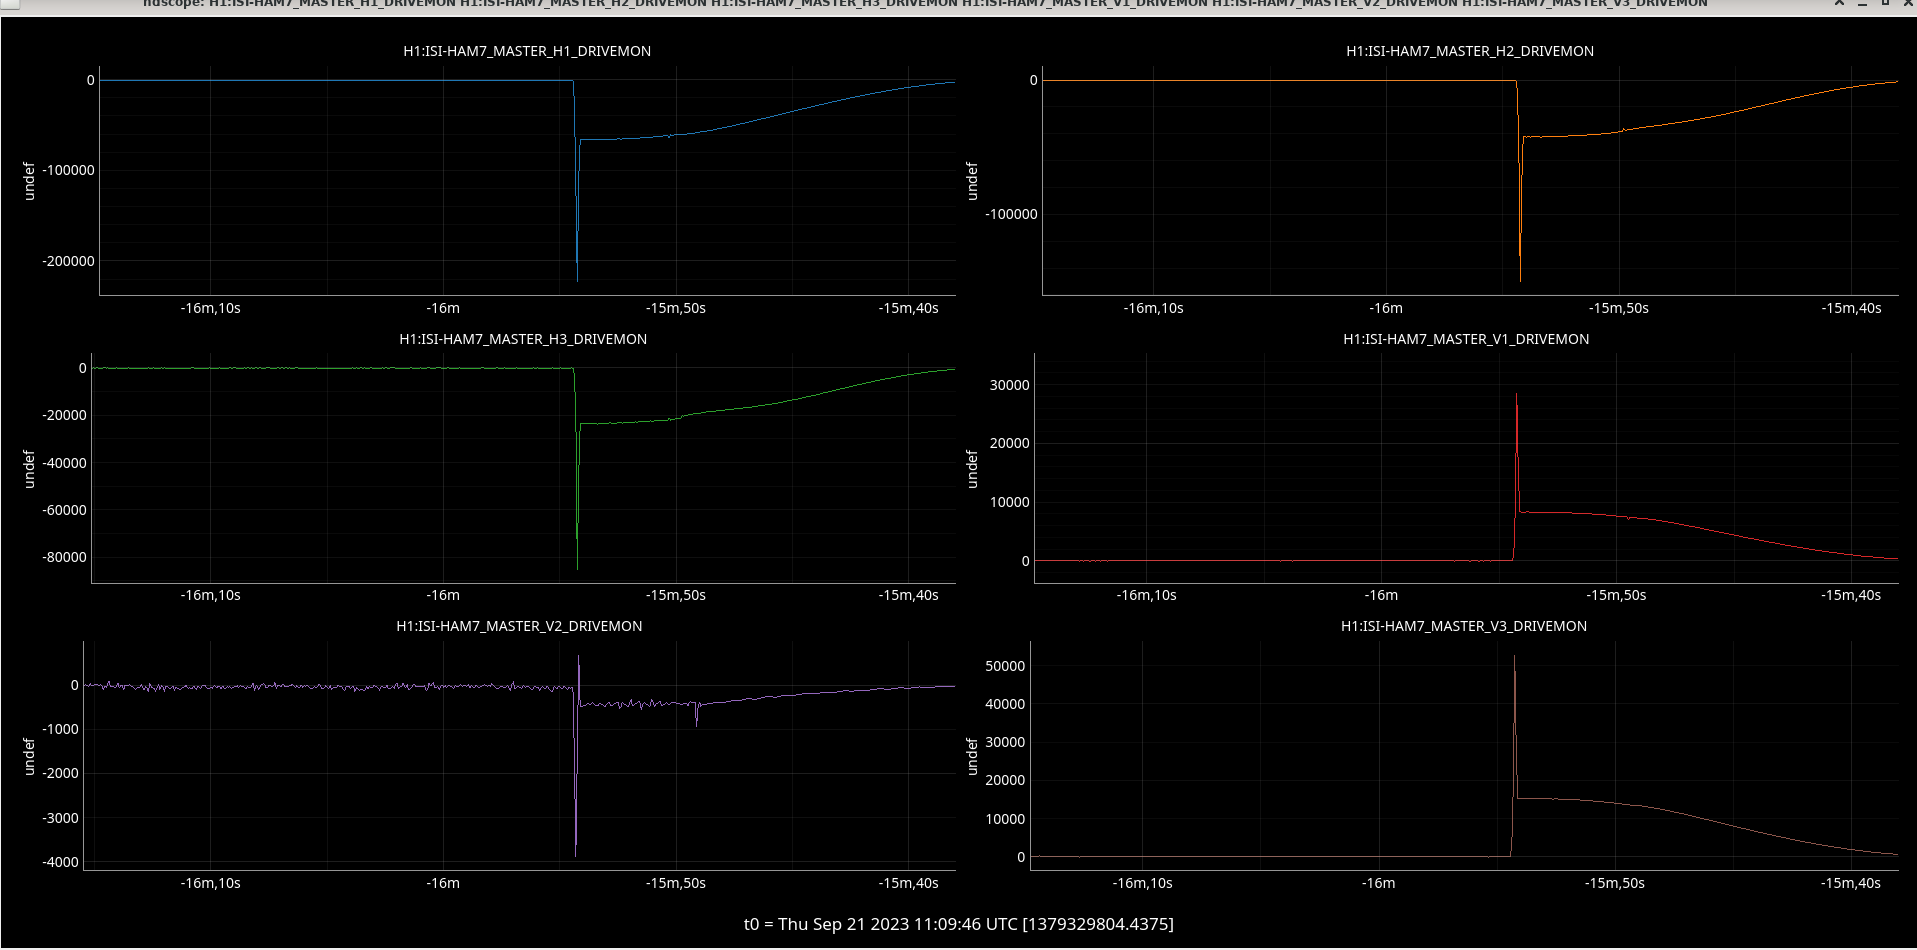
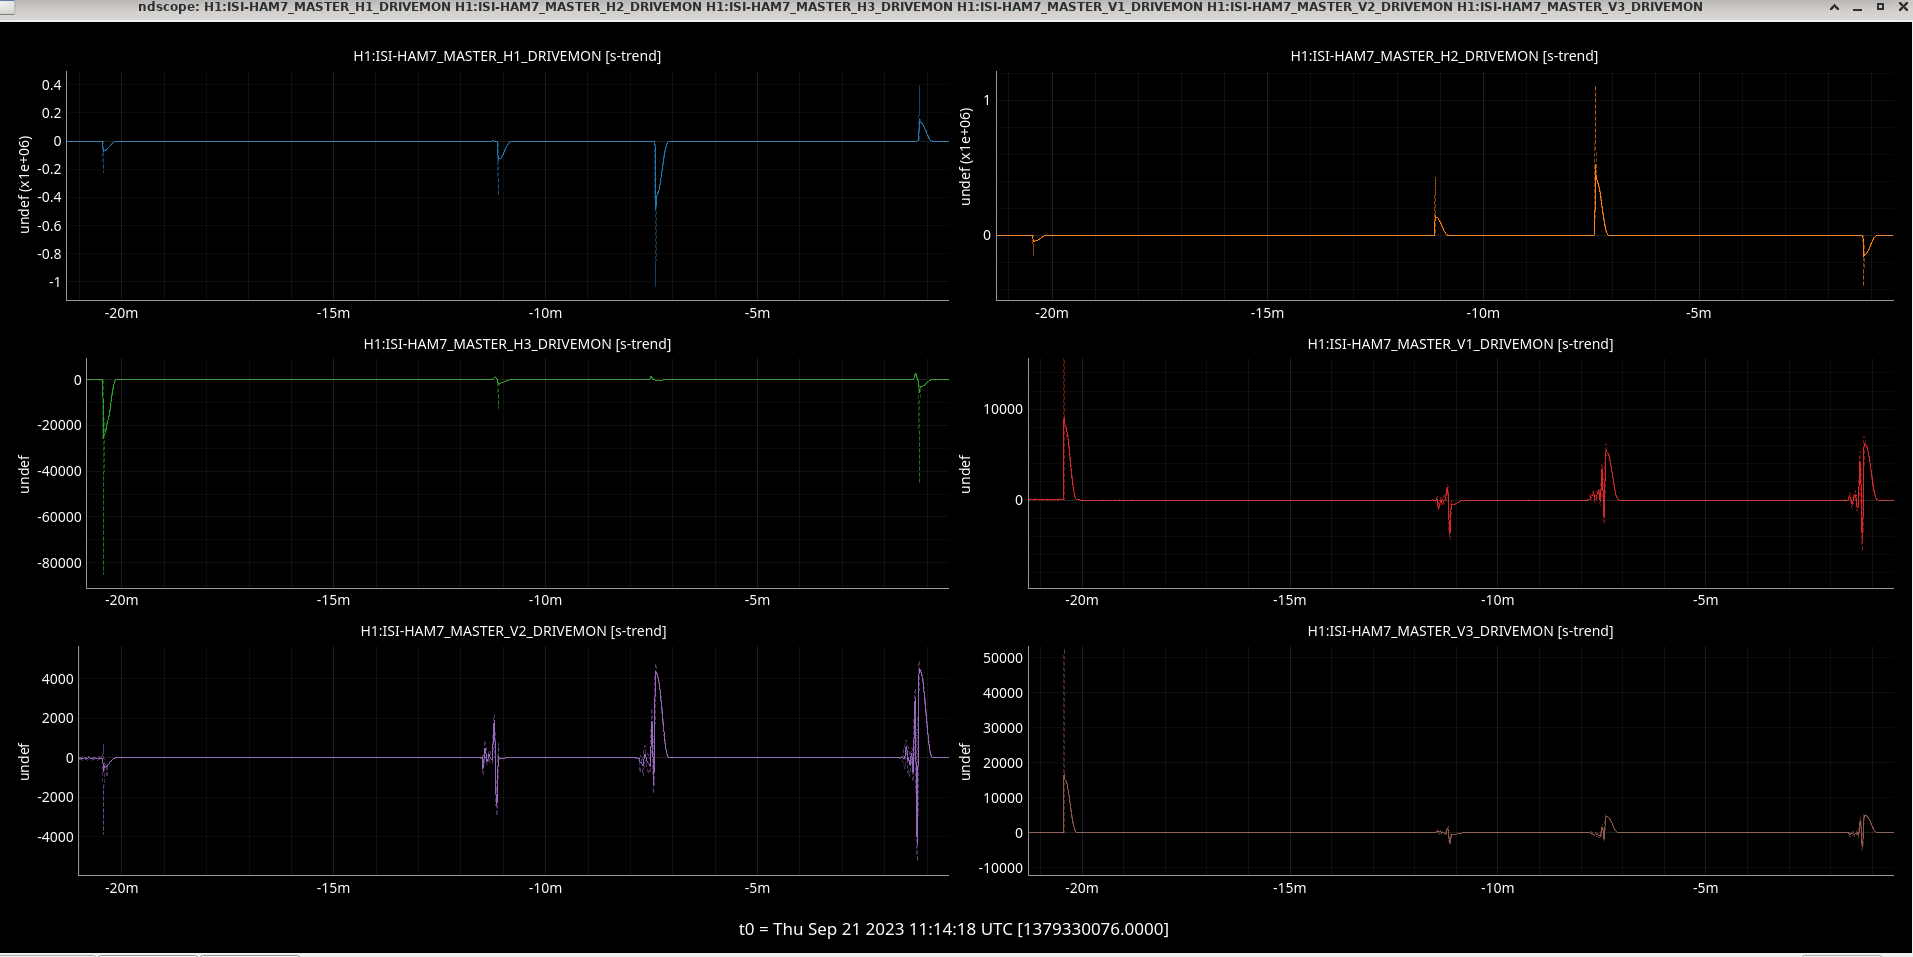
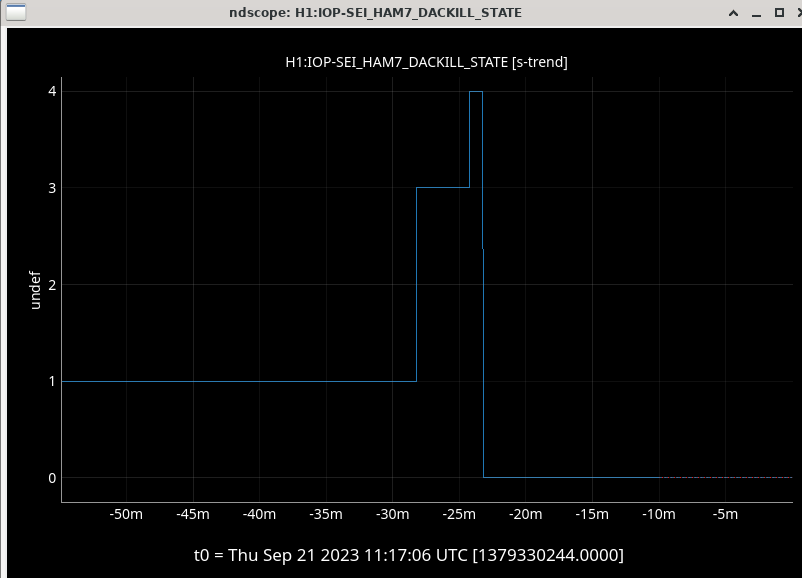
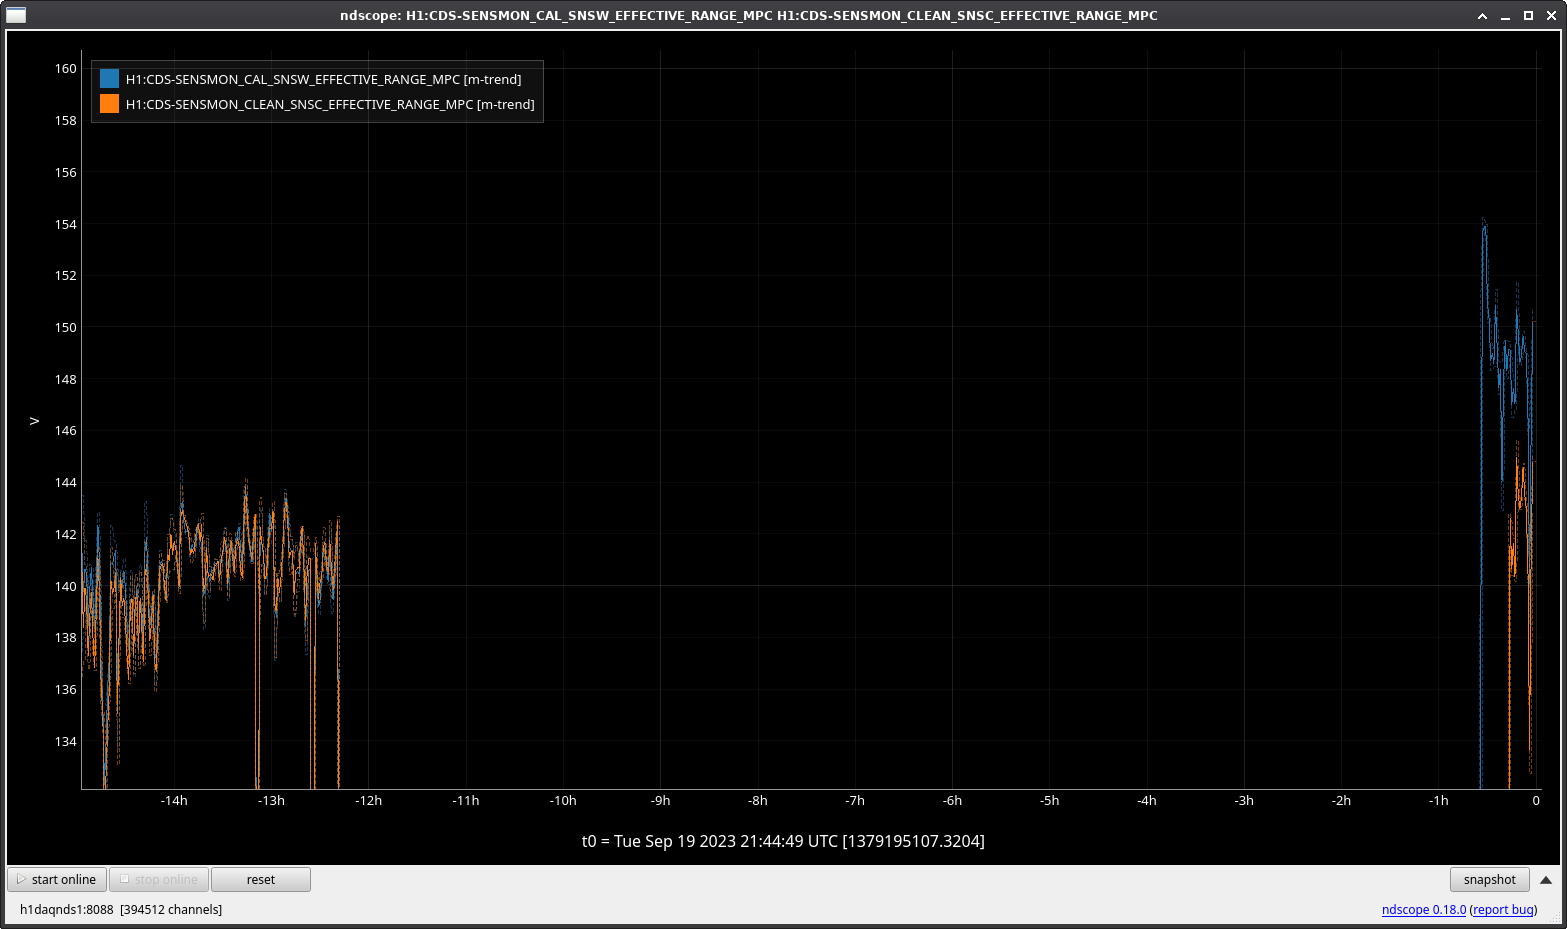
From this time onwards H1 was still in lock with a depressed range of ~130MPc and was out of OBSERVE. h1seih7 SWWDs were tripped.
Recovery process was:
Stop models, fence h1sush7 from the Dophin fabric, reboot h1sush7.
When h1sush7 came back, I verified that the IO Chassis could not be seen. I then fenced and powered the front end down.
Fil went onto the mech room mezzanine and verified that the SUS side of the Kepco dual-power-supply had tripped (SEI side was OK). He powered the IO Chassis back on, I powered h1sush7 computer and all came back correctly.
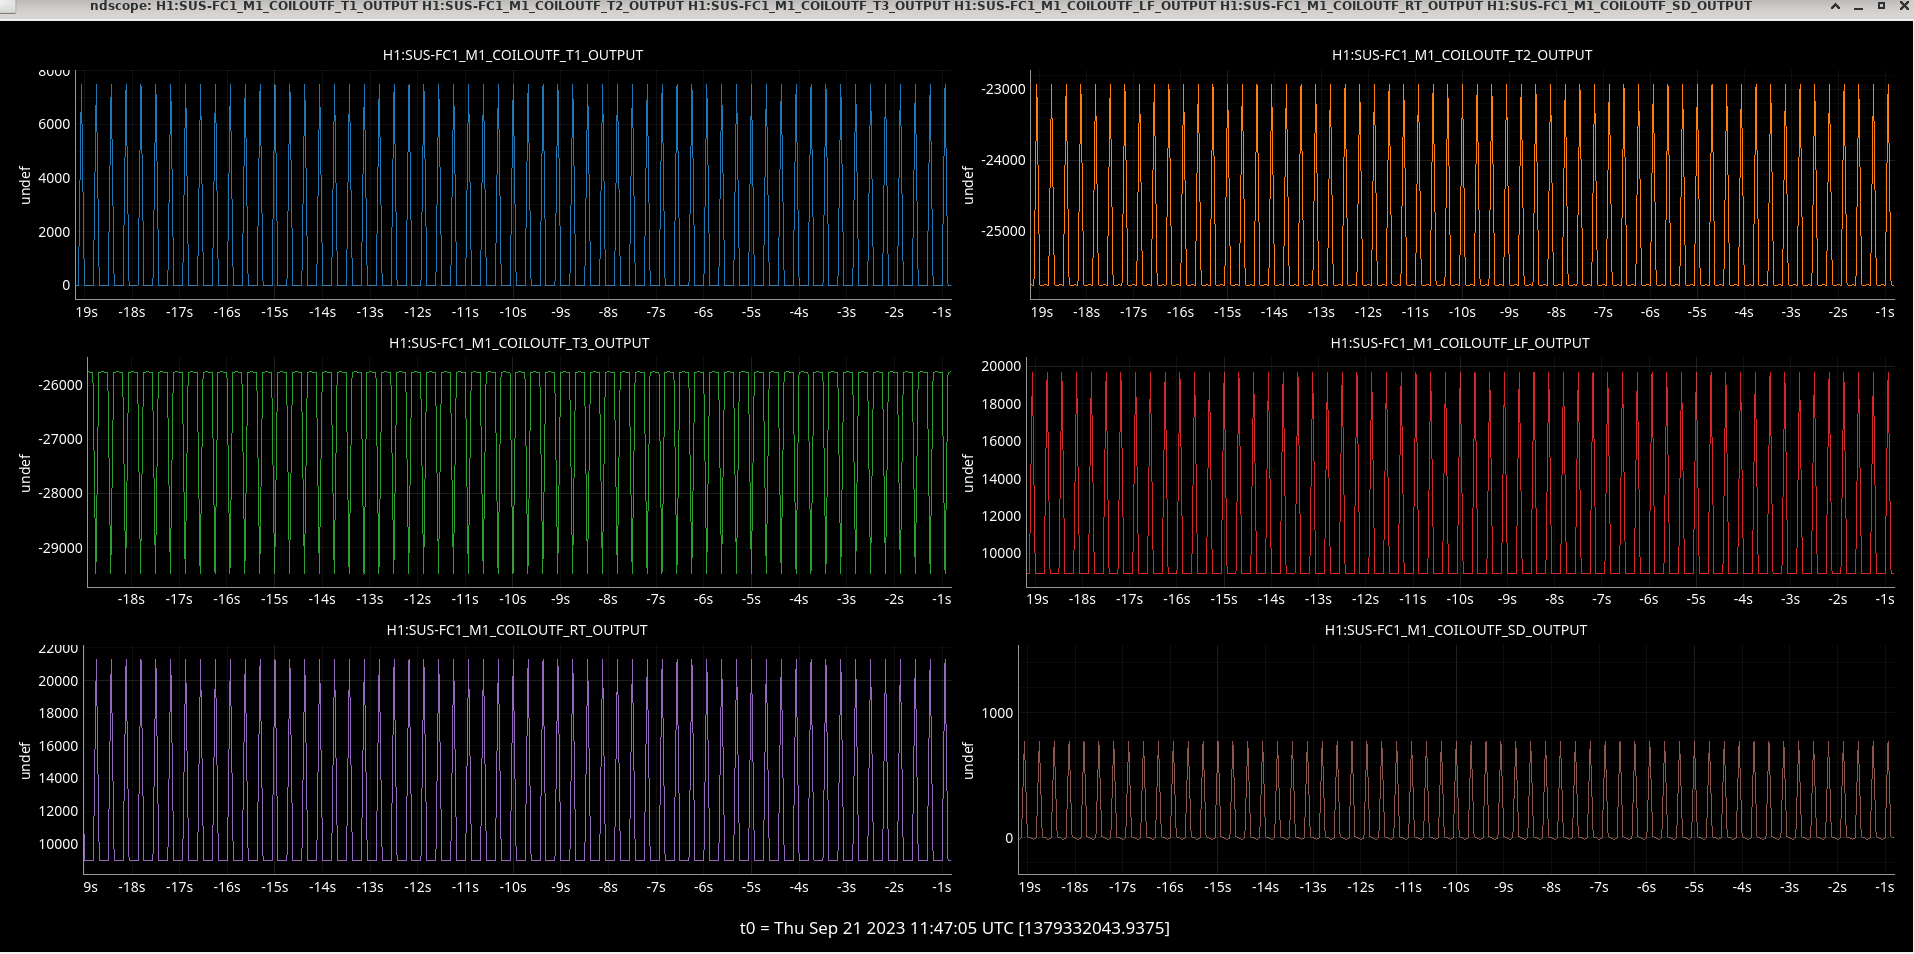
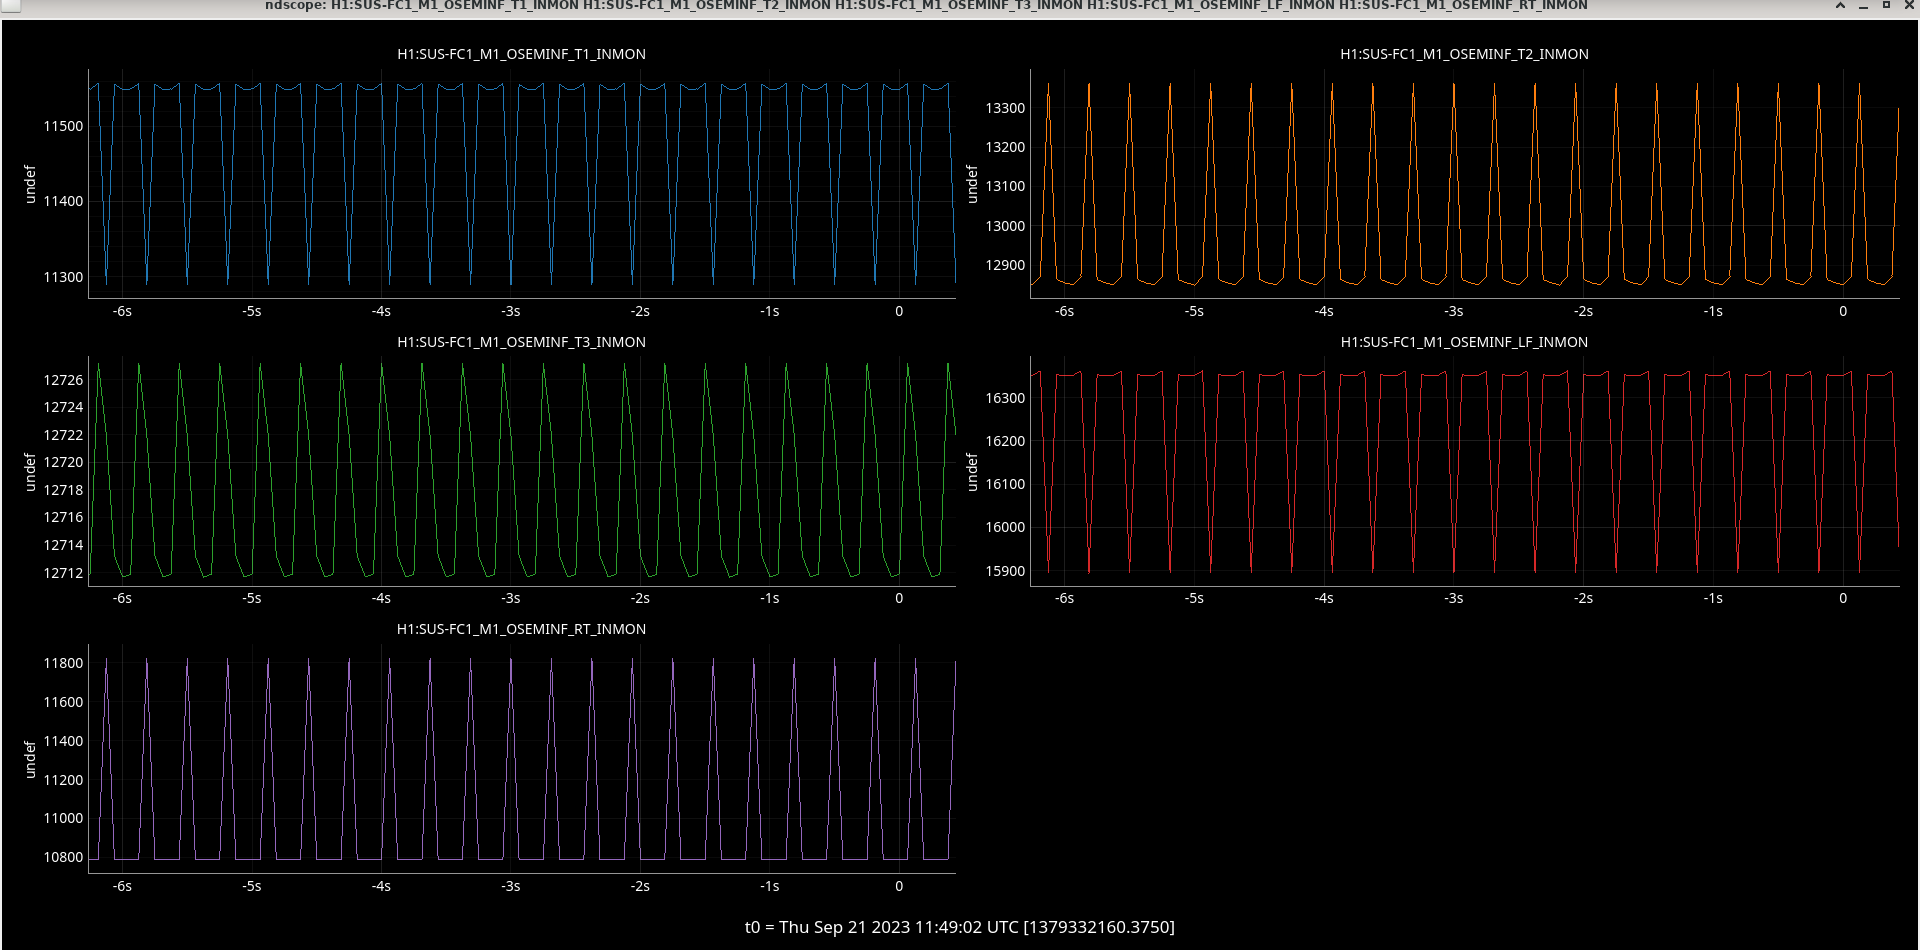
I untripped the SWWDs to get h1seih7 driving again, Ryan and Rahul recovered the SUS models.


Opened FRS29160 for this issue.
This is the third time this has happened
Fil has opened a workpermit to replace this Kepco power supply next Tuesday.
Total H1 observing time lost this morning was 4h,58m from 10:49 UTC to 15:47 UTC. During this time, there was no squeezing and H1's range averaged around 135Mpc.