Follow up investigation to Ryan's alog from this morning, indicating that recently, we have had issues getting IR in the arms and subsequently lose lock at CARM to TR on reaquistions. In addition, it has been noted that despite recently running initial alignments, ALS (particularly Y) would have to go through increase flashes for it to catch. I did a bit of digging, and these are my findings.
I decided to trend back some channels to find potential drift on the Y arm, particuarly in the past 24 hours. Plot 1, is a graphical representation of the Y arm witness sensors and oplev P/Y/sums for E/ITMY in addition to some wind and temp plots to see if I could see any coupling. A bit hard to read, but the point of this plot is to mostly look to see if there is anything that immediately sticks out as being direct evidence of the cause of our Y arm problems. From this plot, nothing really stands out; there is no temperature swings in the VEA, nor any consistent high wind speeds that could explain this recent issue, and no egregious shifts in any of the ETM or ITMY channels either.
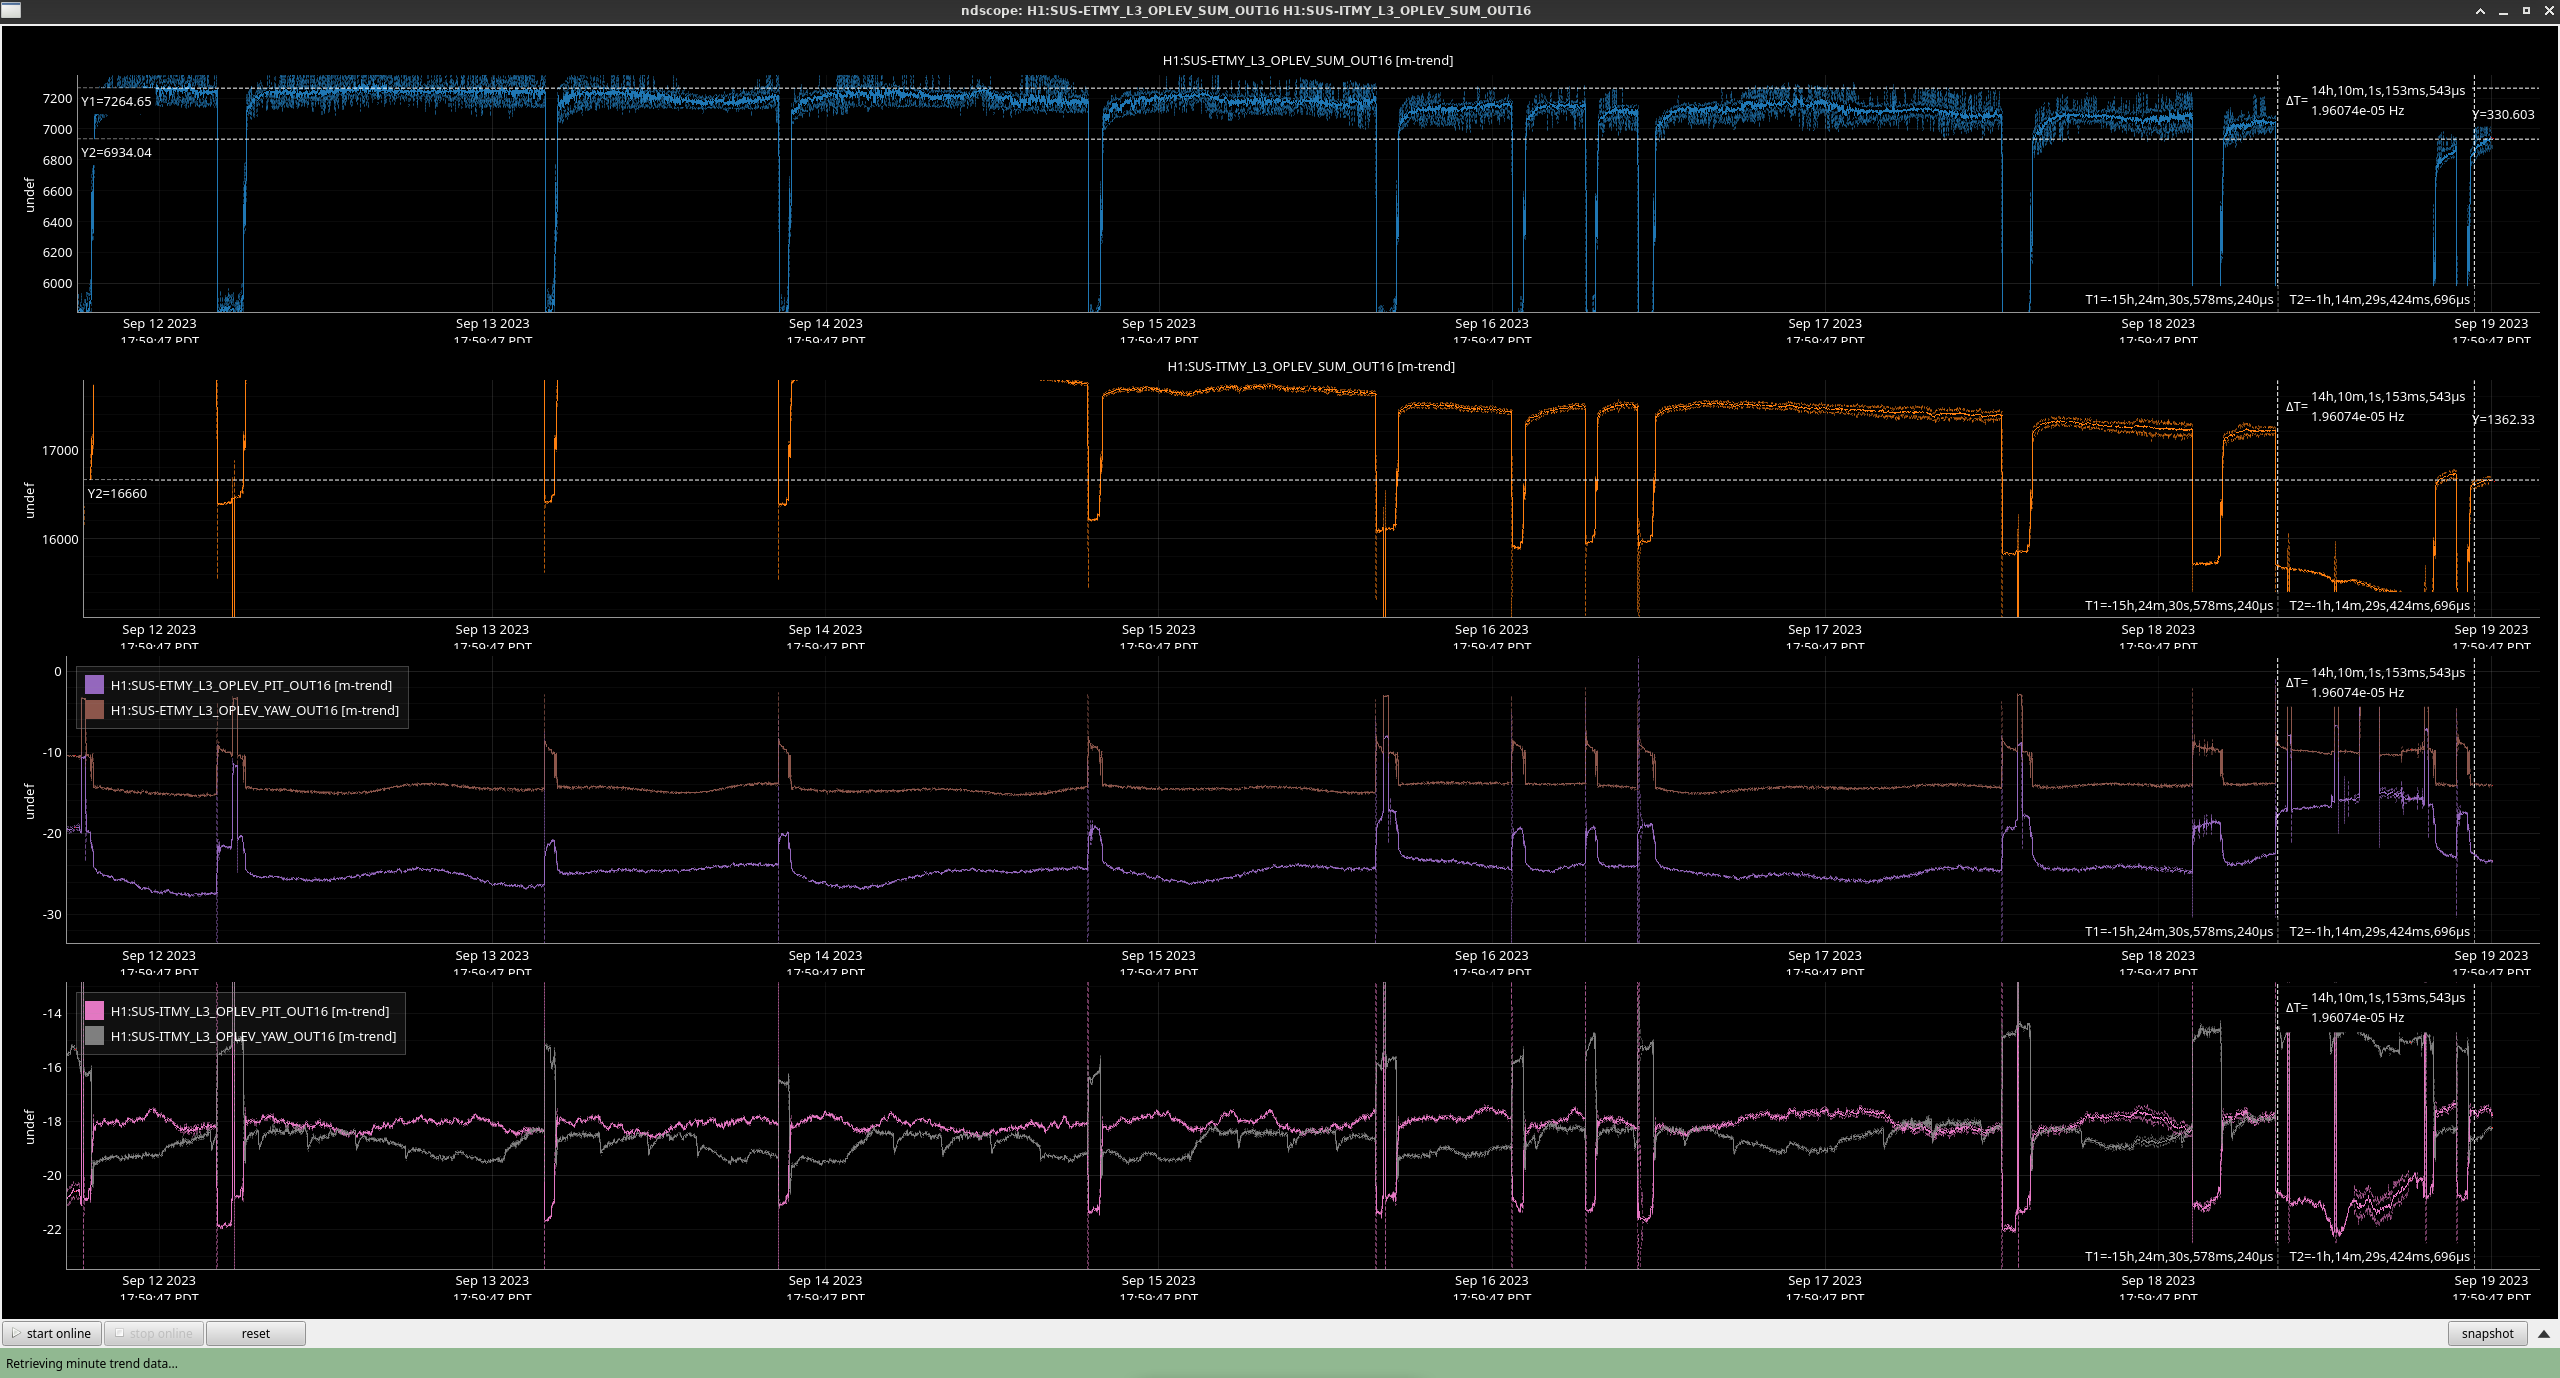
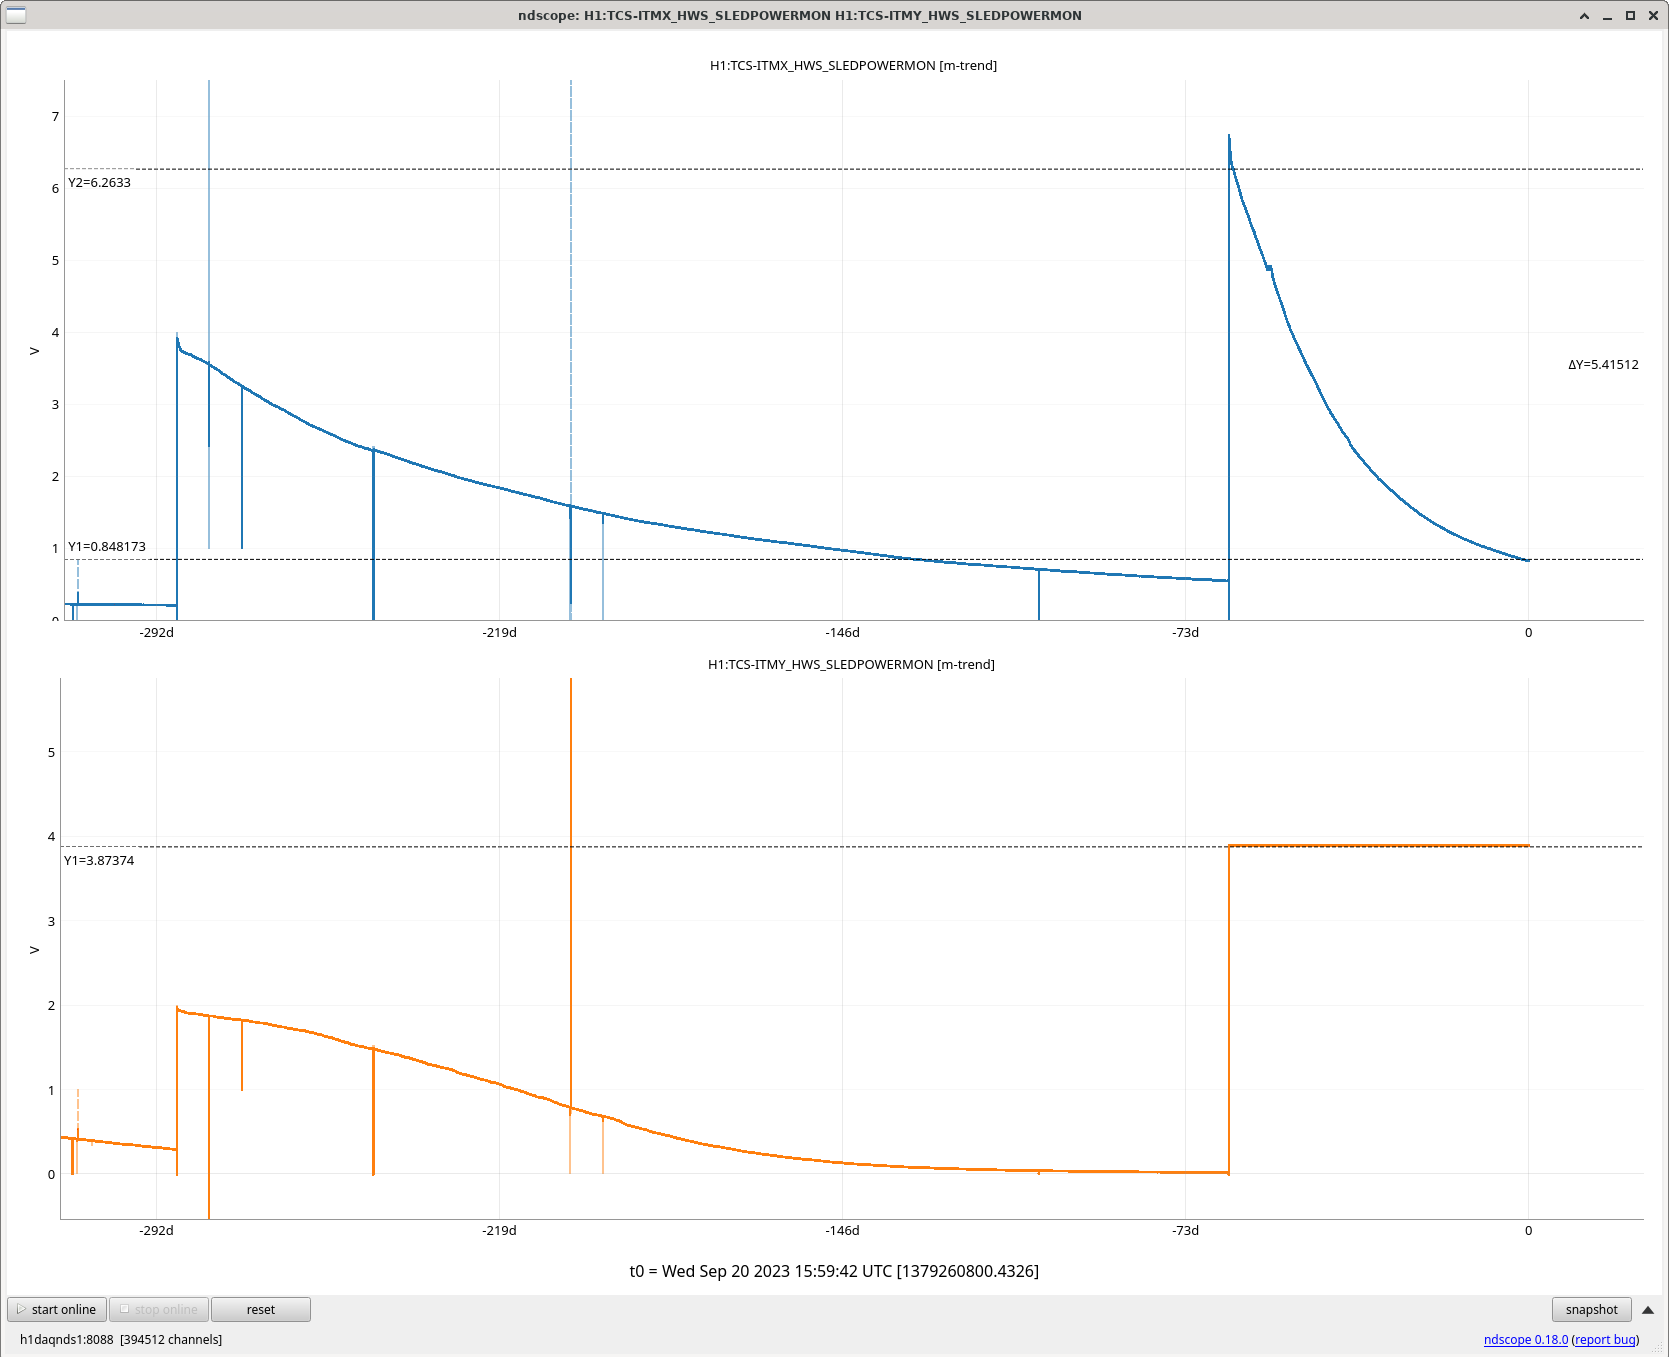
However, I wanted to narrow down some of these channels to take a closer look, and in doing so, found something interesting. Plot 2 show the oplev sum counts for the Y arm suspensions and I found that the sum counts have been steadily decreasing over the past week, with ITMY being the worst of the two. According to the plot, the sum counts for ETMY have dropped by roughly 350 counts, while ITMY has dropped by 1350 counts. Plot 3 shows the same channels, but with the oplev P/Y readbacks added. Interestingly, despite the drop in oplev sum counts, the pitch and yaw for both Y arm oplevs don't seem to have moved a whole bunch, at least not in parallel with the sum count drop. However, something did appear to happen yesterday (~9/19 2:25 PDT/9:25 UTC), as denoted by the vertical plot lines (in plot 3), where there seemed to be a hop in p/y readbacks for the Y arm oplevs and a more drastic drop in sum counts that followed (at a higher rate compared to the original rate of drop in counts leading up to it). So what happened during this time? A lockloss! (Note: it should be expected that a lockloss will drastically change the sum/pitch/yaw counts, but the point I'm trying to make is regarding the jump in oplev p/y counts and the counts staying at those increased values for an extended period of time, which is not seen in other locklosses).
It does look like the p/y oplev readbacks eventually made its way back to a roughly nominal state, but the process did take roughly a day for this to happen (could this be why we had alignment issues when relocking yesterday?). Plot 4 takes a closer look at the "hop" I mention earlier, using the ETM/ITMY witness sensors, and from what I see, there is some shift, but not a whole lot. However, we again see both the witness sensors and oplev values remaining at this elevated value and not dropping back down to its nominal values, for a period of at least 12 hours. Plot 5 shows the Y arm slider values following the lockloss. And again, from what I'm seeing, not a whole lot of movement. It might be noteworthy that ITMY P moved ~1 microradian since the lockloss event, which is a lot for ITMY.
All this to say, I'm not sure if I can call this weird movement/drift the smoking gun, but might be worth looking into. A quick search through recent alogs of commissioning/site events that could potentially relate to this issue also turned up moot. I think the ITMY sum oplev counts dropping as much as they did is pretty suspicious, but then again, could be just a coincidence (or could just be the oplev laser itself dying). I do think it's possible that that particular lockloss could have kicked something more aggresively than normal which could have then caused misalignment issues when reacquiring lock in the Y arm. Or maybe it's just a red herring and not related at all. Maybe all this information is a red herring. who knows ¯\_(ツ)_/¯