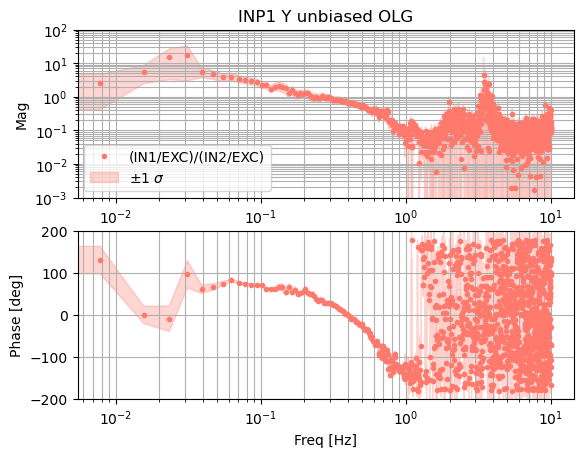
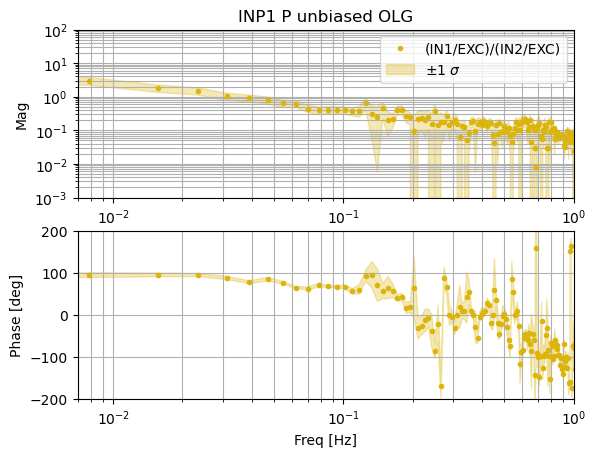
Today I took "unbiased" OLGs of INP1 P and Y (67187). I have plot the measurements with error shading.
INP1 P has a UGF of about 0.036 Hz and phase margin of 87 deg. This UGF seems very low for the target Gabriele and I had when we redesigned this loop (69108). I think should be closer to 0.1 Hz. INP1 Y has a UGF of about 0.25 Hz with phase margin 35 deg, which is higher than I would have expected for our target. Time permitting, I will look into the design of both of these loops and see if there are any adjustments worth making.
You can find the measurement templates, exported data, and processing code in '/ligo/home/elenna.capote/DRMI_ASC/INP1'.
The templates for the these measurements are also saved in [userapps]/asc/h1/templates/INP1 as 'INP1_{P,Y}_olg_broadband_shaped.xml'.
As a reminder, INP1 controls IM4 and is sensed on a combination of REFL RF45 WFS.
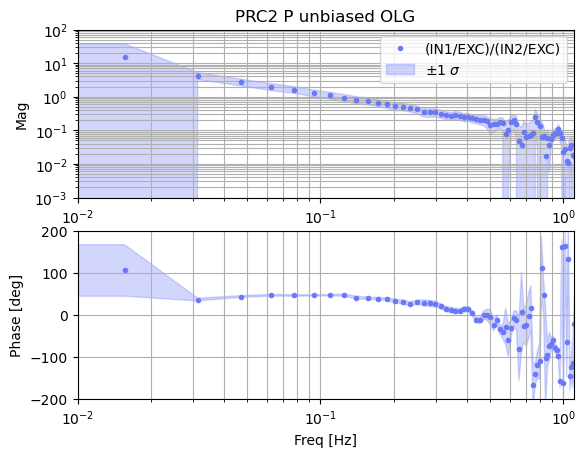
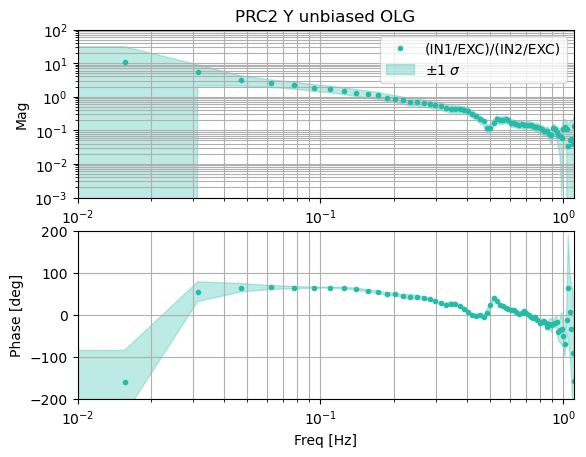
Today I took "unbiased" OLGs of PRC2 P and Y (67187). I have plot the measurements with error shading.
PRC2 P has a UGF of about 0.12 Hz with a phase margin of 46 deg. PRC2 Y has a UGF of about 0.17 Hz with a phase margin of 53 deg.
This lines up with the target UGF Gabriele and I had when we redesigned this loop (69108).
You can find the measurement templates, exported data, and processing code in '/ligo/home/elenna.capote/DRMI_ASC/PRC2'.
The templates for the these measurements are also saved in [userapps]/asc/h1/templates/PRC2 as 'PRC2_{P,Y}_olg_broadband_shaped.xml'.
As a reminder, PRC2 controls PR2 and is the "only" ASC loop that controls the PRC. We do not run PRC1 in full lock, and we only control PRM angle with the (very low bandwidth) camera servo. PRC2 is currently sensed on a combination of REFL RF9 WFS.
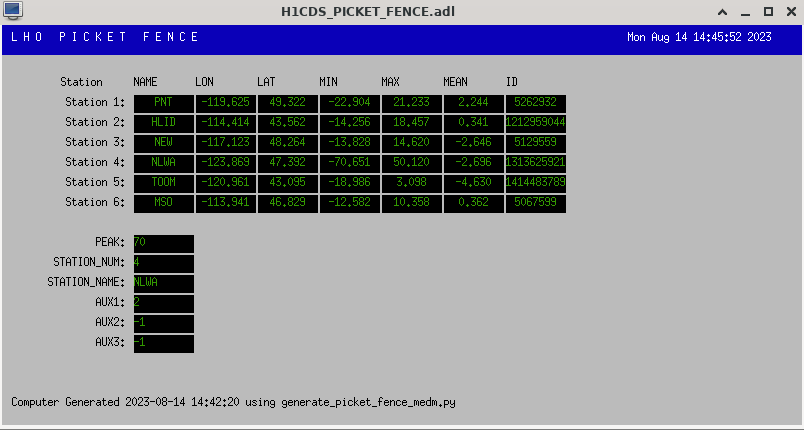
I've written a python program to generate a H1CDS_PICKET_FENCE.adl MEDM (see attached). This can be opened from the SITEMAP as the last entry in the SEI pull-down.
All the non-string PVs can be trended using the DAQ.
Dave, I love this!
what do i need to do to get this script so I can monitor the picket fences while doing debugging here at Stanford too?
Edgard
H1 has wrapped up commissioning activities and is back observing as of 20:18 UTC
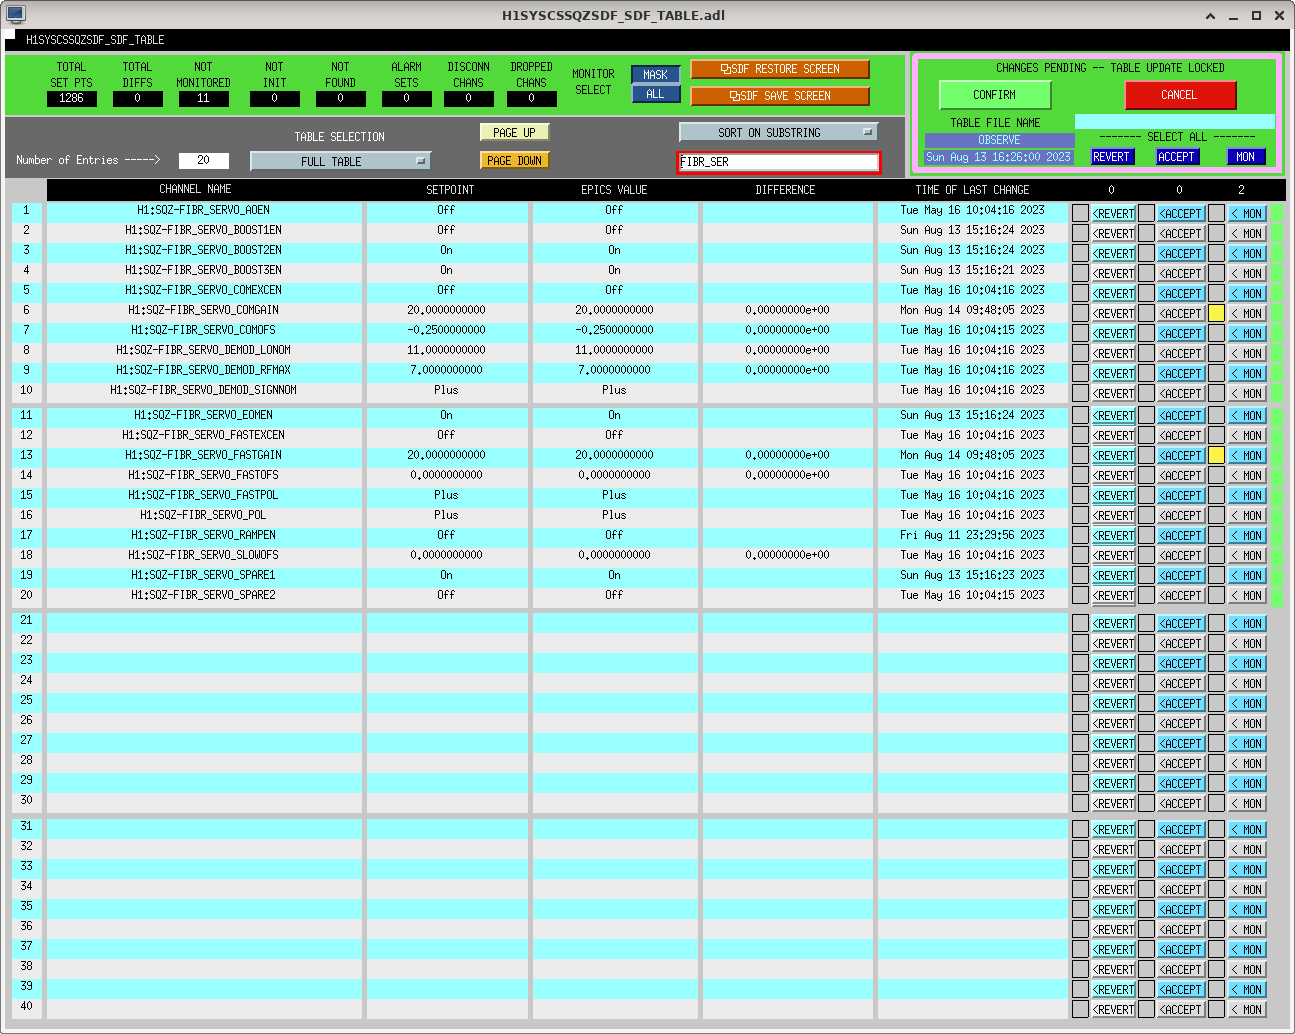
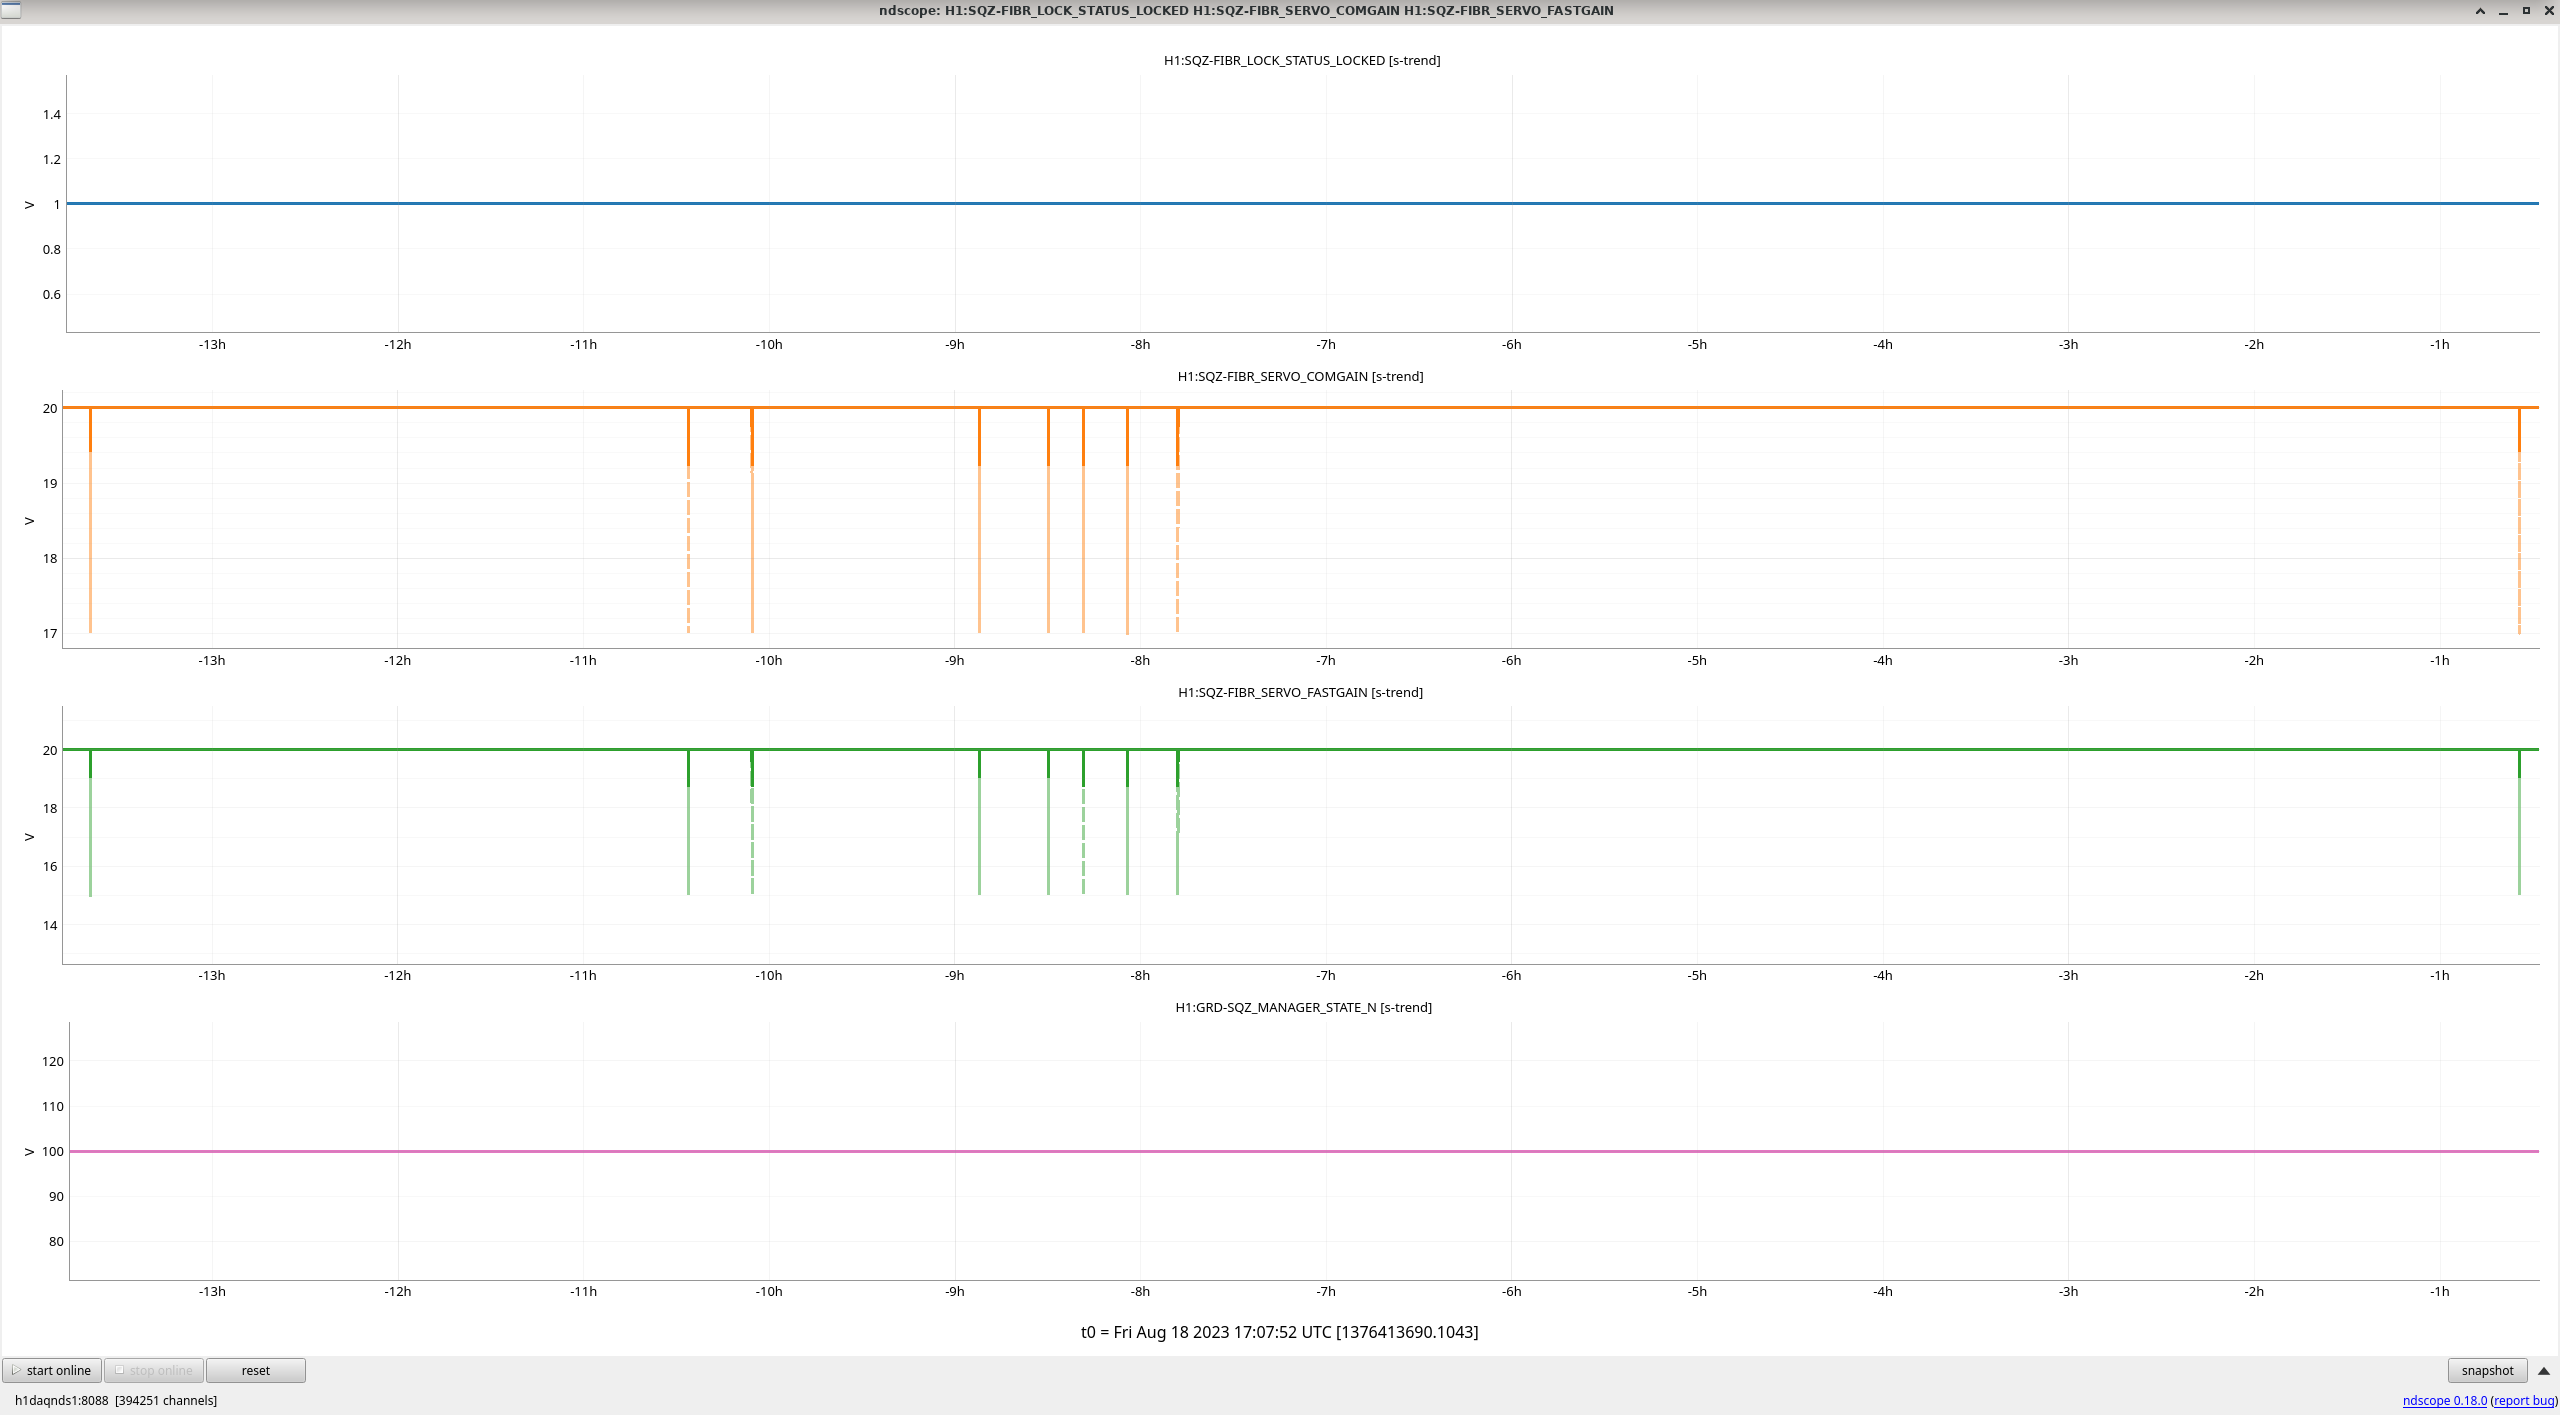
Naoki and I unmonitored H1:SQZ-FIBR_SERVO_COMGAIN and H1:SQZ-FIBR_SERVO_FASTGAIN from syscssqz observe.snap. They have been regularly taking us out of observing (72171) by changing when the TTFSS isn't really unlocking, see 71652. If the TTFSS really unlocks there will be other sdf diffs and the sqz guardians will unlock.
We still plan to investigate this further tomorrow. We can monitor if it keeps happening using the channels.
Daniel, Sheila
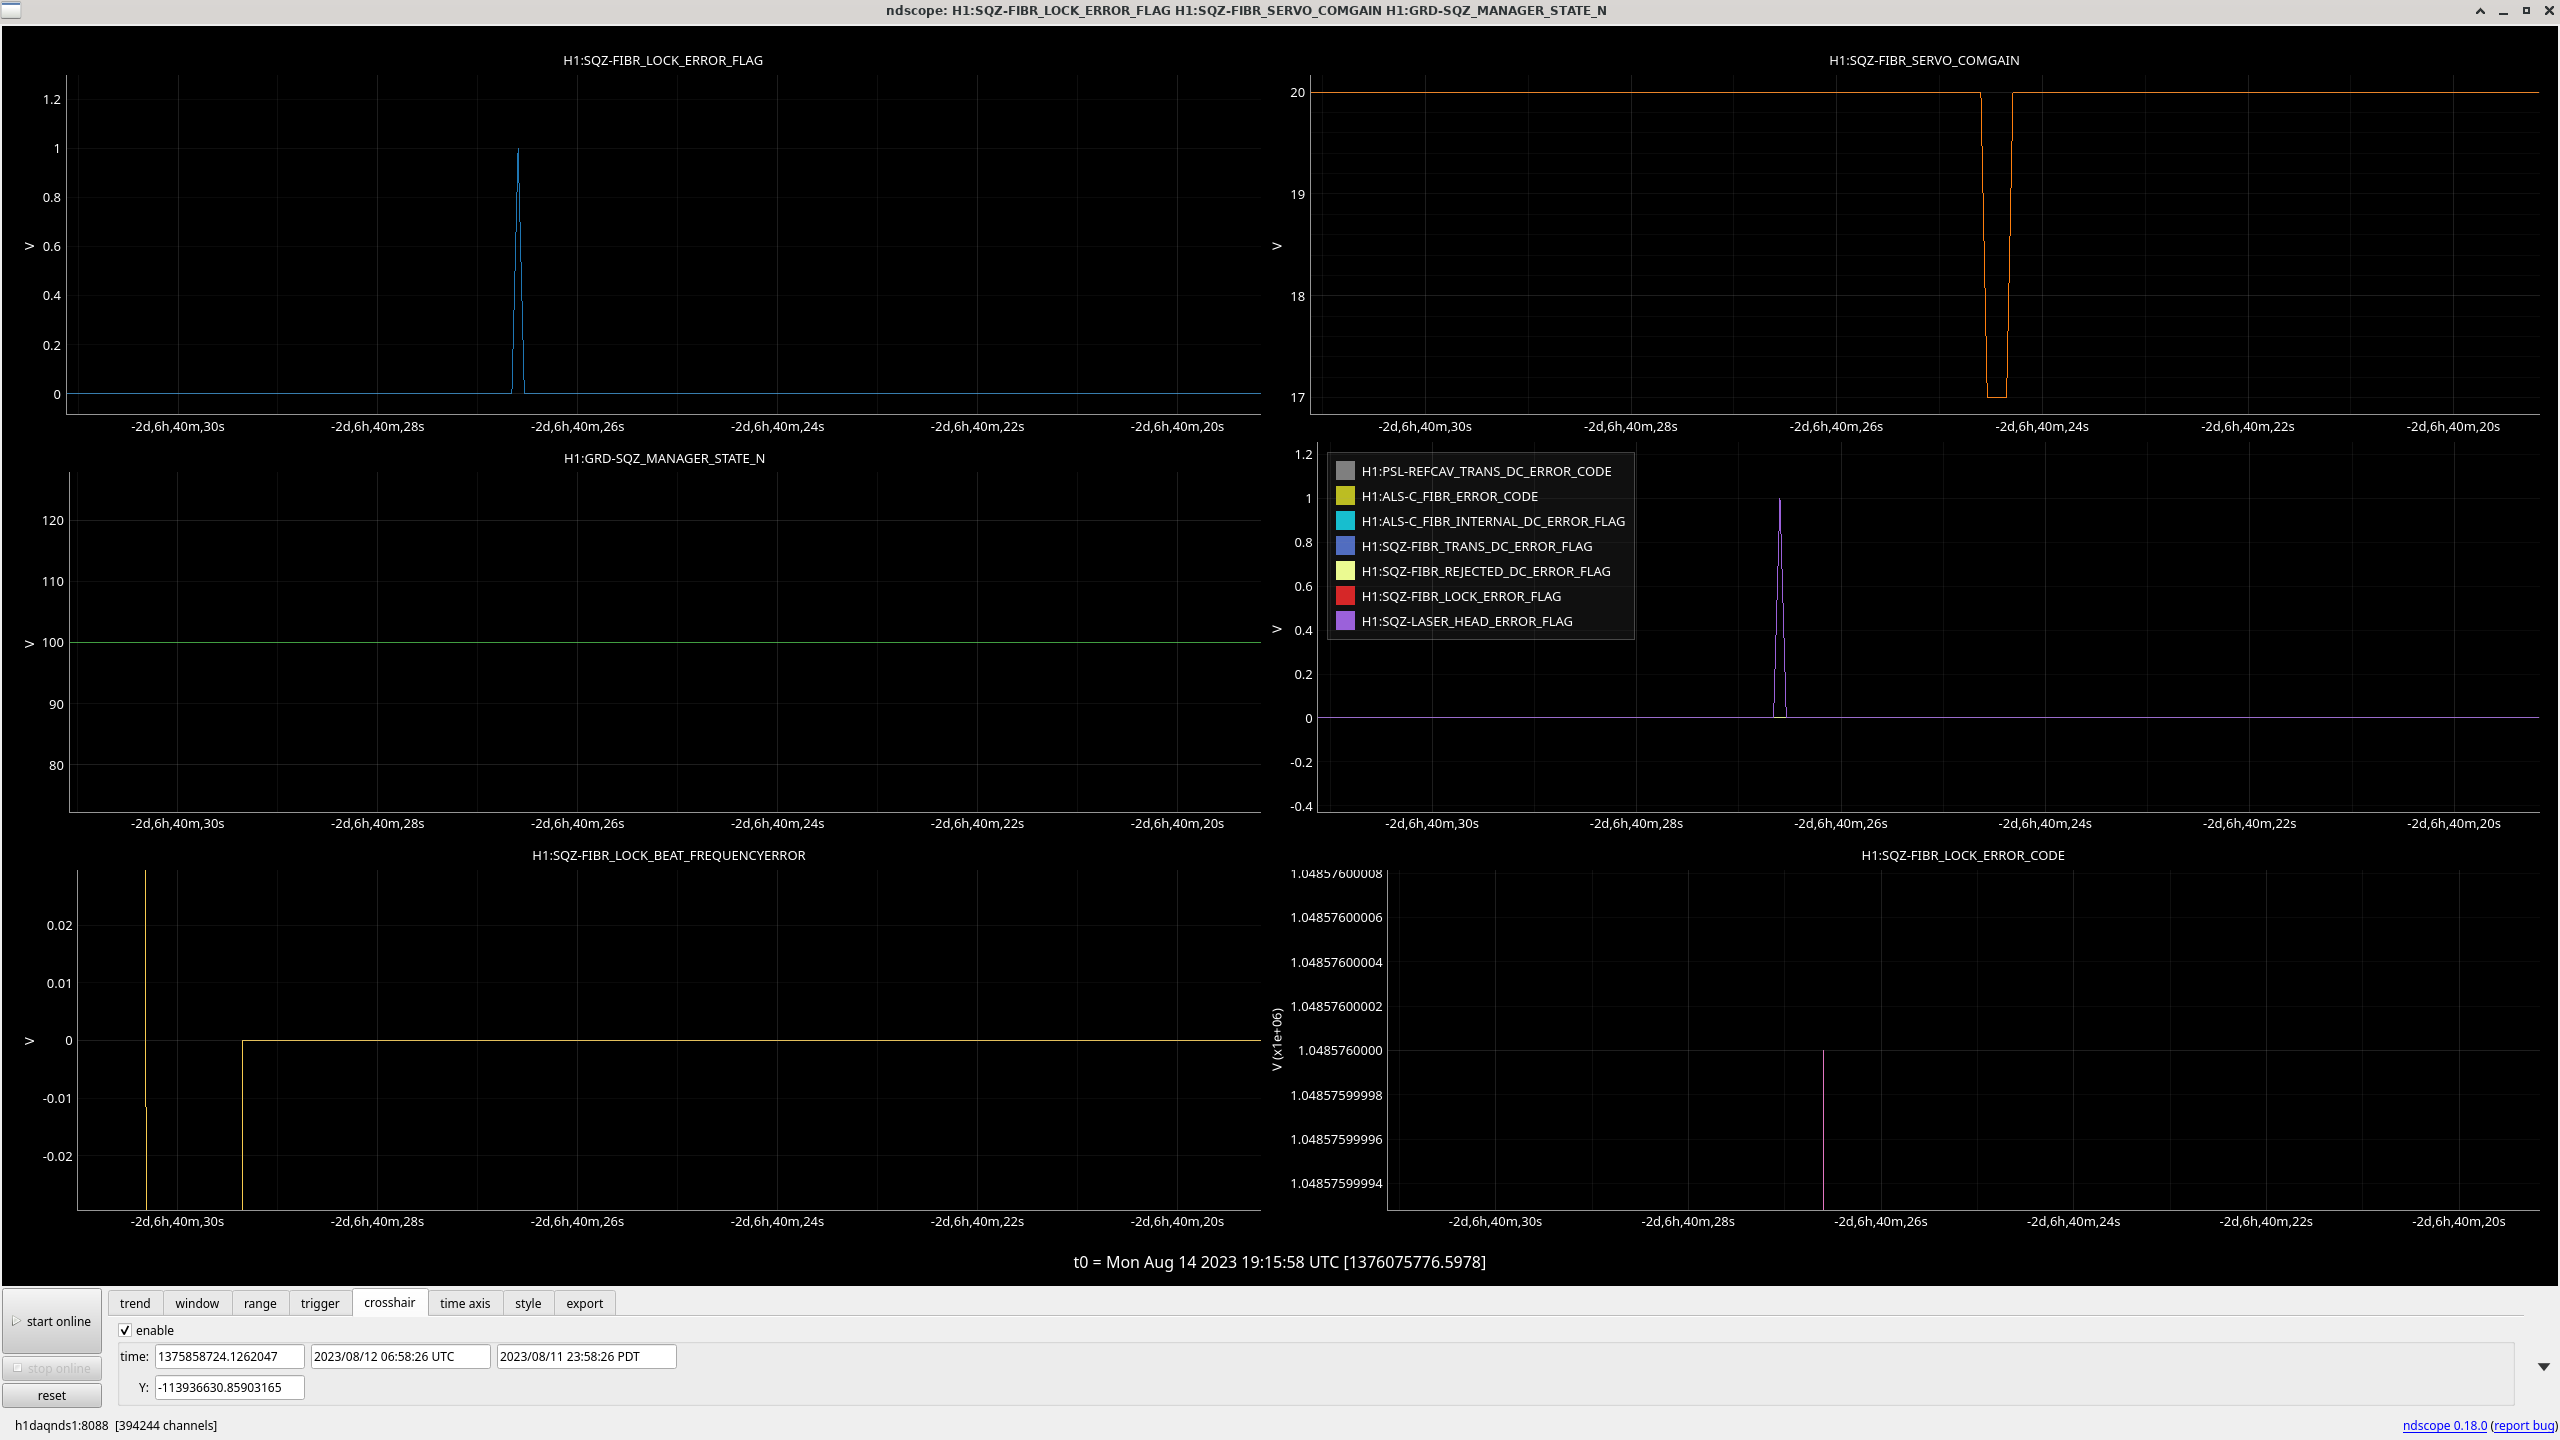
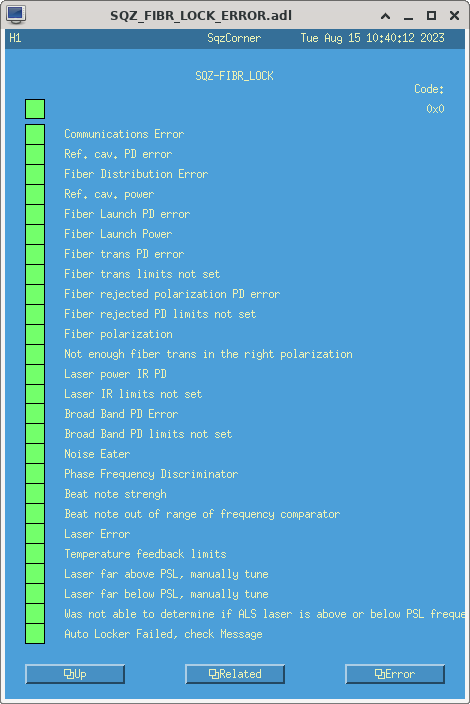
We looked at one of these incidents, to see what information we could get from the beckhoff error checking. The attached screenshot shows that when this happened on August 12th at 12:35 UTC, the beckhoff error code for the TTFSS was 2^20, counting down on the automated error screen (second attachment) the 20th error is Beatnote out of range of frequency comparator. We looked at the beatnote error epics channel, which does seem to be well within the tolerances. Daniel thinks that the error is happening faster than it can be recorded by epics. He proposes that we go into the beckhoff code and add a condition that the error condition has to be met for 0.1s before throwing the error.
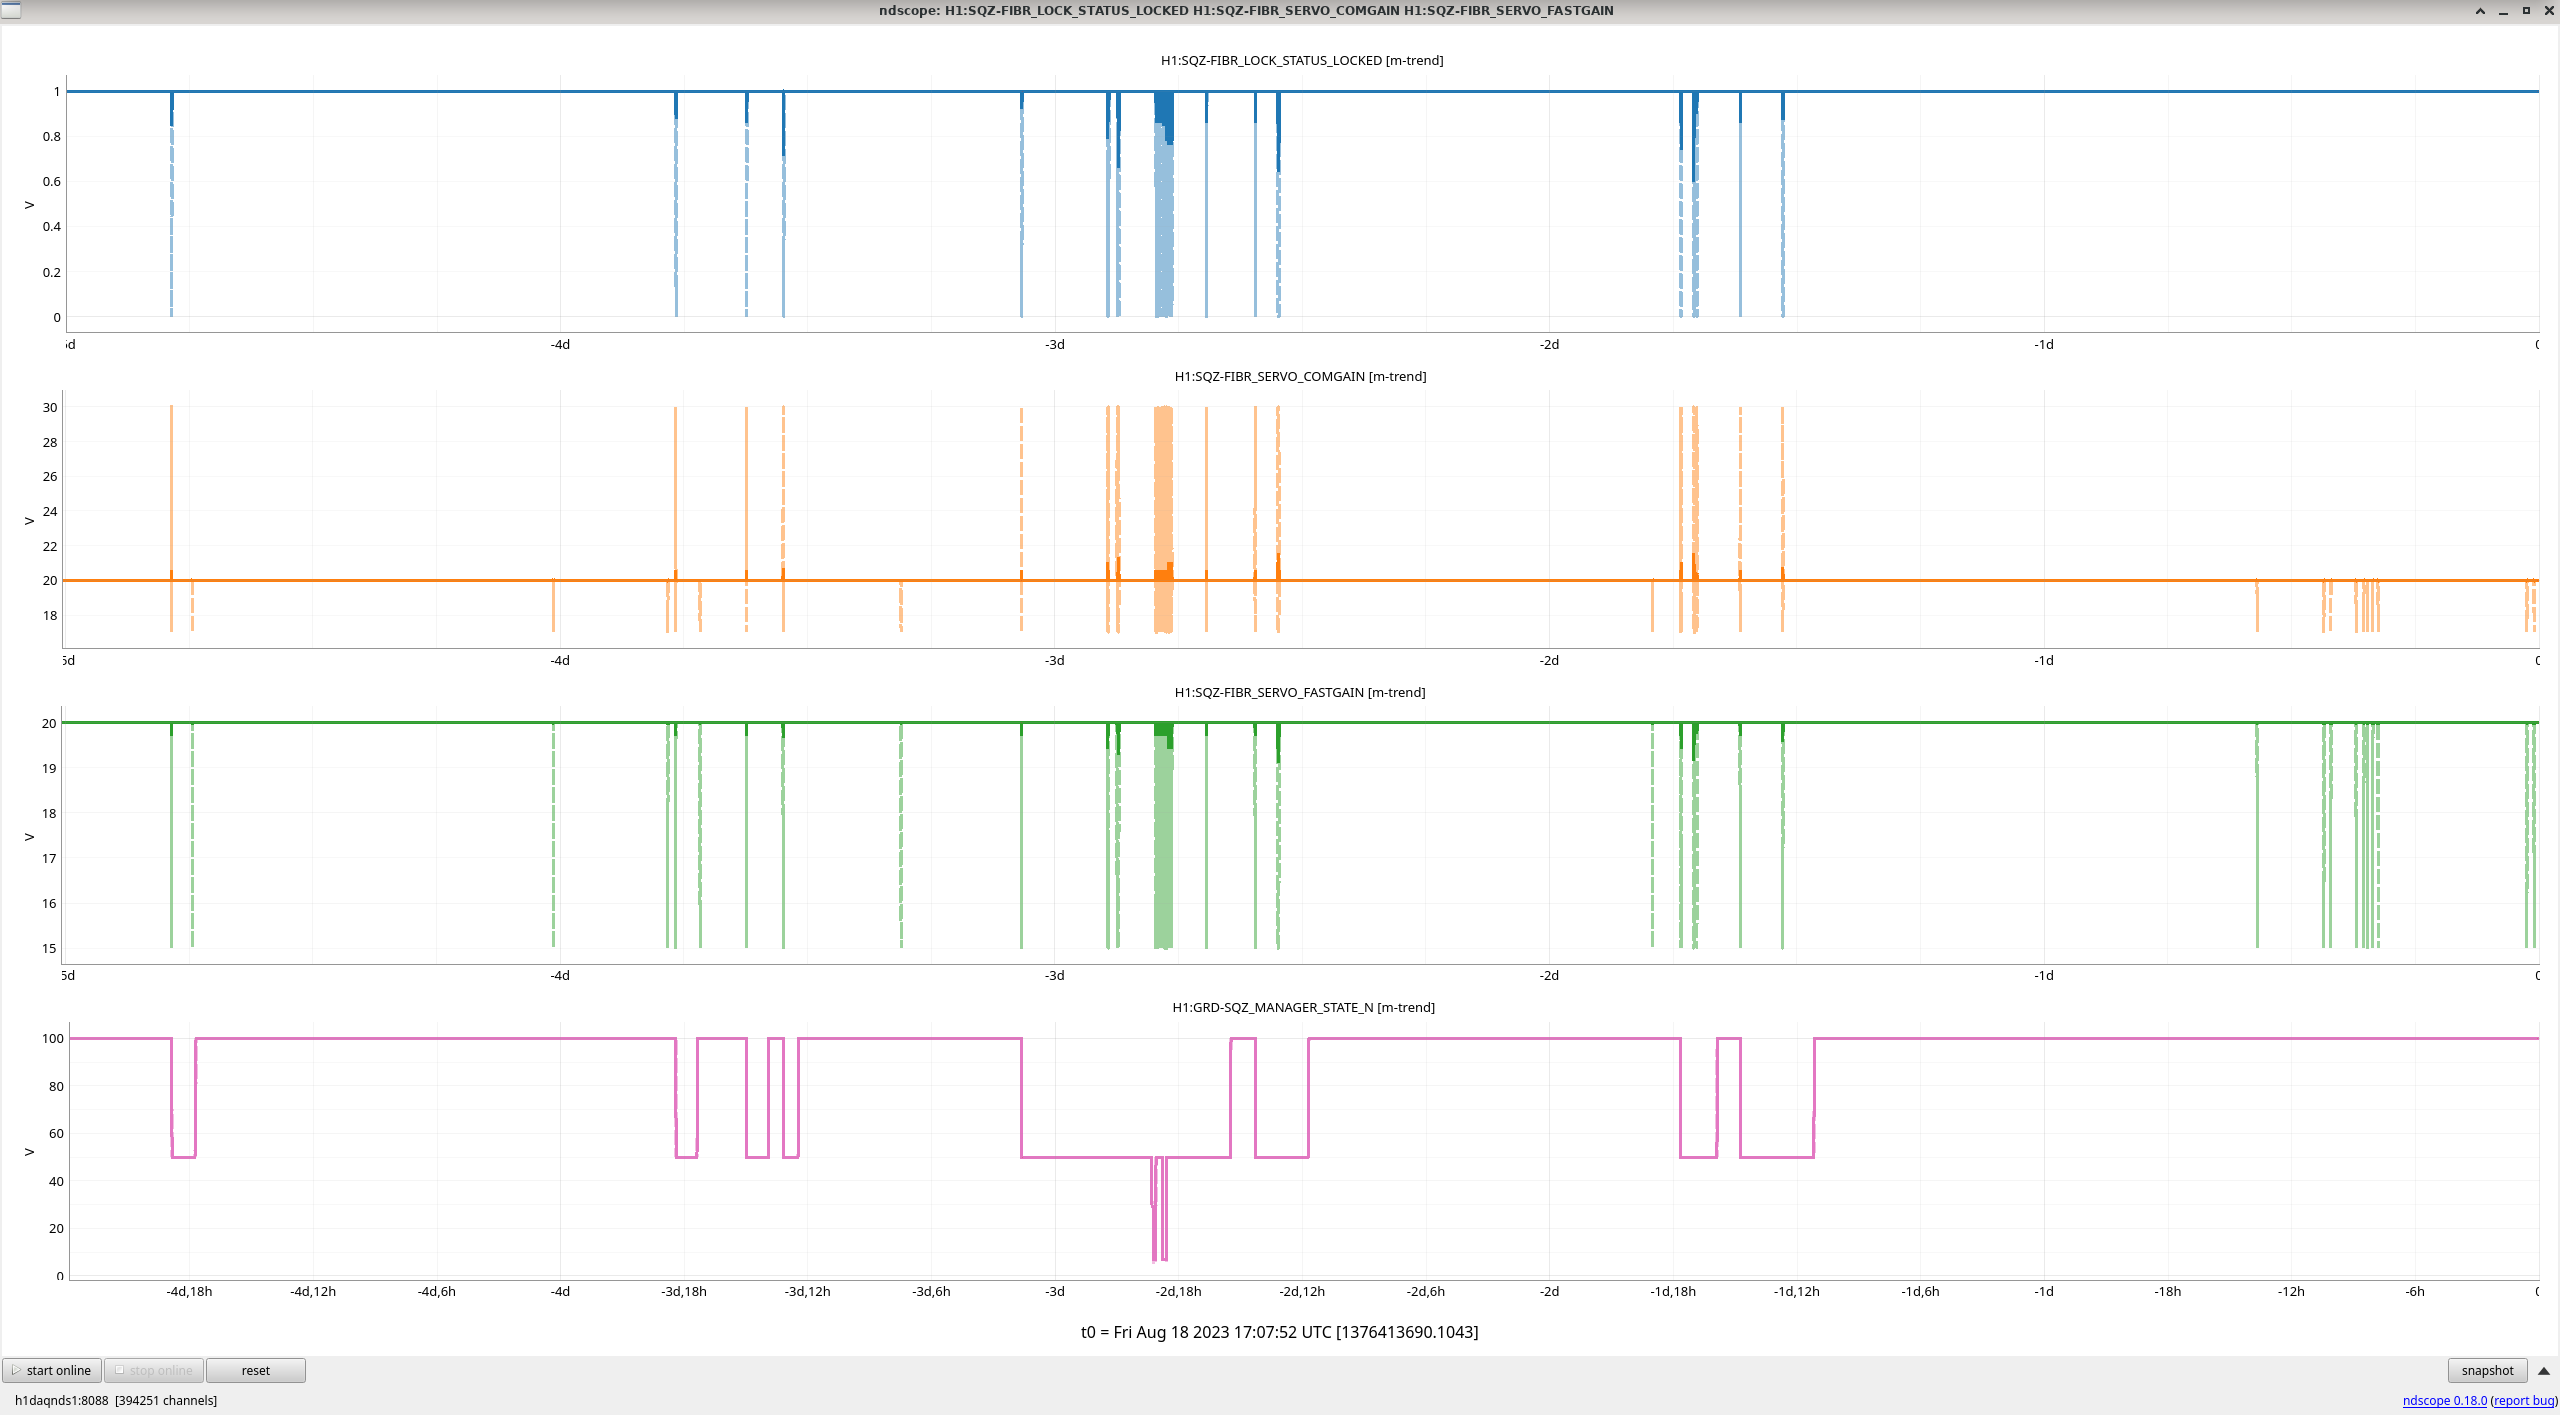
In the last 5 days these channels would have taken us out of observing 13 times if they were still monitored, plot attached. Worryingly, 9 times in the last 14 hours, see attached.
Maybe something has changed in SQZ to make the TTFSS more sensitive. The IFO has been locked for 35 hours where sometimes we get close to the edges of our PZT ranges due to temperature drifts over long locks.
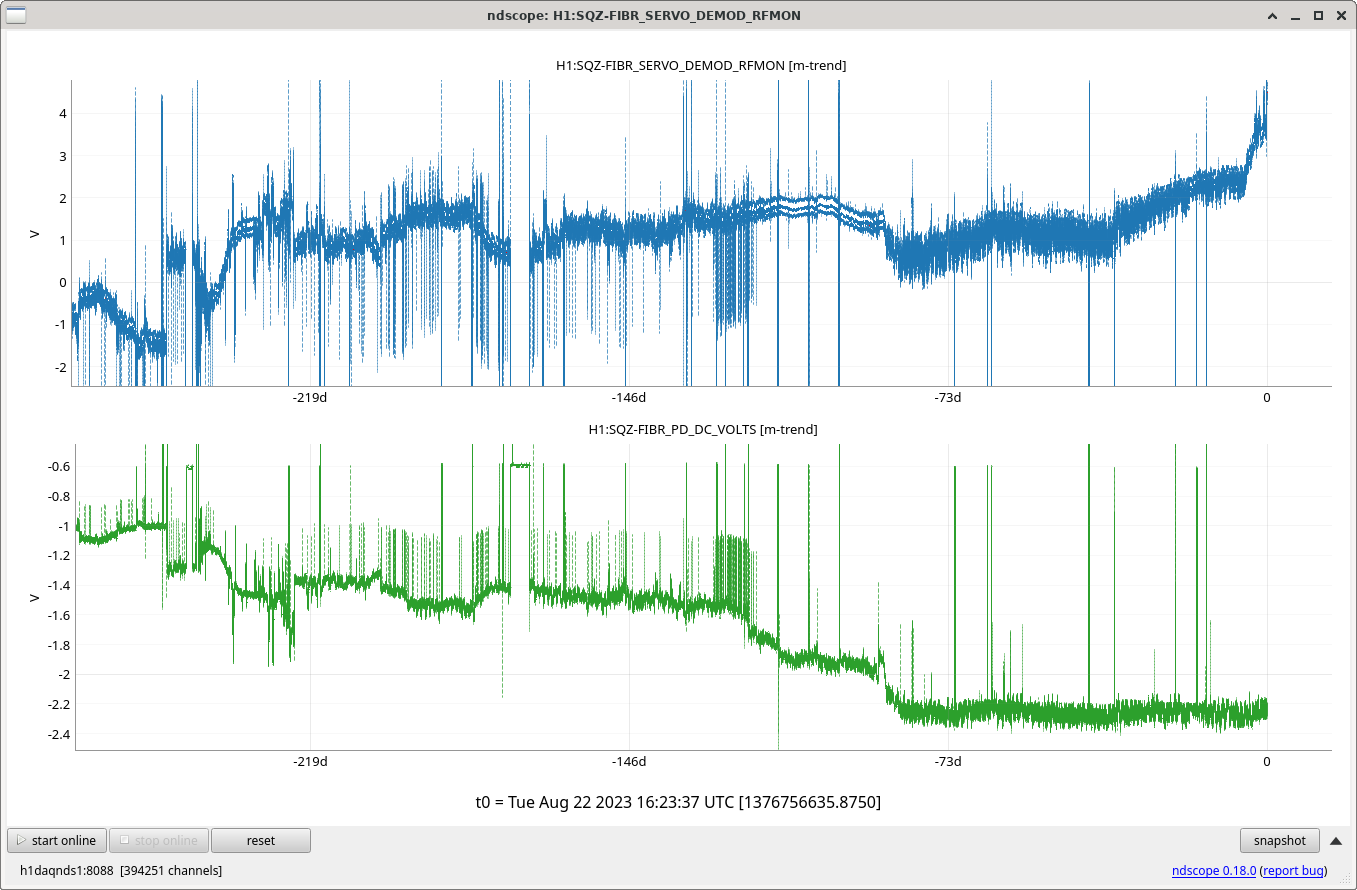
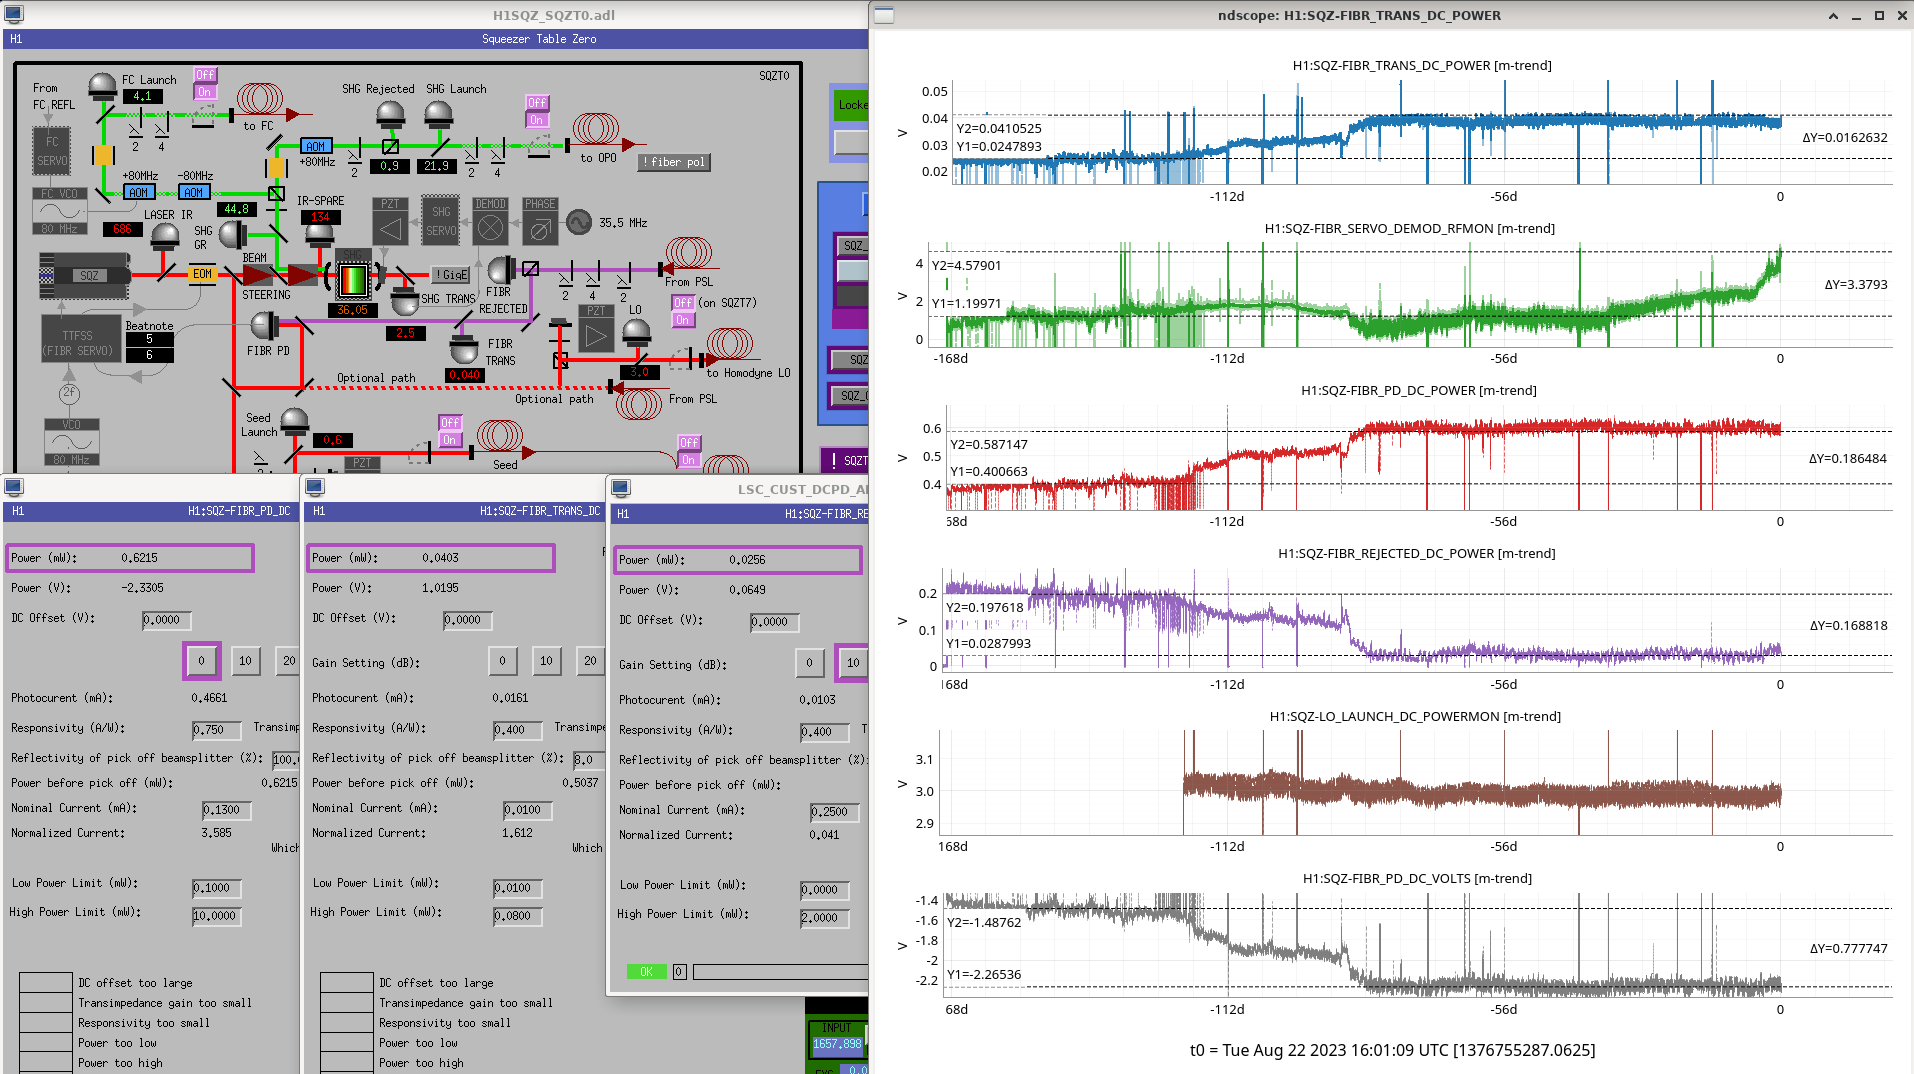
I wonder if the TTFSS 1611 PD is saturated as power from the PSL fiber has drifted. Trending RFMON and DC volts from the TTFSS PD, it looks like in the past 2-3 months, the green beatnote's demod RF MON has increased (its RF max is 7), while the bottom gray DC volts signal from the PD has flattened out around -2.3V. Also looks like the RF MON got noisier as the PD DC volts saturated.
This PD should see the 160 MHz beatnote between the PSL (via fiber) and SQZ laser (free space). From LHO:44546, it looks like this PD "normally" would have like 360uW on it, with 180uW from each arm. If we trust the PD calibrations, then current PD values report ~600uW total DC power on the 1611 PD (red), with 40uW transmitted from the PSL fiber (green trend). Pick-offs for the remaining sqz laser free-space path (iem sqz laser seed/LO PDs) don't see power changes, so unlikely the saturations are coming from upstream sqz laser alignment. Not sure if there's some PD calibration issues going on here. In any case, all fiber PDs seem to be off from their nominal values, consistent with their drifts in the past few months.
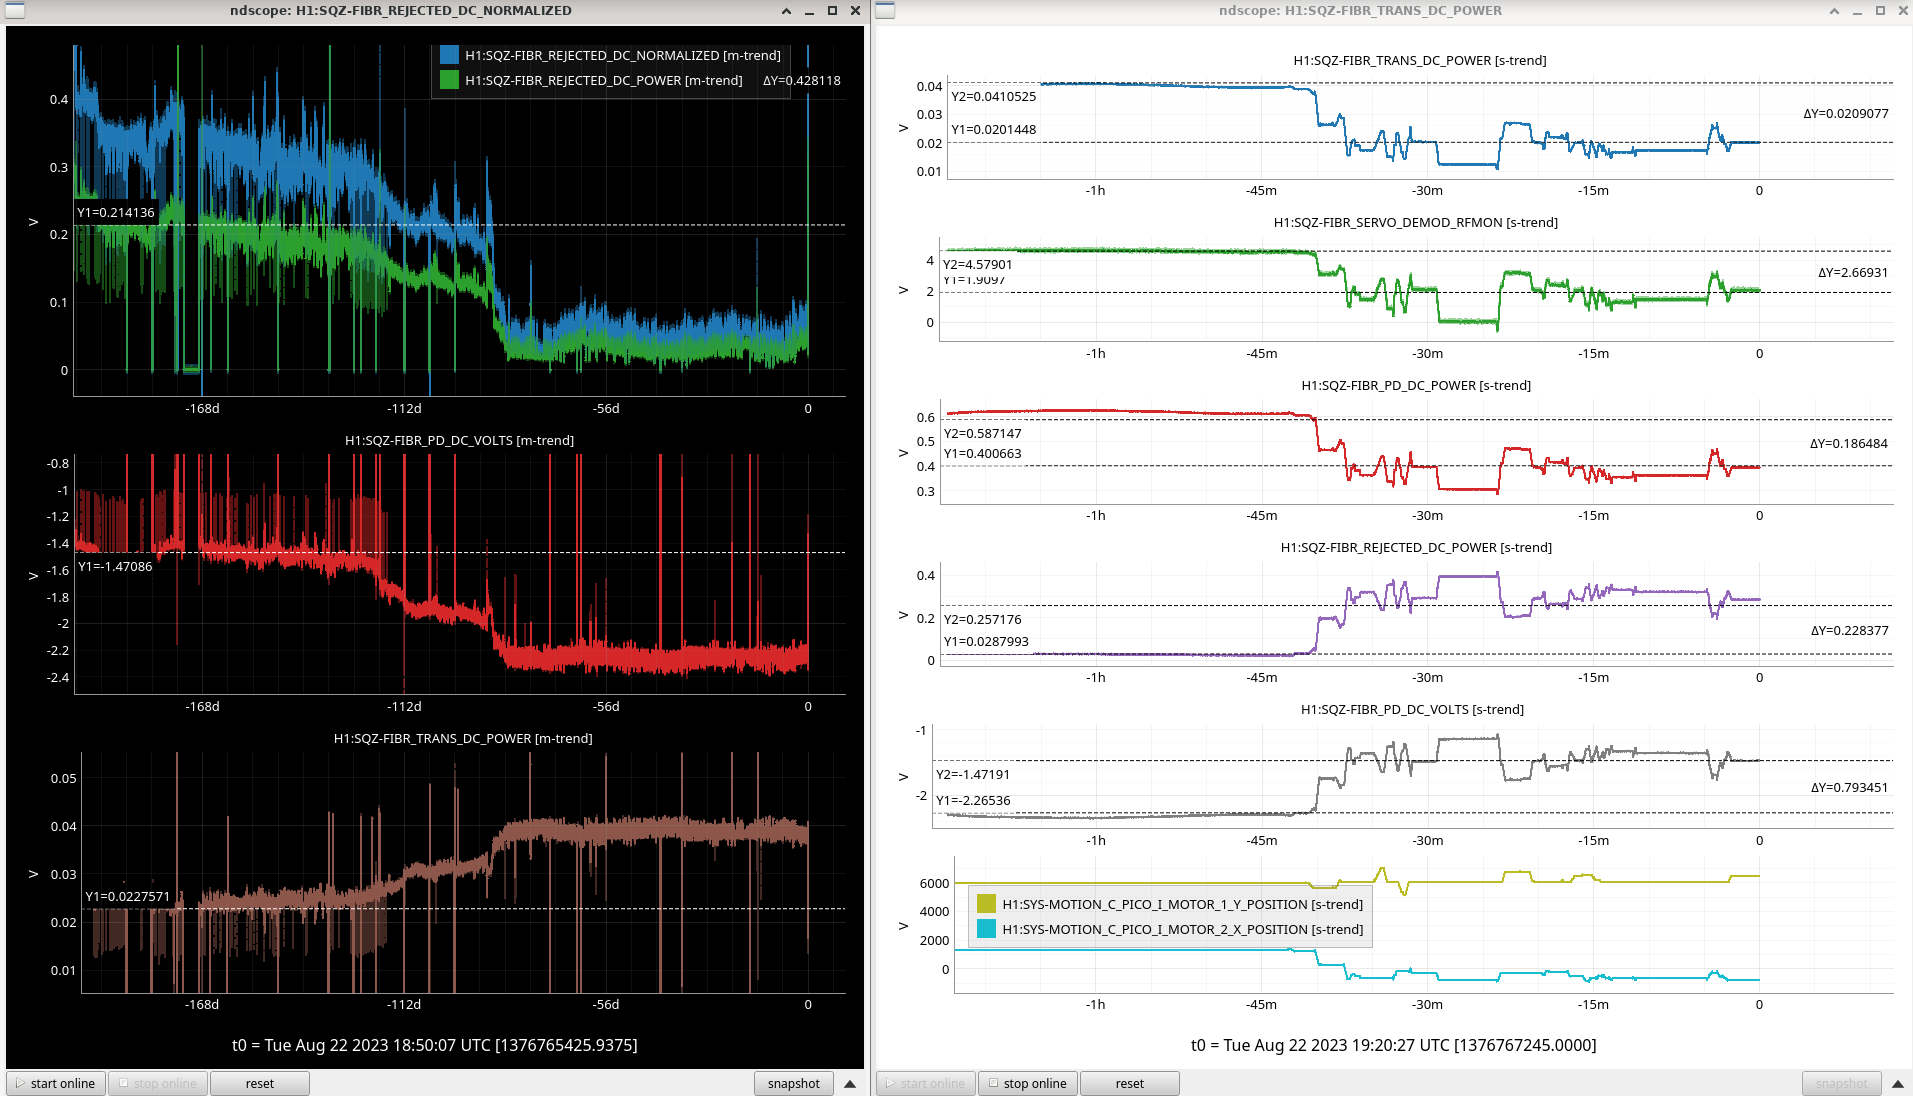
I adjusted the TTFSS waveplates on the PSL fiber path to bring the FIBR PDs closer to their nominal values, and at least so we're not saturing the 1611. TTFSS and squeezer locks seem to have come back fine. We can see if this helps the SDF issues at all.
These were re-monitored in 72679 after Daniel adjusted the SQZ Laser Diode Nominal Current, stopping this issue.
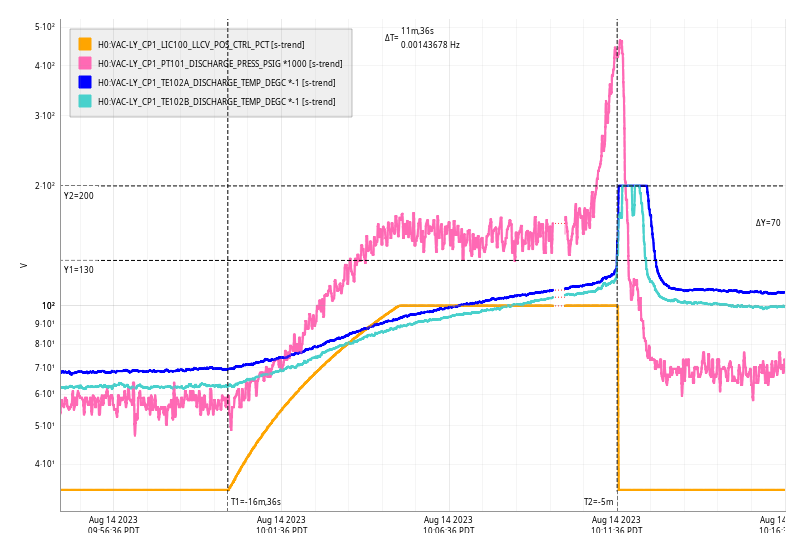
Mon Aug 14 10:11:36 2023 INFO: Fill completed in 11min 32secs
Gerardo confirmed a good fill curbside.
H1 has dropped out of observing as of 16:38 UTC for opportunistic commissioning activities since L1 is down for logging.
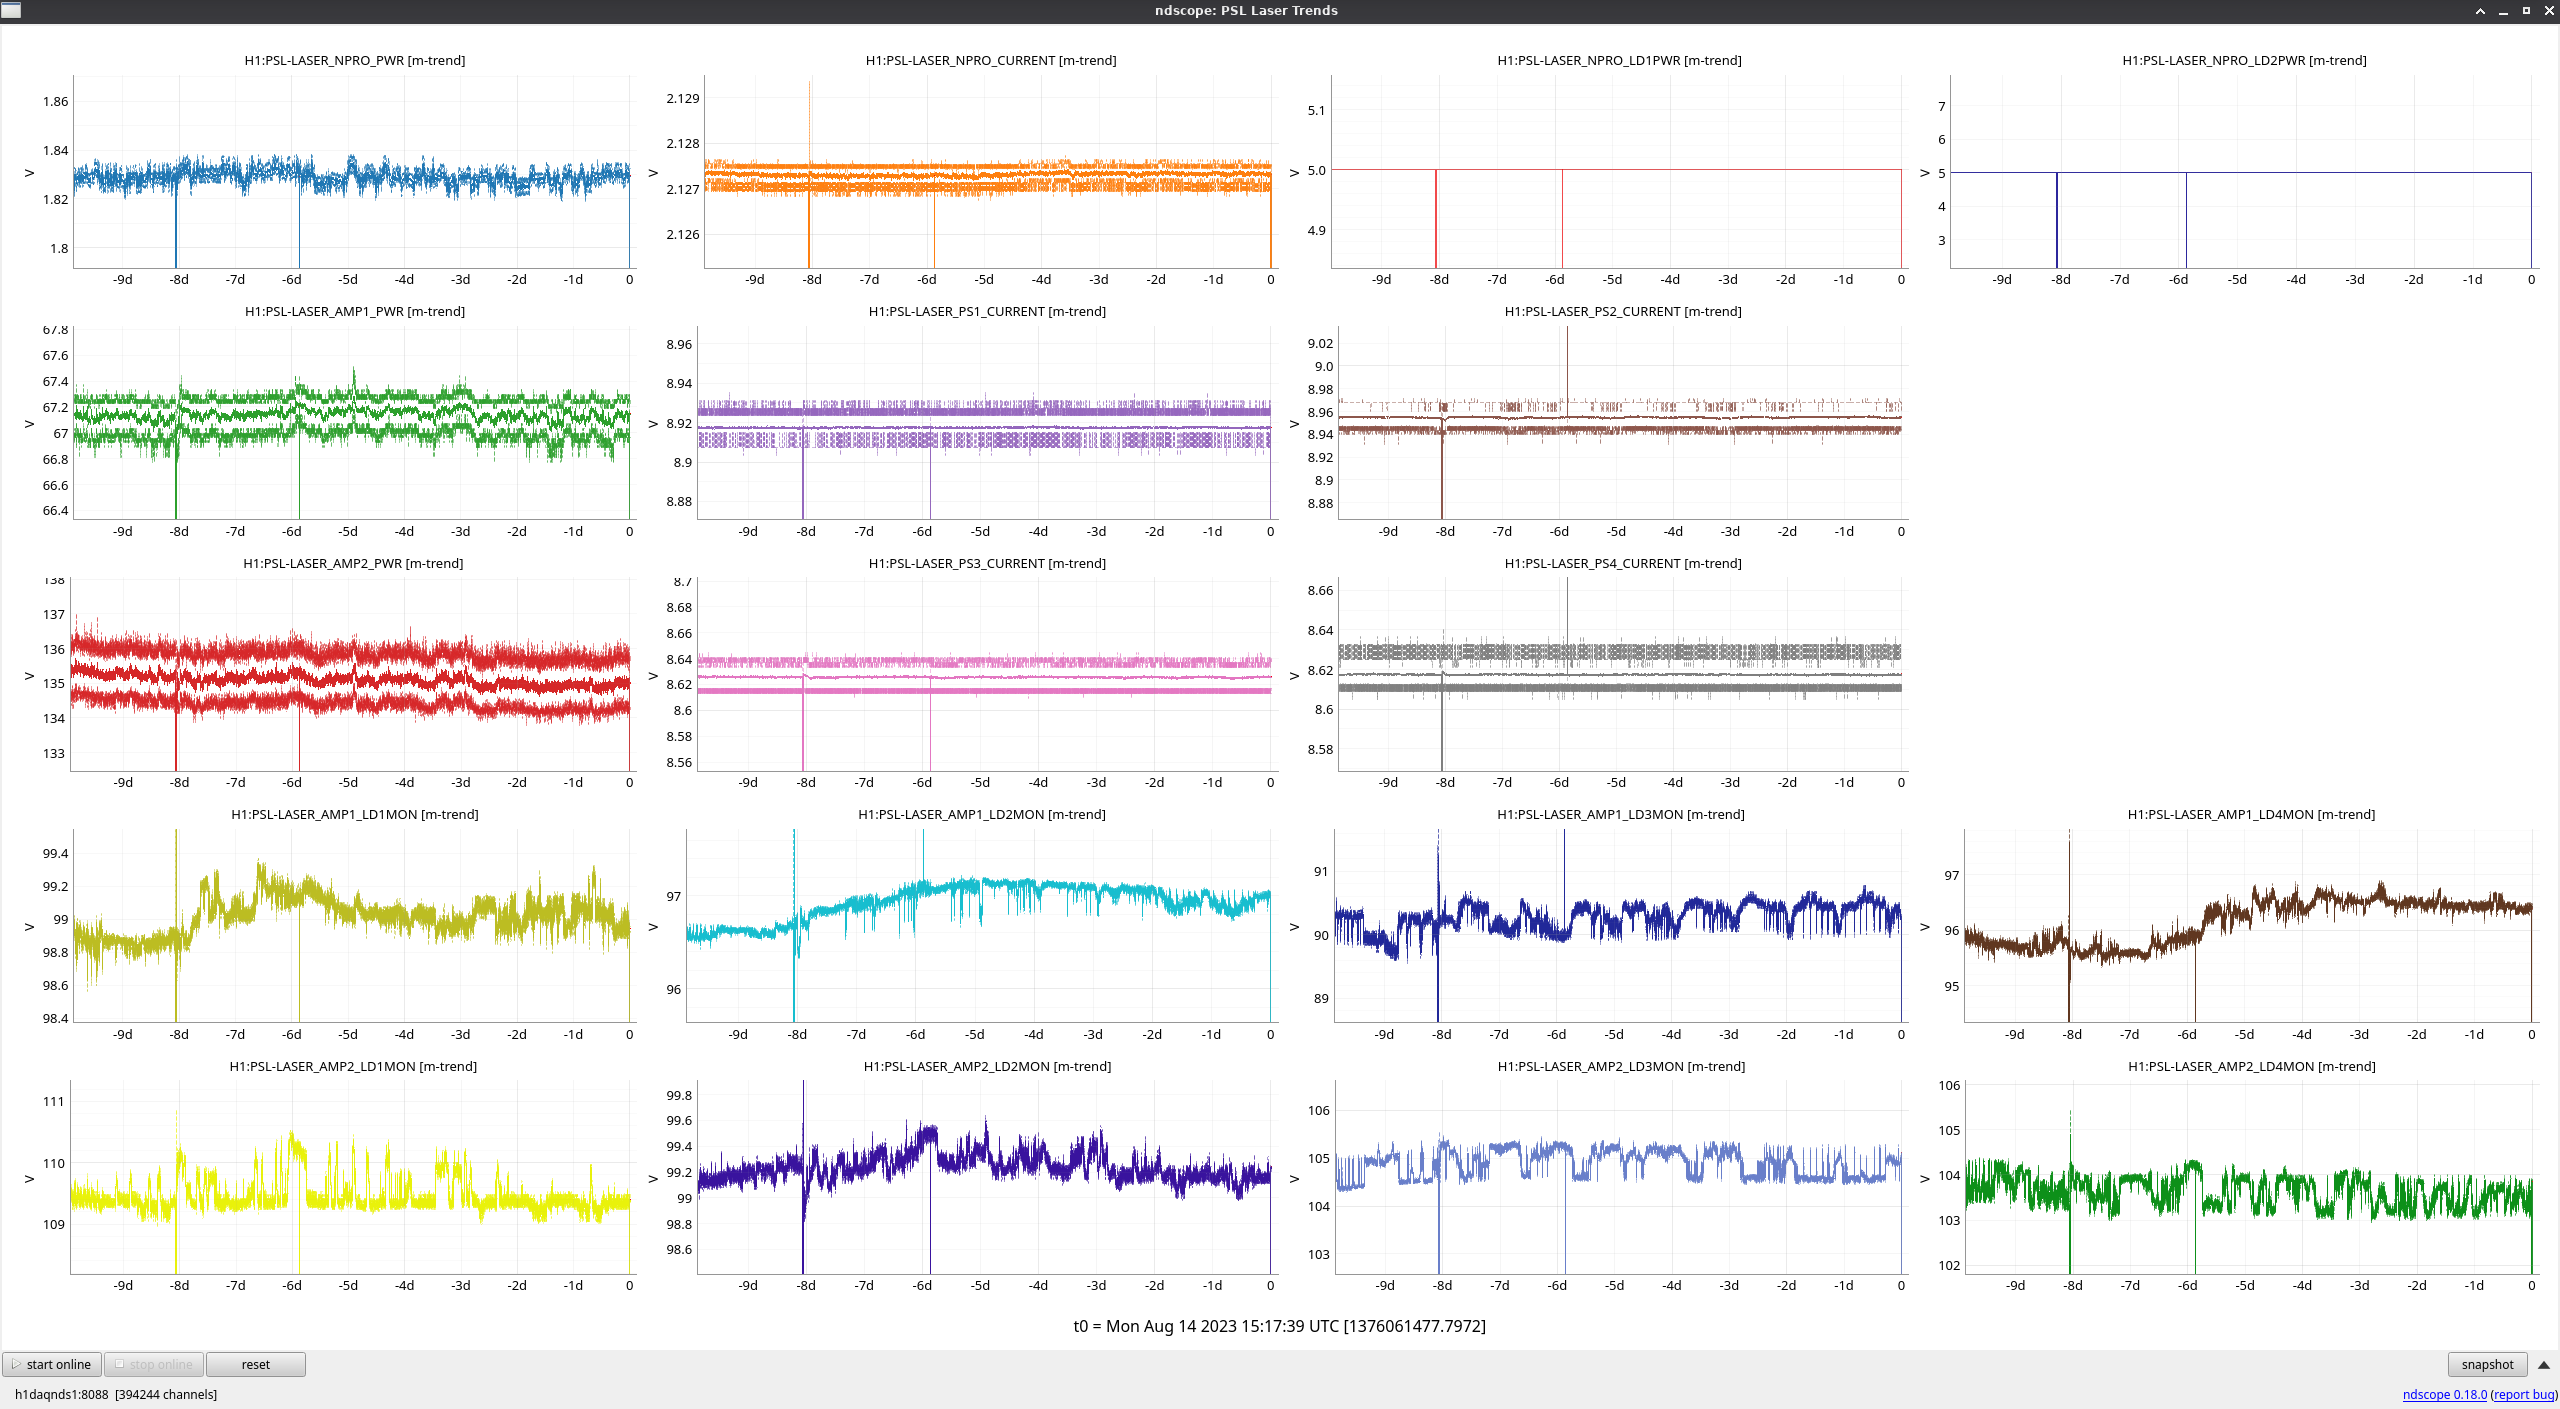
FAMIS 19989
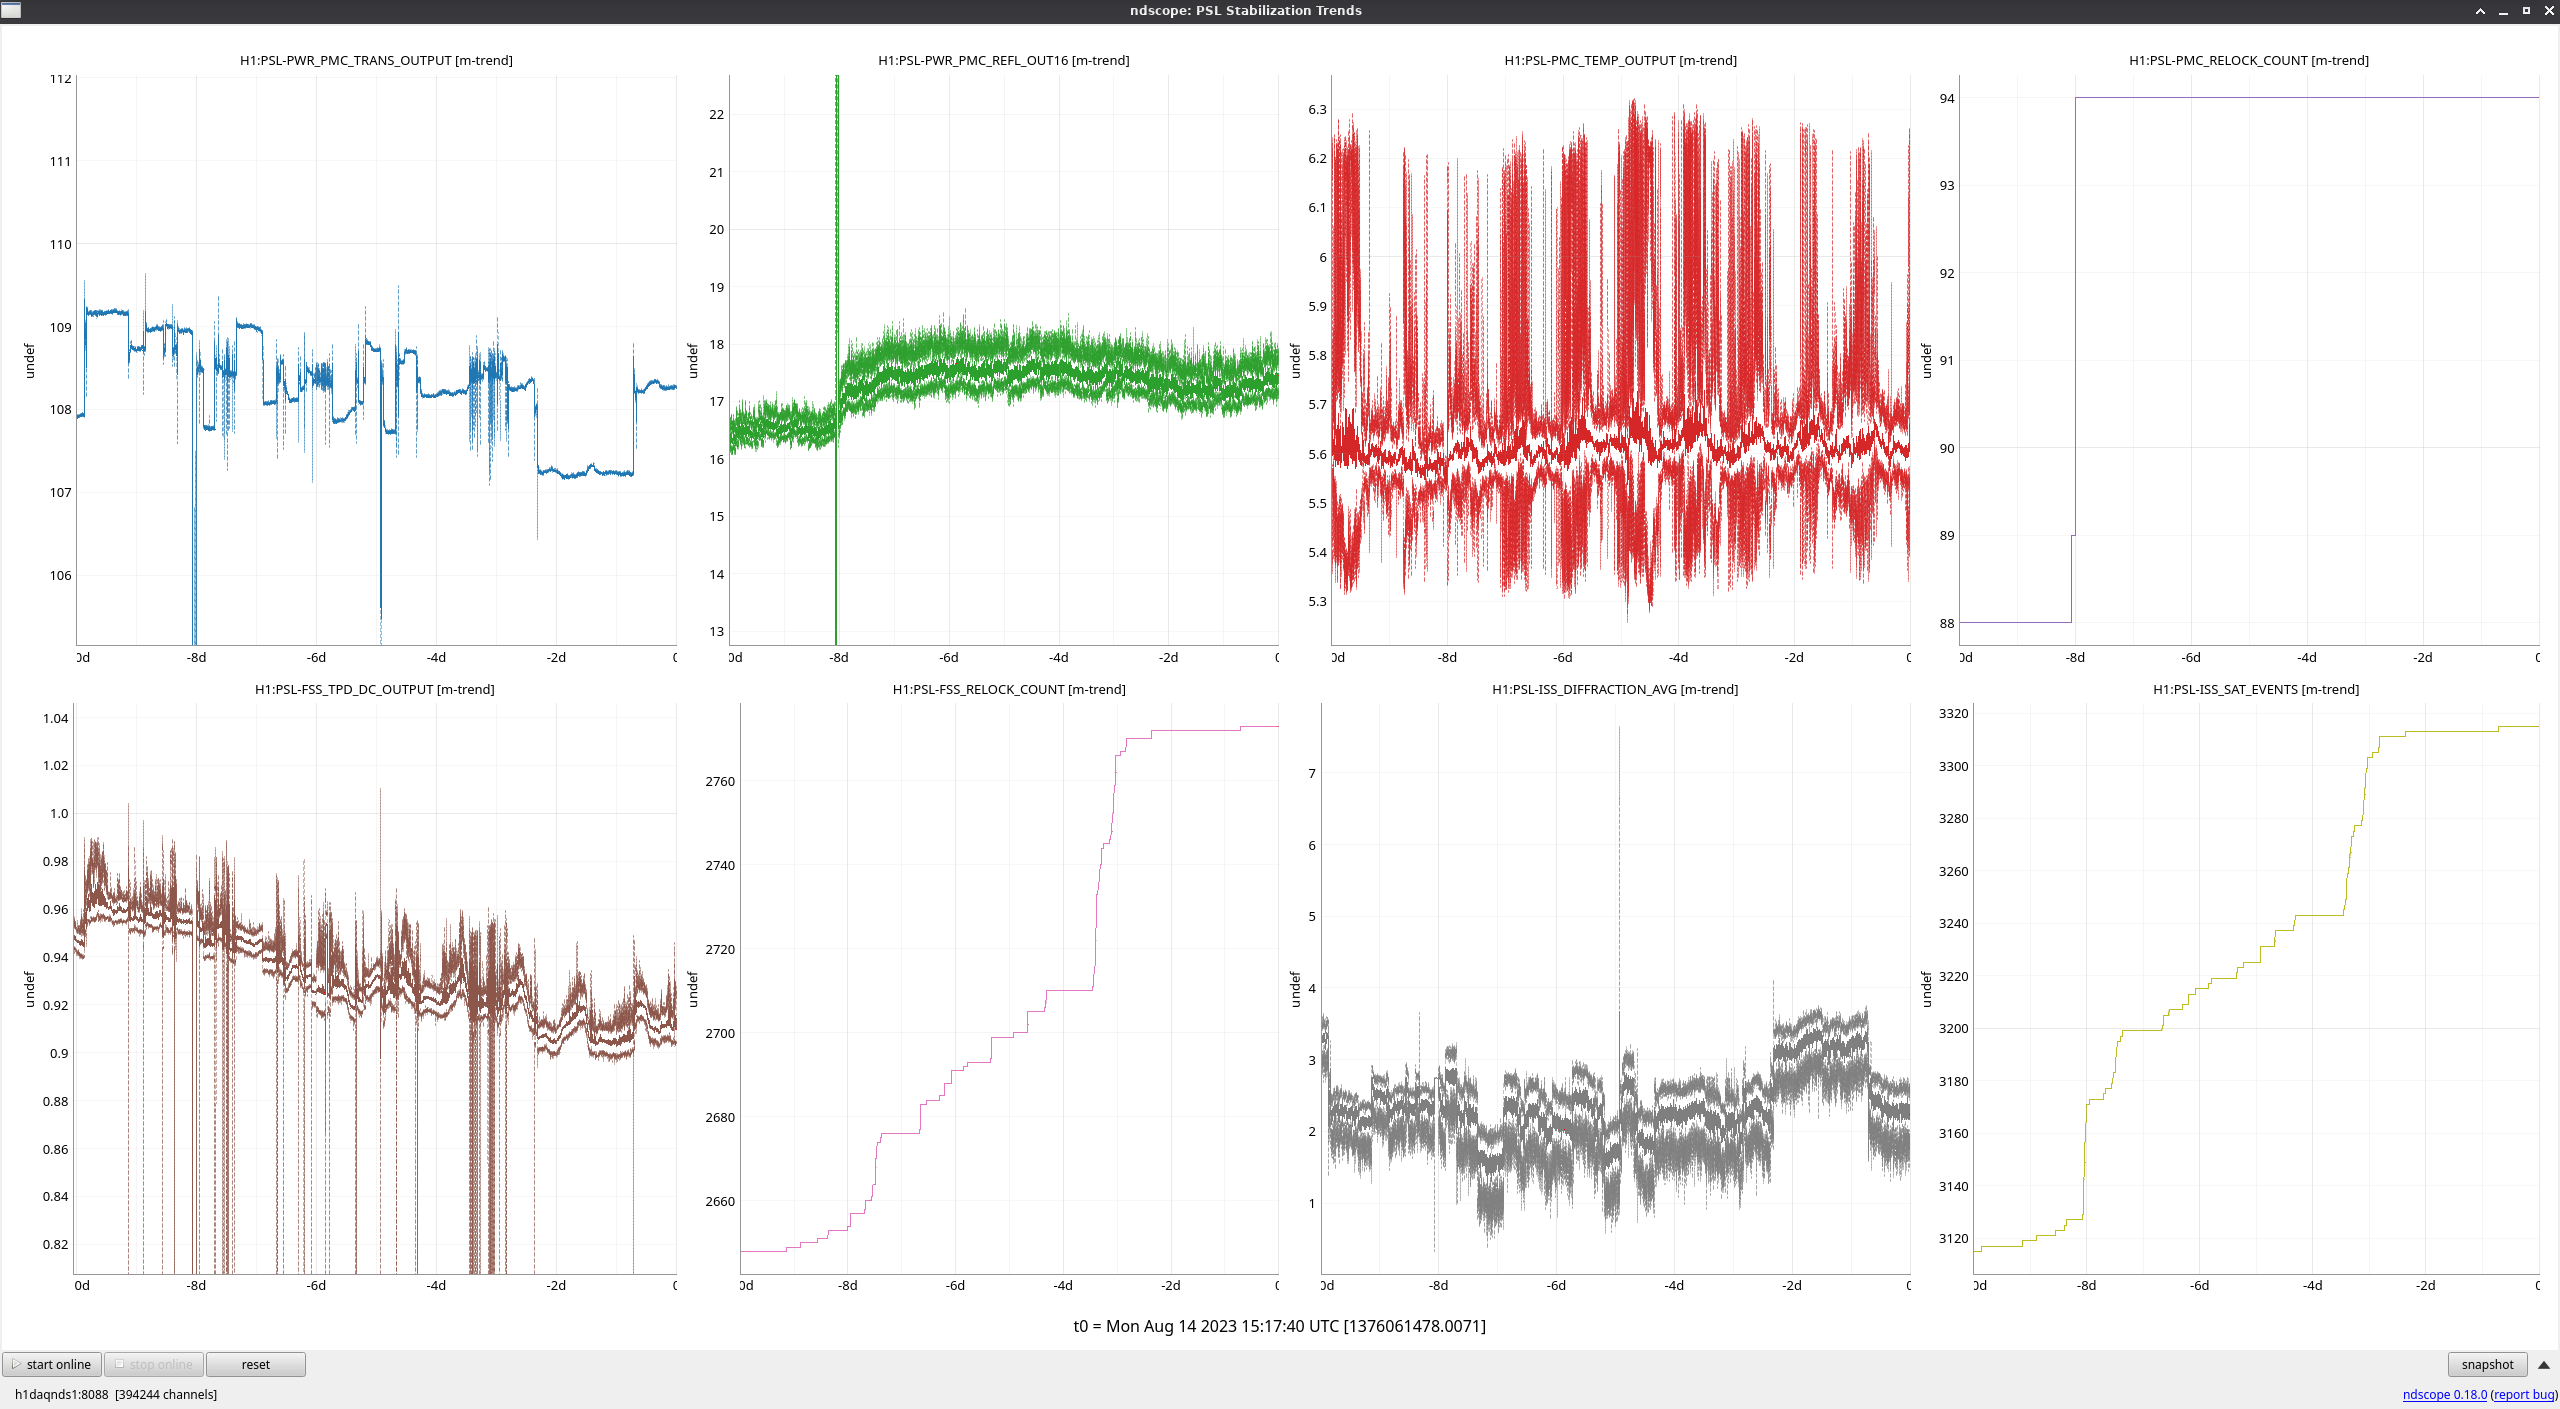
No major events of note this week, although the FSS TPD voltage is trending downwards. Not too bad yet, but I'll monitor and see if it needs a realignment soon.
TITLE: 08/14 Day Shift: 15:00-23:00 UTC (08:00-16:00 PST), all times posted in UTC
STATE of H1: Observing at 153Mpc
OUTGOING OPERATOR: Austin
CURRENT ENVIRONMENT:
SEI_ENV state: EARTHQUAKE
Wind: 6mph Gusts, 4mph 5min avg
Primary useism: 0.23 μm/s
Secondary useism: 0.17 μm/s
QUICK SUMMARY: H1 has been locked for 15.5 hours. Currently riding through a 6.2-magnitude earthquake from Guam.
TITLE: 08/14 Eve Shift: 23:00-07:00 UTC (16:00-00:00 PST), all times posted in UTC
STATE of H1: Observing at 150Mpc
INCOMING OPERATOR: Austin
SHIFT SUMMARY: We were able to relock without issue and are 7hrs 38mins into the Lock.
23:00 Detector relocking from earlier lockloss (72181)
23:25 Reached NOMINAL_LOW_NOISE
23:26:30 & 23:26:40 PI 31 notification on Verbals - damped quickly by Guardian
23:33 Into Observing
23:39 RO WS Major Alarm - contacted Richard
LOG:
no log
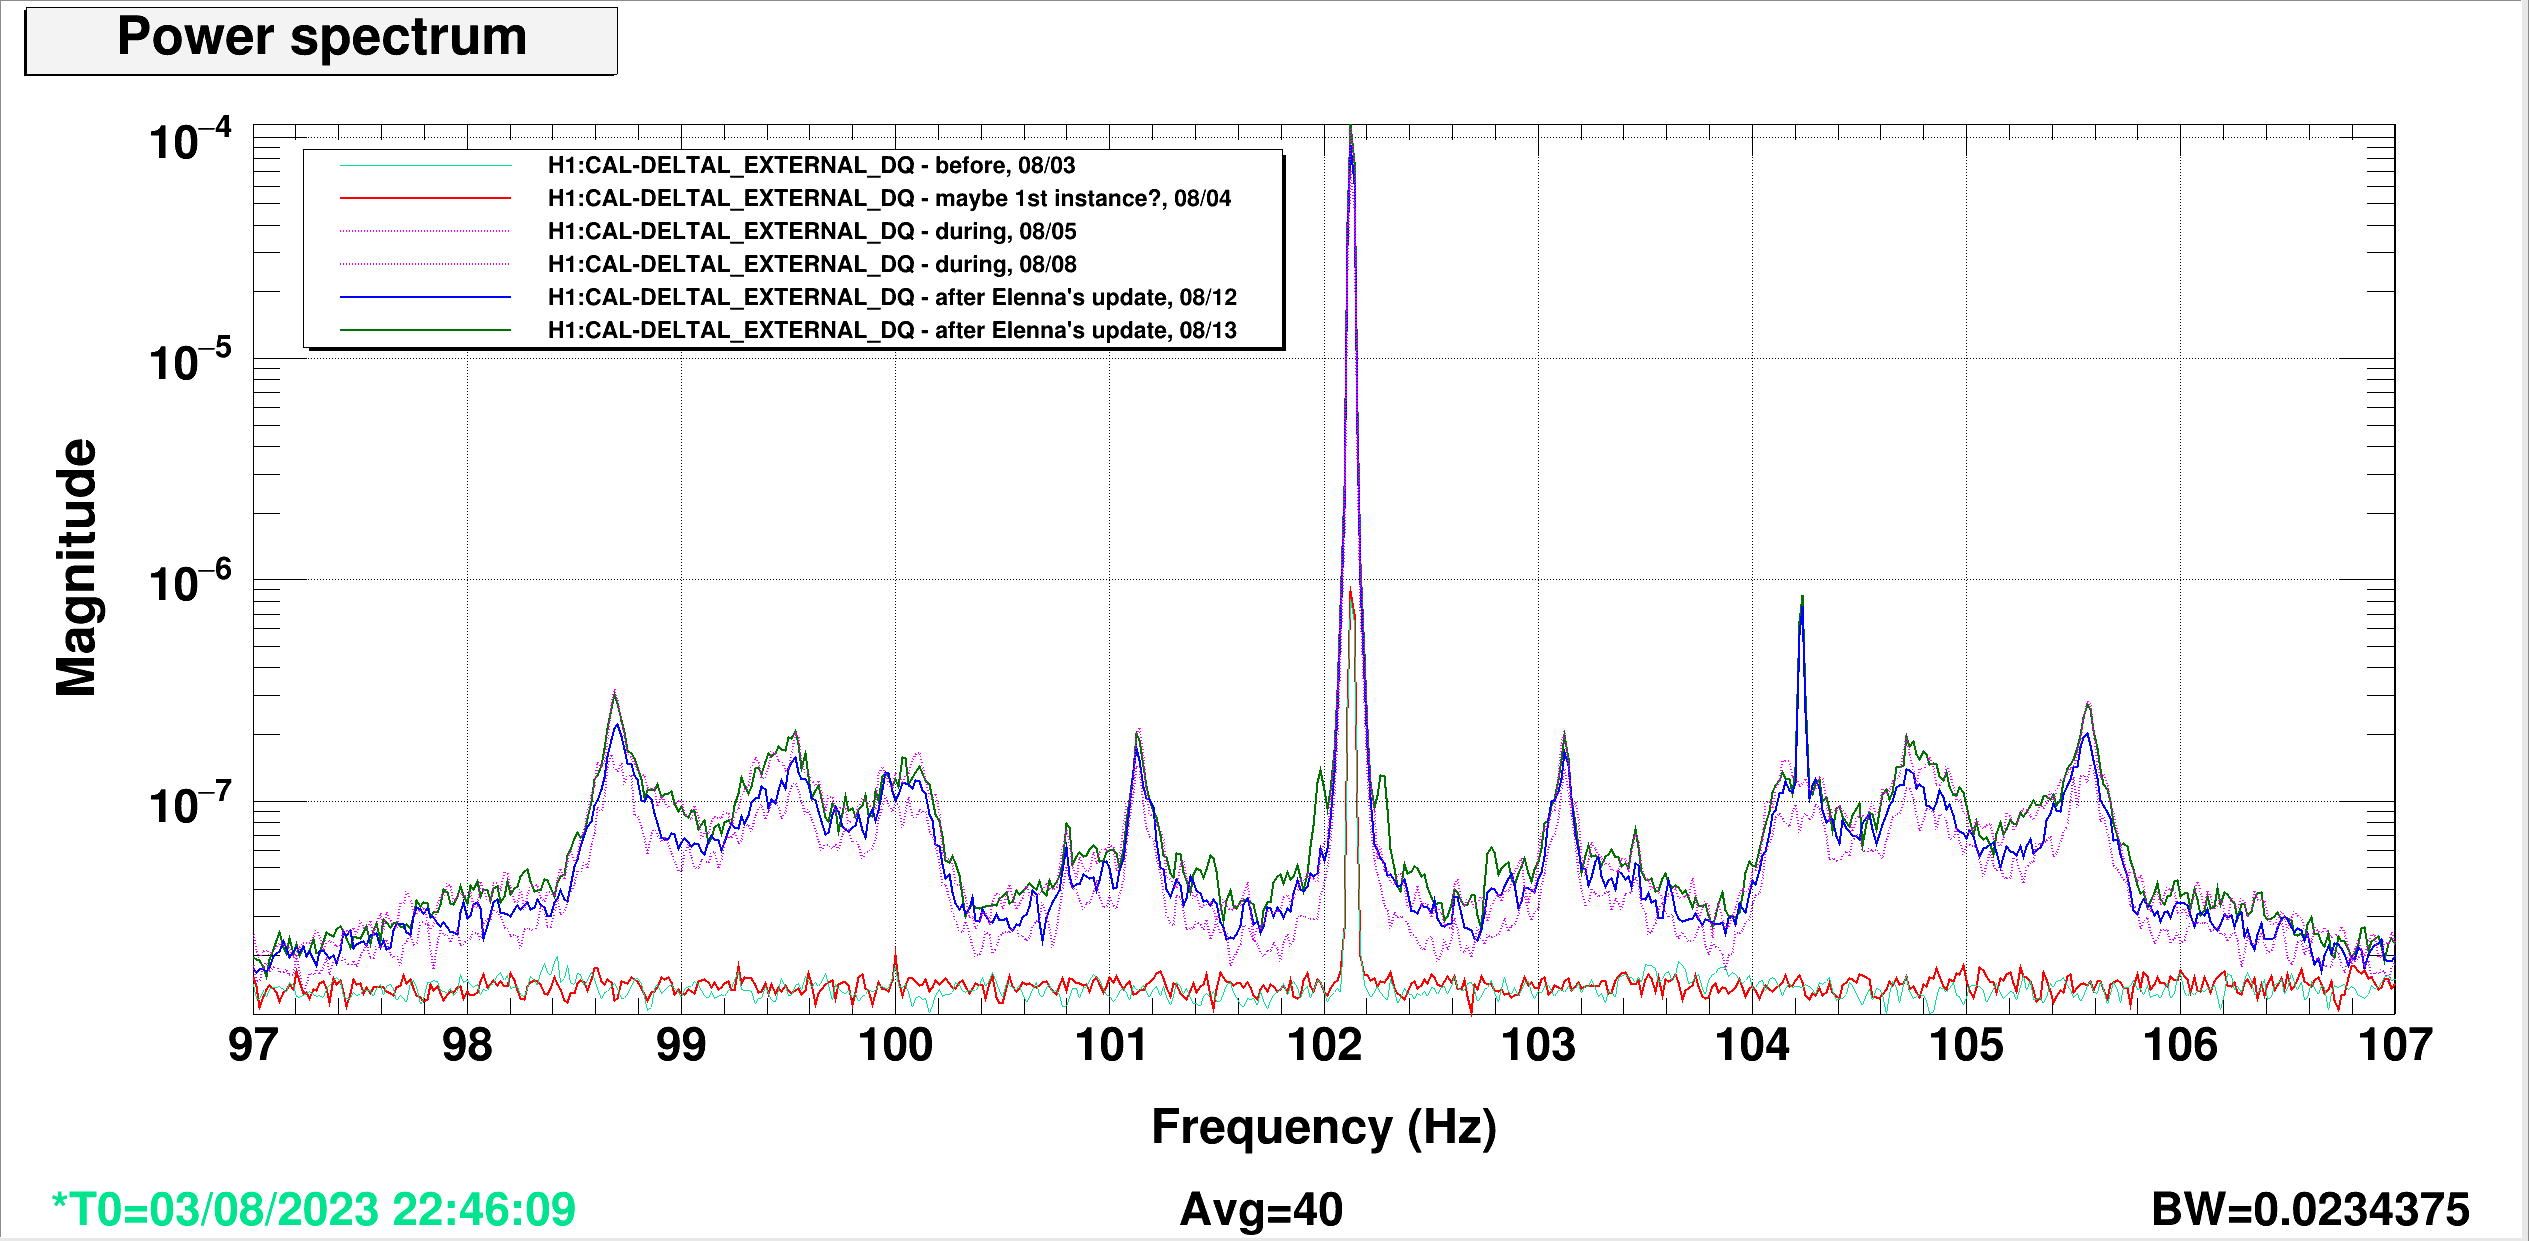
We've now had two locklosses since Elenna updated the LSC FF filter ramp times (72163) on 8/11 in the hopes of getting rid of the 102Hz peak (72064) that appeared on 8/4 or 8/5, so I checked out the NOLINES plot on the summary pages to see if it had changed anything.
Relocking from both of the locklosses on 8/12 and 8/13, we can still see the line at 102Hz is still there (attachment1), and I plotted some times(attachment2) to more directly see if the change in ramp time had affected the peak at all, but it looks like it didn't.
Got back into NOMINAL_LOW_NOISE at 23:25UTC from the lockloss that occurred during Ryan S's shift, and entered Observing at 23:33UTC.
We've currently been Locked for almost 4 hours.
TITLE: 08/13 Eve Shift: 23:00-07:00 UTC (16:00-00:00 PST), all times posted in UTC
STATE of H1: Lock Acquisition
OUTGOING OPERATOR: Ryan S
CURRENT ENVIRONMENT:
SEI_ENV state: CALM
Wind: 13mph Gusts, 10mph 5min avg
Primary useism: 0.03 μm/s
Secondary useism: 0.18 μm/s
QUICK SUMMARY:
Taking over from Ryan S. Detector is in the last stages of relocking, at MAX_POWER.
TITLE: 08/13 Day Shift: 15:00-23:00 UTC (08:00-16:00 PST), all times posted in UTC
STATE of H1: Lock Acquisition
INCOMING OPERATOR: Oli
SHIFT SUMMARY: Very quiet shift until near the end when H1 lost lock after 38.5 hours.
Handing off to Oli with H1 relocking automatically, currently up to MOVE_SPOTS.
LOG:
No log for this shift.
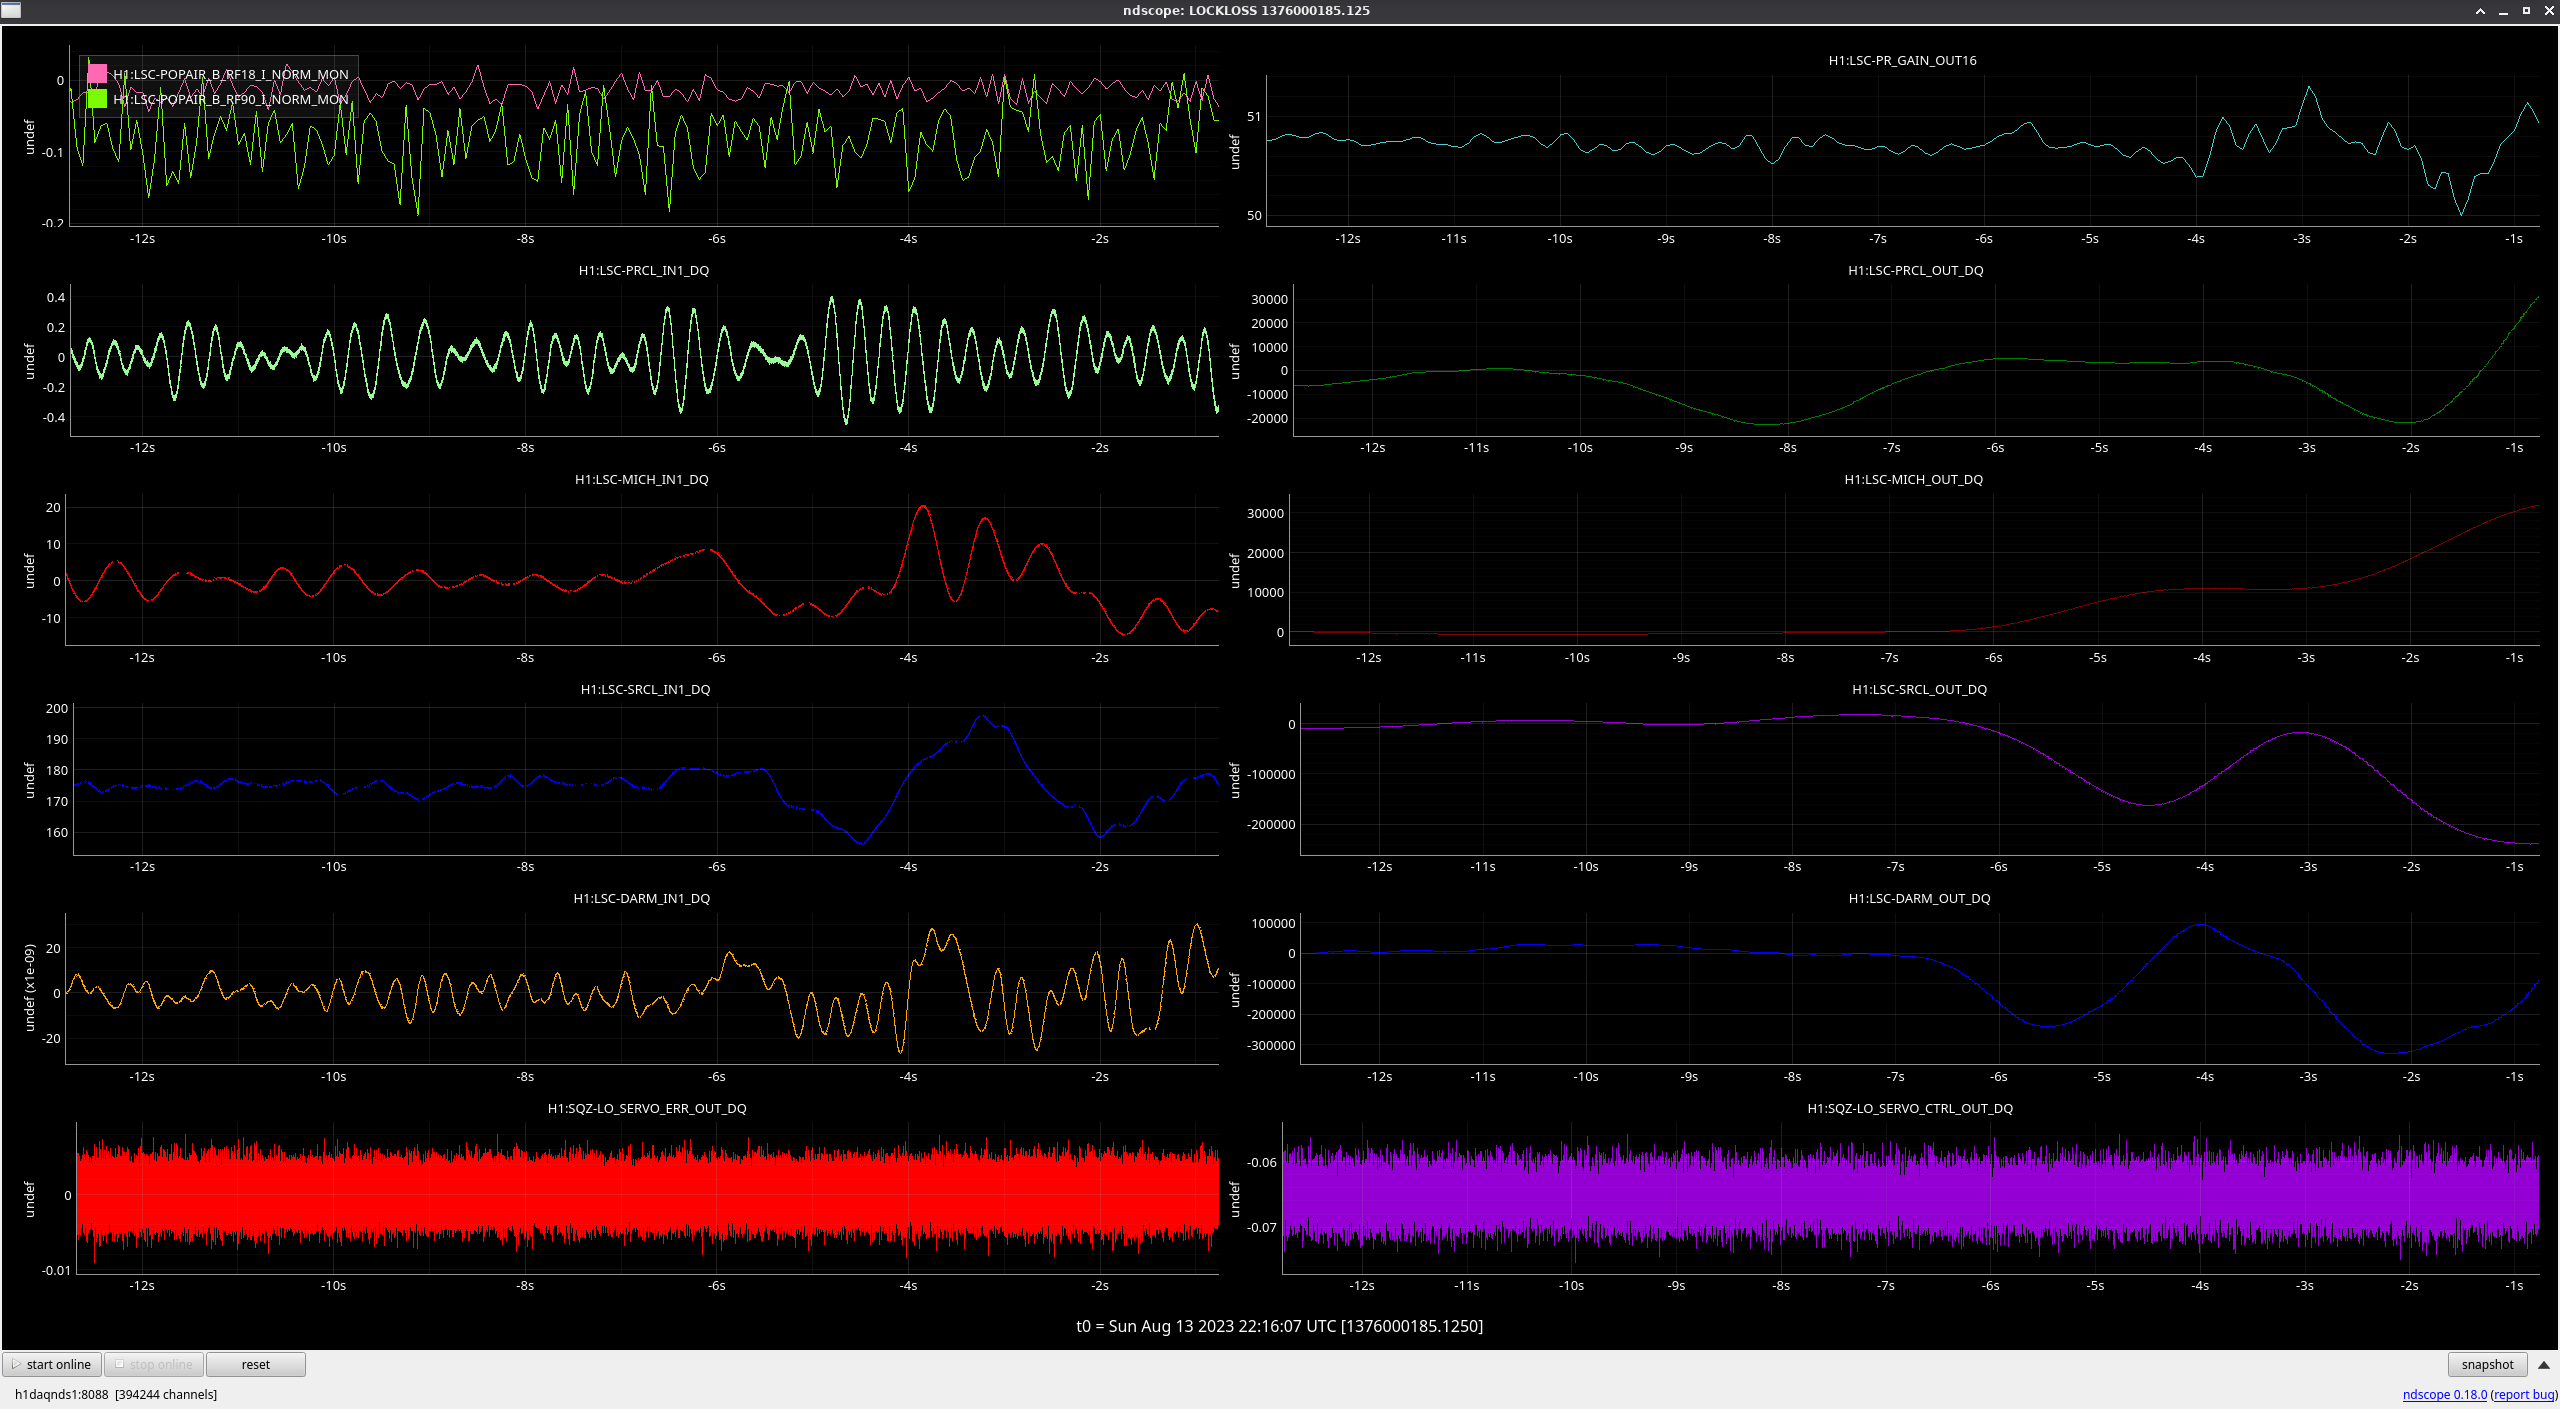
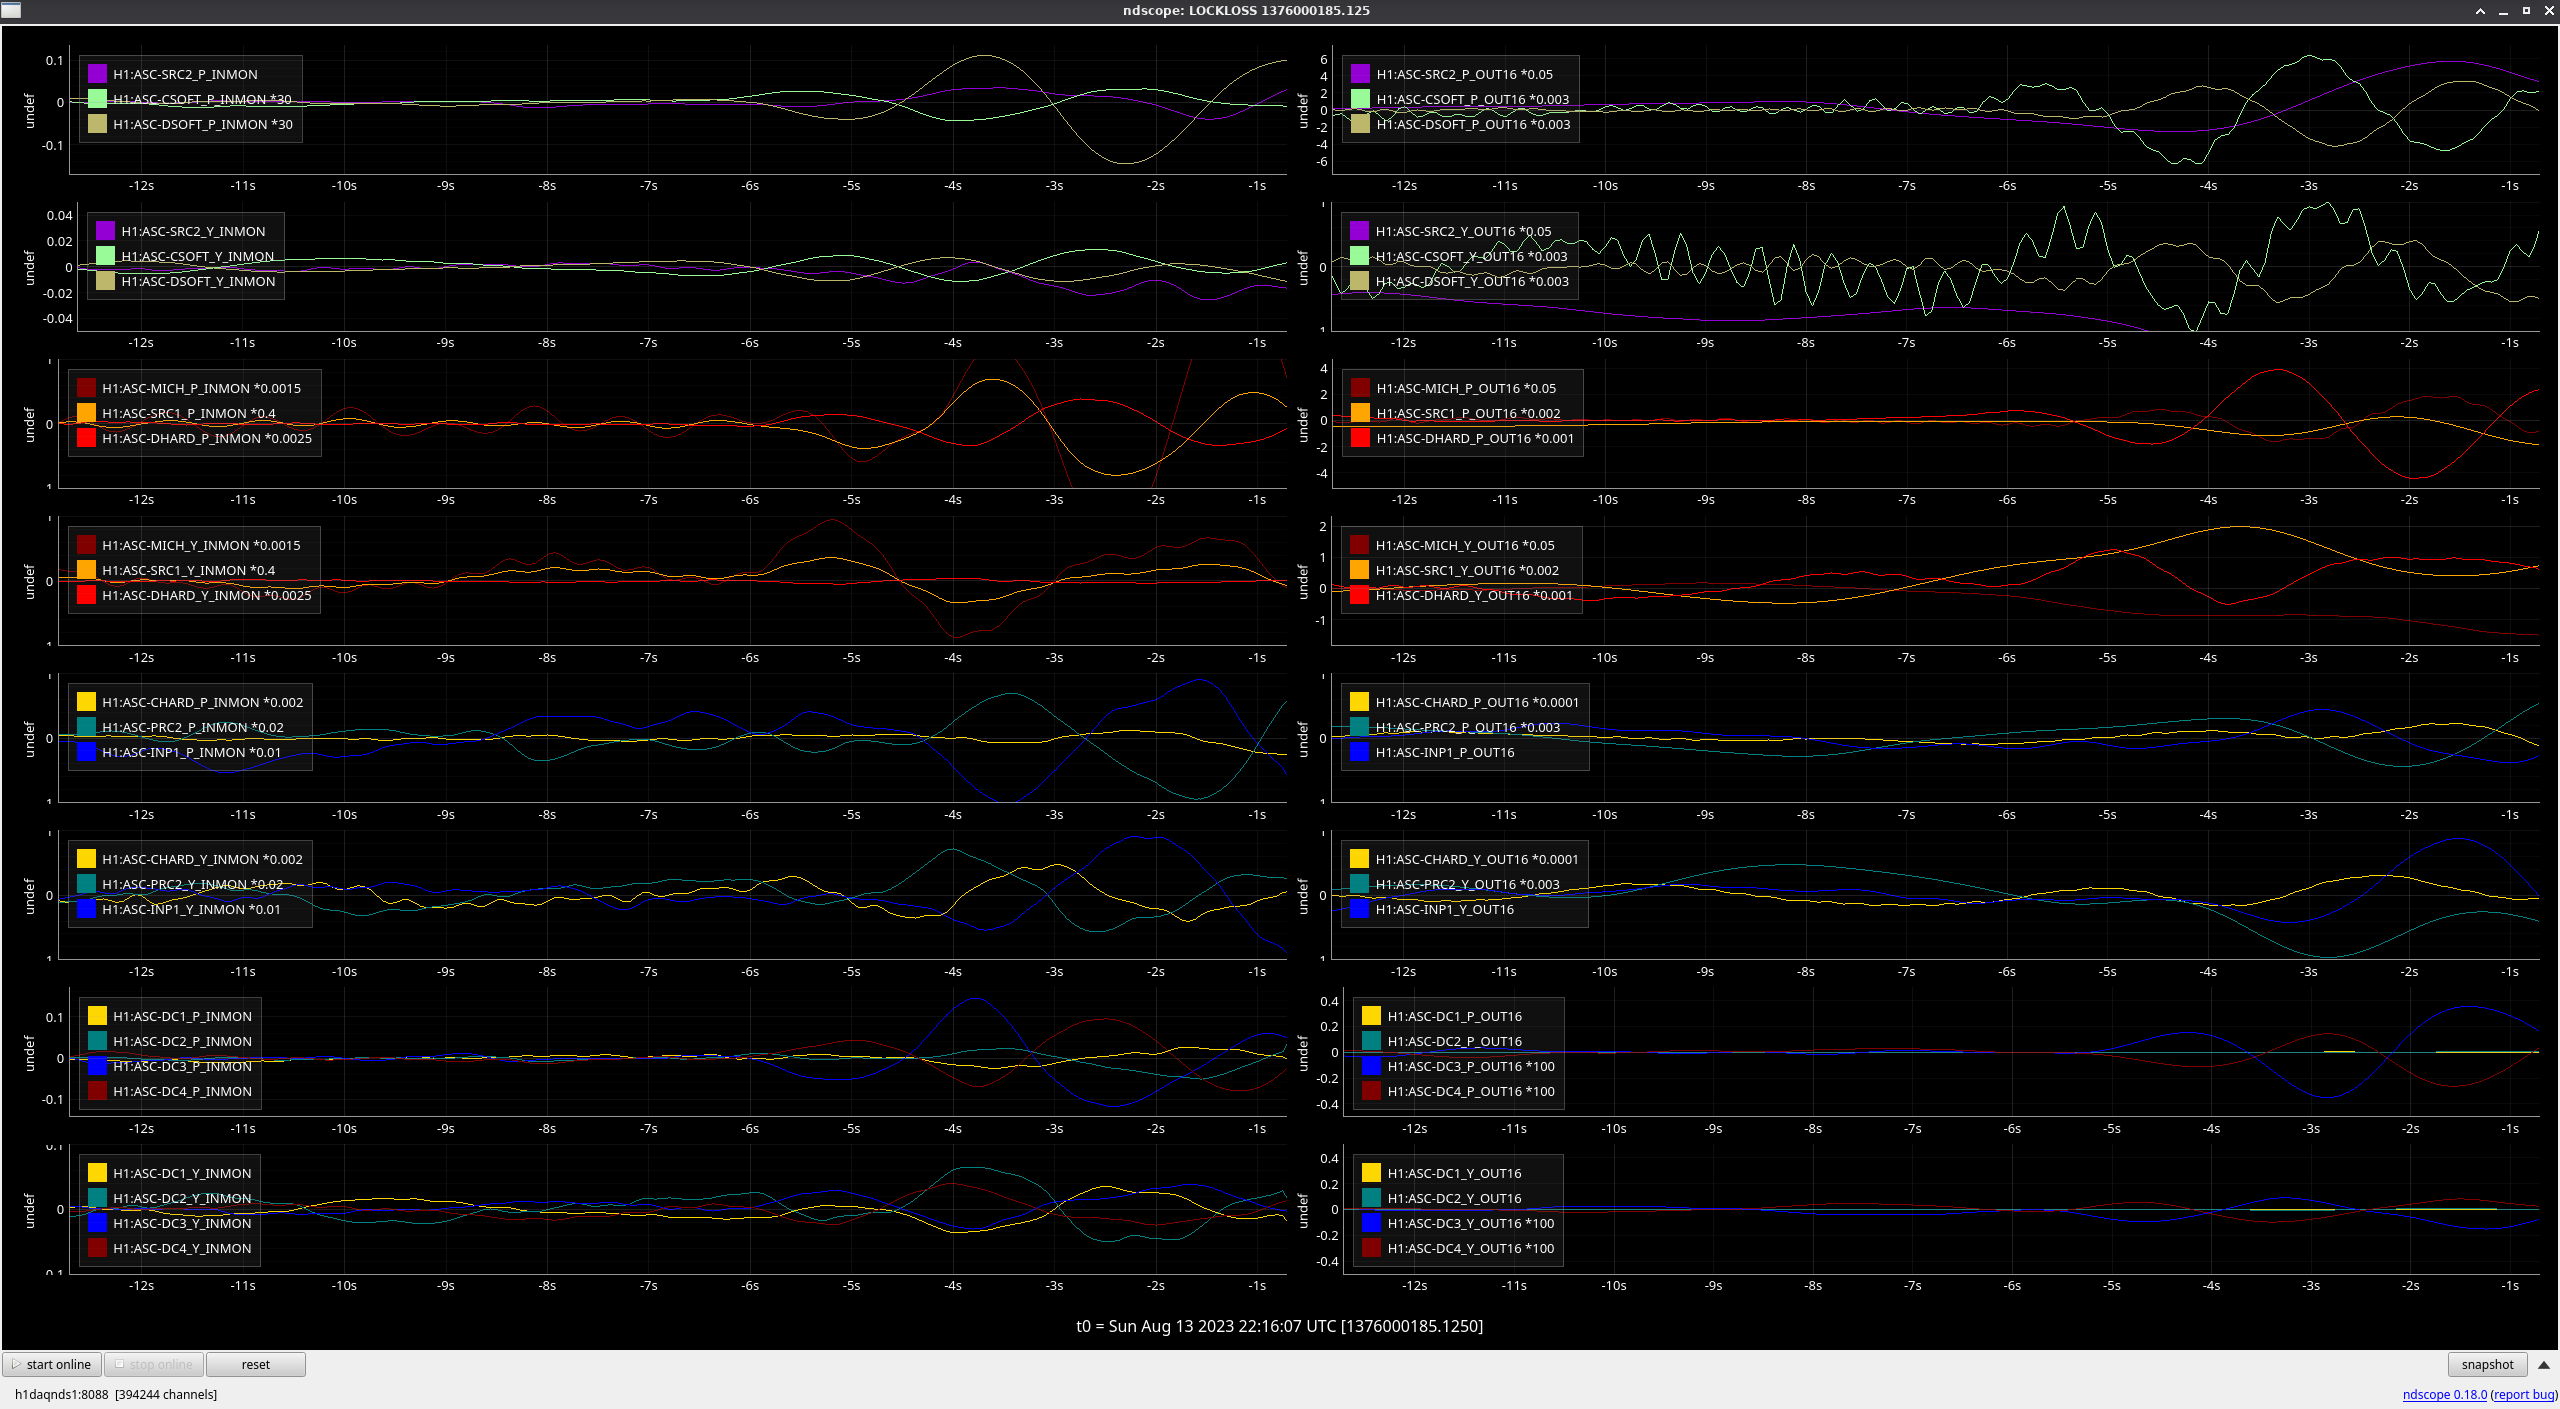
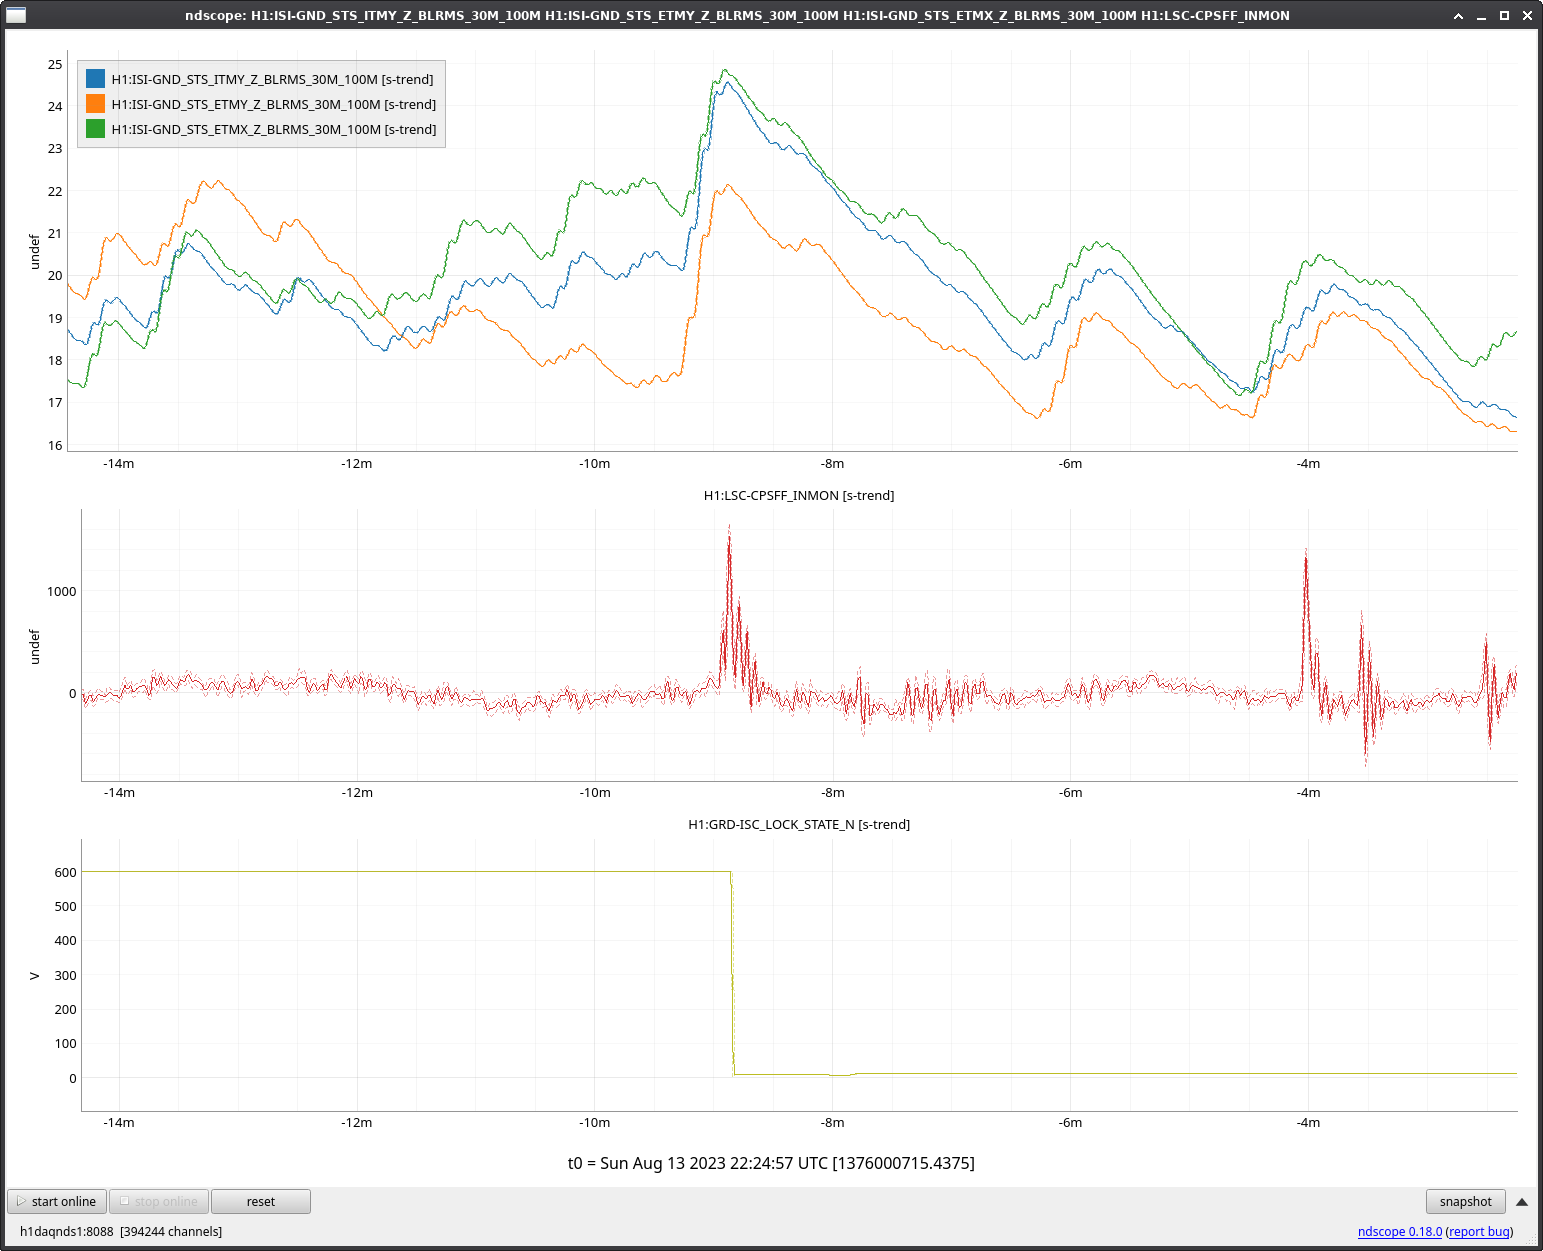
Lockloss @ 22:16 UTC - cause currently unknown, but several LSC and ASC loops showed something happening starting about 6 seconds before the lockloss.
Possibly some very sudden ground motion? I noticed the LSC CPSFF spiked at the lockloss, but I don't have an explanation for where it could have come from.
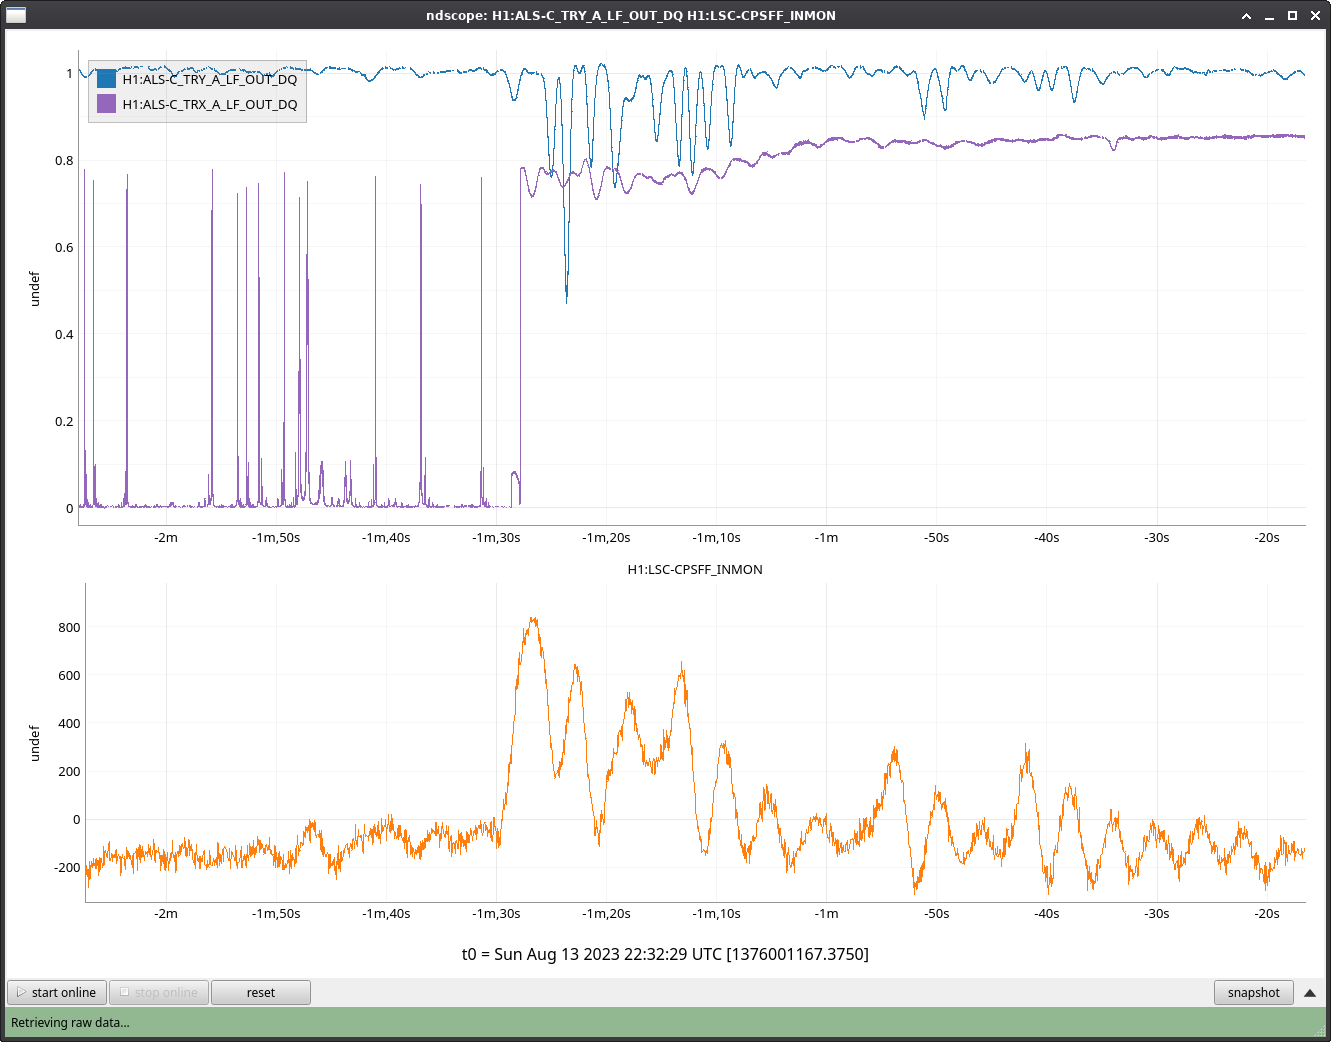
The LSC-CPSFF_INMON channel has also been having these little hiccups every couple of minutes since the lockloss.
The CPSFF hiccups are also seen in the ALS flashes, mostly ALS Y, so the ISI is certainly moving. The movement seen by the LSC CPSFF starts at the same time as the movement seen by the LSC and ASC signals.
As I write, the hiccups appear to have stopped.
Back Observing as of 23:33UTC
State of H1: Observing at 153Mpc
H1 has been locked for 35 hours. Very quiet morning.
Benoit, Ansel, Derek
Benoit noticed that for recent locks, the 102.13 Hz calibration line is much louder than typical for the first few hours of the lock. An example of this behavior is shown in the attached spectrogram of H1 strain data on August 5 - this is the first day this behavior appeared. Ansel noted that this feature includes a comb-like structure around the line that is only present in the H1:GDS-CALIB_STRAIN_NOLINES channel and not H1:GDS-CALIB_STRAIN (see spectra for CALIB_STRAIN and CALIB_STRAIN_NOLINES on Aug 5). This issue also visible in the PCAL trends for the 102.13 Hz line.
We are not sure if the excess noise near 102.13 Hz is from the calibration line itself or another noise source that is near the line. However, the behavior has been present for every lock since 12:30 UTC on August 5 2023.
FYI,
$ gpstime Aug 05 2023 12:30 UTC
PDT: 2023-08-05 05:30:00.000000 PDT
UTC: 2023-08-05 12:30:00.000000 UTC
GPS: 1375273818.000000
so... this behavior seems to have started at 5:30a local time on a Saturday. Therefore *very* unlikely that the start of this issue is intentional / human change driven.
The investigation continues....
making sure to tag CAL.
Other facts and recent events:
- Attached are 2 screenshots that show the actual *digital* excitation is not changing with time in anyway.
:: 2023-08-08_H1PCALEX_OSC7_102p13Hz_Line_3mo_trend.png shows the specific oscillator, --- PCALX's OSC7 which drives the 102.13 Hz line's EPICs channel version of its output. The minute trend shows the max, min, and mean of the output, and there's no change in amplitude.
:: 2023-08-08_H1PCALEX_EXC_SUM_3mo_trend.png shows a trend of the total excitation sum from PCAL X. This also shows *no* change in time in amplitude.
Both trends show the Aug 02 2023 change in amplitude kerfuffle I caused that Corey found and a bit later rectified -- see LHO:71894 and subsequent comments, but that was done, over with an solved, definitely by Aug 03 2023 UTC and unrelated to the start up of this problem.
It's also well after I installed new oscillators and rebooted the PCALX, PCALY, and OMC models on Aug 01 2023 (see LHO:71881).
The front-end version of the calibration's systematic error at 102.13 Hz also shows the long, time-dependent issue -- this will allow us to trend the issue against other channels
Folks in the calibration group have found that the online monitoring system for the
- overall DARM response function systematic error
- (absolute reference) / (Calibrated Data Product) [m/m]
- ( \eta_R ) ^ (-1)
- (C / 1+G)_pcal / (C / 1+G)_strain
- CAL-DELTAL_REF_PCAL_DQ / GDS-CALIB_STRAIN
(all different ways of saying the same thing; see T1900169) in calibration at each PCAL calibration line frequency -- the "grafana" pages -- are showing *huge* amounts of systematic error during these times when the amplitude of the line is super loud.
Though this metric is super useful because it's dreadfully obvious that things are going wrong -- this metric is not in any normal frame structure, so you can't compare it against other channels to find out what's causing the systematic error.
However -- remember -- we commissioned a front-end version of this monitoring during ER15 -- see LHO:69285.
That means the channels
H1:CAL-CS_TDEP_PCAL_LINE8_COMPARISON_OSC_FREQ << the frequency of the monitor
H1:CAL-CS_TDEP_PCAL_LINE8_SYSERROR_MAG_MPM << the magnitude of the systematic error
H1:CAL-CS_TDEP_PCAL_LINE8_SYSERROR_PHA_DEG << the phase of the systematic error
tell you (what's supposed to be***) equivalent information.
*** One might say that "what's suppose to be" is the same as "roughly equivalent" due to the following reasons:
(1) because we're human, the one system is displaying the systematic error \eta_R, and the other is displaying the inverse ( \eta_R ) ^ (-1)
(2) Because this is early-days in the front-end system, it uses the "less complete" calibrated channel CAL-DELTAL_EXTERNAL_DQ rather than the "fully correct" channel GDS-CALIB_STRAIN
But because the problem is so dreadfully obvious in these metrics, even though they're only *roughly* equivalent, you can see the same thing.
In the attached screenshot, I show both metrics for the most recent observation stretch, between 10:15 and 14:00 UTC on 2023-Aug-09.
Let's use this front-end metric to narrow down the problem via trending.
There appears to be no change in the PCALX analog excitation monitors either. Attached is a trend of some key channels in the optical follower servo -- the analog feedback system that serves as intensity stabilization and excitation power linearization for the PCAL's laser light that gets transmitted to the test mass -- the actuator of which is an acousto-optic modulator (an AOM). There seems to be no major differences in the max, min, and mean of these signals before vs. after these problems started on Aug 05 2023. H1:CAL-PCALX_OFS_PD_OUT_DQ H1:CAL-PCALX_OFS_AOM_DRIVE_MON_OUT_DQ
I believe this is caused by the presence of another line very close to the 102.13 Hz pcal line. This second line is present at the start of a lock stretch but seems to go away as the lock stretch continues. I have attached a plot showing a zoom-in on an ASD around 102.1-102.2 Hz right after a lock stretch (orange), where the second peak is evident, and well into a lock stretch (blue) where the PCAL line is still present, but the second peak right below it in frequency is gone. This ASD is computed using an hour of data for each curve, so we can get the needed resolution for these two peaks.
I don't know the origin of this second line. However, a quick fix to the issue could be moving the PCAL line over by about a Hz. The second attached plot shows that the spectrum looks pretty clean from 101-102 Hz, so somewhere in there would be probably be okay for a new location of the PCAL line.
Since it looks like the additional noise is at 102.12833 Hz, I did a quick check in Fscan data from Aug 5 for channels where there is high coherence with DELTAL_EXTERNAL at 102.12833 but *not* at 102.13000 Hz. This narrows down to just a few channels:
(lines git issue opened as we work on this.)
As a result of Ansel's discovery, and conversation on the CAL call today -- I've moved the calibration line frequency from 102.13 to 104.23 Hz. See LHO:72108.
This line may have appeared in the previous lock the day before (Aug 4). The daily spectrogram for Aug 4 shows a line near 100 Hz starting at 21:00 UTC.
Looking at alogs leading up to the time Derek notes above, I noticed that Gabriele retuned and tested new LSC FF. This change may be related to this new peak. Remembering some issues we had recently where DHARD filter impulses were ringing up violin modes, I checked the new LSC FF filters and how they are engaged in the guardian. Some of them have no ramp time, and the filter bank is turned on immediately along with the filters in the guardian. I have no idea why that would cause a peak at 102 Hz, but I updated those filters to have a 3 second ramp.
Reloaded the H1LSC model to load in Elenna's filter changes
Now that the calibration line has been moved, the comb-like structure at the calibration line frequency is no longer present (checked in the CLEAN channel).
We can also see the shape of the 102.12833 Hz line much more clearly without the overlapping calibration line. I have attached a plot for reference on the width and shape.
As discussed in todays commissioning meeting, I checked TMSX and ETMX movement for a kick during locking and couldn't see anything suspicious. I did find some increase motion/noise every 8Hz in TMSX 1s into ENGAGE_SOFT_LOOPS when ISC_LOCK isn't explicitly doing anything, plot attached. However this noise was present prior to Aug 4th, (July 30th attached).
TMS is suspicious as Betsy found that TMS's have violin modes ~103-104Hz.
Jeff draws attendtion to 38295, showing modes of quad blade springs above 110Hz, and 24917 showing quad top wire modes above 300Hz.
Elenna's notes with calibration lines off (as we are experimenting with for current lock) we can see this 102Hz peak at ISC_LOCK state ENGAGE_ASC_FOR_FULL_IFO. We were mistaken.
To preserve documentation, this problem has now been solved, with more details in 72537, 72319, and 72262.
The cause of this peak was a spurious, narrow, 102 Hz feature in the SRCL feedforward that we didn't catch when the filter was made. This has been been fixed, and the cause of the mistake has been documented in the first alog listed above so we hopefully don't repeat this error.