david.barker@LIGO.ORG - posted 10:20, Sunday 13 August 2023 (72179)
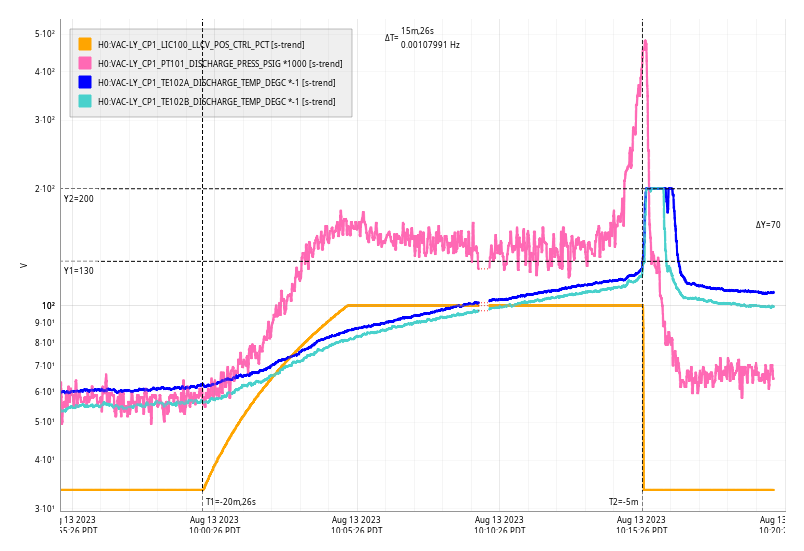
Sun CP1 Fill
Sun Aug 13 10:15:26 2023 INFO: Fill completed in 15min 22secs
Images attached to this report
Sun Aug 13 10:15:26 2023 INFO: Fill completed in 15min 22secs
TITLE: 08/13 Day Shift: 15:00-23:00 UTC (08:00-16:00 PST), all times posted in UTC
STATE of H1: Observing at 149Mpc
OUTGOING OPERATOR: Austin
CURRENT ENVIRONMENT:
SEI_ENV state: CALM
Wind: 12mph Gusts, 8mph 5min avg
Primary useism: 0.03 μm/s
Secondary useism: 0.12 μm/s
QUICK SUMMARY: H1 has been locked for 31 hours. Dropped out of observing twice at 09:09 and 09:22 from the TCS CO2 X laser losing lock. On both occasions observing resumed automatically within 2 minutes. (Tagging TCS)
TITLE: 08/13 Eve Shift: 23:00-07:00 UTC (16:00-00:00 PST), all times posted in UTC
STATE of H1: Observing at 144Mpc
INCOMING OPERATOR: Austin
SHIFT SUMMARY:
Overall a quiet and calm night! Going on 23hrs 21mins Locked.
Timeline:
23:00 Detector in Observing and Locked for 15.5 hrs
00:00 Verbal alarm for WAP On in LVEA, EX, and EY, but it isn't actually on (this has happened a few times recently)
4:58 Earthqake mode activated due to earthquake from Papua New Guinea
5:08 Back to CALM
LOG:
no log
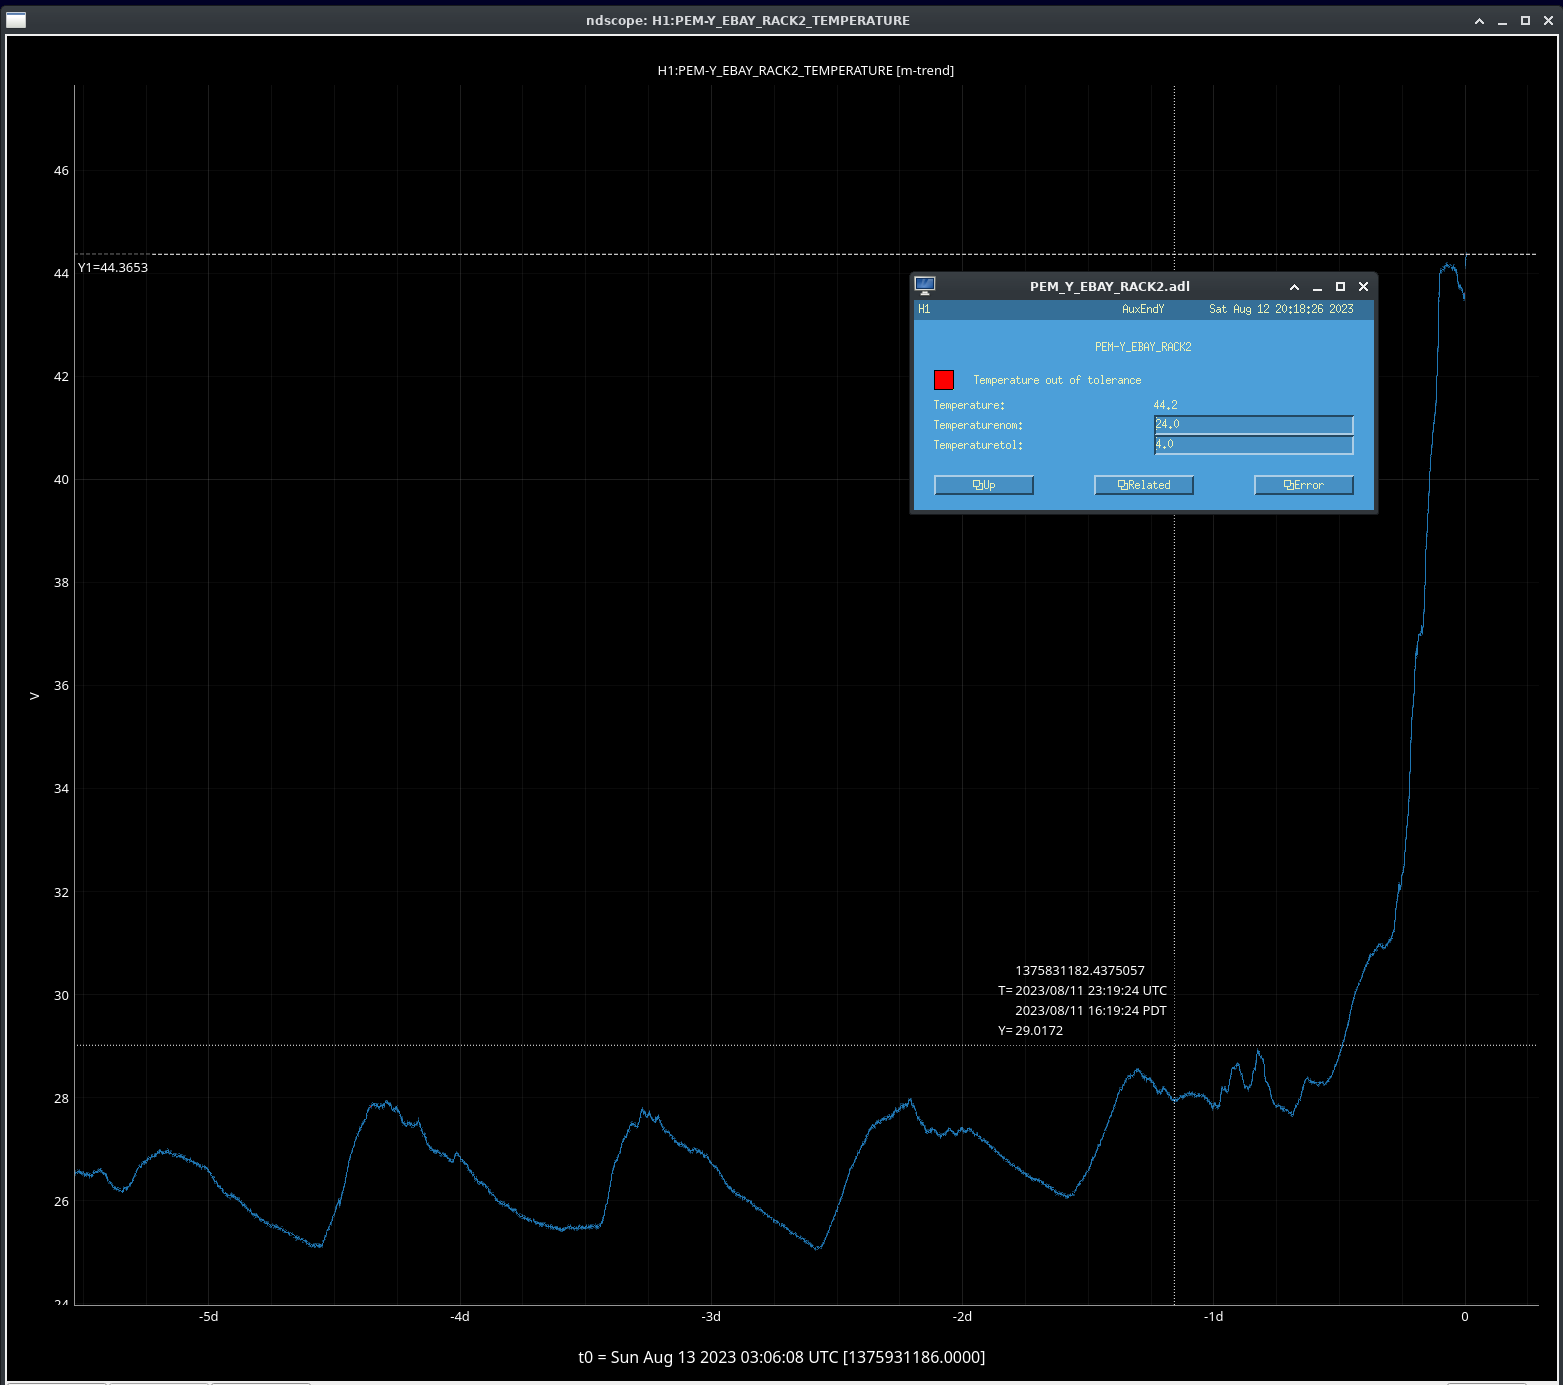
We have been Locked for 19hrs 20mins. At 00:00UTC, we did get a notification on Verbals that WAP was on in the LVEA, EX, and EY, which it wasn't, but it's been quiet besides that.
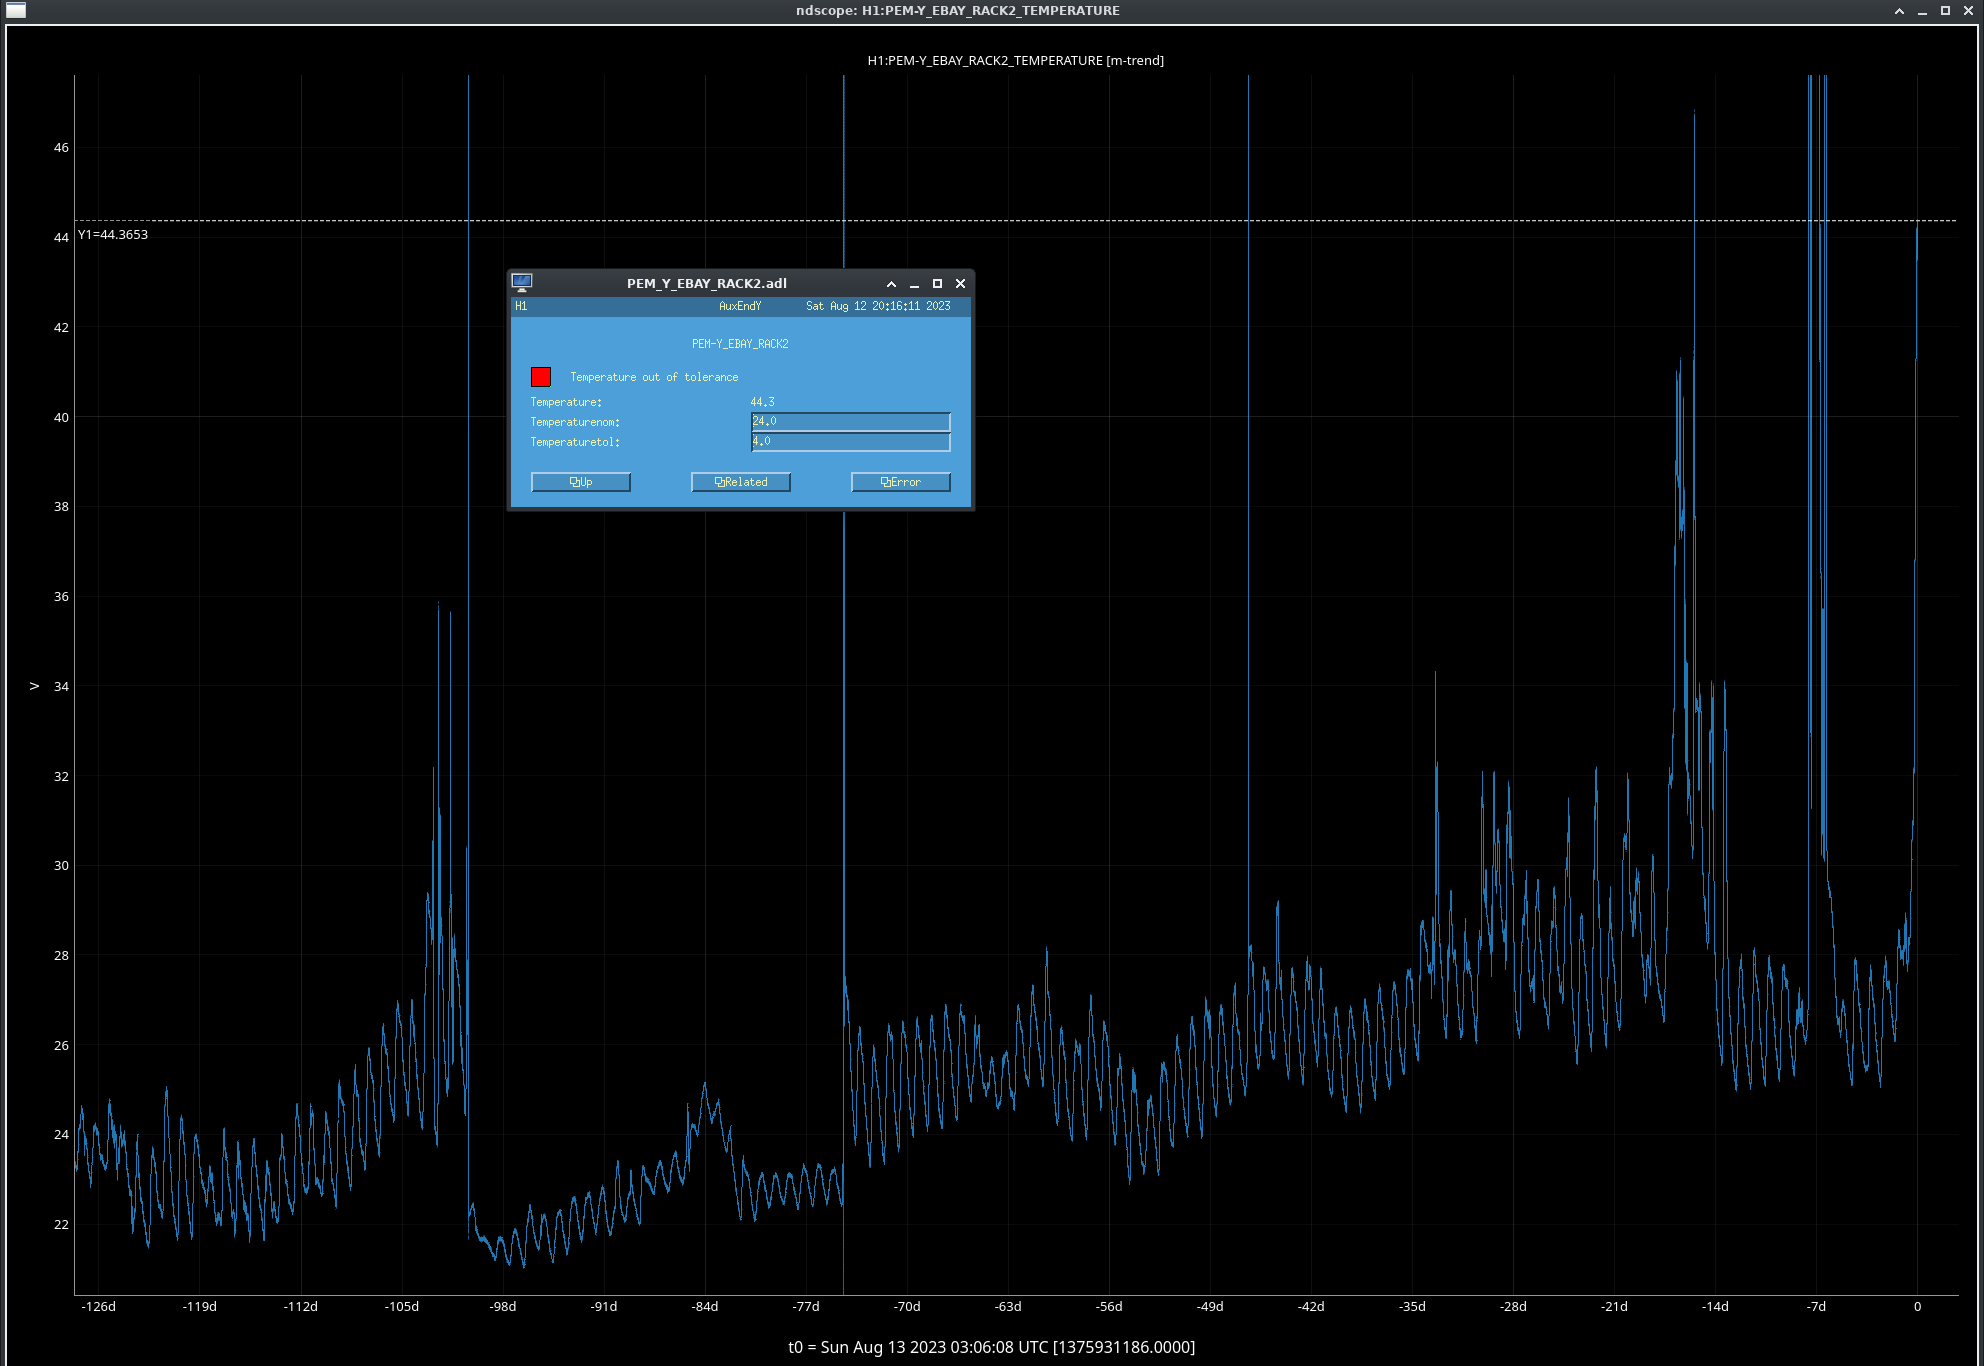
However I did notice that the temperature of Rack 2 in the Y EBay has been rising in temperature over the past day, starting possibly around 8/11 23:19UTC (attachment1), and the current temp reads as almost double the nominal temp. Attachment2 gives a zoomed out timeline, showing that besides the power glitch that resulted in a partial power outage from August 5th (72000) and a period of time 17 days ago(unsure of the cause of that), the rack temperature has not gotten this high in multiple months. Tagging PEM and SYS (not sure if SYS should be tagged).
TITLE: 08/12 Eve Shift: 23:00-07:00 UTC (16:00-00:00 PST), all times posted in UTC
STATE of H1: Observing at 149Mpc
OUTGOING OPERATOR: Ryan S
CURRENT ENVIRONMENT:
SEI_ENV state: CALM
Wind: 17mph Gusts, 12mph 5min avg
Primary useism: 0.03 μm/s
Secondary useism: 0.09 μm/s
QUICK SUMMARY:
Taking over for Ryan S. Detector in Observing and Locked for 15.5hrs.
TITLE: 08/12 Day Shift: 15:00-23:00 UTC (08:00-16:00 PST), all times posted in UTC
STATE of H1: Observing at 152Mpc
INCOMING OPERATOR: Oli
SHIFT SUMMARY: H1 has been locked for 15 hours; quiet the entire shift. Only out of observing a handful of times due to SDF diffs (below).
LOG:
No log for this shift.
State of H1: Observing at 148Mpc
H1 has been locked for 11 hours. Quiet morning with the usual Saturday tour groups passing through. We've dropped out of observing three times so far from SDF diffs on syscssqz; the rate of this seems to be higher than normal today (tagging SQZ).
Sat Aug 12 10:16:34 2023 INFO: Fill completed in 16min 29secs

TITLE: 08/12 Day Shift: 15:00-23:00 UTC (08:00-16:00 PST), all times posted in UTC
STATE of H1: Observing at 148Mpc
OUTGOING OPERATOR: Austin
CURRENT ENVIRONMENT:
SEI_ENV state: CALM
Wind: 3mph Gusts, 2mph 5min avg
Primary useism: 0.01 μm/s
Secondary useism: 0.09 μm/s
QUICK SUMMARY: H1 has been locked for over 7 hours. Looks like we dropped observing for 3 seconds at 14:00:37 for two SDF diffs on syscssqz, but observing was resumed automatically (tagging SQZ).
TITLE: 08/12 Eve Shift: 23:00-07:00 UTC (16:00-00:00 PST), all times posted in UTC
STATE of H1: Lock Acquisition
INCOMING OPERATOR: Austin
SHIFT SUMMARY:
Lost lock 30 minutes ago(72168) and currently locking back up. ALSY was having trouble holding a lock but I was able to help it along.
23:00UTC Observing and Locked for 3hrs
23:41:09 Taken out of Observing due to SDF Diffs in syscssqz. I used this as a chance to reload the H1LSC model to load in the changed Elenna had made (72163)
23:42:34 I put us back into Observing
LOG:
| Start Time | System | Name | Location | Lazer_Haz | Task | Time End |
|---|---|---|---|---|---|---|
| 23:20 | PCAL | Tony, Genevieve | PCal Lab | y(local) | Put up equipment | 23:53 |
Closes FAMIS #25594, last checked in 71978
Corner Station Fans (Attachment1)
Corner station fans all well within range. The line ~2.5 days ago was due to the corner station fans shutting off from the Fire Alarm(72097).
Outbuilding Fans (Attachment2)
All outbuilding fans well within range.
Other observations
-On August 5th at 18:07UTC, something happened to MY_FAN1_270_1/2 that caused MY_FAN1_270_1 to go from ~0.7 to ~0.3.


During Tuesday maintance this week, we moved the upper (inner) beam of the Xend Pcal system down from it's nominal location by 2.5 mm on the surface of the ETM (see aLog entry 72063).
The observed change in the Pcal X/Y comparison should give a measurement of the vertical component of the displacement of the interferometer beam from the center of the ETM. This displacement, denoted by the b_y, is given by
Delta_XY = c/2 * b_y * M / I
where Delta_XY is the observed change in the Pcal X/Y comparison (after minus before), c is the change in the vertical position of upper Pcal beam, the factor of 1/2 results from only moving one of the two Pcal beams, b_y is the vertical component of the displacement of the interferometer beam from the center of the optic, M is the mass of the optic, and I is the moment of intertia of the ETM for rotation about an axis parallel to the face of the optic and and through the center of the face of the optic.
Thus the interferometer beam displacement can be estimated by b_y = 2* Delta_XY / (c * M / I).
For the Xend ETM, M / I = 0.94e-4 / mm^2 and c = - 2.5 mm. Thus b_y = -0.85e4 * Delta_XY mm
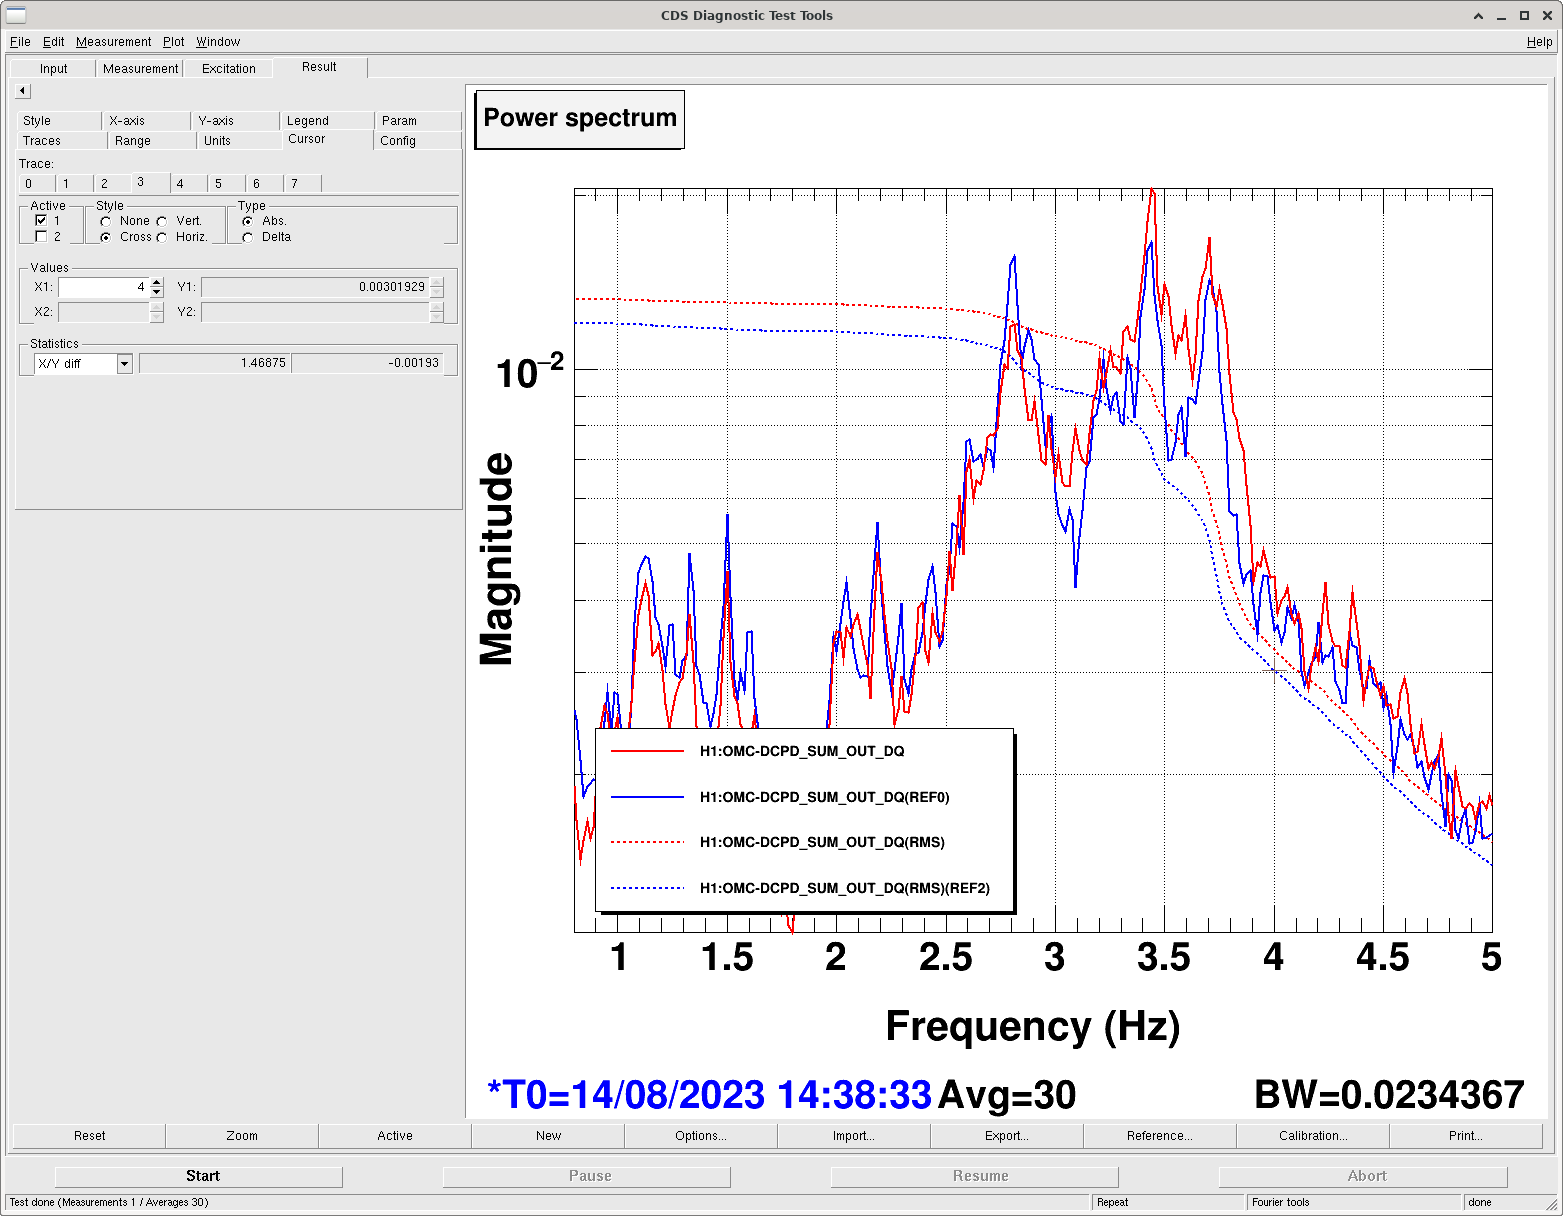
Using DTT to analyze data (1024 sec FFTs, 50% overlap, 10 avgs) during a lock stretch the day before we moved the beam, 08/07 from about 08:00 to 23:00 UTC, and after the move on 08/09 between 00:30 and 06:30 and between 11:30 and 15:30. We observe a change in the X/Y comparison of about - 24e-4 (see attached plot). This would indicate an interferoemter beam offset of about 20.7 mm in the positive y direction, ABOVE the center of the optic.
Info provided by JenneB (seel below) indicated that the pitch measurements using the electrostatic acutators indicate that the interferometer beam is offset by about 14.3 mm BELOW the center of the ETM.
We will look at more data from before and after the beam position move and double-check our calcuation to make sure we aren't missing a minus sign somewhere.
Next Tuesday, we plan to move the beam back to it's nominal vertical potition and offset it to the left (when viewing the fact of the optic from the BS side) by 2.5 mm to assess the horizontal component of the interferometer beam offset from center.
-------------------------
From JenneD on 7/21/23:
Folder for getting the spot position is /opt/rtcds/userapps/trunk/isc/common/scripts/decoup/BeamPosition/
Using matlab....
help a2l_lookup: look up spot position for a given a2l gain on a test mass
Input:
1) 'PIT' or 'YAW'
2) a2l gain Output:
1) spot position in mm from test mass center ("spot position" is really the actuation node position; if the spot is co-located with the actuation node (eg. servo-ed there) then this also represents the spot position)
Sign convention for spot position: up (+Vert on SUS screens) is positive for pitch and farther to the left (+Trans on SUS screens) is positive for yaw.
a2l_lookup('PIT',4.0) Spot is -14.3 mm from the PIT center of the optic
a2l_lookup('YAW',4.4) Spot is 16.2 mm from the YAW center of the optic
ETMY:
a2l_lookup('PIT',4.60) Spot is -17.1 mm from the PIT center of the optic
a2l_lookup('YAW',3.2) Spot is 11.8 mm from the YAW center of the optic
TITLE: 08/11 Eve Shift: 23:00-07:00 UTC (16:00-00:00 PST), all times posted in UTC
STATE of H1: Observing at 147Mpc
OUTGOING OPERATOR: Ryan S
CURRENT ENVIRONMENT:
SEI_ENV state: CALM
Wind: 12mph Gusts, 10mph 5min avg
Primary useism: 0.02 μm/s
Secondary useism: 0.09 μm/s
QUICK SUMMARY:
Taking over for Ryan S. Observing and Locked for 3 hours.
TITLE: 08/11 Day Shift: 15:00-23:00 UTC (08:00-16:00 PST), all times posted in UTC
STATE of H1: Observing at 147Mpc
INCOMING OPERATOR: Oli
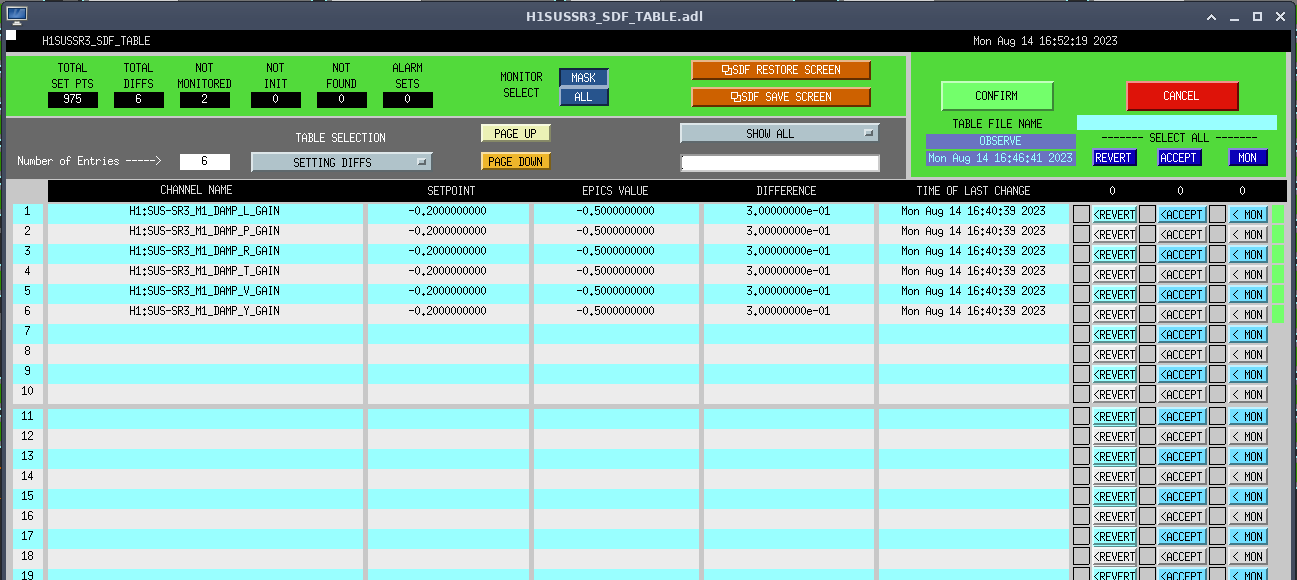
SHIFT SUMMARY: Shift started troubleshooting locking issues eventually tracked down to recently modified SR2/3 damping gains (see alog 72152). Two short lock stretches in the morning to do some PEM injections while L1 was down. Back to observing by early afternoon, now locked for almost 3 hours.
LOG:
| Start Time | System | Name | Location | Lazer_Haz | Task | Time End |
|---|---|---|---|---|---|---|
| 15:56 | FAC | Randy | MX | - | Inventory | 17:56 |
| 15:56 | PEM | Robert | EY | - | PEM injections | 16:51 |
| 16:15 | FAC | Cindi | MY | - | Cleaning | 16:50 |
| 17:45 | FAC | Cindi | MY | - | Tech clean | 19:20 |
| 17:59 | PEM | Robert | EY | - | PEM injections | 19:10 |
| 18:54 | SEI | Jim | MX, MY | - | 3IFO inventory | 20:25 |
| 19:52 | PEM | Robert | EY | - | Shutting off amps, turning off lights | 20:18 |
| 20:25 | SEI | Jim | EY | - | Wind fence pic | 20:40 |
| 21:39 | CAL | Tony, Genevieve | PCal Lab | - | Cleaning up equipment | 22:32 |
Follow up on previous tests (72106)
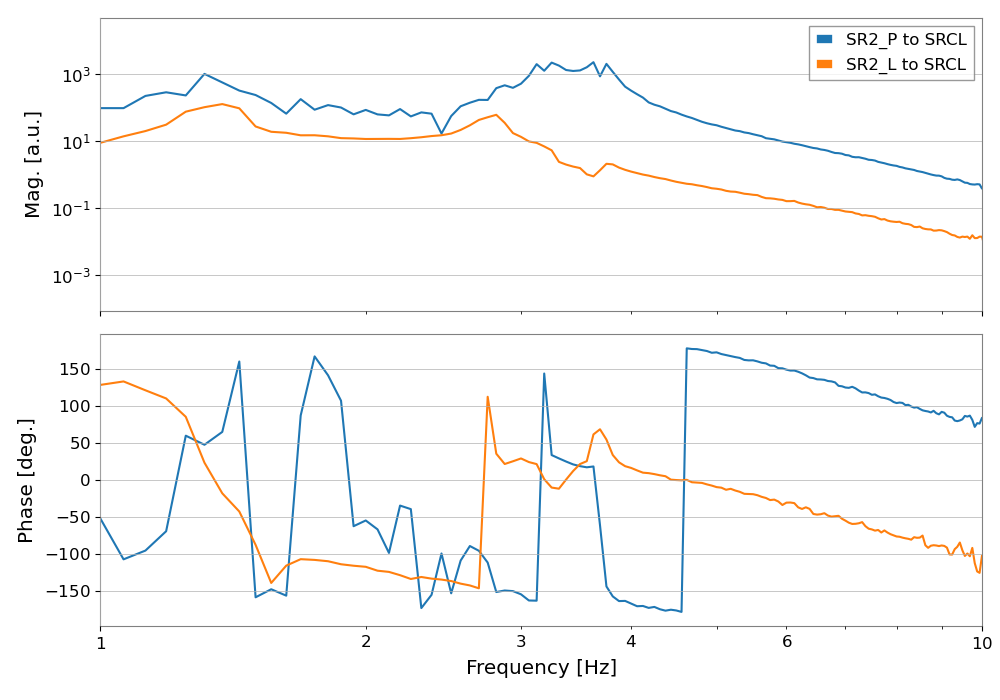
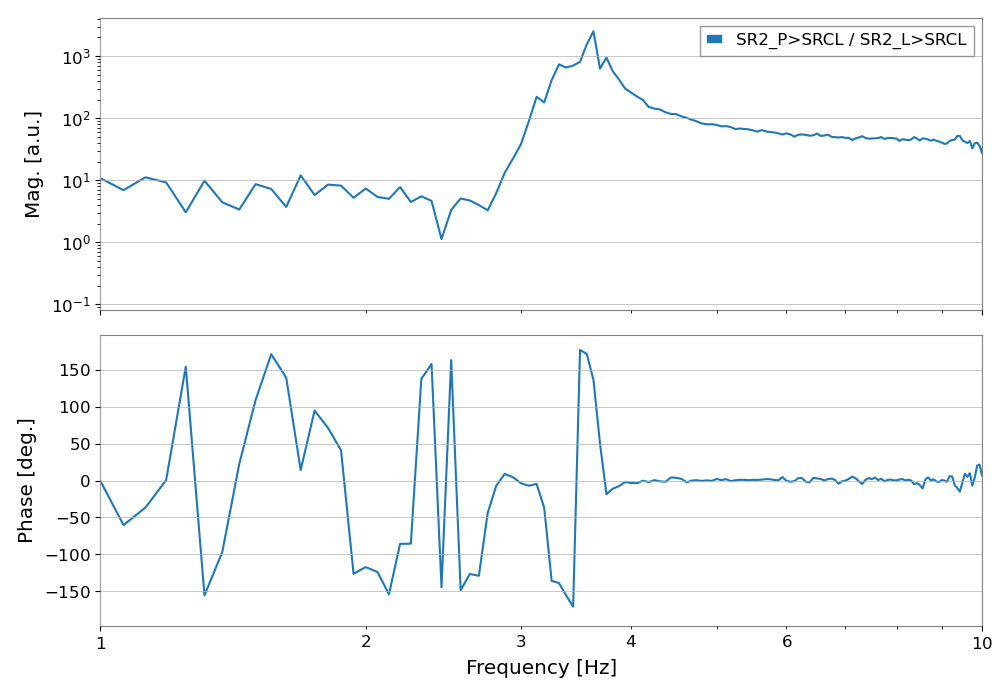
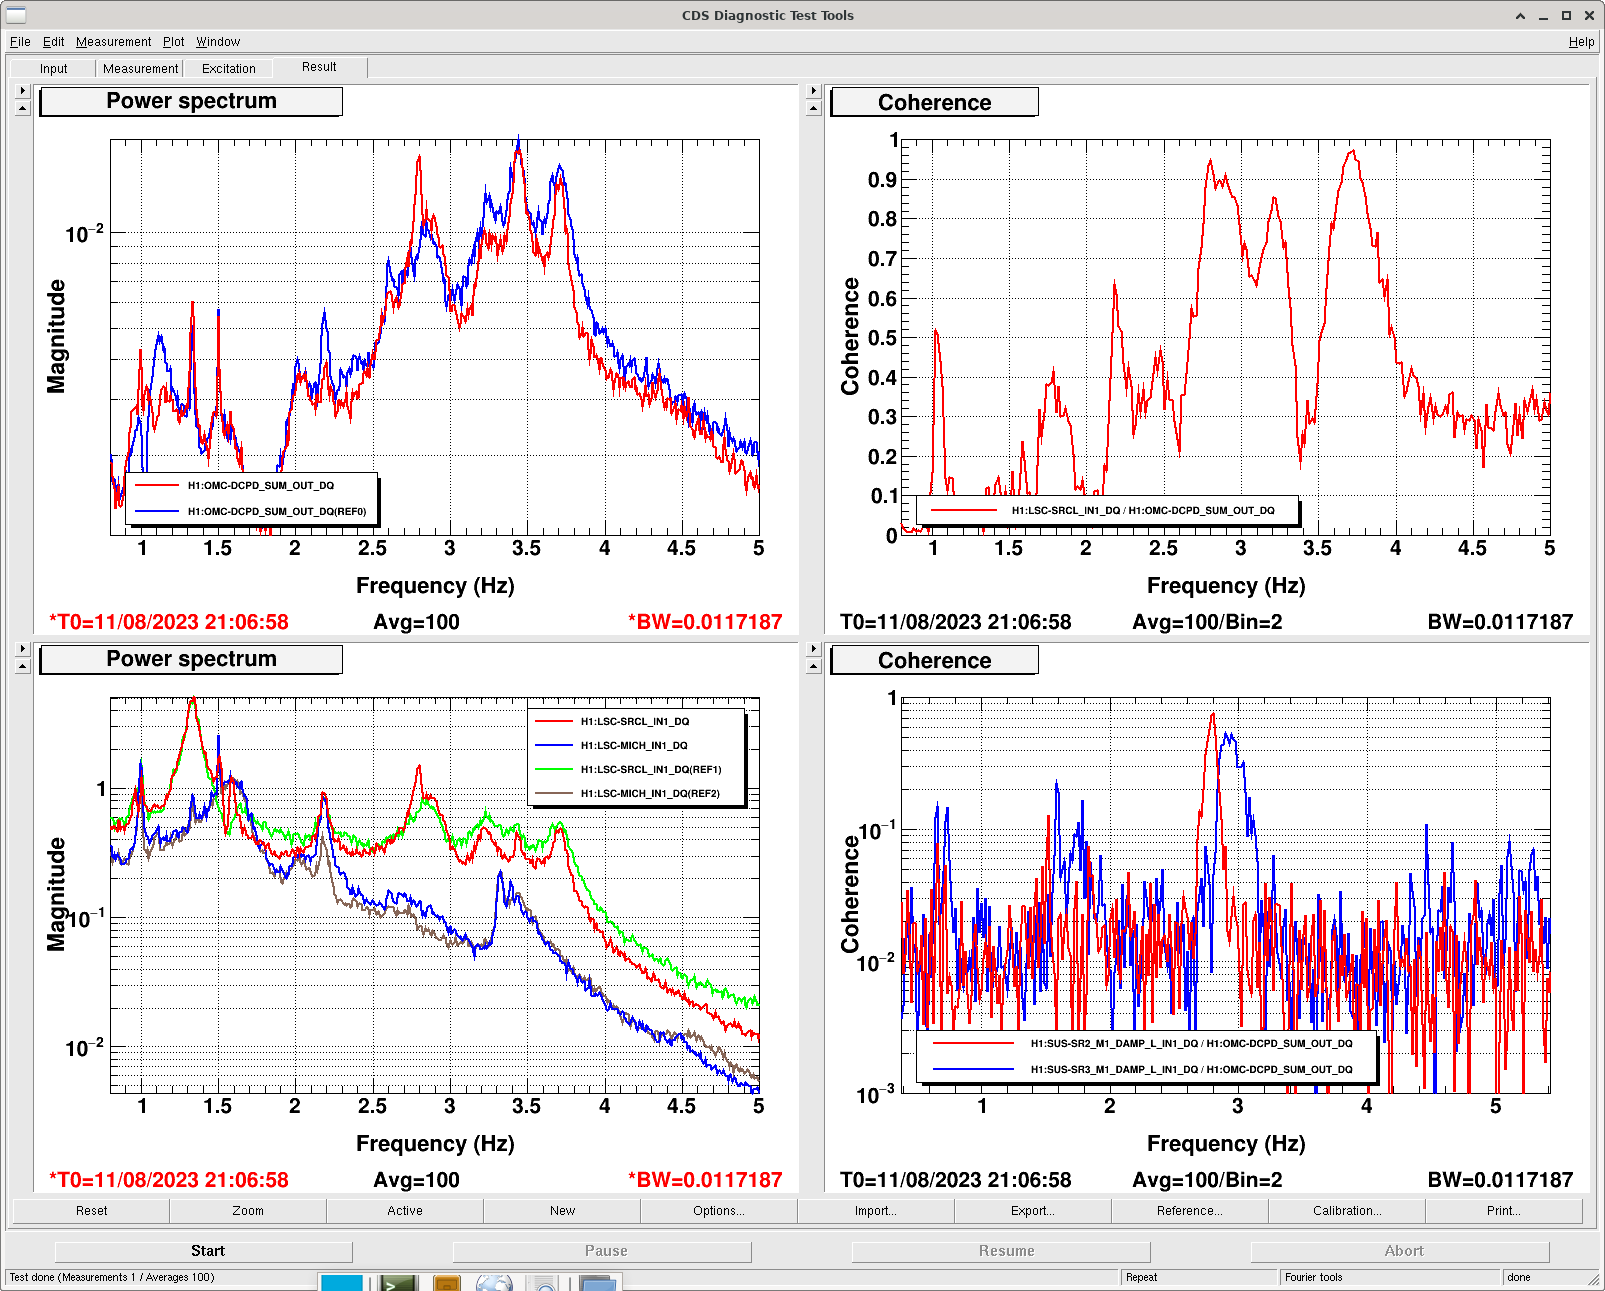
First I injected noise on SR2_M1_DAMP_P and SR2_M1_DAMP_L to measure the transfer function to SRCL. The result shows that the shape is different and the ratio is not constant in frequency. Therefore we probably can't cancel the coupling of SR2_DAMP_P to SRCL by rebalancing the driving matrix. Although I haven't thought carefully if there is some loop correction I need to do for those transfer functions. I measured and plotted the DAMP_*_OUT to SRCL_OUT. transfer functions. It might still be worth trying to change the P driving matrix while monitoring a P line to minimize the coupling to SRCL.
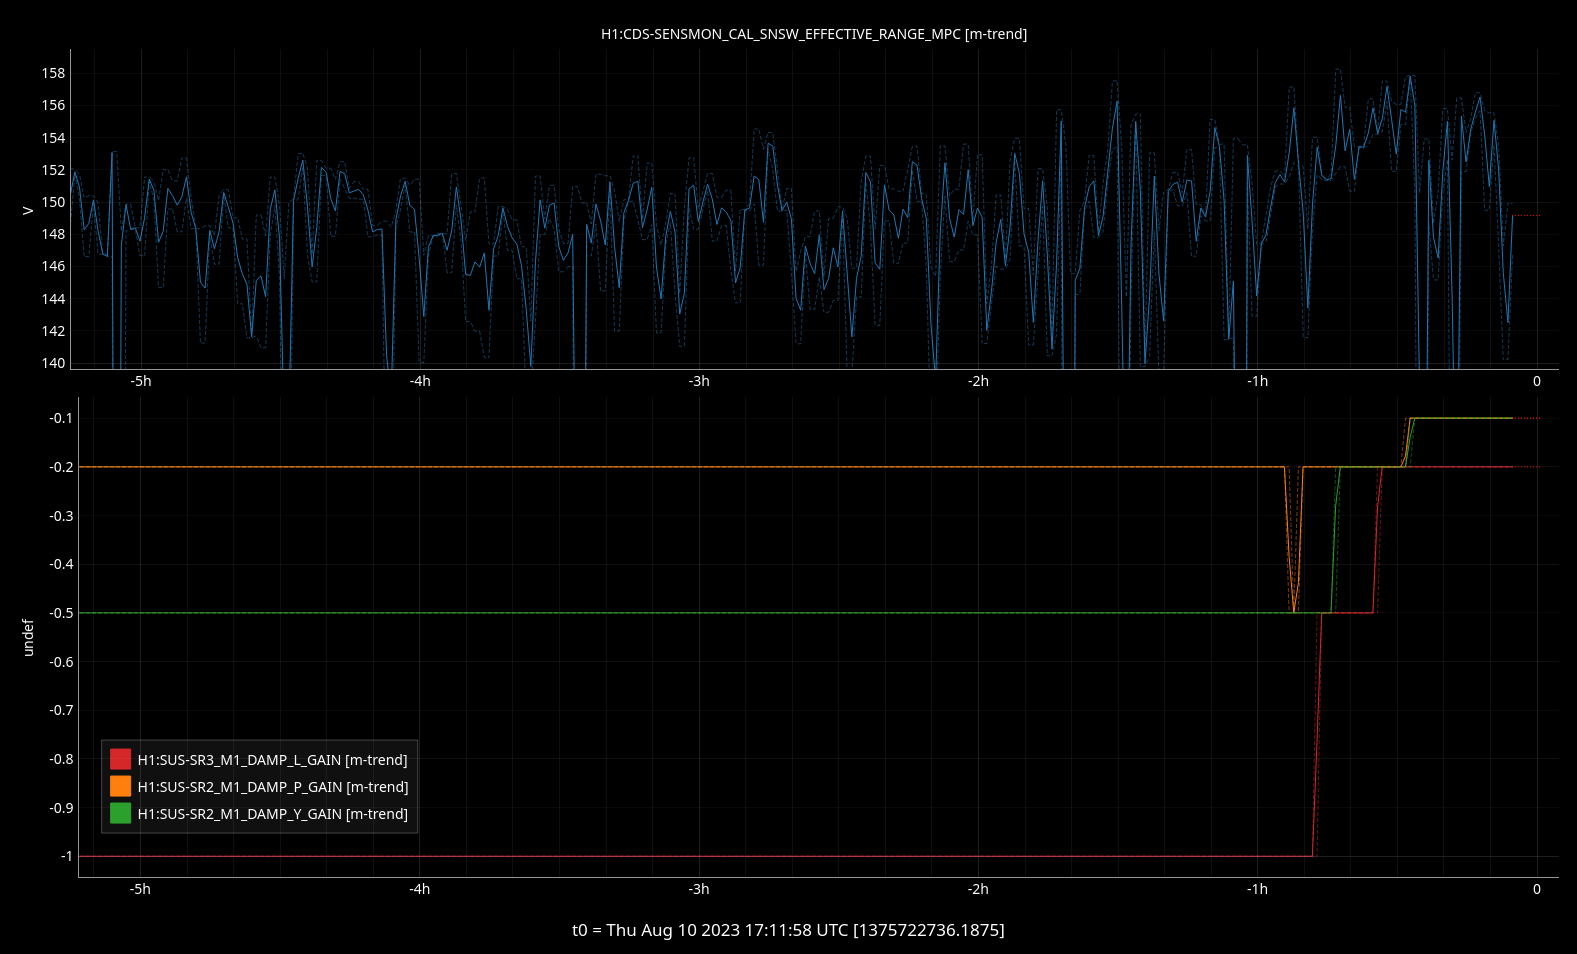
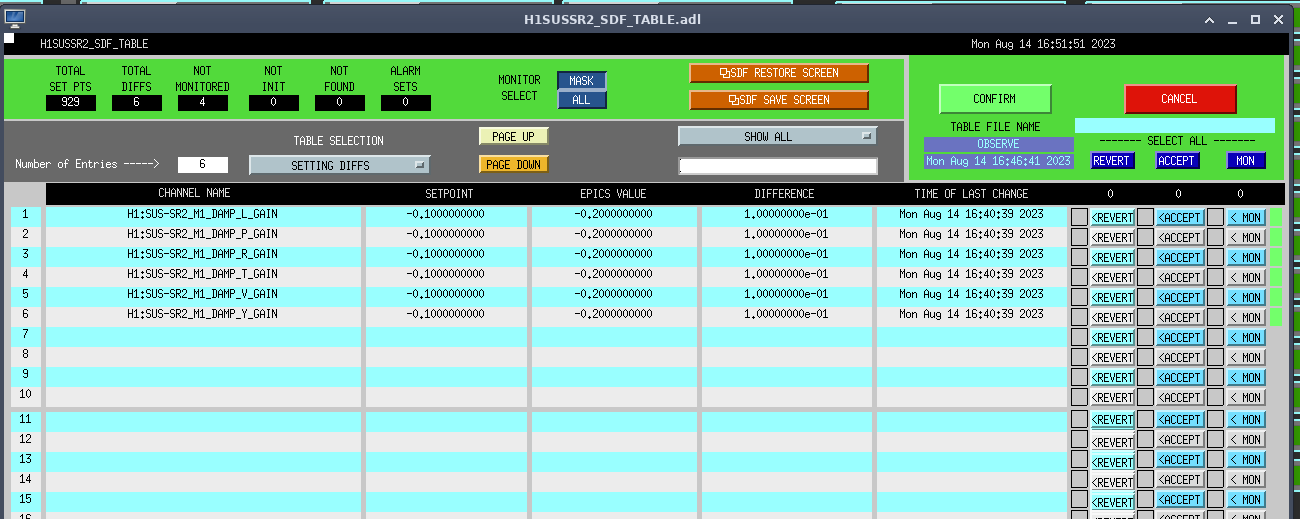
Then I reduced the damping gains for SR2 and SR3 even further. We are now running with SR2_M1_DAMP_*_GAIN = -0.1 (was -0.5 for all but P that was -0.2 since I reduced it yesterday). Also SR3_M1_DAMP_*_GAIN = -0.2 (was -1). This has improved a lot the SRCL motion and also improved DARM RMS. It looks like it also improved the range.
Tony has accepted this new configuration in SDF.
Detailed log below for future reference.
Time with SR2 P gain at -0.2 (but before that too)

from    PDT: 2023-08-10 08:52:40.466492 PDT

        UTC: 2023-08-10 15:52:40.466492 UTC

        GPS: 1375717978.466492

to      PDT: 2023-08-10 09:00:06.986101 PDT

        UTC: 2023-08-10 16:00:06.986101 UTC

        GPS: 1375718424.986101
H1:SUS-SR2_M1_DAMP_P_EXC  butter("BandPass",4,1,10) ampl 2

from    PDT: 2023-08-10 09:07:18.701326 PDT

        UTC: 2023-08-10 16:07:18.701326 UTC

        GPS: 1375718856.701326

to      PDT: 2023-08-10 09:10:48.310499 PDT

        UTC: 2023-08-10 16:10:48.310499 UTC

        GPS: 1375719066.310499
H1:SUS-SR2_M1_DAMP_L_EXC  butter("BandPass",4,1,10) ampl 0.2

from    PDT: 2023-08-10 09:13:48.039178 PDT

        UTC: 2023-08-10 16:13:48.039178 UTC

        GPS: 1375719246.039178

to      PDT: 2023-08-10 09:17:08.657970 PDT

        UTC: 2023-08-10 16:17:08.657970 UTC

        GPS: 1375719446.657970
All SR2 damping at -0.2, all SR3 damping at -0.5

start   PDT: 2023-08-10 09:31:47.701973 PDT

        UTC: 2023-08-10 16:31:47.701973 UTC

        GPS: 1375720325.701973

to      PDT: 2023-08-10 09:37:34.801318 PDT

        UTC: 2023-08-10 16:37:34.801318 UTC

        GPS: 1375720672.801318
All SR2 damping at -0.2, all SR3 damping at -0.2

start   PDT: 2023-08-10 09:38:42.830657 PDT

        UTC: 2023-08-10 16:38:42.830657 UTC

        GPS: 1375720740.830657

to      PDT: 2023-08-10 09:43:58.578103 PDT

        UTC: 2023-08-10 16:43:58.578103 UTC

        GPS: 1375721056.578103
All SR2 damping at -0.1, all SR3 damping at -0.2

start   PDT: 2023-08-10 09:45:38.009515 PDT

        UTC: 2023-08-10 16:45:38.009515 UTC

        GPS: 1375721156.009515
If our overall goal is to remove peaks from DARM that dominate the RMS, reducing these damping gains is not the best way to acheive that. SR2 L damping gain was reduced by a factor of 5 in this alog, and a resulting 2.8 Hz peak is now being injected into DARM from SRCL. This 2.8 Hz peak corresponds to a 2.8 Hz SR2 L resonance. There is no length control on SR2, so the only way to suppress any length motion of SR2 is via the top stage damping loops. The same can be said for SR3, whose gains were reduced by 80%. It may be that we are reducing sensor noise injected into SRCL from 3-6 Hz by reducing these gains, hence the improvement Gabriele has noticed.
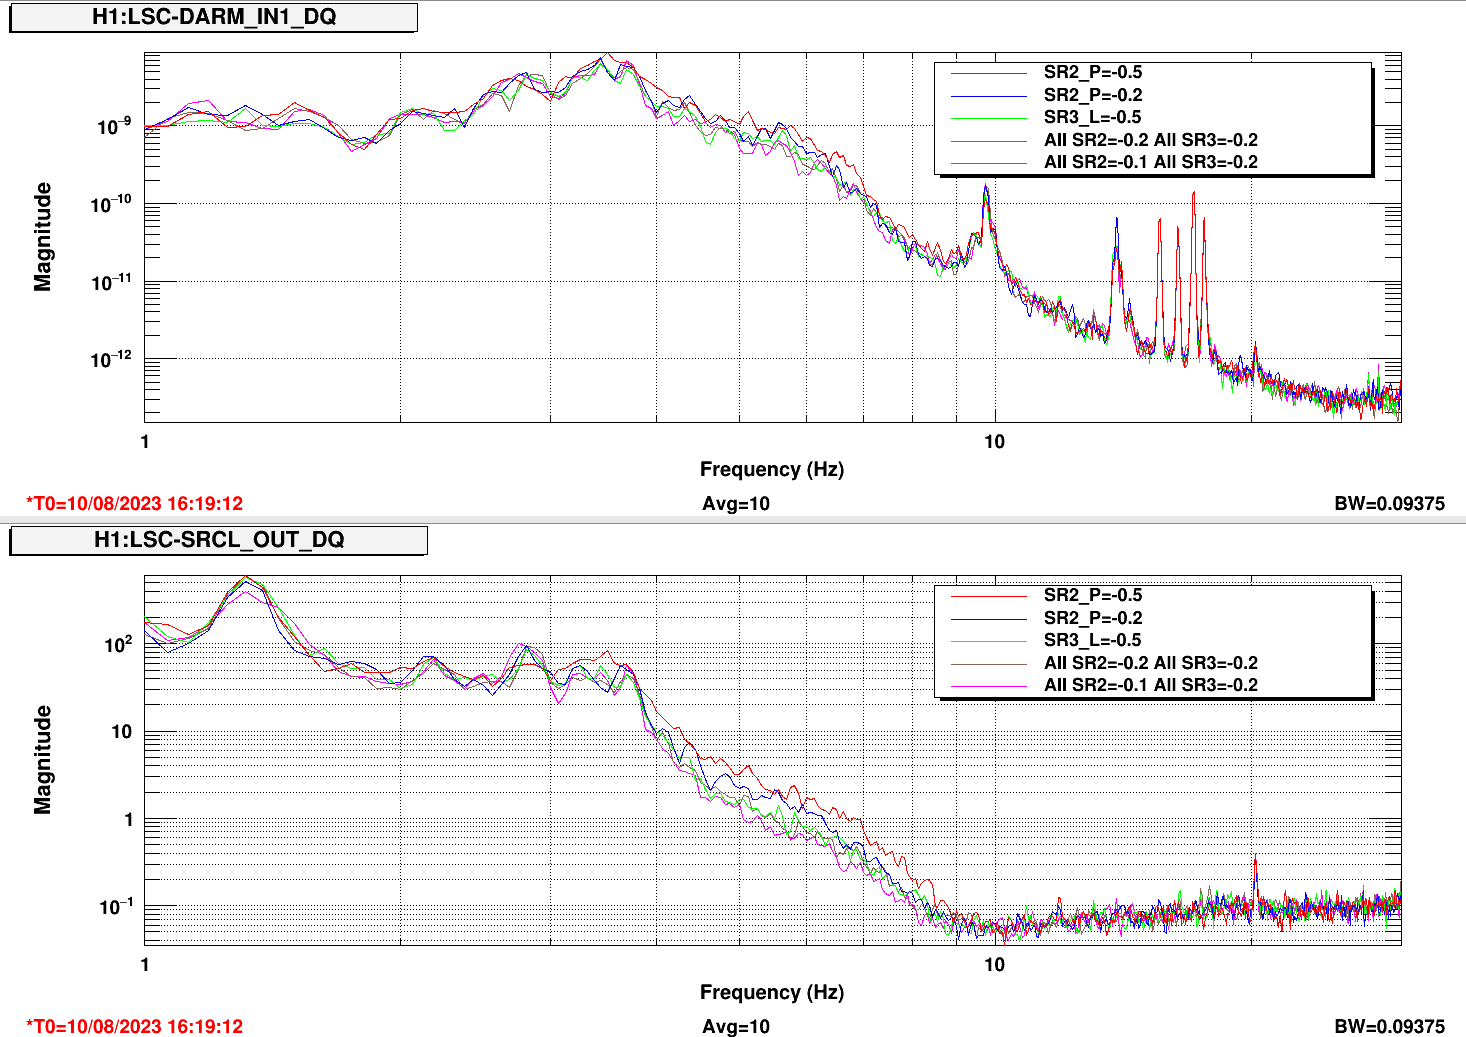
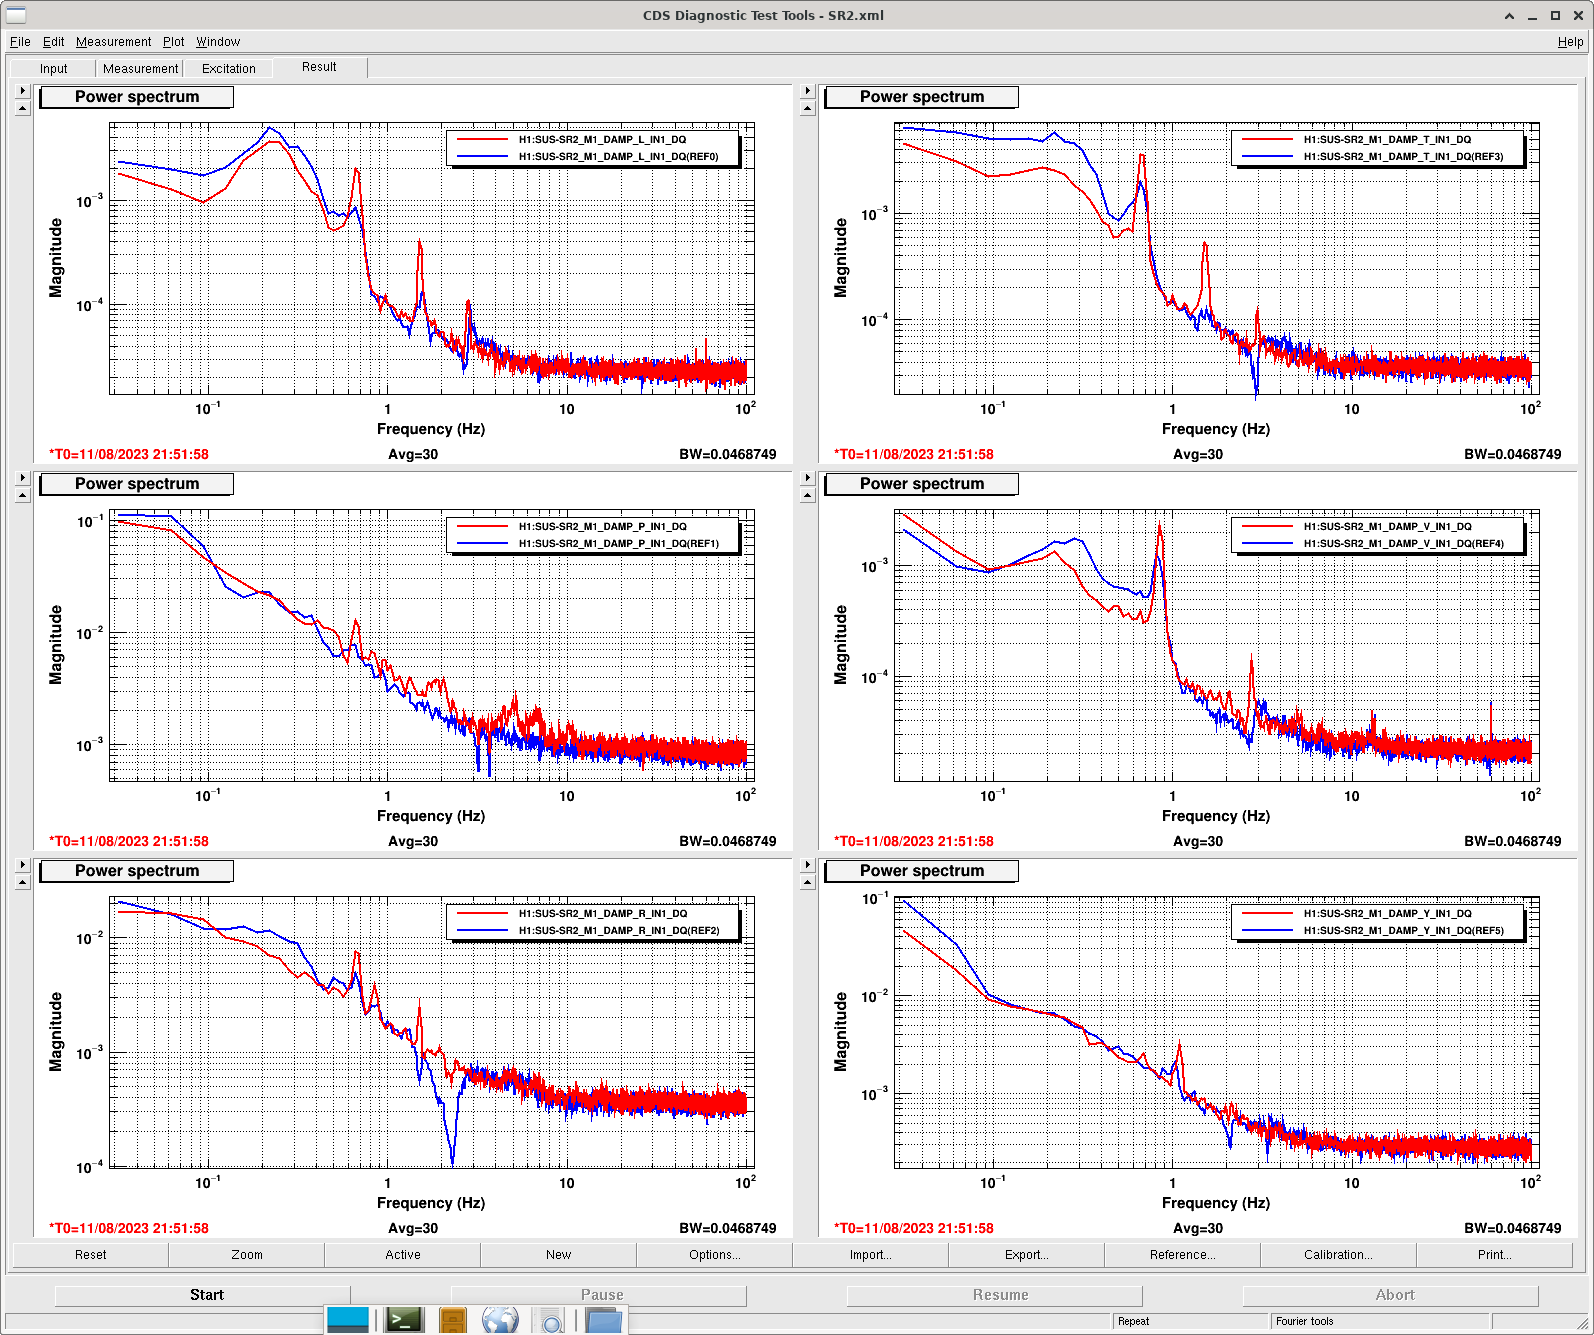
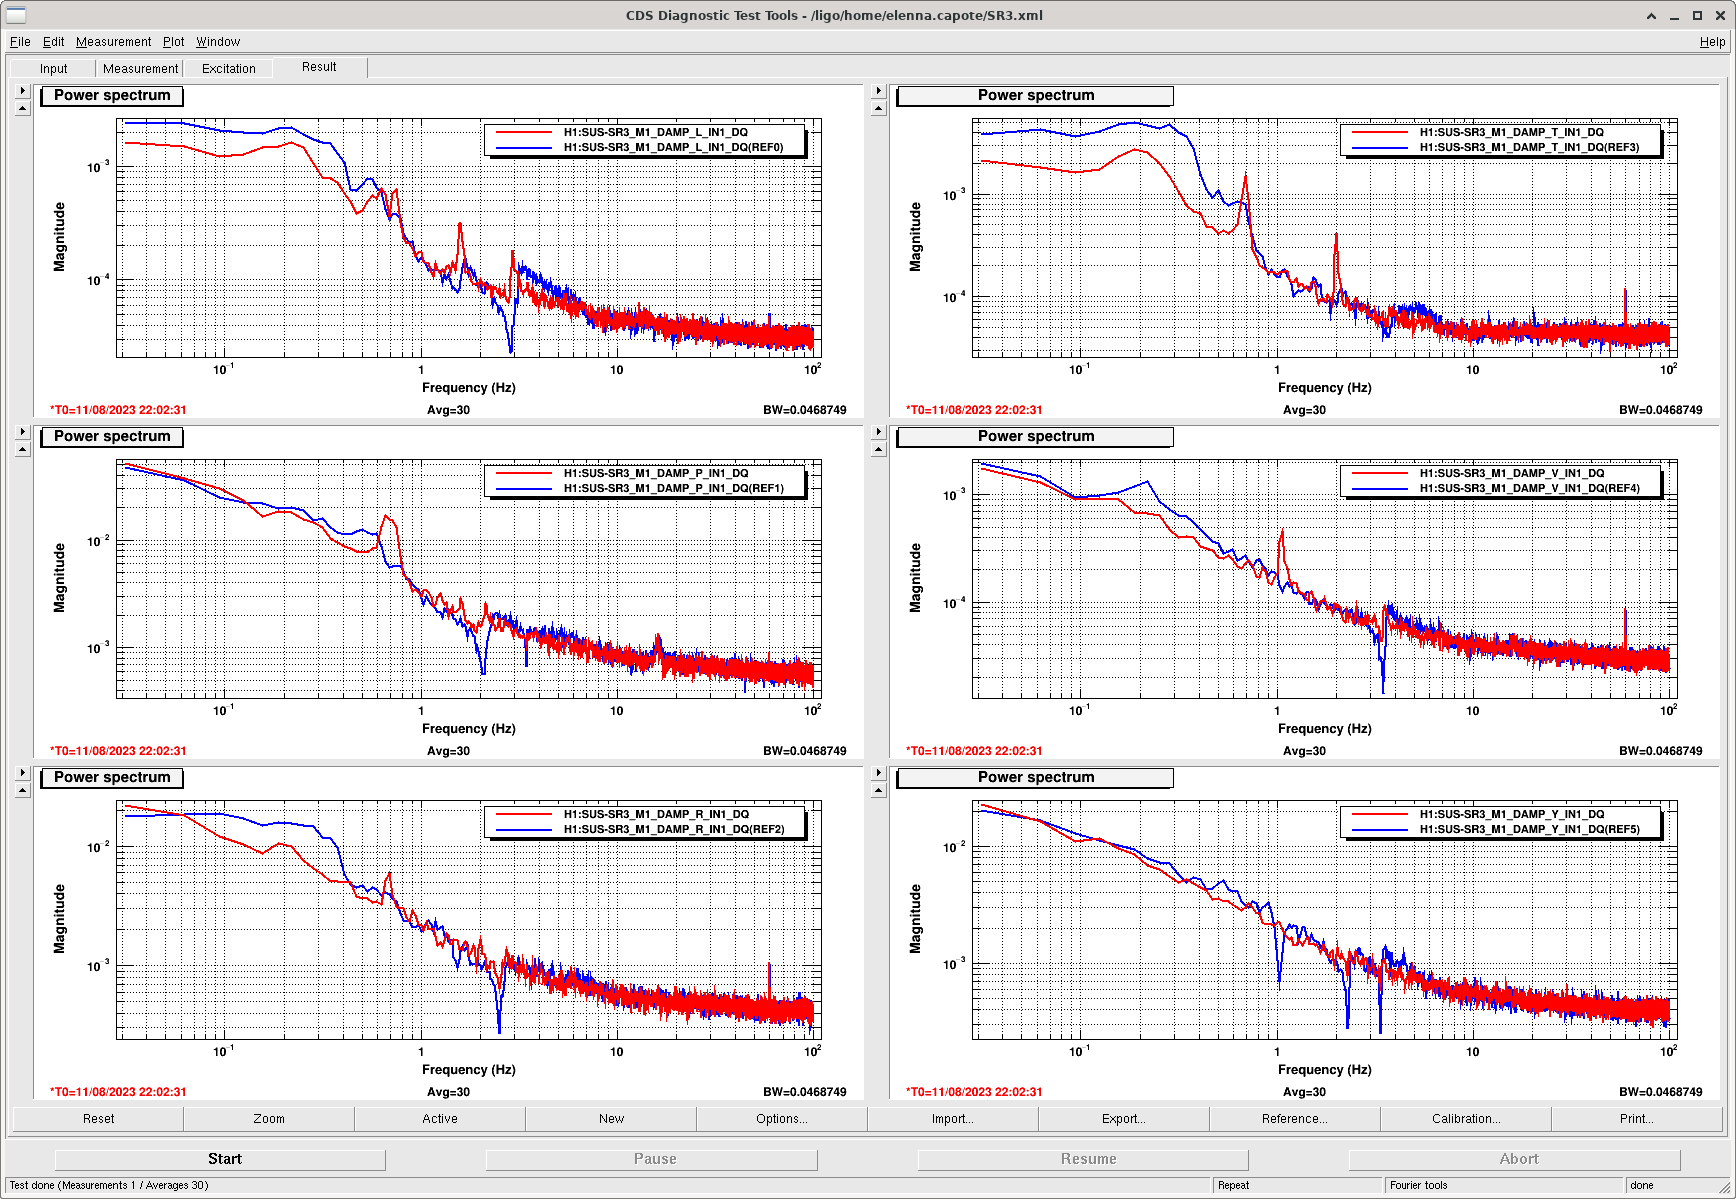
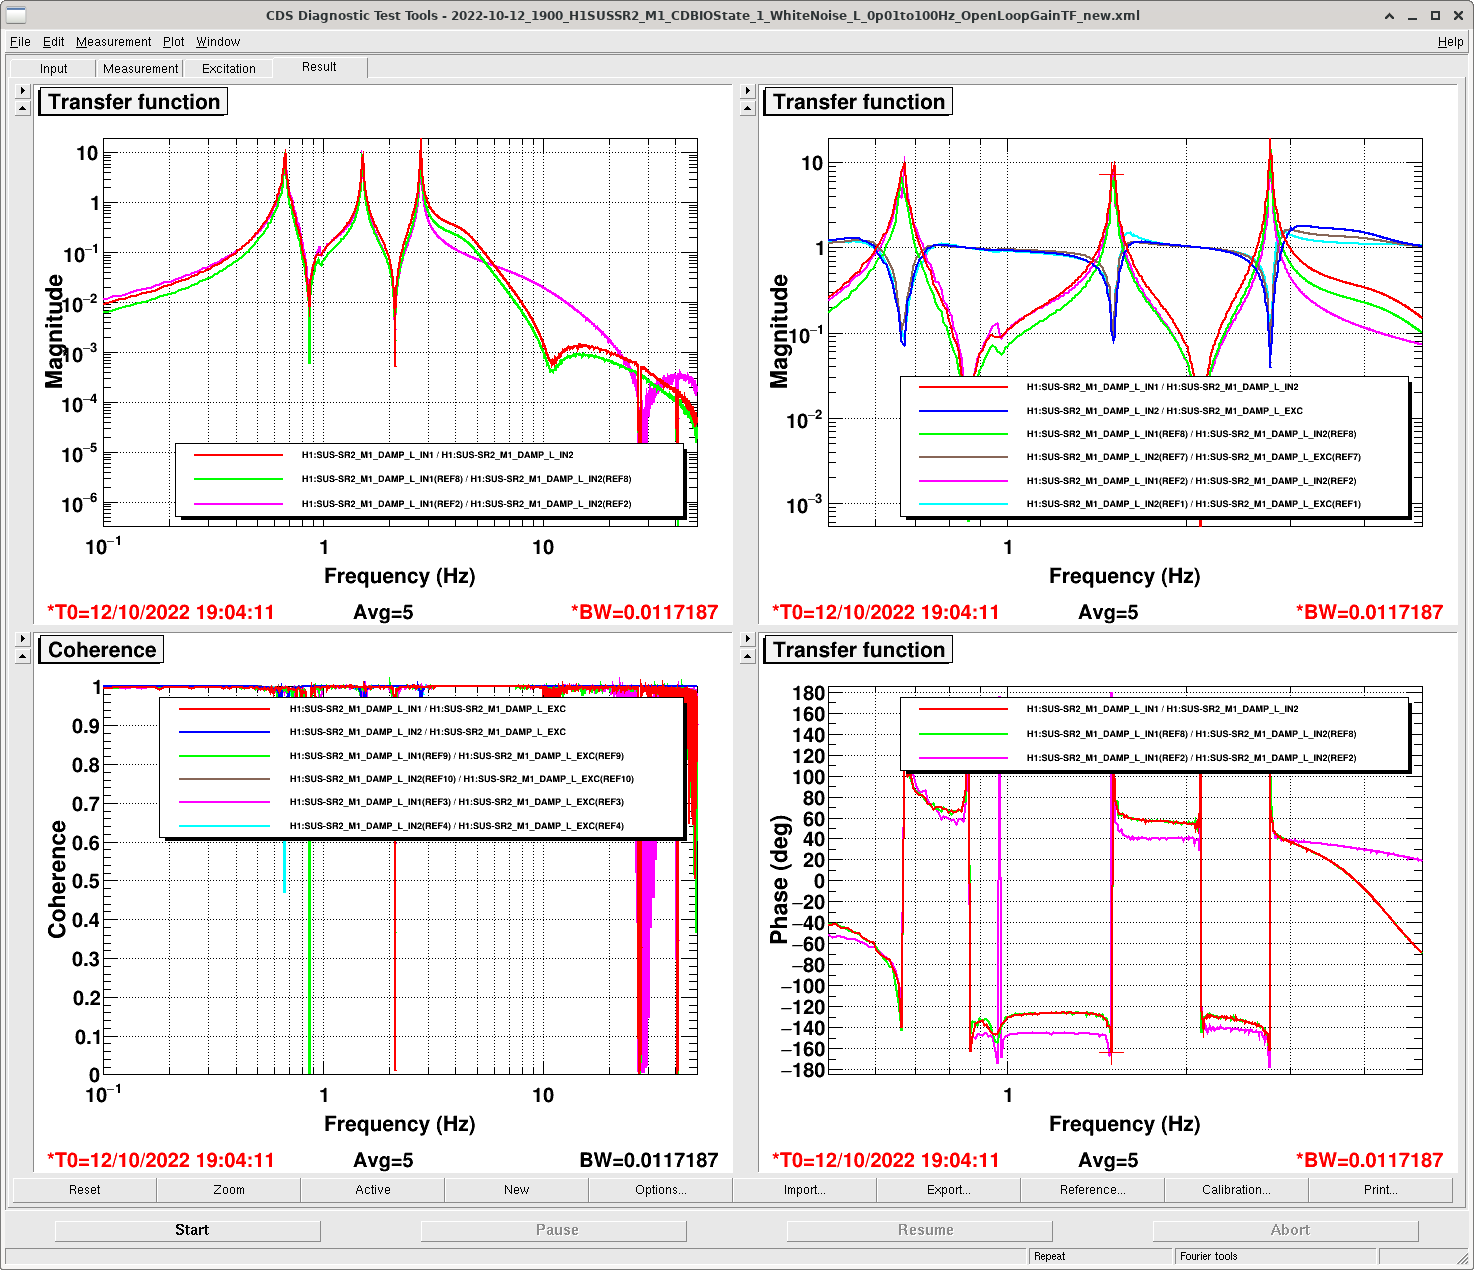
Comparing a DARM spectrum before and after this change to the damping gains, you can see that the reduction in the damping gain did reduce DARM and SRCL above 3 Hz, but also created a new peak in DARM and SRCL at 2.8 Hz. I also plotted spectra of all dofs of SR2 and SR3 before and after the damping gain change showing that some suspension resonances are no longer being suppressed. All reference traces are from a lock on Aug 9 before these damping gains were reduced and the live traces are from this current lock. The final plot shows a transfer function measurement of SR2 L taken by Jeff and me in Oct 2022.
Since we fell out of lock, I took the opportunity to make SR2 and SR3 damping gain adjustments. I have split the difference on the gain reductions in Gabriele's alog. I increased all the SR2 damping gains from -0.1 to -0.2 (nominal is -0.5). I increased the SR3 damping gains from -0.2 to -0.5 (nominal is -1).
This is guardian controlled in LOWNOISE_ASC, because we need to acquire lock with higher damping gains.
Once we are back in lock, I will check the presence of the 2.8 Hz peak in DARM and determine how much different the DARM RMS is from this change.
There will be SDF diffs in observe for all SR2 and SR3 damping dofs. They can be accepted.
SR2 and SR3 damping gains changes that Elenna made have been accepted
The DARM RMS increases by about 8% with these new slightly higher gains. These gains are a factor of 2/2.5 greater than Gabriele's reduction. The 2.8 Hz peak in DARM is down by 21%.
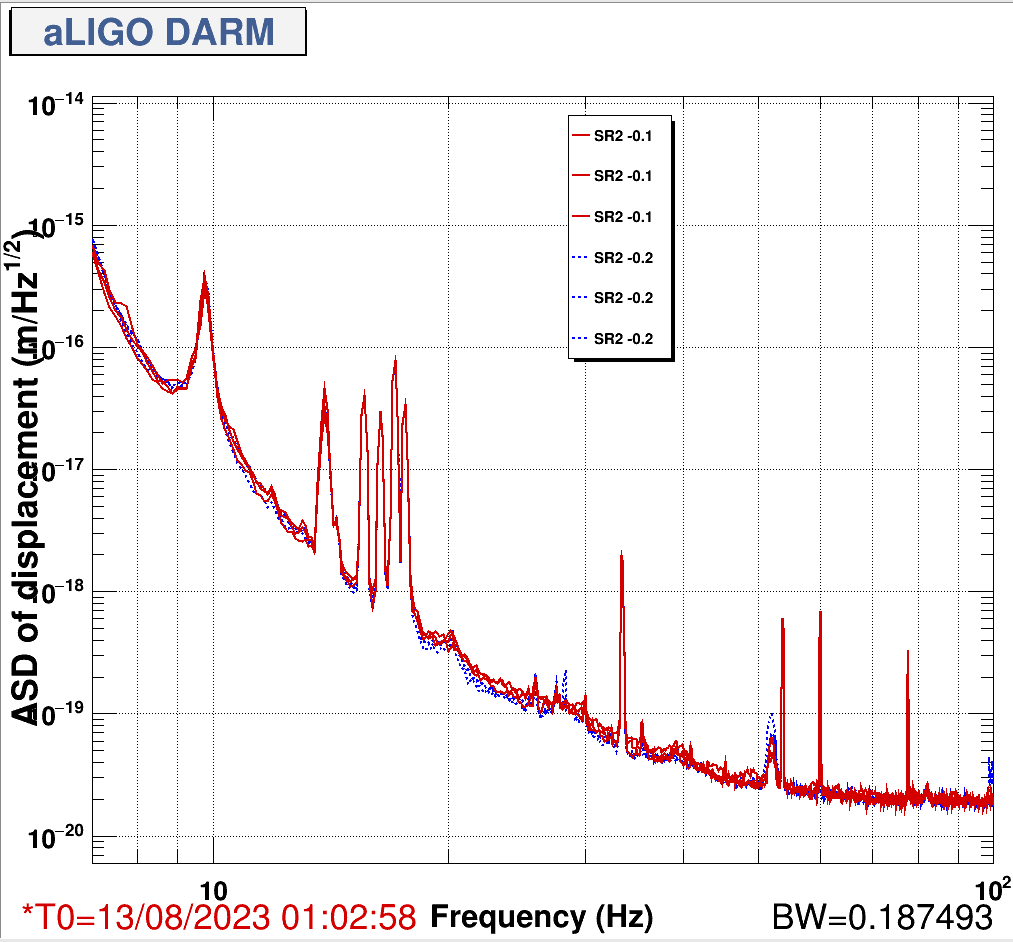
This is a somewhat difficult determination to make, given all the nonstationary noise from 20-50 Hz, but it appears the DARM sensitivity is slightly improved from 20-40 Hz with a slightly higher SR2 gain. I randomly selected several times from the past few locks with the SR2 gains set to -0.1 and recent data from the last 24 hours where SR2 gains were set to -0.2. There is a small improvement in the data with all SR2 damping gains = -0.2 and SR3 damping gains= -0.5.
I think we need to do additional tests to determine exactly how SR2 and SR3 motion limit SRCL and DARM so we can make more targeted improvements to both. My unconfirmed conclusion from this small set of data is that while we may be able to reduce reinjected sensor noise above 3 Hz with a damping gain reduction, we will also limit DARM if there is too much motion from SR2 and SR3.
Benoit, Ansel, Derek
Benoit noticed that for recent locks, the 102.13 Hz calibration line is much louder than typical for the first few hours of the lock. An example of this behavior is shown in the attached spectrogram of H1 strain data on August 5 - this is the first day this behavior appeared. Ansel noted that this feature includes a comb-like structure around the line that is only present in the H1:GDS-CALIB_STRAIN_NOLINES channel and not H1:GDS-CALIB_STRAIN (see spectra for CALIB_STRAIN and CALIB_STRAIN_NOLINES on Aug 5). This issue also visible in the PCAL trends for the 102.13 Hz line.
We are not sure if the excess noise near 102.13 Hz is from the calibration line itself or another noise source that is near the line. However, the behavior has been present for every lock since 12:30 UTC on August 5 2023.


FYI,
$ gpstime Aug 05 2023 12:30 UTC
    PDT: 2023-08-05 05:30:00.000000 PDT
    UTC: 2023-08-05 12:30:00.000000 UTC
    GPS: 1375273818.000000
so... this behavior seems to have started at 5:30a local time on a Saturday. Therefore *very* unlikely that the start of this issue is intentional / human change driven.

The investigation continues....
making sure to tag CAL.
Other facts and recent events:
- Attached are 2 screenshots that show the actual *digital* excitation is not changing with time in anyway.
    :: 2023-08-08_H1PCALEX_OSC7_102p13Hz_Line_3mo_trend.png shows the specific oscillator, --- PCALX's OSC7 which drives the 102.13 Hz line's EPICs channel version of its output. The minute trend shows the max, min, and mean of the output, and there's no change in amplitude.
    :: 2023-08-08_H1PCALEX_EXC_SUM_3mo_trend.png shows a trend of the total excitation sum from PCAL X. This also shows *no* change in time in amplitude.

Both trends show the Aug 02 2023 change in amplitude kerfuffle I caused that Corey found and a bit later rectified -- see LHO:71894 and subsequent comments, but that was done, over with an solved, definitely by Aug 03 2023 UTC and unrelated to the start up of this problem.

It's also well after I installed new oscillators and rebooted the PCALX, PCALY, and OMC models on Aug 01 2023 (see LHO:71881).


The front-end version of the calibration's systematic error at 102.13 Hz also shows the long, time-dependent issue -- this will allow us to trend the issue against other channels

Folks in the calibration group have found that the online monitoring system for the
    -  overall DARM response function systematic error
    - (absolute reference) / (Calibrated Data Product) [m/m]
    - ( \eta_R ) ^ (-1)
    - (C / 1+G)_pcal / (C / 1+G)_strain
    - CAL-DELTAL_REF_PCAL_DQ / GDS-CALIB_STRAIN
(all different ways of saying the same thing; see T1900169) in calibration at each PCAL calibration line frequency -- the "grafana" pages -- are showing *huge* amounts of systematic error during these times when the amplitude of the line is super loud.

Though this metric is super useful because it's dreadfully obvious that things are going wrong -- this metric is not in any normal frame structure, so you can't compare it against other channels to find out what's causing the systematic error.

However -- remember -- we commissioned a front-end version of this monitoring during ER15 -- see LHO:69285.

That means the channels
     H1:CAL-CS_TDEP_PCAL_LINE8_COMPARISON_OSC_FREQ        << the frequency of the monitor
    H1:CAL-CS_TDEP_PCAL_LINE8_SYSERROR_MAG_MPM        << the magnitude of the systematic error
    H1:CAL-CS_TDEP_PCAL_LINE8_SYSERROR_PHA_DEG        << the phase of the systematic error

tell you (what's supposed to be***) equivalent information.

*** One might say that "what's suppose to be" is the same as "roughly equivalent" due to the following reasons:
    (1) because we're human, the one system is displaying the systematic error \eta_R, and the other is displaying the inverse ( \eta_R ) ^ (-1)
    (2) Because this is early-days in the front-end system, it uses the "less complete" calibrated channel CAL-DELTAL_EXTERNAL_DQ rather than the "fully correct" channel GDS-CALIB_STRAIN

But because the problem is so dreadfully obvious in these metrics, even though they're only *roughly* equivalent, you can see the same thing.
In the attached screenshot, I show both metrics for the most recent observation stretch, between 10:15 and 14:00 UTC on 2023-Aug-09.

Let's use this front-end metric to narrow down the problem via trending.

There appears to be no change in the PCALX analog excitation monitors either.

Attached is a trend of some key channels in the optical follower servo -- the analog feedback system that serves as intensity stabilization and excitation power linearization for the PCAL's laser light that gets transmitted to the test mass -- the actuator of which is an acousto-optic modulator (an AOM). There seems to be no major differences in the max, min, and mean of these signals before vs. after these problems started on Aug 05 2023.

H1:CAL-PCALX_OFS_PD_OUT_DQ
H1:CAL-PCALX_OFS_AOM_DRIVE_MON_OUT_DQ

I believe this is caused by the presence of another line very close to the 102.13 Hz pcal line. This second line is present at the start of a lock stretch but seems to go away as the lock stretch continues. I have attached a plot showing a zoom-in on an ASD around 102.1-102.2 Hz right after a lock stretch (orange), where the second peak is evident, and well into a lock stretch (blue) where the PCAL line is still present, but the second peak right below it in frequency is gone. This ASD is computed using an hour of data for each curve, so we can get the needed resolution for these two peaks.
I don't know the origin of this second line. However, a quick fix to the issue could be moving the PCAL line over by about a Hz. The second attached plot shows that the spectrum looks pretty clean from 101-102 Hz, so somewhere in there would be probably be okay for a new location of the PCAL line.


Since it looks like the additional noise is at 102.12833 Hz, I did a quick check in Fscan data from Aug 5 for channels where there is high coherence with DELTAL_EXTERNAL at 102.12833 but *not* at 102.13000 Hz. This narrows down to just a few channels:
(lines git issue opened as we work on this.)
As a result of Ansel's discovery, and conversation on the CAL call today -- I've moved the calibration line frequency from 102.13 to 104.23 Hz. See LHO:72108.
This line may have appeared in the previous lock the day before (Aug 4). The daily spectrogram for Aug 4 shows a line near 100 Hz starting at 21:00 UTC.

Looking at alogs leading up to the time Derek notes above, I noticed that Gabriele retuned and tested new LSC FF. This change may be related to this new peak. Remembering some issues we had recently where DHARD filter impulses were ringing up violin modes, I checked the new LSC FF filters and how they are engaged in the guardian. Some of them have no ramp time, and the filter bank is turned on immediately along with the filters in the guardian. I have no idea why that would cause a peak at 102 Hz, but I updated those filters to have a 3 second ramp.
Reloaded the H1LSC model to load in Elenna's filter changes
Now that the calibration line has been moved, the comb-like structure at the calibration line frequency is no longer present (checked in the CLEAN channel).
We can also see the shape of the 102.12833 Hz line much more clearly without the overlapping calibration line. I have attached a plot for reference on the width and shape.

As discussed in todays commissioning meeting, I checked TMSX and ETMX movement for a kick during locking and couldn't see anything suspicious. I did find some increase motion/noise every 8Hz in TMSX 1s into ENGAGE_SOFT_LOOPS when ISC_LOCK isn't explicitly doing anything, plot attached. However this noise was present prior to Aug 4th, (July 30th attached).
TMS is suspicious as Betsy found that TMS's have violin modes ~103-104Hz.
Jeff draws attendtion to 38295, showing modes of quad blade springs above 110Hz, and 24917 showing quad top wire modes above 300Hz.
Elenna's notes with calibration lines off (as we are experimenting with for current lock) we can see this 102Hz peak at ISC_LOCK state ENGAGE_ASC_FOR_FULL_IFO. We were mistaken.


To preserve documentation, this problem has now been solved, with more details in 72537, 72319, and 72262.
The cause of this peak was a spurious, narrow, 102 Hz feature in the SRCL feedforward that we didn't catch when the filter was made. This has been been fixed, and the cause of the mistake has been documented in the first alog listed above so we hopefully don't repeat this error.
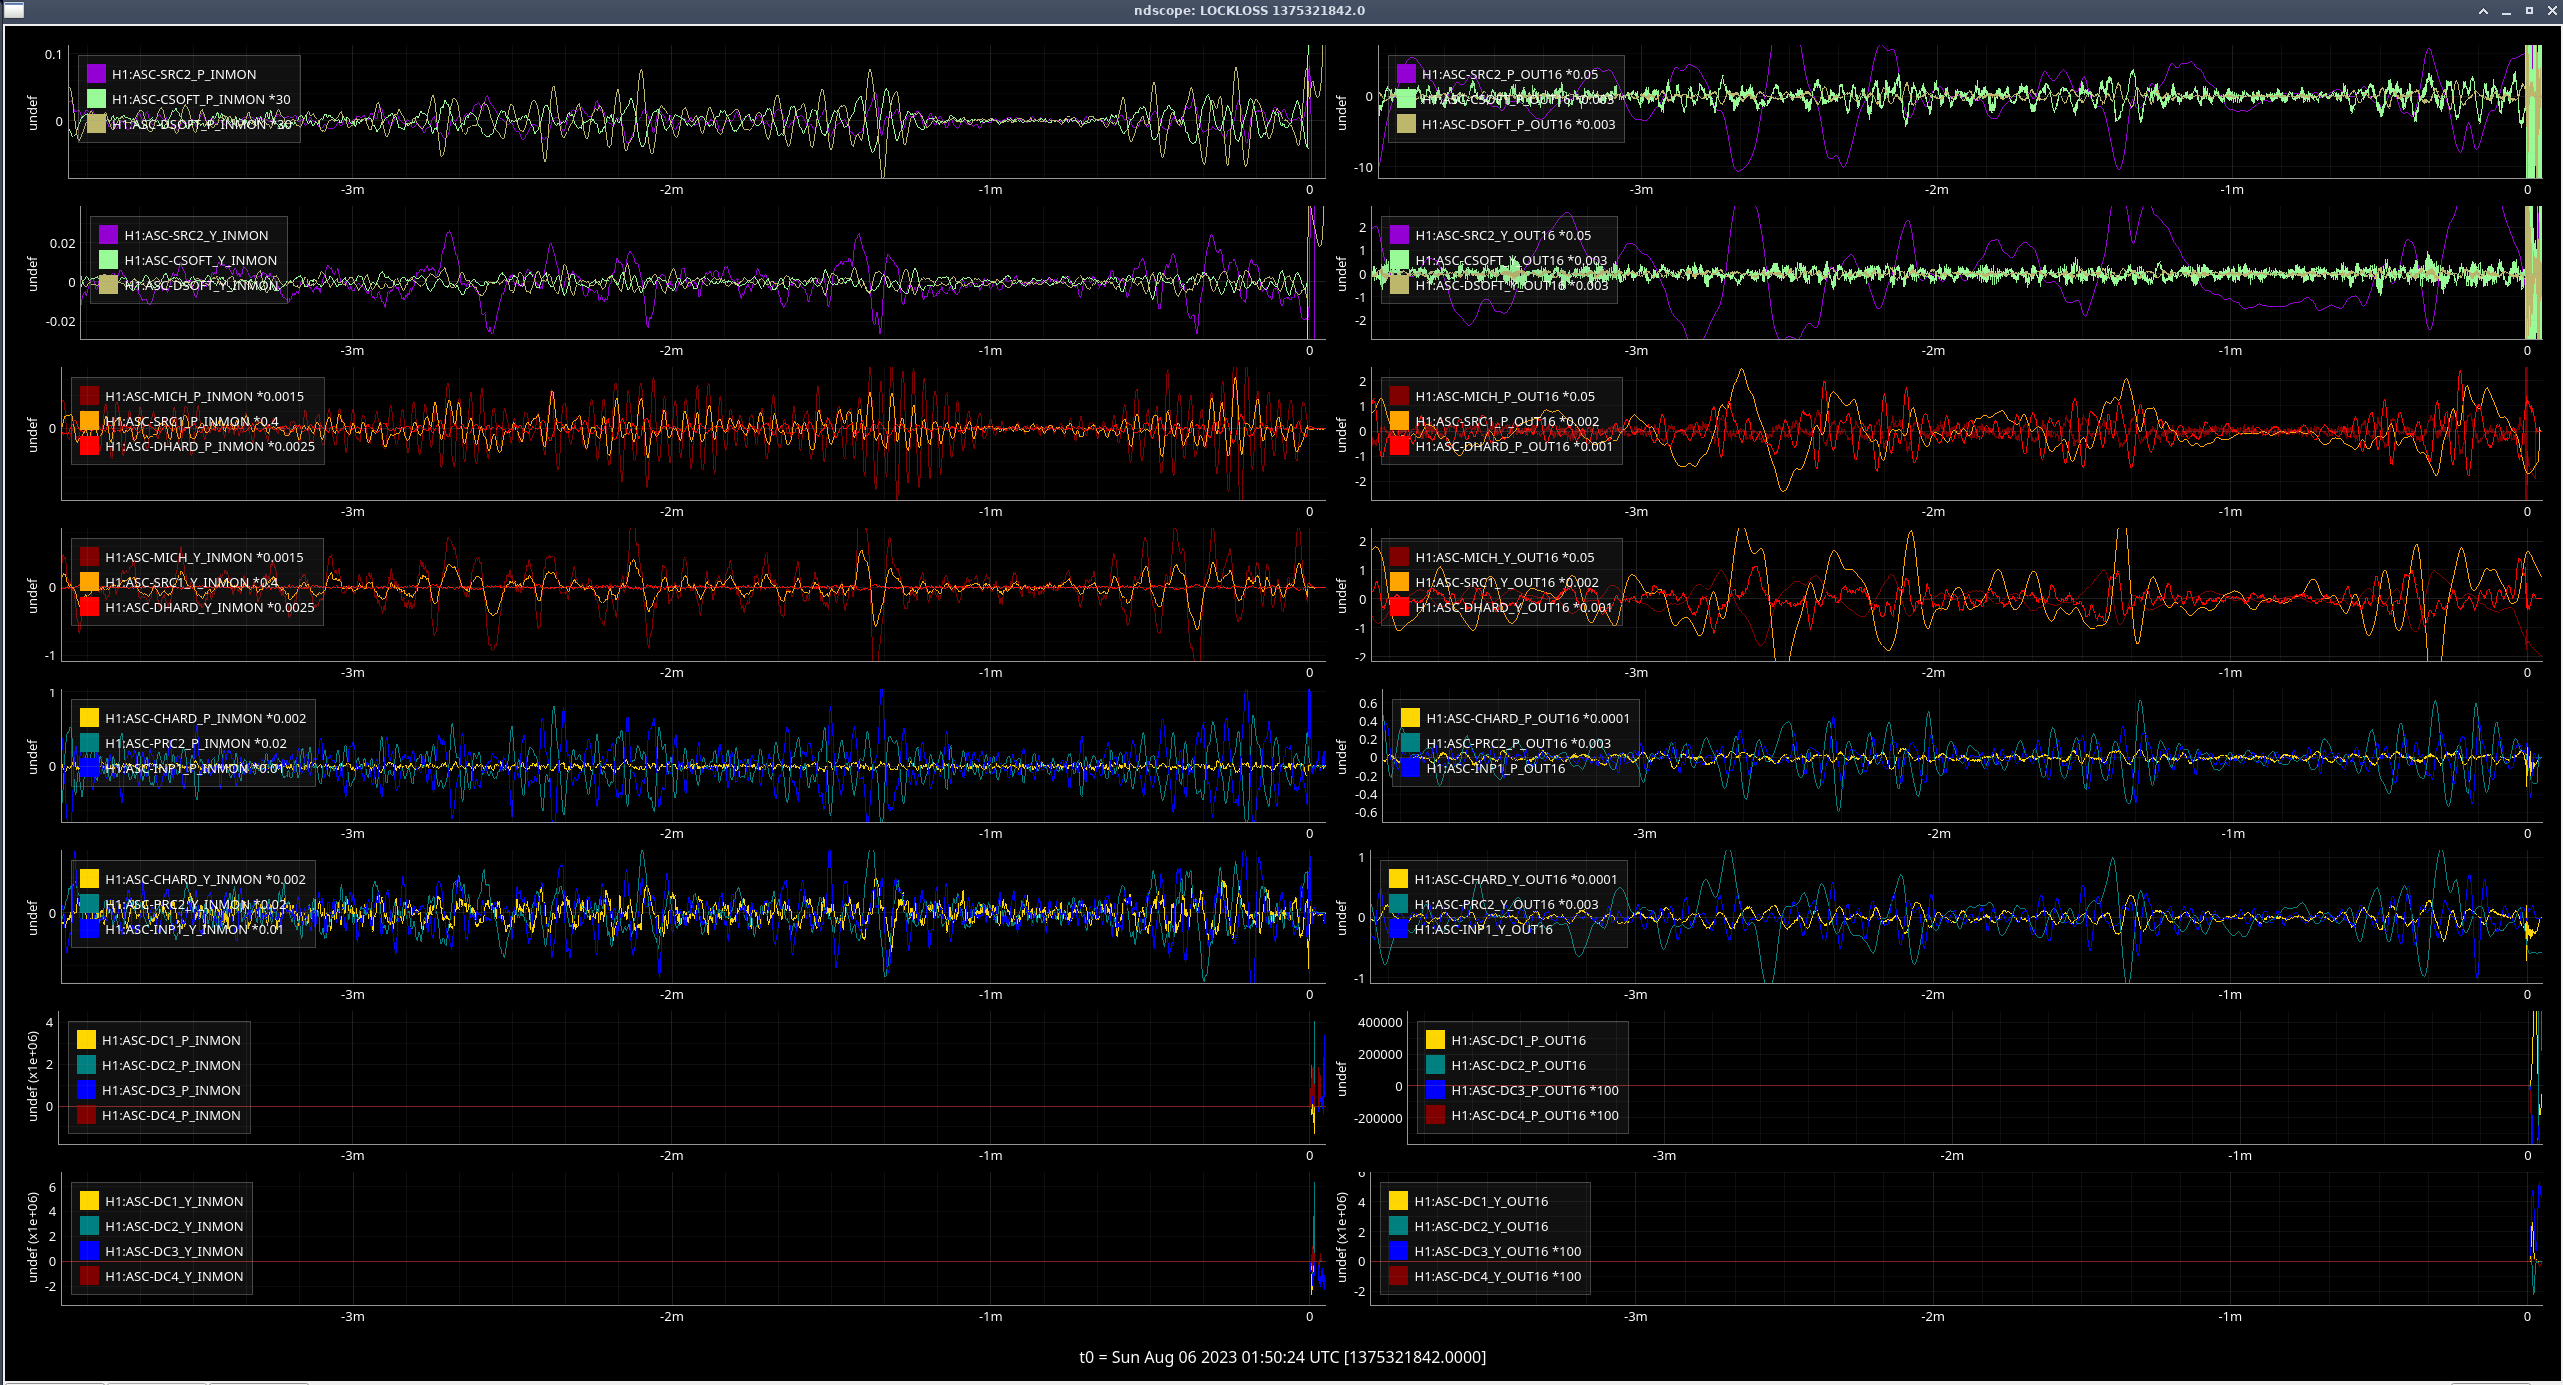
Lockloss @ 1:50 UTC, was noticing some instability in the ASC loops on the CR screen, particuarlly for the SRC and HARD loops, though can't say for certain if this caused the lockloss.
[Keita, Nutsinee, Sheila, Jenne]
We went in to HAM6 today, and believe that we have finished all ISC/SQZ related tasks, and are ready to begin closeout procedures tomorrow. (Betsy, who has the final say, will write an alog or talk to the relevant folks for the actual final start of closeout.)
After Richard opened the PSL shutter and Ed locked the IMC, we pretty easily were able to get beam onto AS_C. To check our alignment, Sheila aligned the Michelson, then made sure we were still centered on AS_C. Since we don't have arms, we just assumed that the input beam is pretty close to its usual, and only adjusted ITMs and BS for MICH. Around this time, Keita noticed that there was a bit of a 'tail' on the beam as seen on an IR card. Sheila walked SR2 and SR3 until the tail was gone, but we were still centered on AS_C. After this we aligned SRY (restored SRM, misaligned ITMX) to get good fringes, so that we could trust the SRM position for squeezer-related work. We also took the IMC offline (which misaligns MC2) to remove the main IFO beam, injected the SQZ beam, ran the squeezer's ASC loops, and noted that the ZM1 actuators were very close to the edge of their ranges (as Sheila made a quick note about in alog 52405). We deferred action on this until after the main IFO path checks were complete.
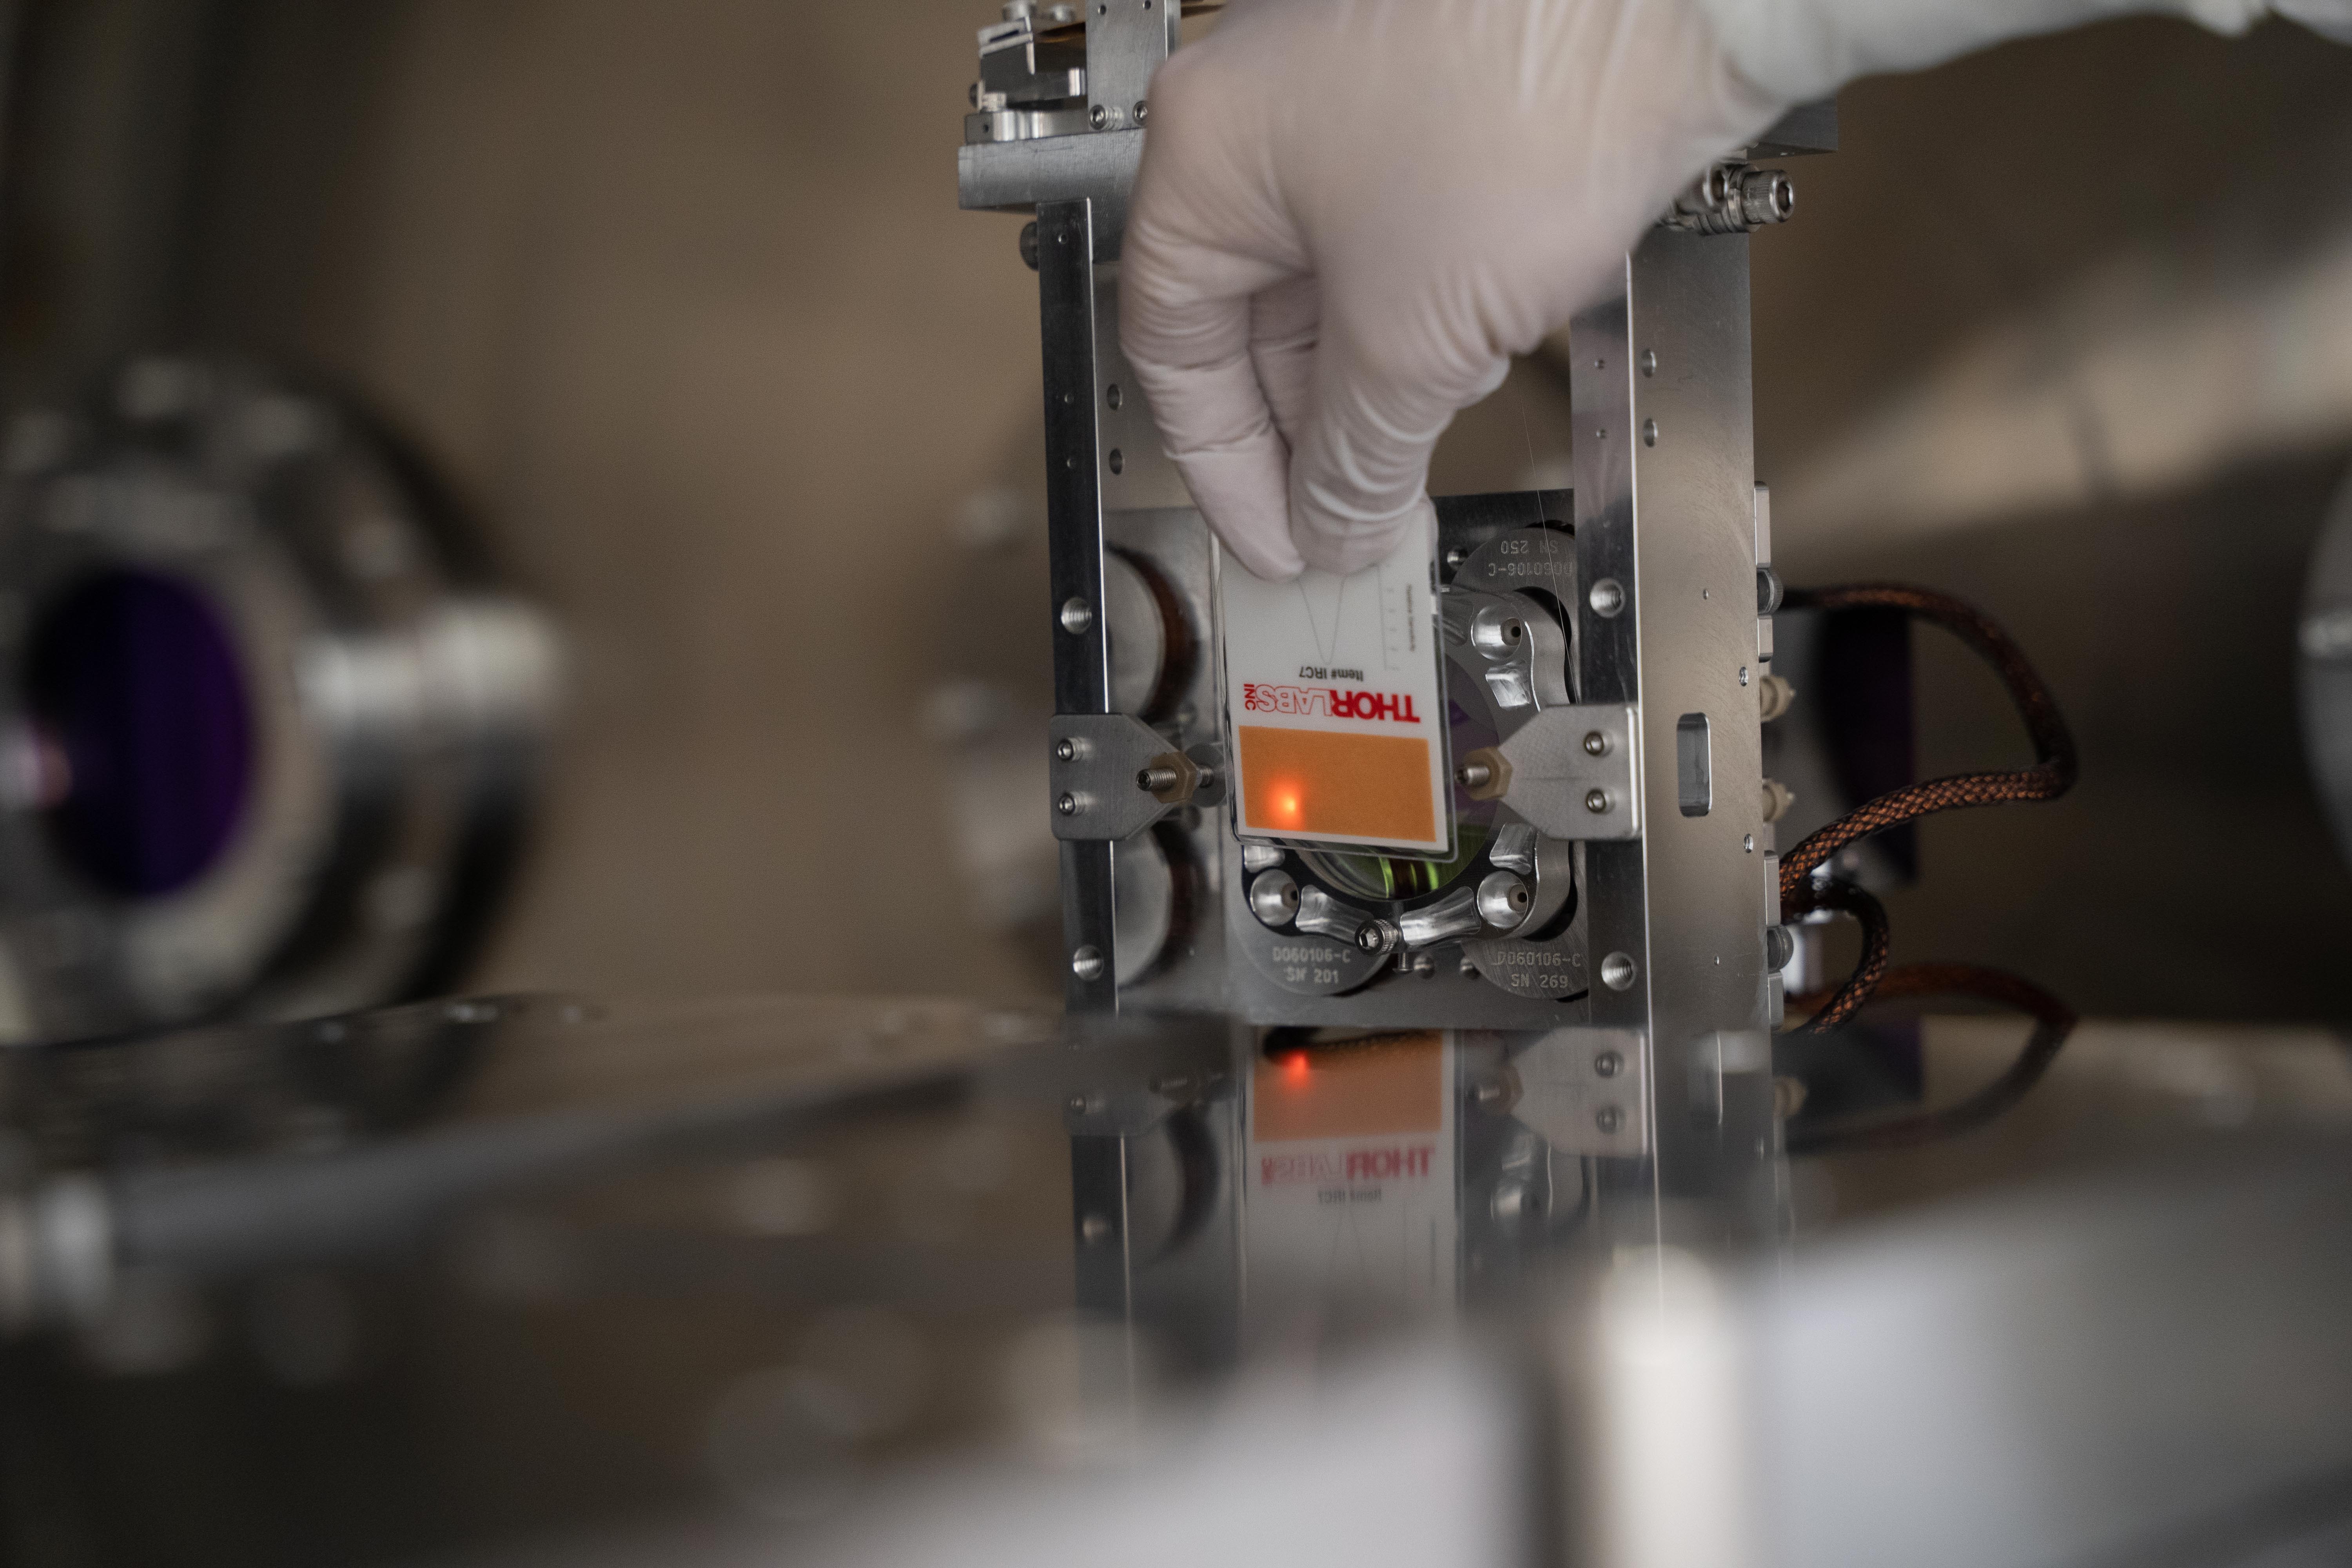
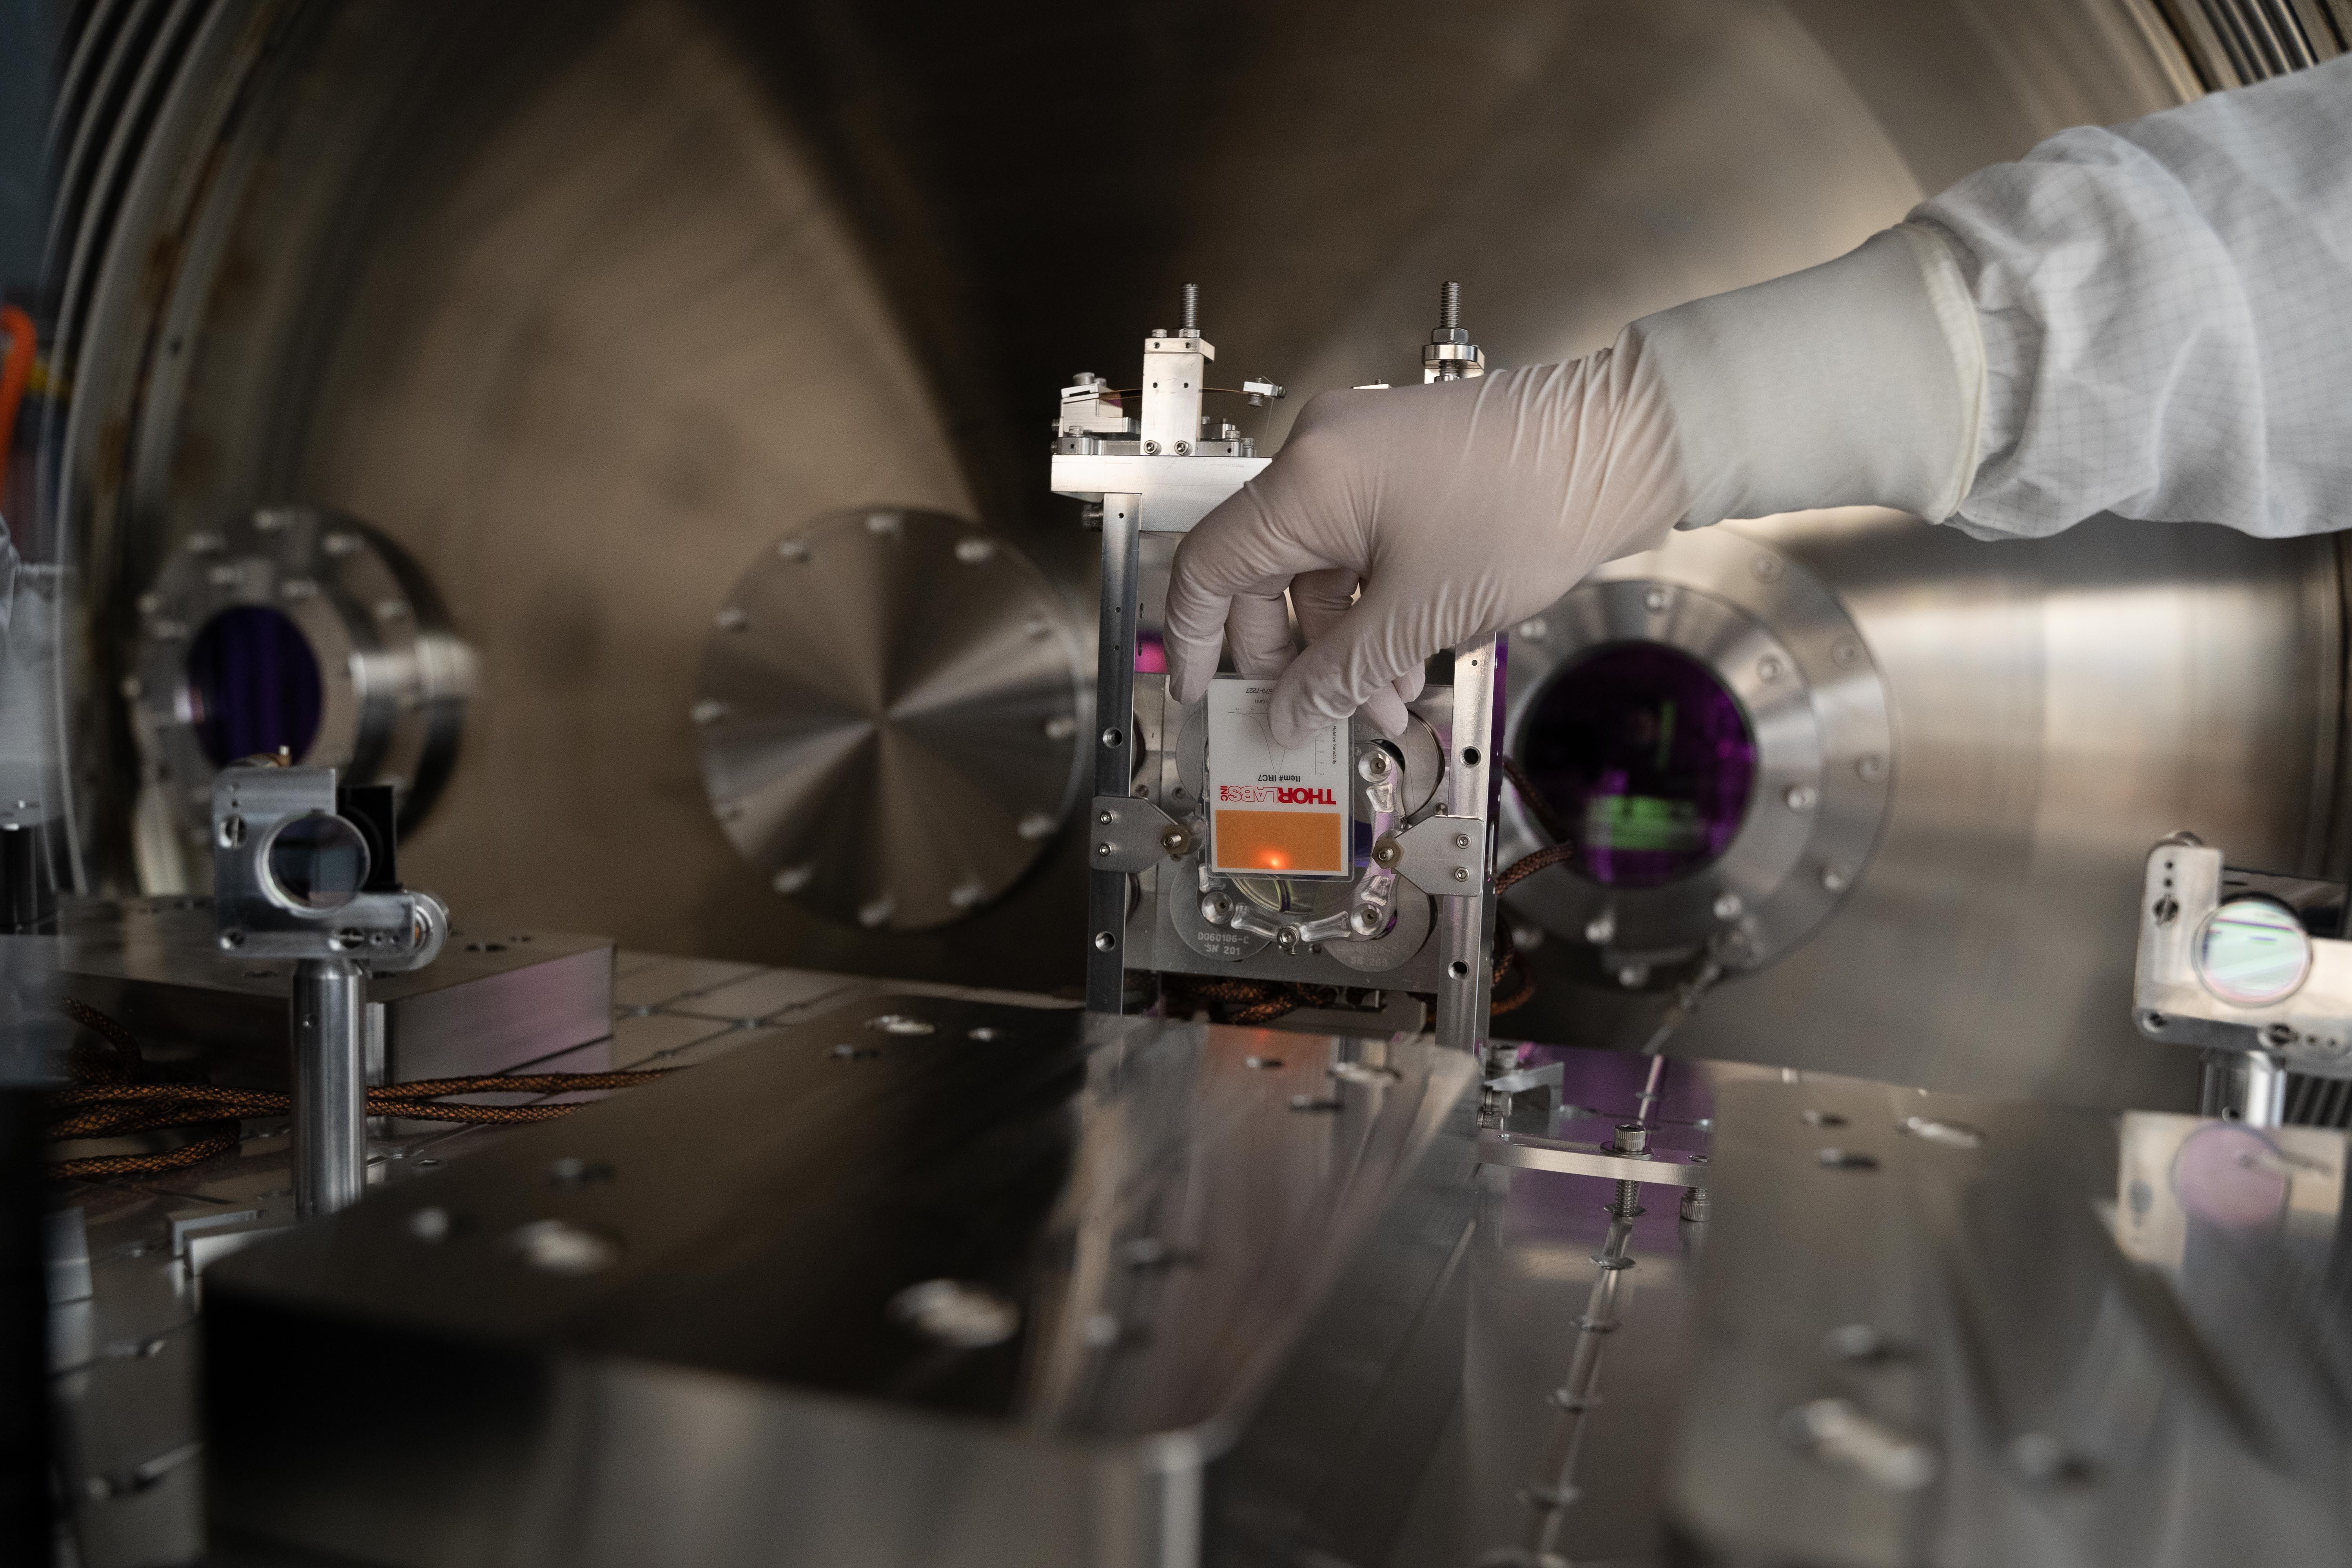
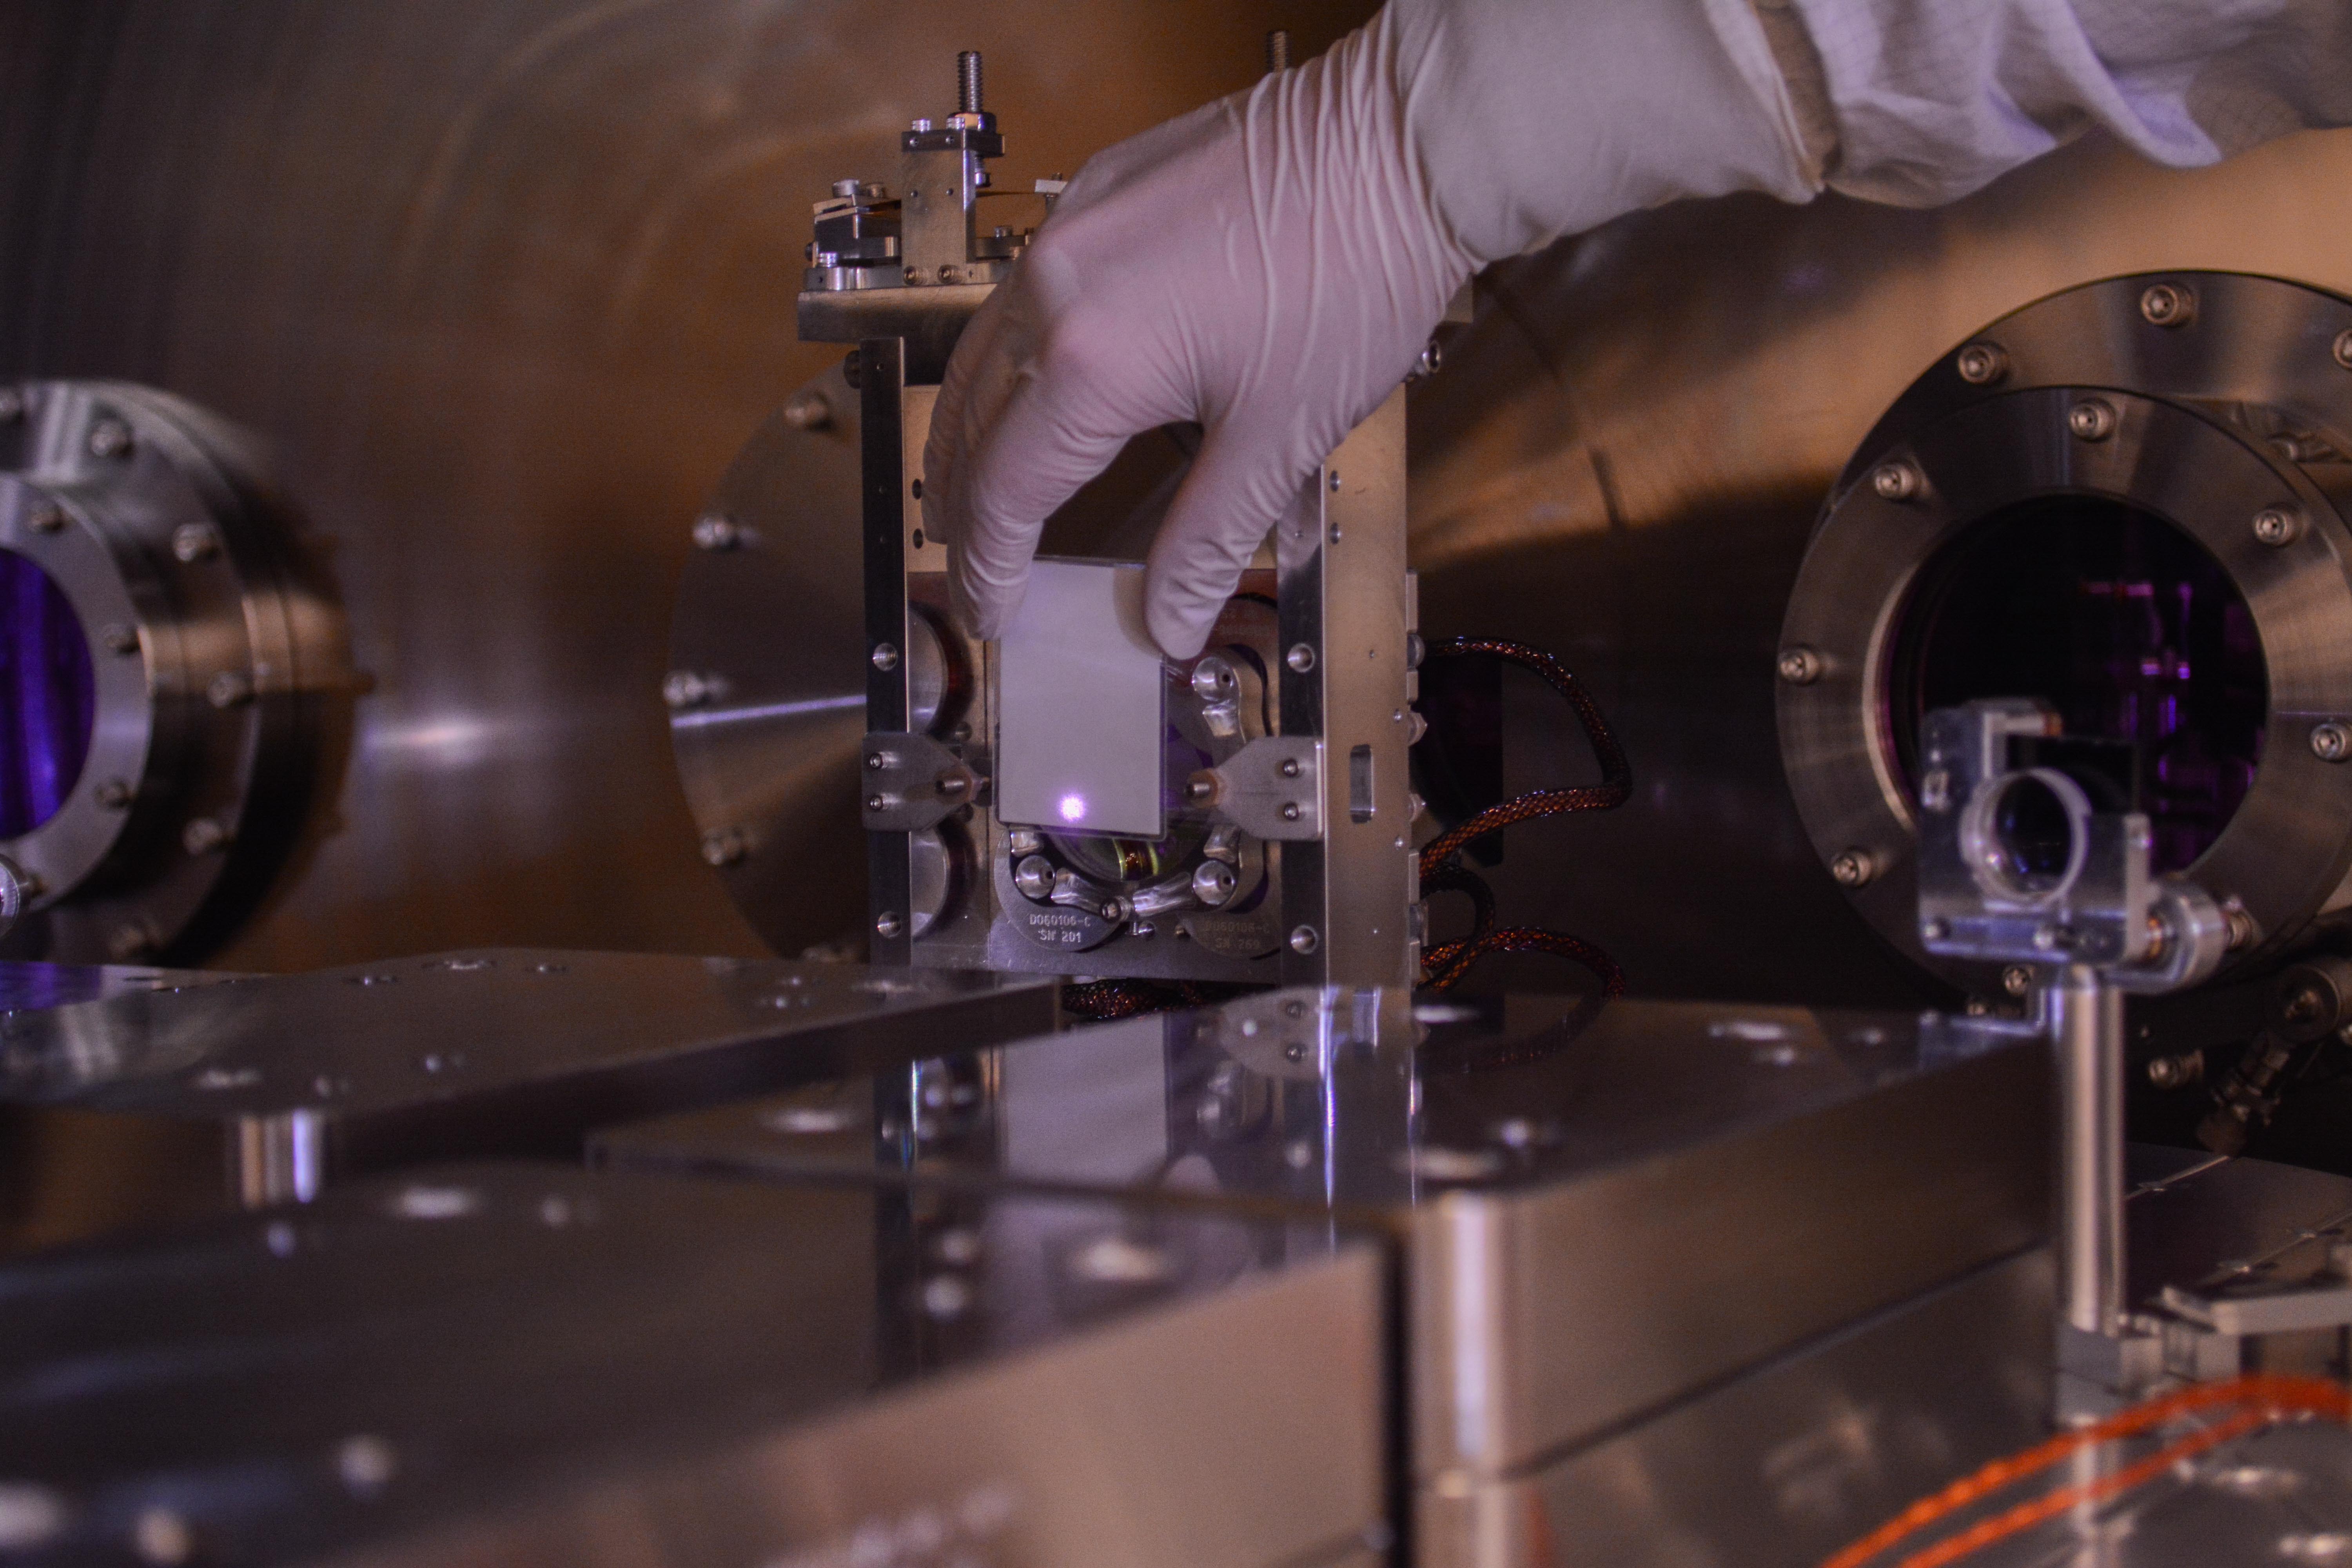
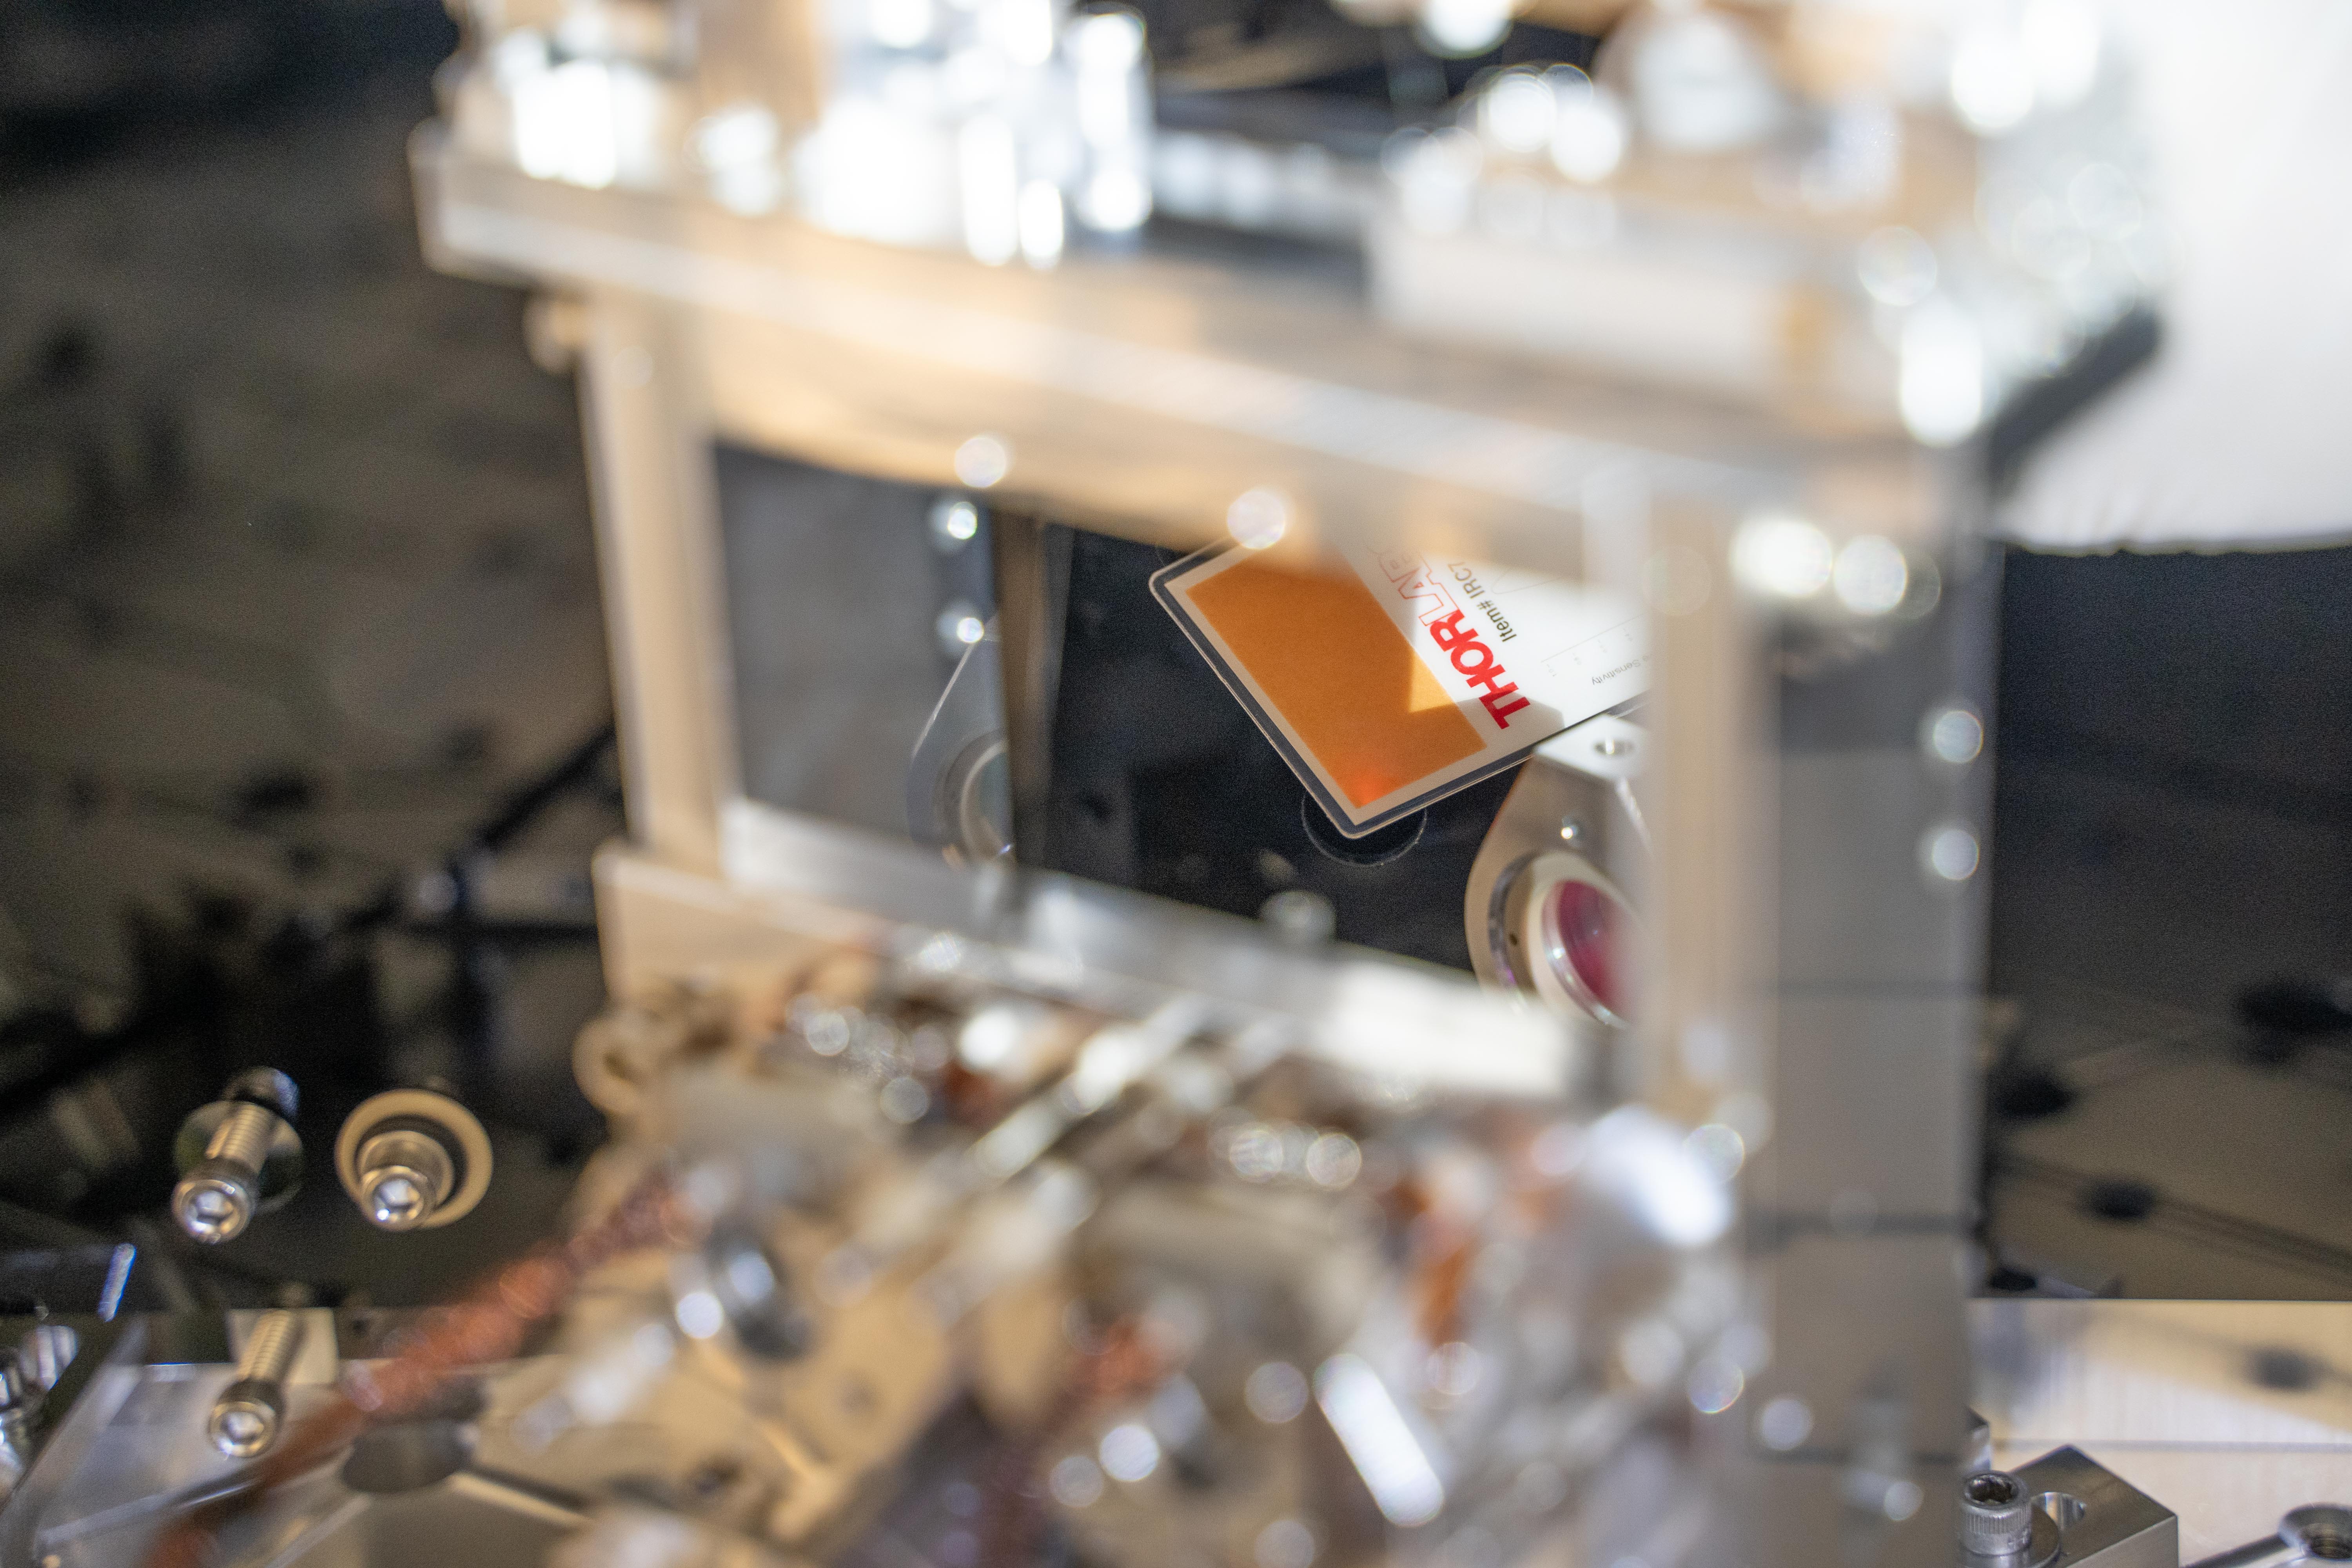
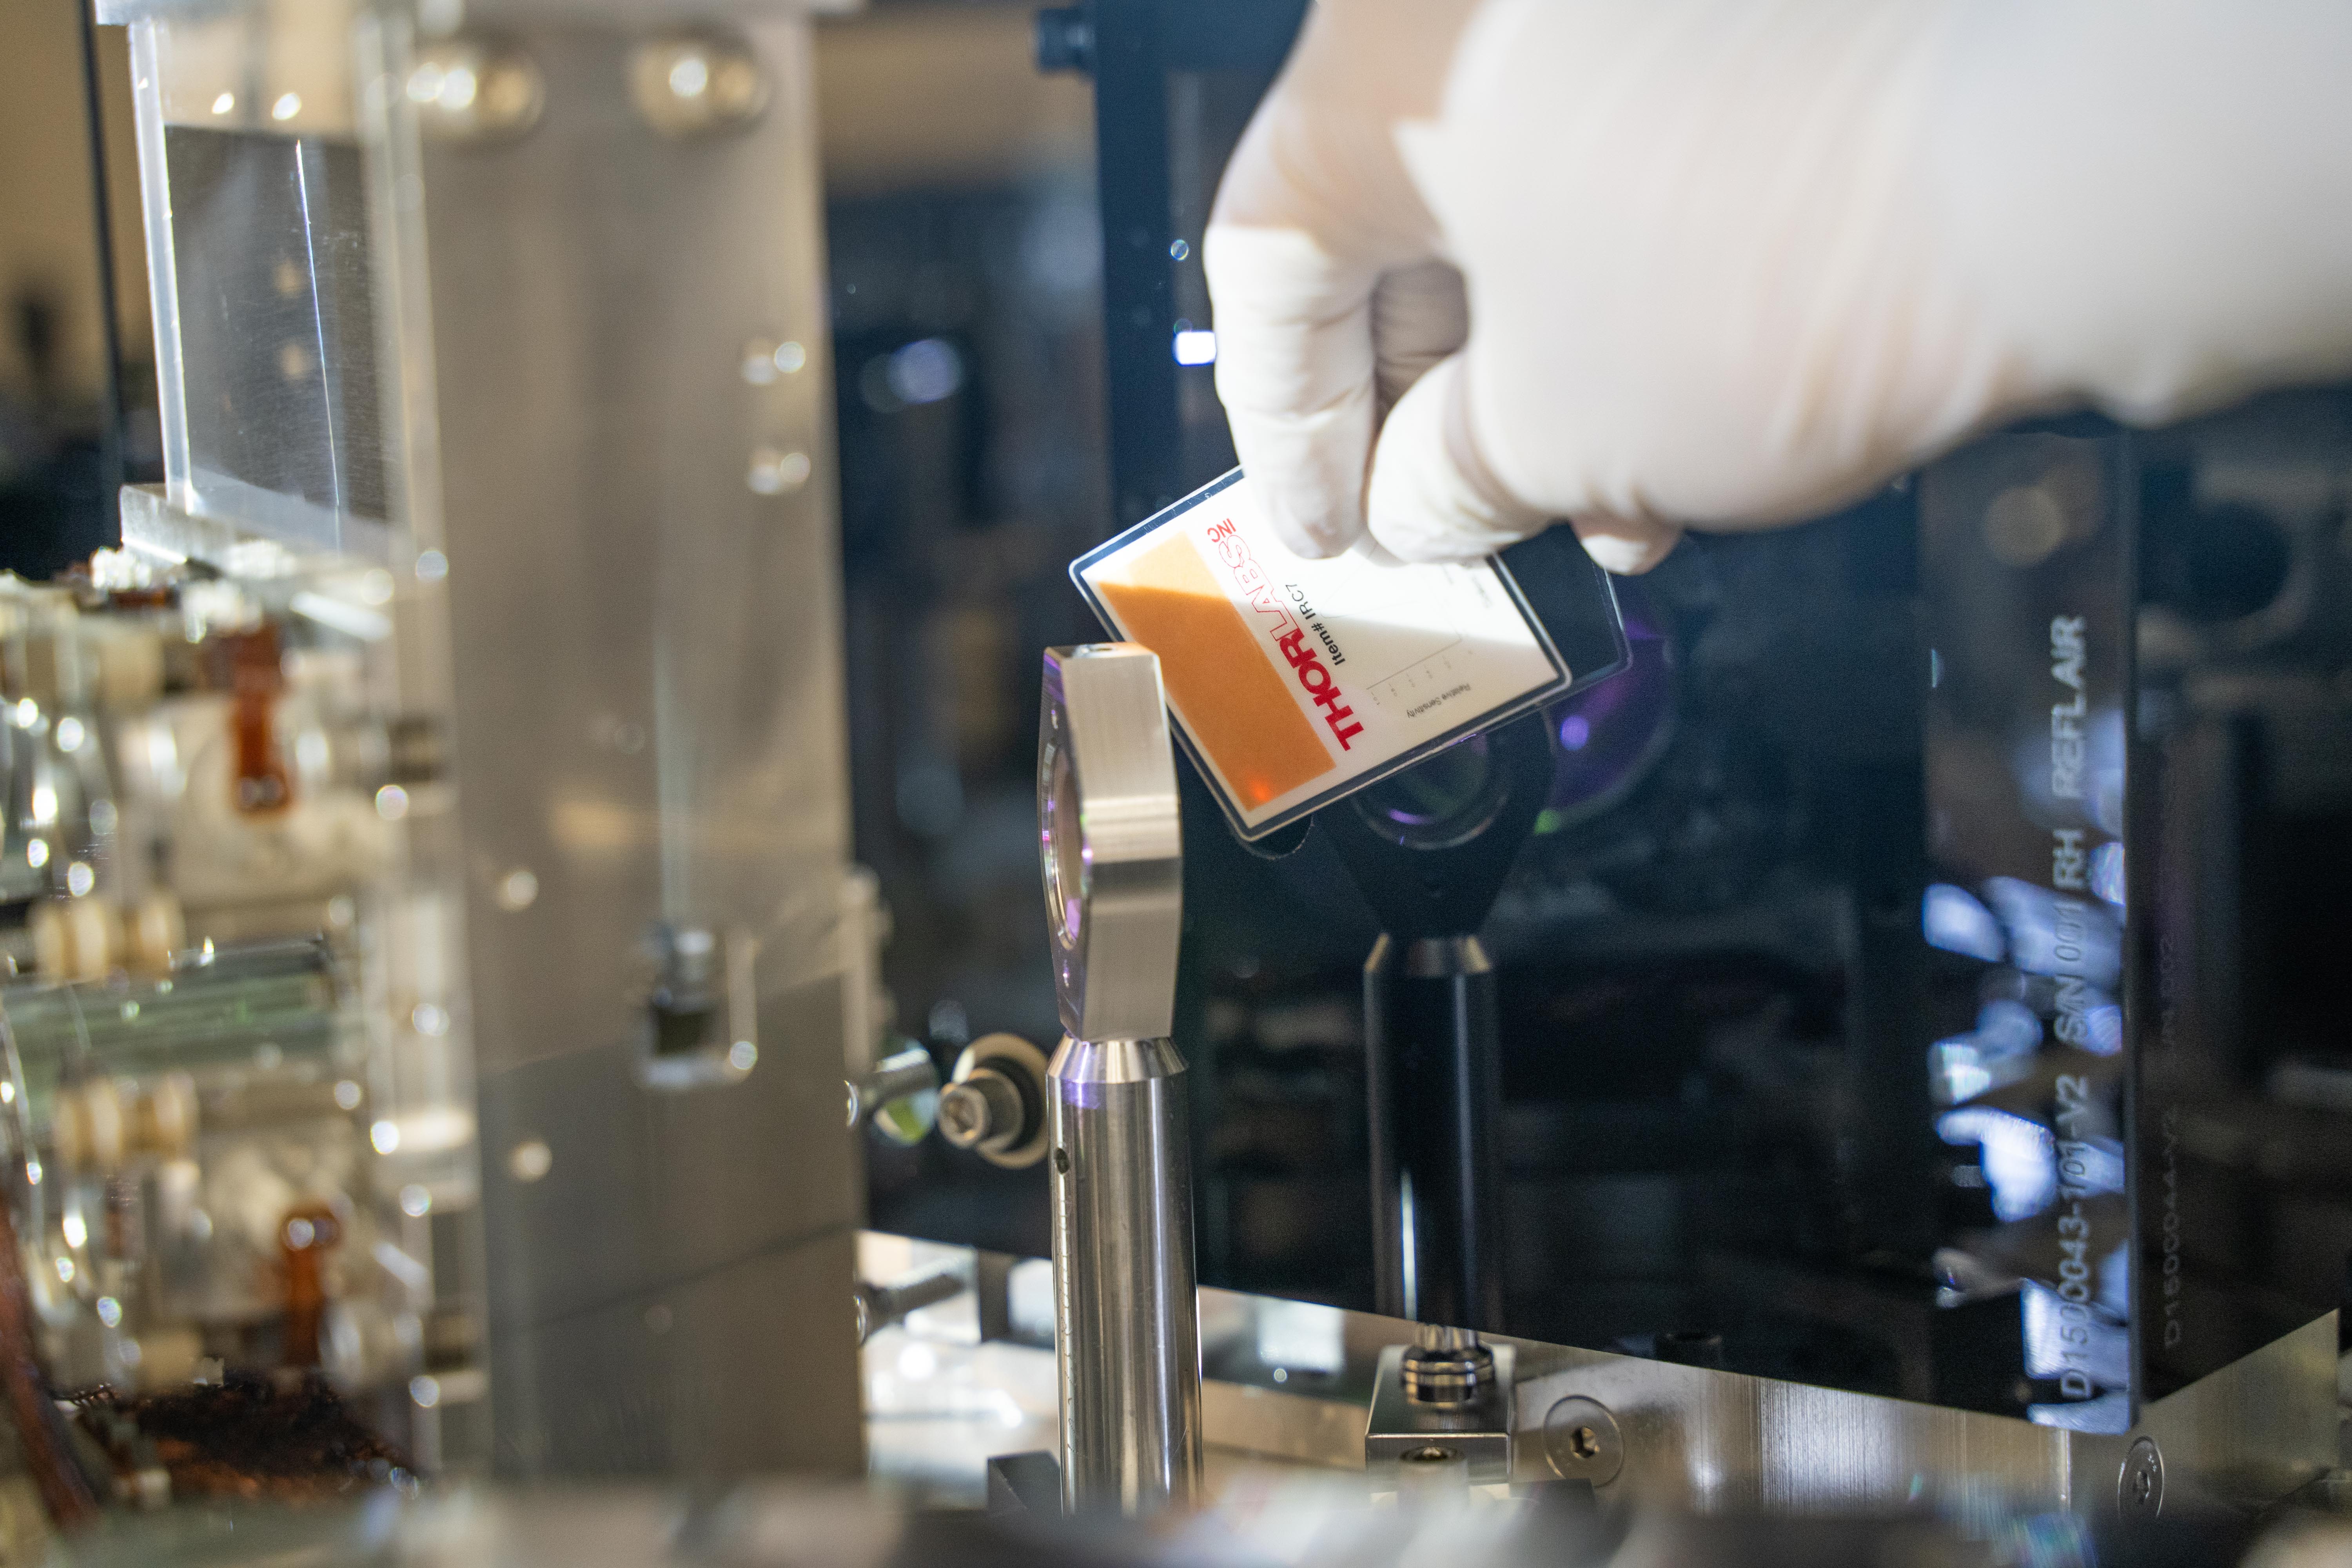
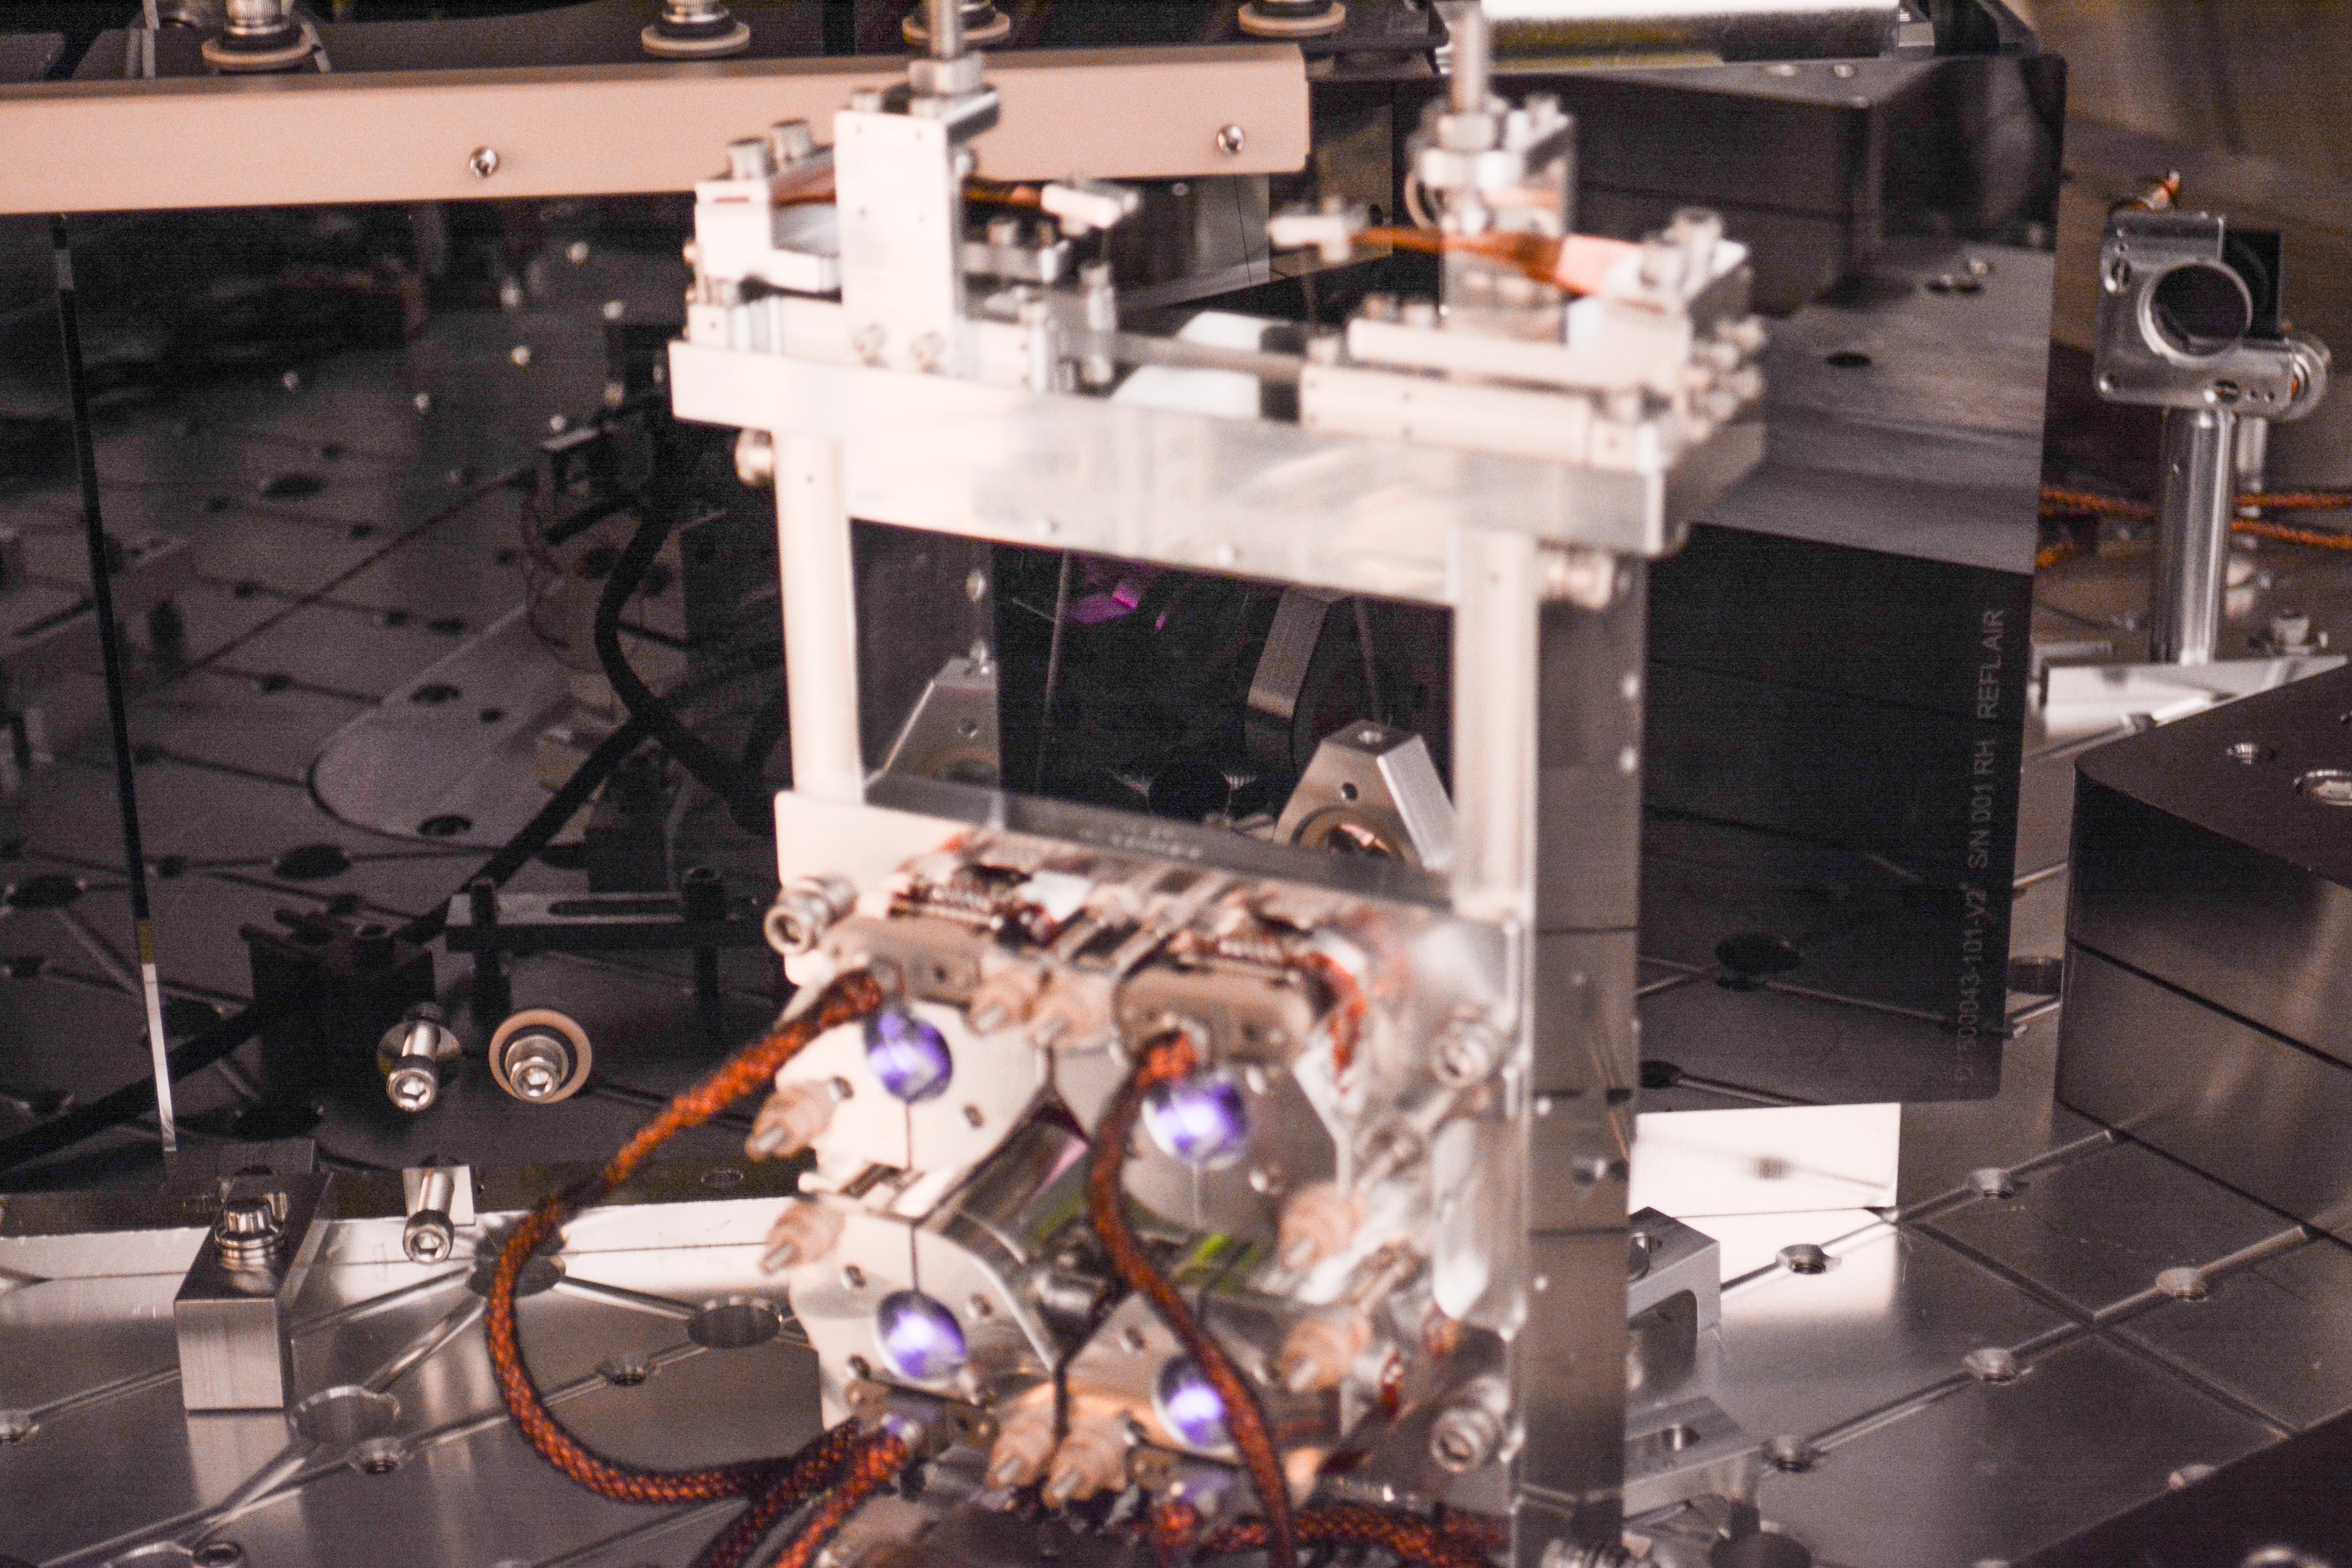
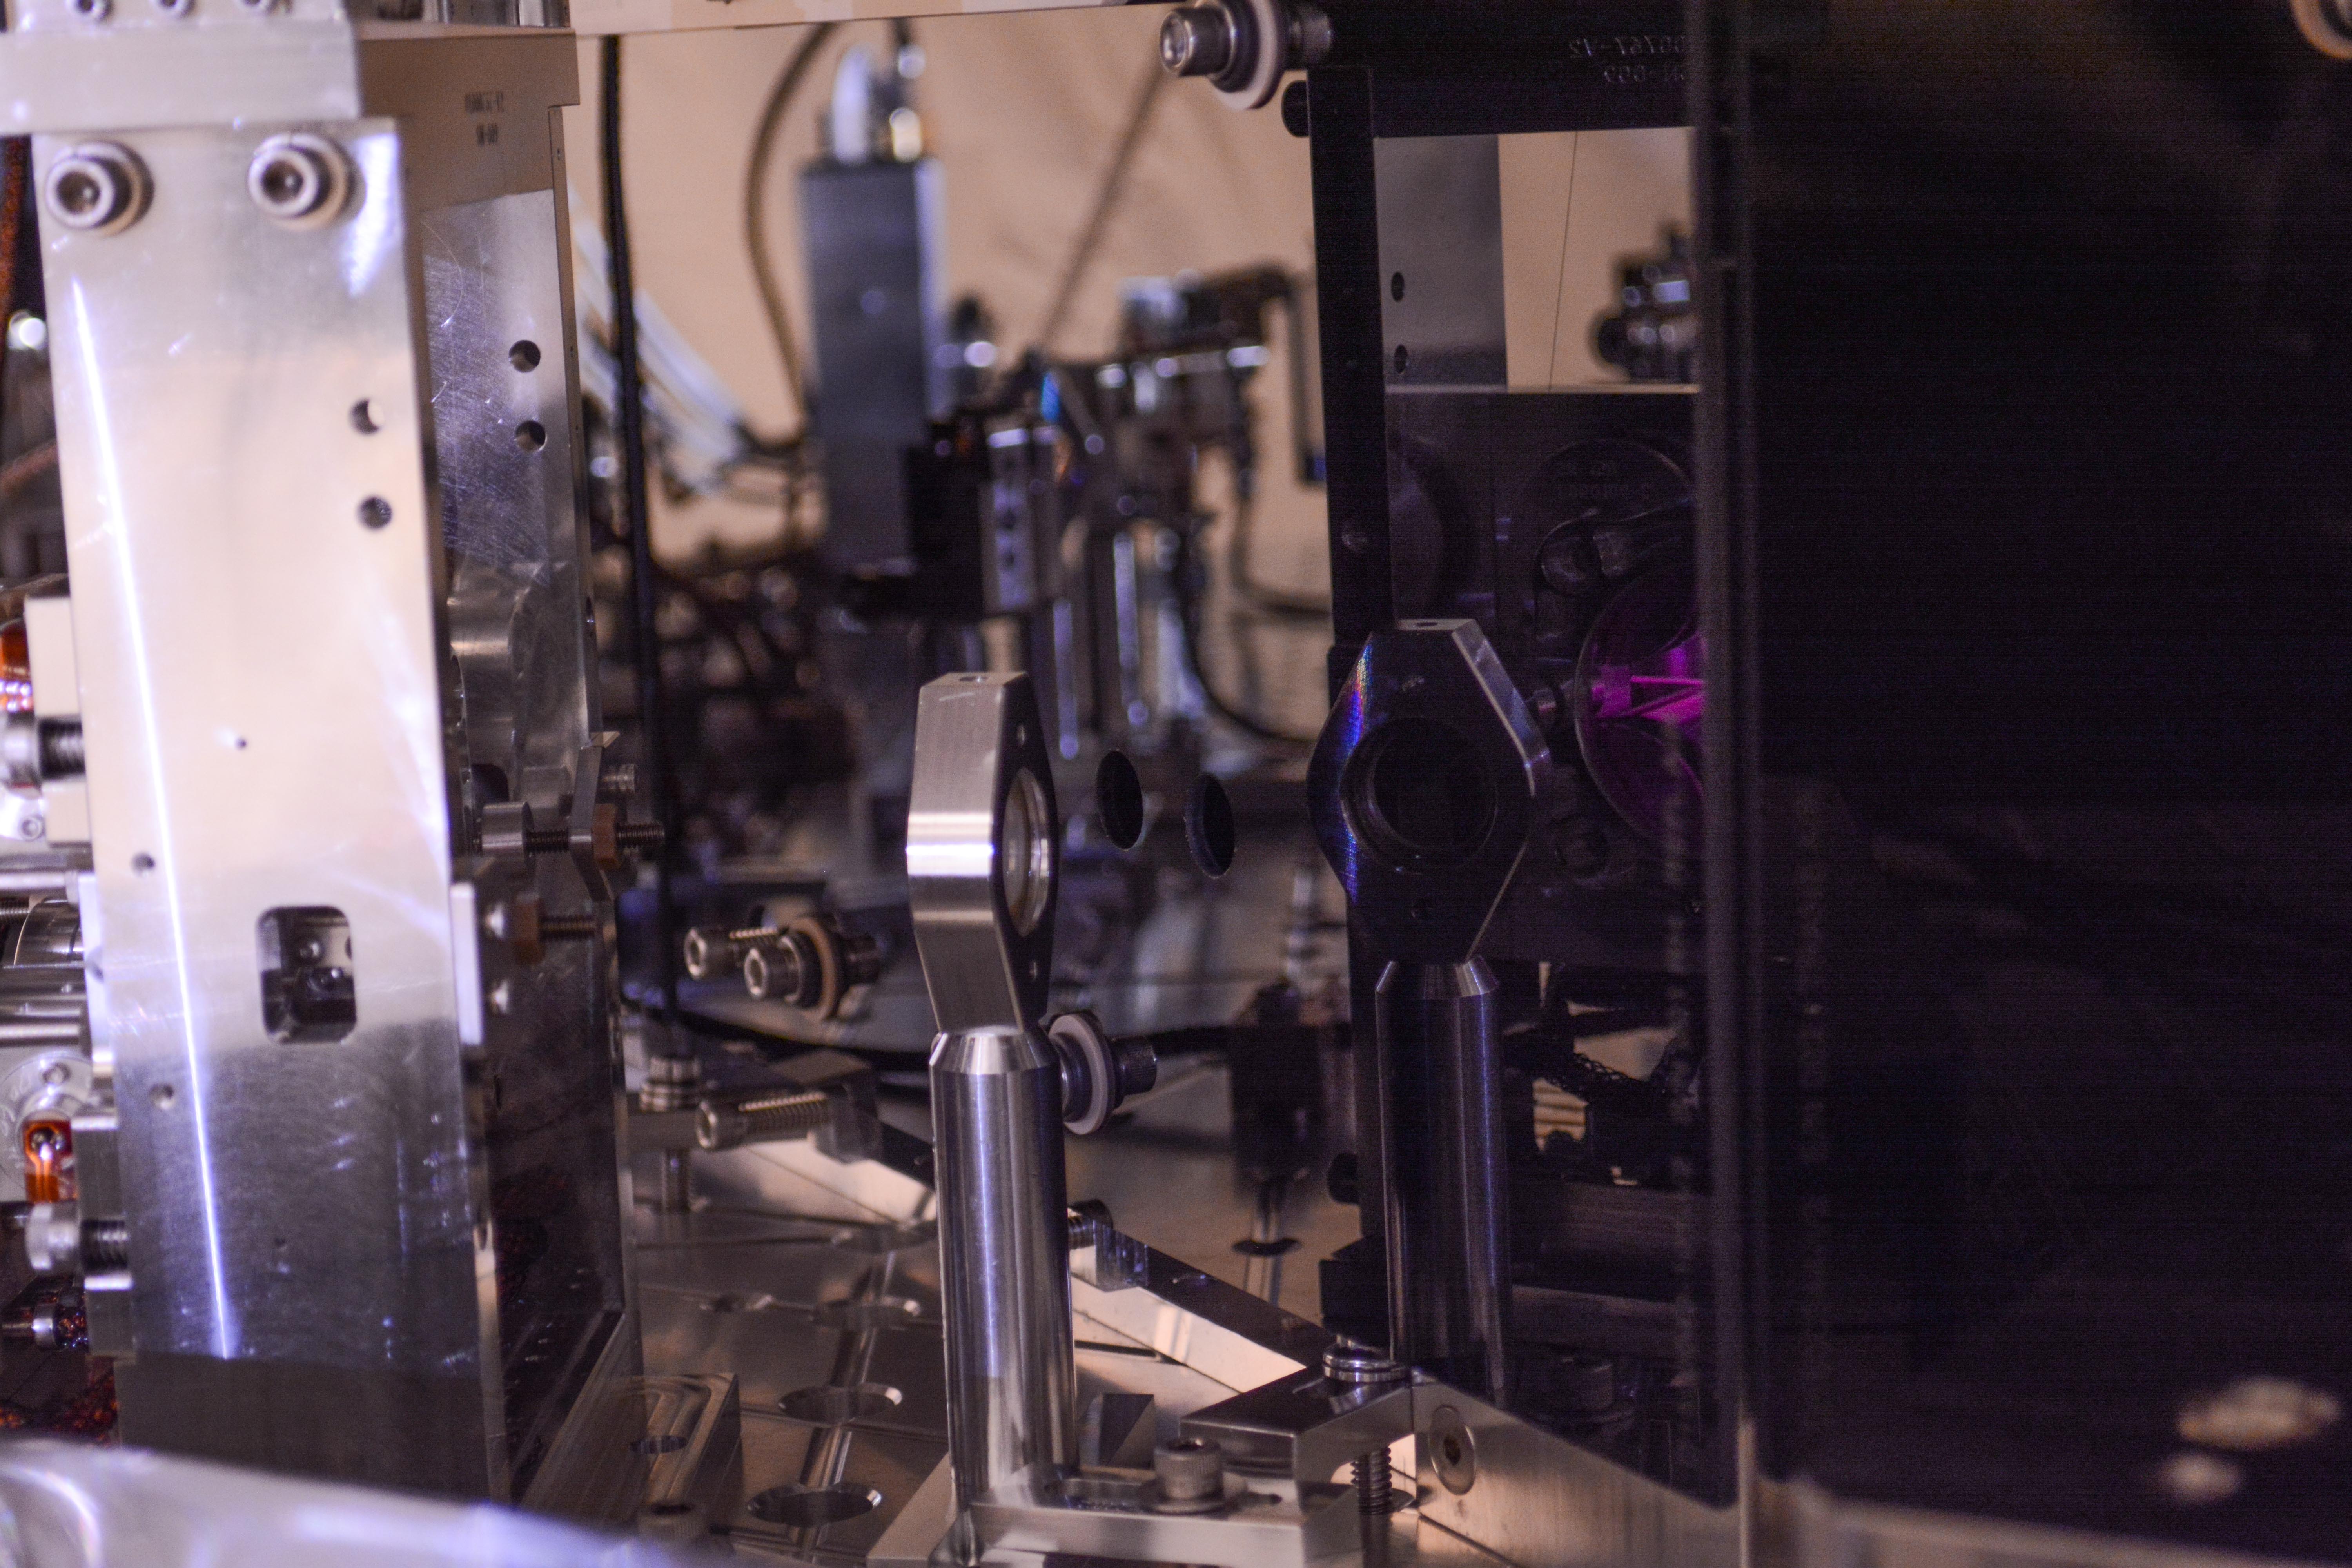
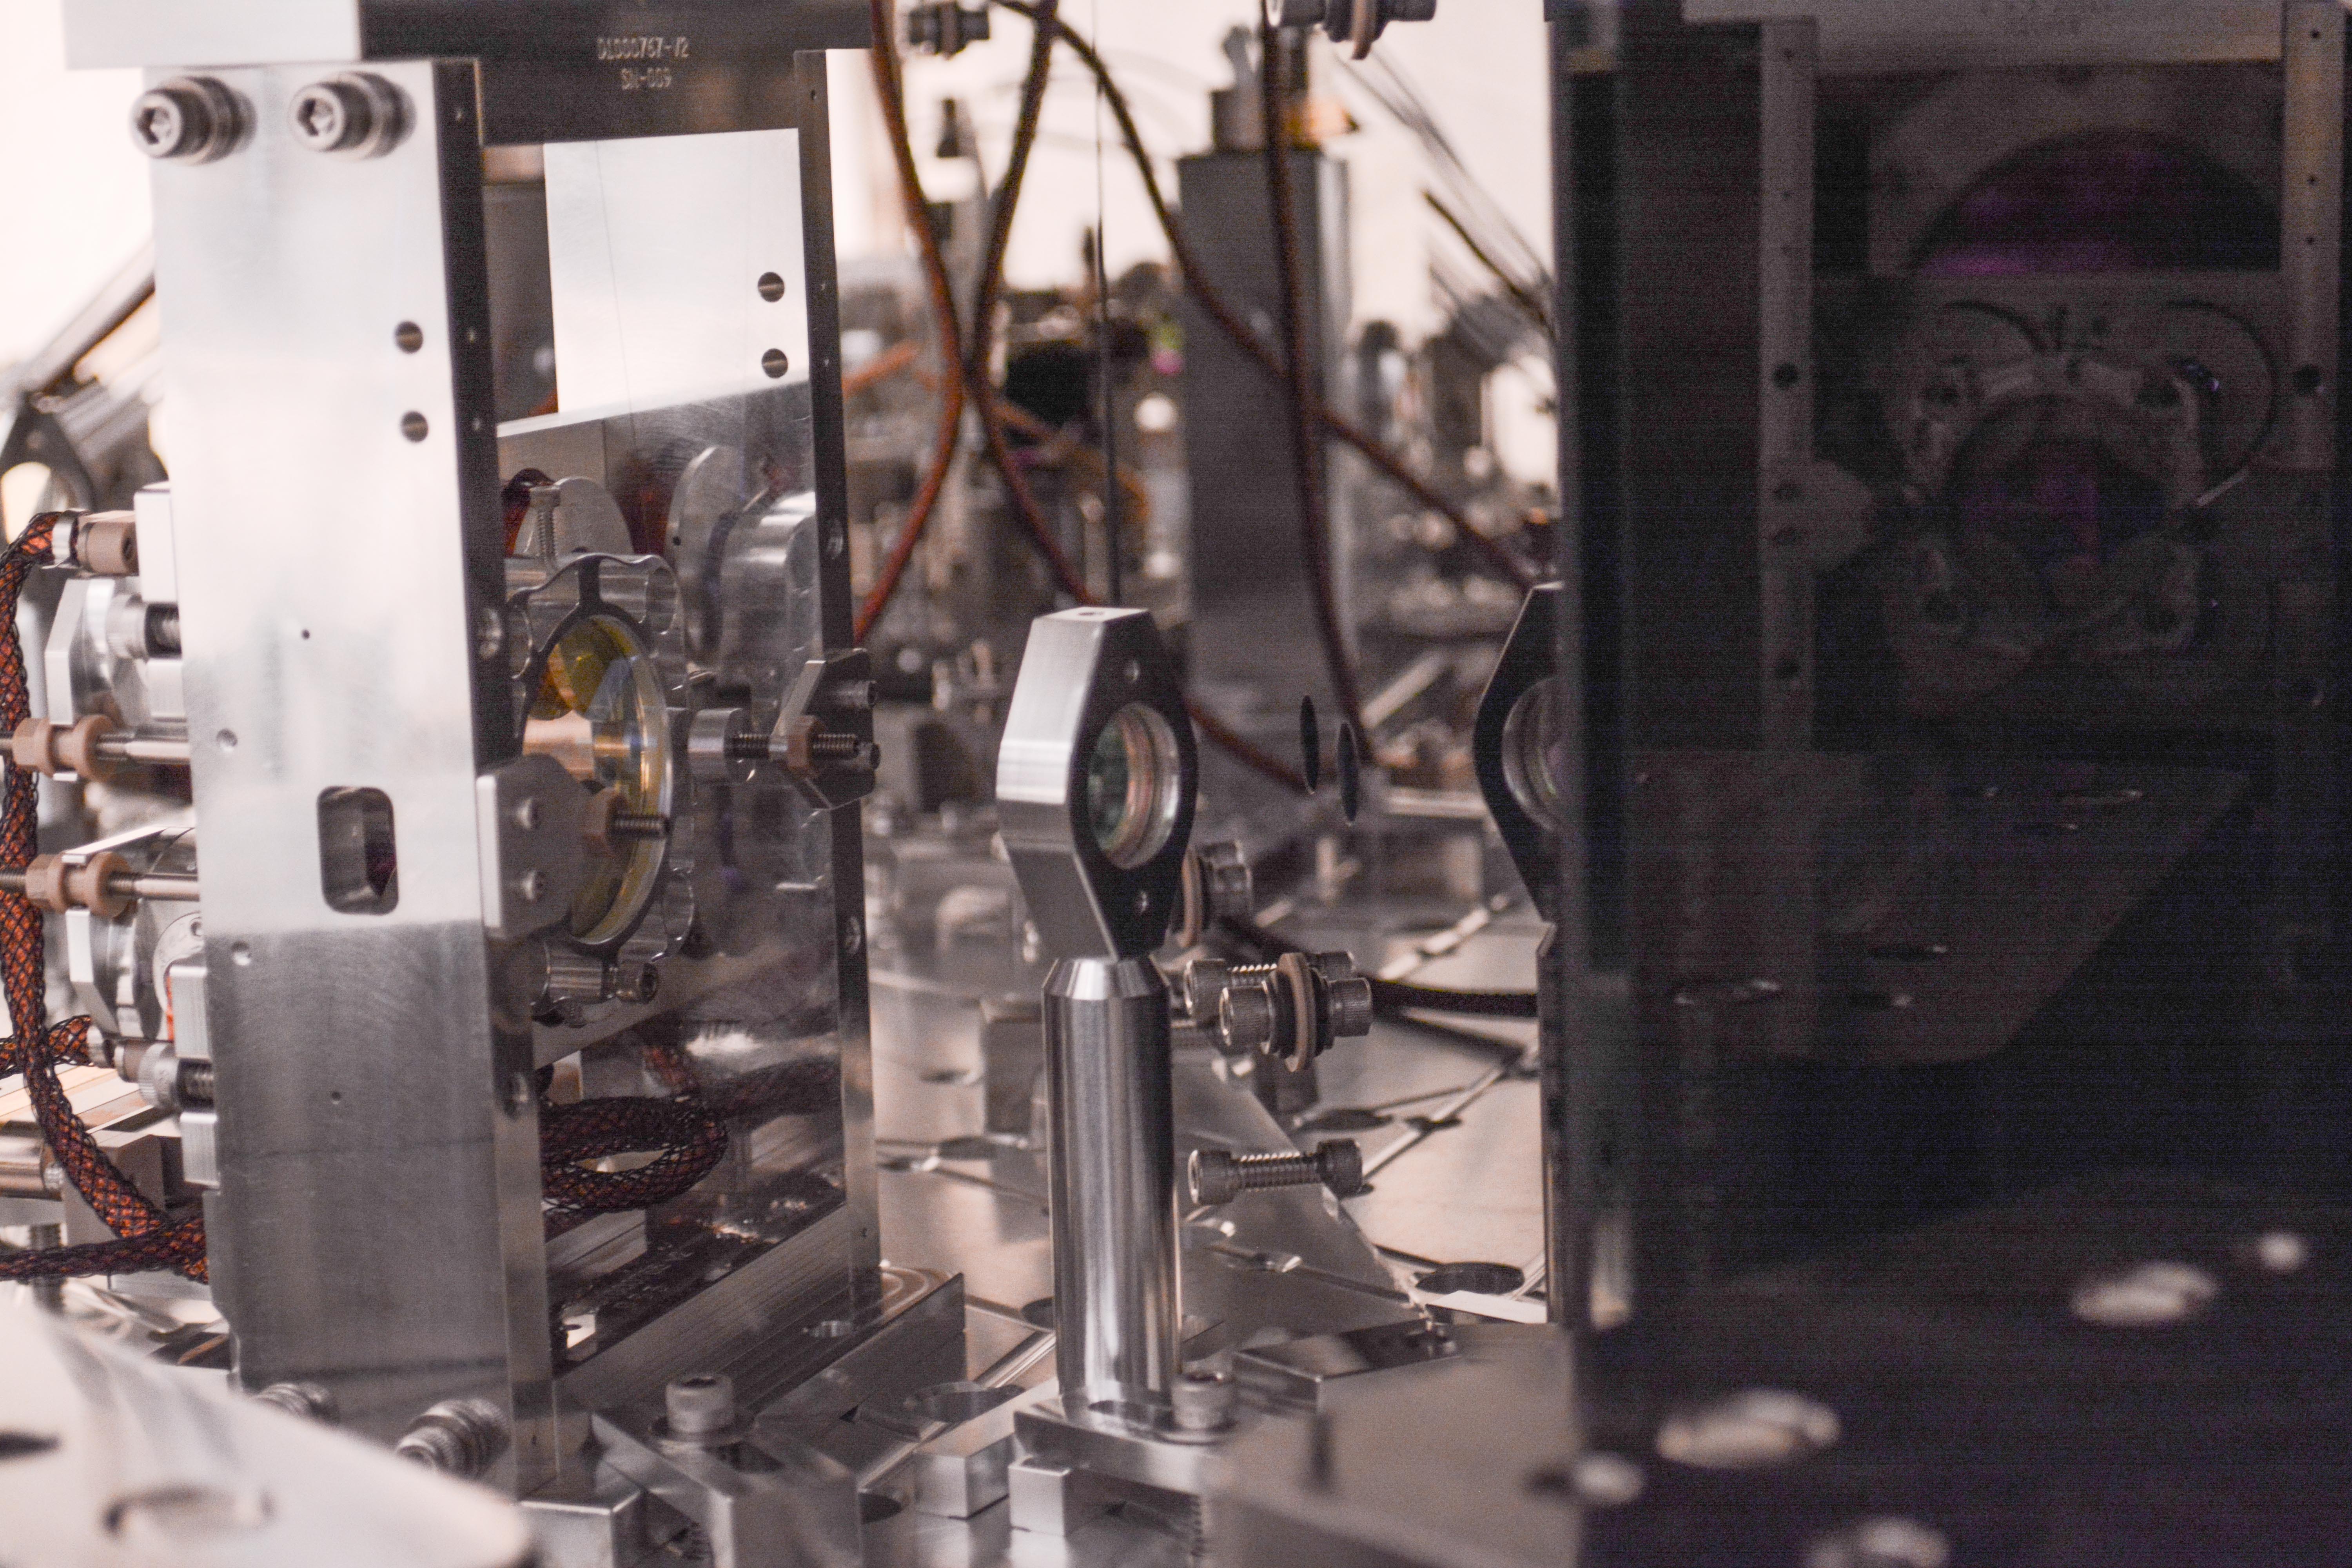
Once we were happy with all of our alignments we brought the main IFO beam back and Nutsinee took photos of the beam in several different places, including the septum window, the position on OM1, the position relative to the fast shutter's wire, the position on OM2, the position going into and returning from the OMC shroud, and some photos to ensure that we don't see any obvious scattered light at the shroud apertures.
Having completed this, and deciding that it was still quite early in the day, we began work on relieving the ZM1 actuator. Sheila noted that the pico that is on/near the OFI is closer in Gouy phase to ZM2 than ZM1, so would not be a satisfactory way of relieving ZM1. Sheila and Keita went in and adjusted the last steering mirror on the VOPO platform that sends the beam to ZM1 about 1/4 of a turn in yaw, clockwise if you are standing at the endcap. After I damped the VOPO we re-ran the squeezer alignment loops, and found that instead of having outputs of nearly 29k the ZM1 outputs were at most about 7k. Excellent! We note that the ZM2 outputs are around 22k, but this is the same that they were during O3a, it hasn't drifted, and if we need to we can relieve ZM2 using the pico, so we are leaving things as-is.
With these 2 sets of checks and work, I believe that we are done with ISC/SQZ work in HAM6. Nutsinee will comment with her photos.
Nice work team!! We'll mobilize to do the chamber unlocking and closeout tomorrow!
Attached photos of beam at various places.
1) Beam coming out of septum window towards OM1 -- taken as close as possible to the beam height, vertical view
2) Beam coming out of septum window -- camera aligned to the beam as much as possible, horizontal view
3) Beam towards OM1 just before the fast shutter
4) Beam towards OM1 just after the fast shutter
5) Beam reflecting off OM1, in front of the fast shutter
6) Beam reflecting off OM1, behind the fast shutter
7) Beam next to the toaster again after a small alignment change. The beam location stayed pretty much the same.
8) Beam on OM1 (vertical view)
9) Beam on OM1 (horizontal view)
10) Beam on OM2 (vertical view)
11) Beam on OM2 (horizontal view)
12) Beam on OM2 (IR camera)
13) Beam going into OMC, reflects off OM3
14) Beam going into OMC, vertical view
15, 16, 17) OMC input output port area (IR camera looking for scattering)
18) Beam relative to the wire when fast shutter closed
19) OMC refl on beam dump
20) Beam reflects off fast shutter to beam dump


Before-swap pictures were posted in alog 52310.
Oct 11, 2019 Close-out sweep of HAM6 photos are here.
Since Resource Space appears to no longer be functionable/useable, here are some photos of the septum flanges/viewports.