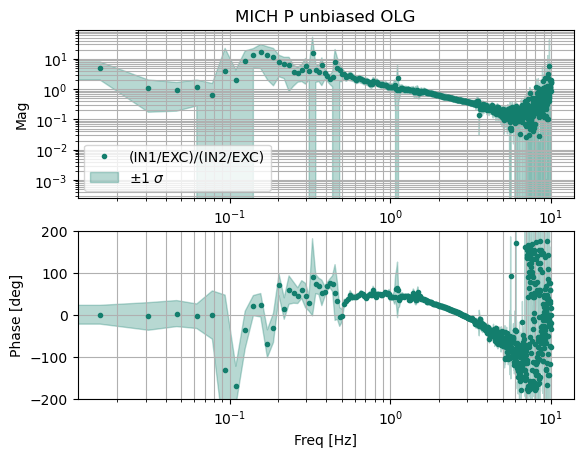
Today I took "unbiased" OLGs of MICH P and MICH Y (see 67187 for a discussion of unbiased measurements and methods). These loops have not been measured since Gabriele and I updated the loop design in May (69370).
The templates for the these measurements are saved in [userapps]/asc/h1/templates/MICH as 'MICH_{P,Y}_olg_broadband_shaped.xml'. I obtained 40 averages at a 0.015 Hz bandwidth, so it took about 20 minutes to run each measurement.
I have plotted the open loop gain with error shading in the attached plots. You can find the same measurement templates, exported data, and processing code in '/ligo/home/elenna.capote/DRMI_ASC/MICH'.
MICH P appears to have a UGF of 1 Hz with a phase margin of 46 deg. MICH Y appears to have a UGF of 0.55 Hz with a phase margin of 35 deg.
I believe Gabriele and I sought to reduce the UGF of MICH Y more than MICH P because at the time, MICH Y contributed more to the ASC subbudget from 10-30 Hz. However, we are now seeing significant upconversion of low frequency motion in DARM that limits the sensitivity from 20-40 Hz. I will revisit this loop design and prioritize more low frequency suppression to see if we can reduce the DARM RMS further.
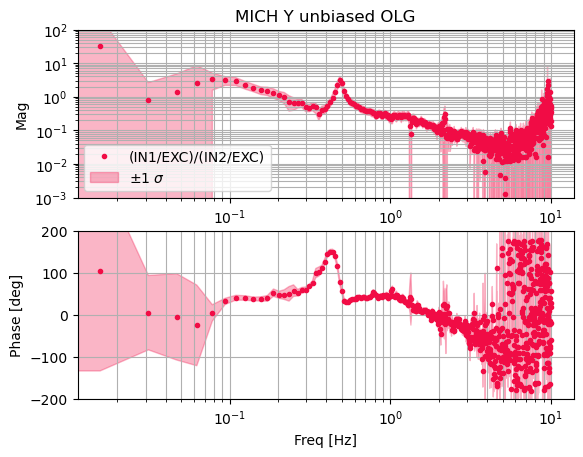
Based on this measurement of MICH Y, it appeared the loop is stable for a 13 dB increase in gain, which would put the UGF closer to 1 Hz like MICH P. I raised the gain by a factor of 4, and the loop is stable and there doesn't appear to be excess noise in DARM. I ran a quick injection to check the level of MICH Y relative to DARM.
MICH Y gain is now -2.4 (was -0.6). This is updated in the guardian (lownoise ASC) and SDFed.
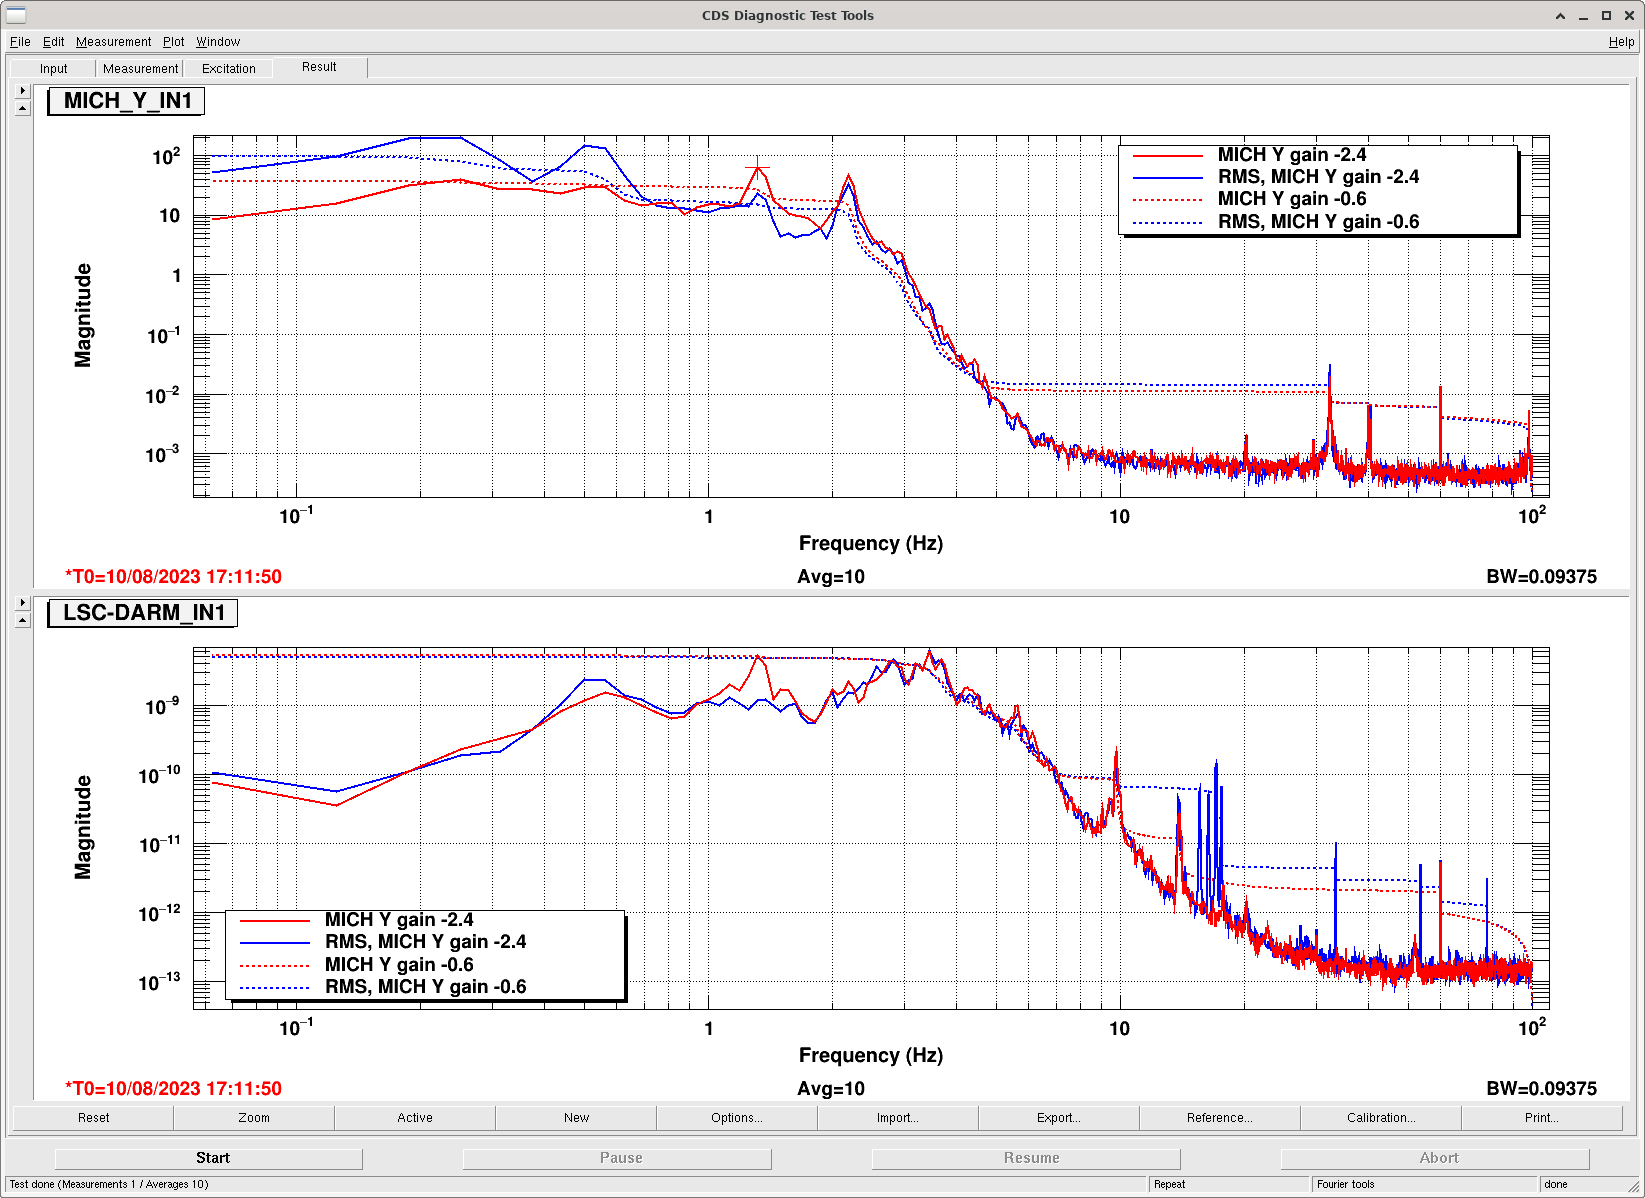
A few minutes after posting, Sheila and I noticed CSOFT Y motion increased significantly and the noise in DARM between 20-30 Hz worsened. This extra noise and motion reduced as I reduced the MICH Y gain back to -0.6. Looking at the spectra and RMS of both MICH Y IN1 and LSC DARM IN1, it appears that although the overall RMS of both decreases with the higher gain, the higher gain also increases a 1.3 Hz peak in both MICH Y and DARM. I am undoing these changes and keeping the MICH Y gain nominal (-0.6).