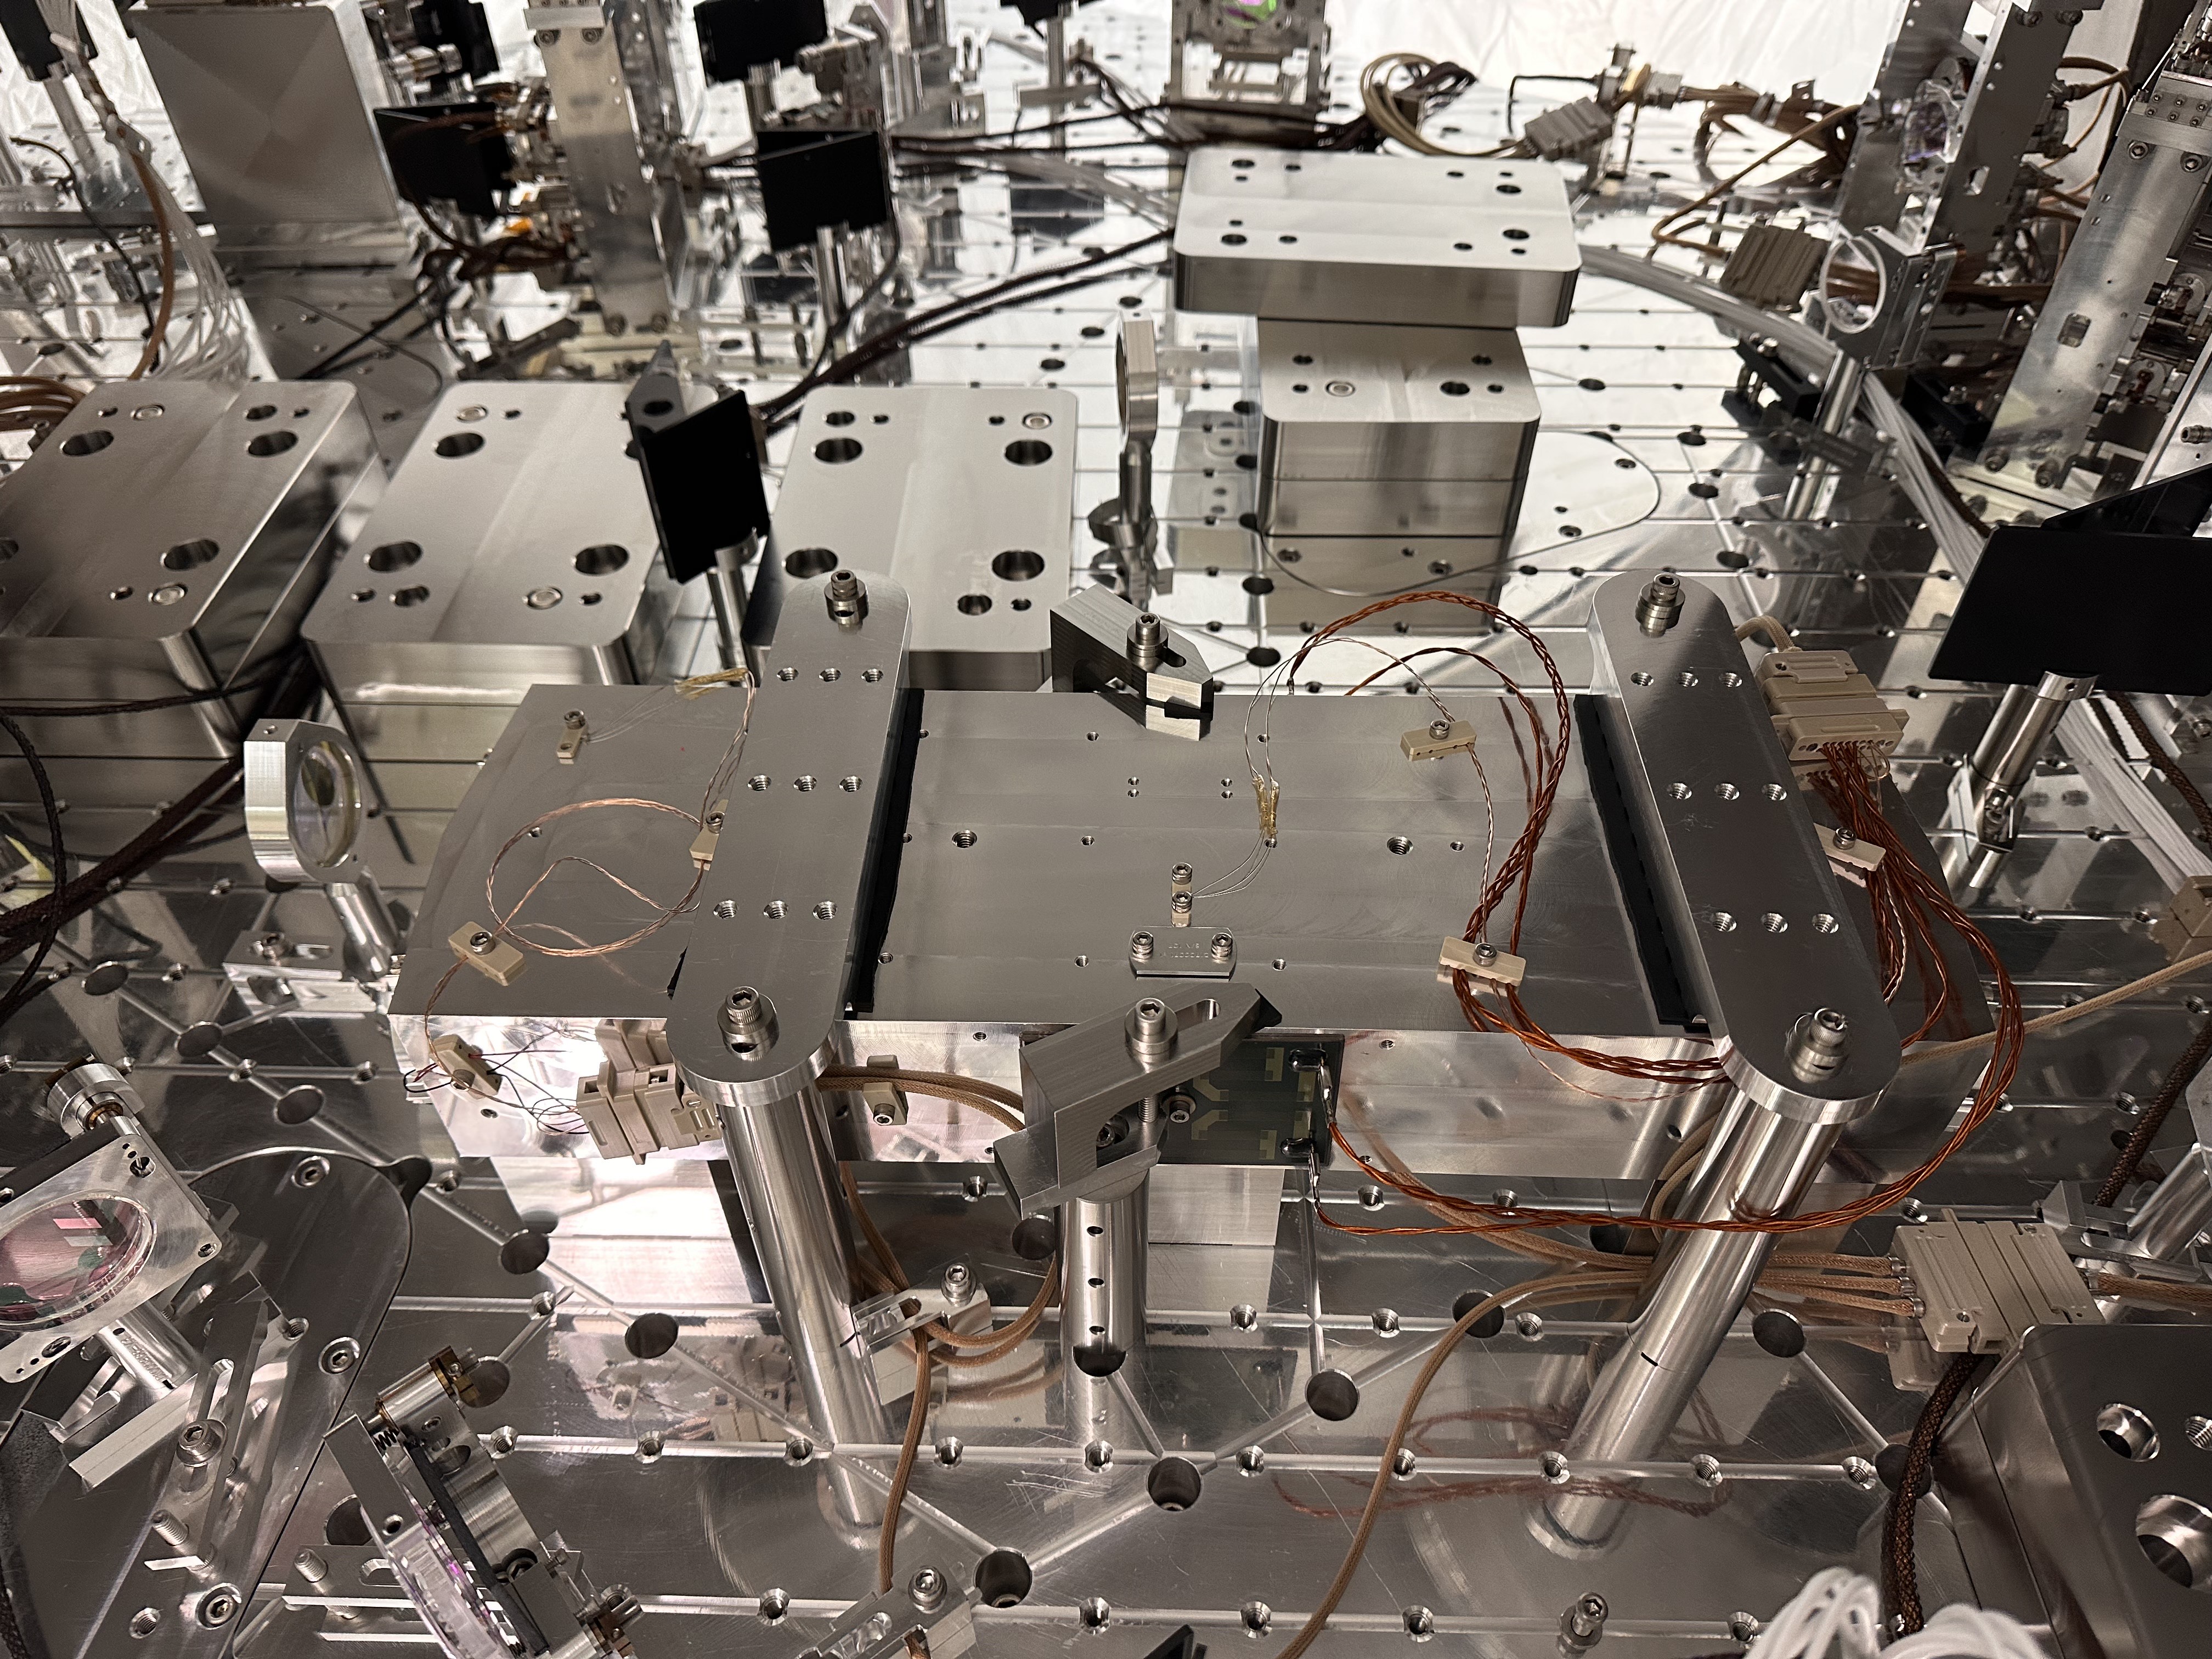
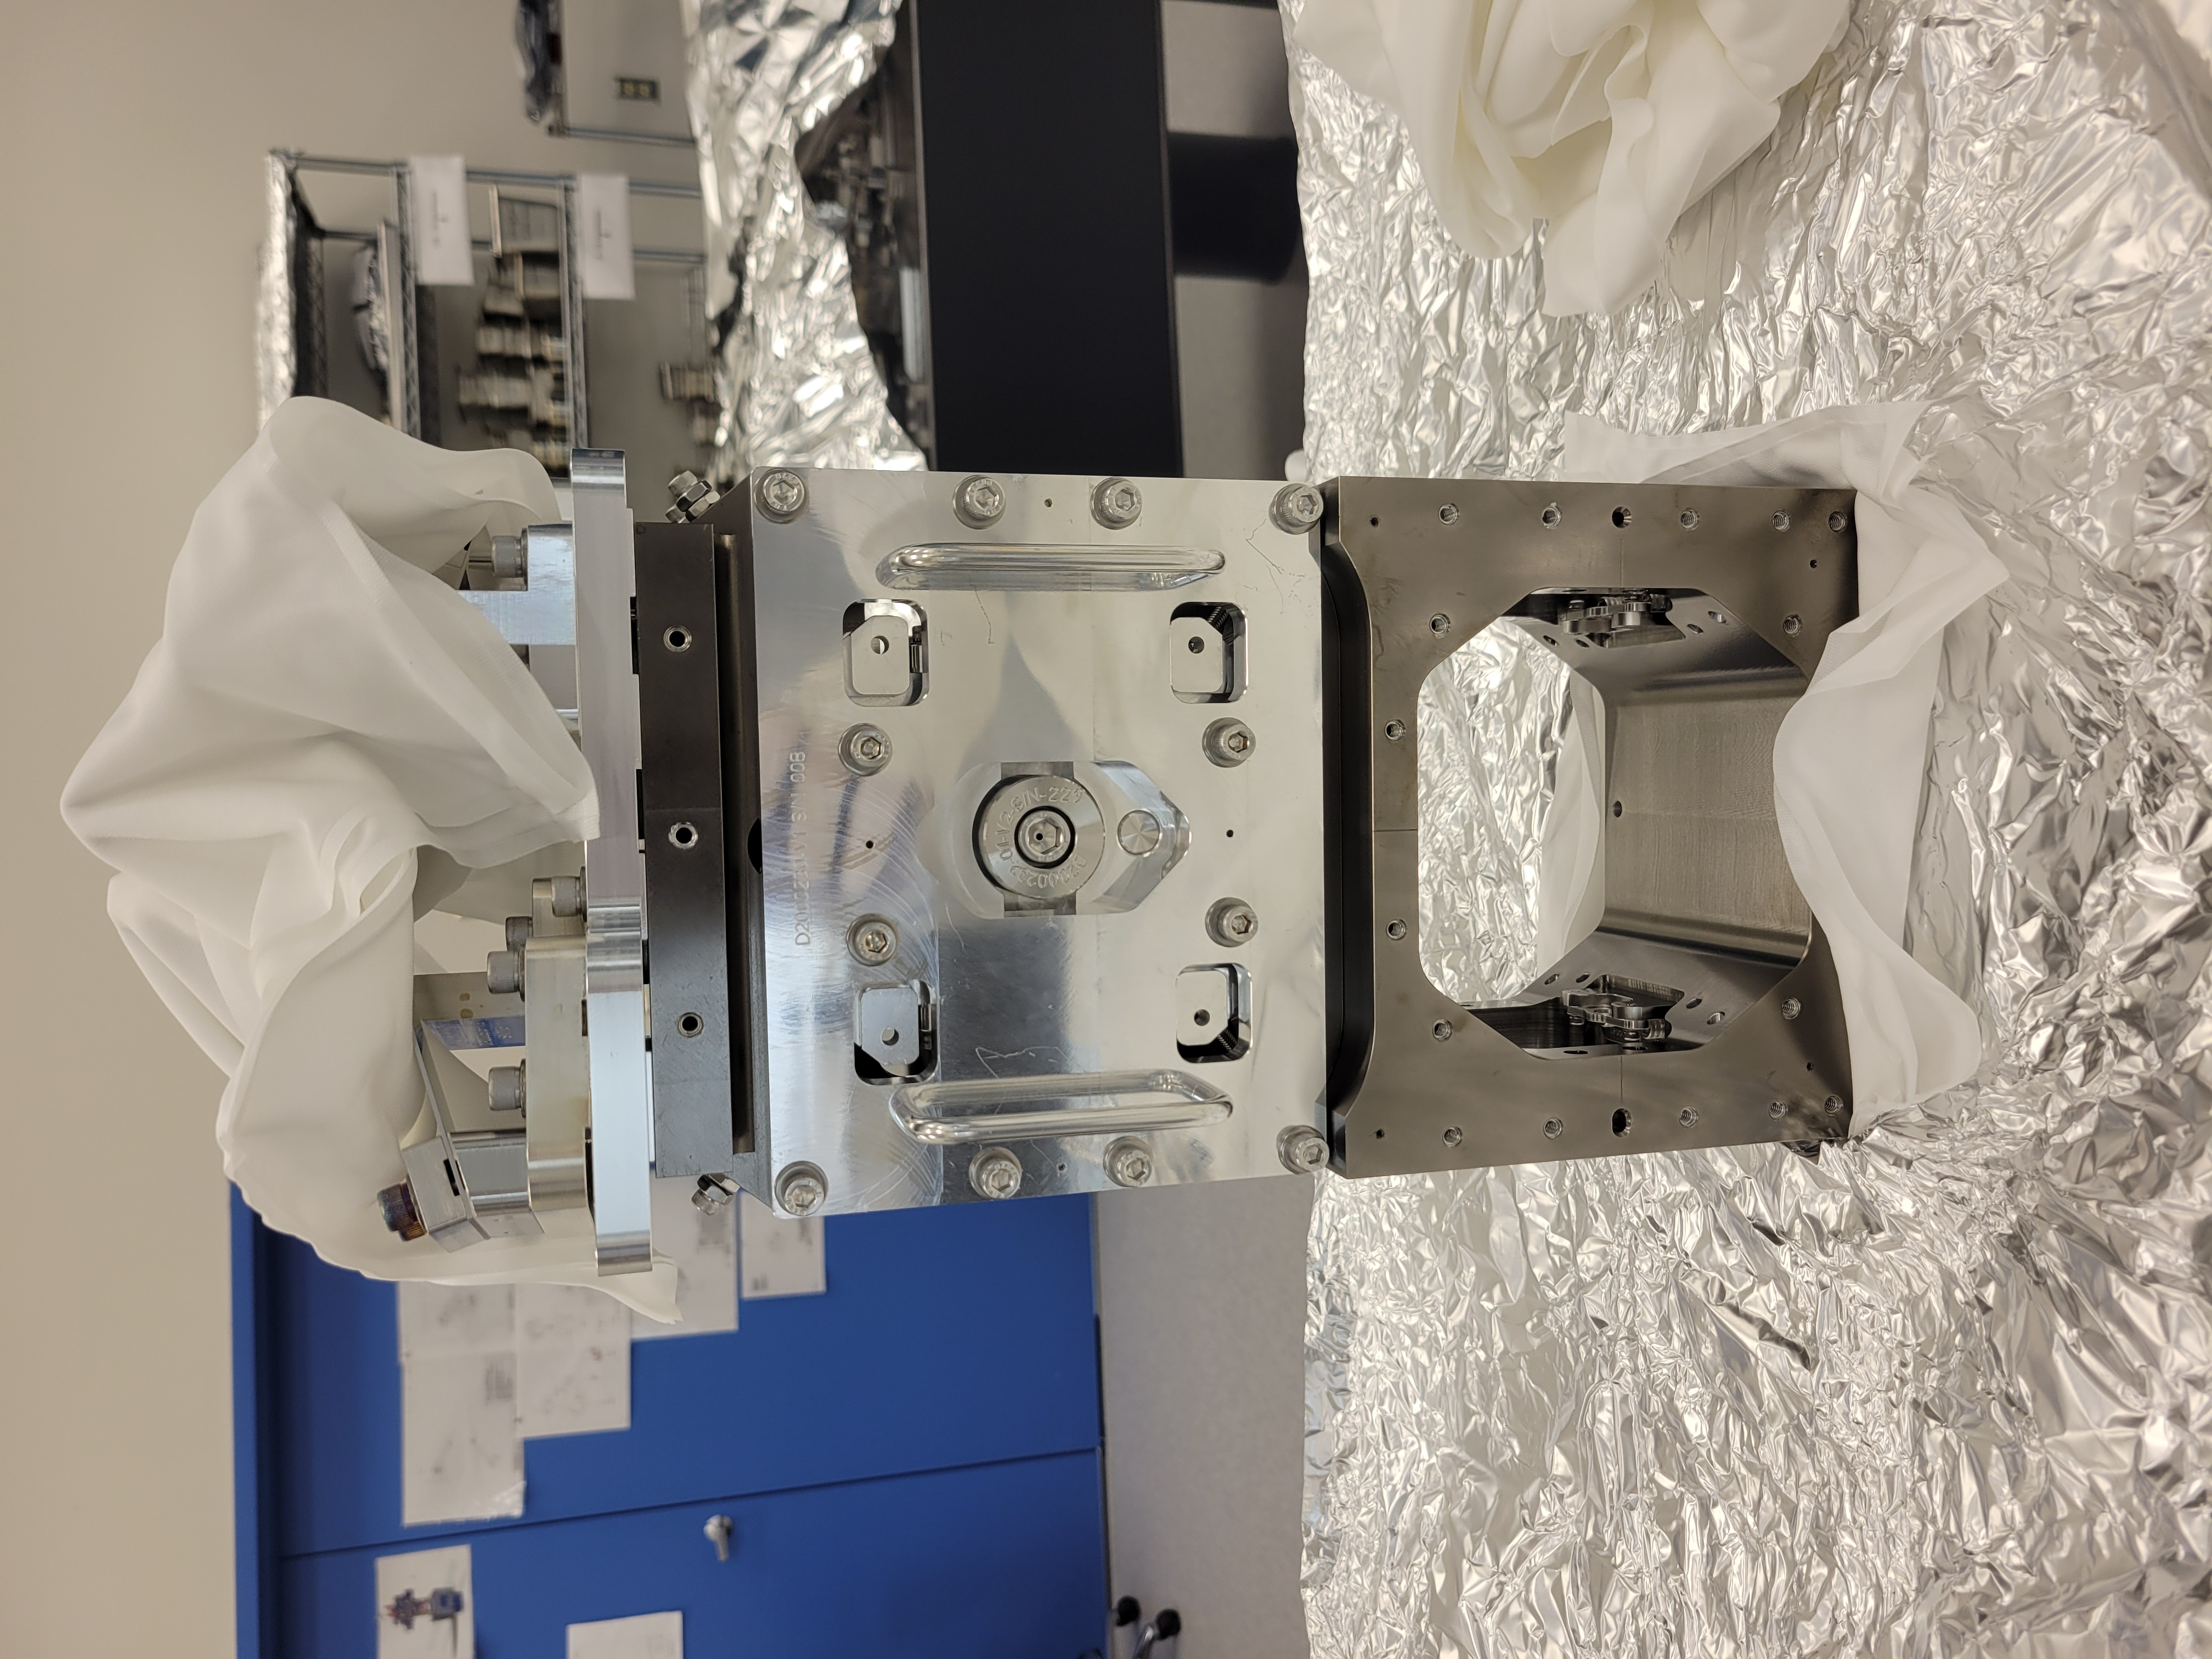
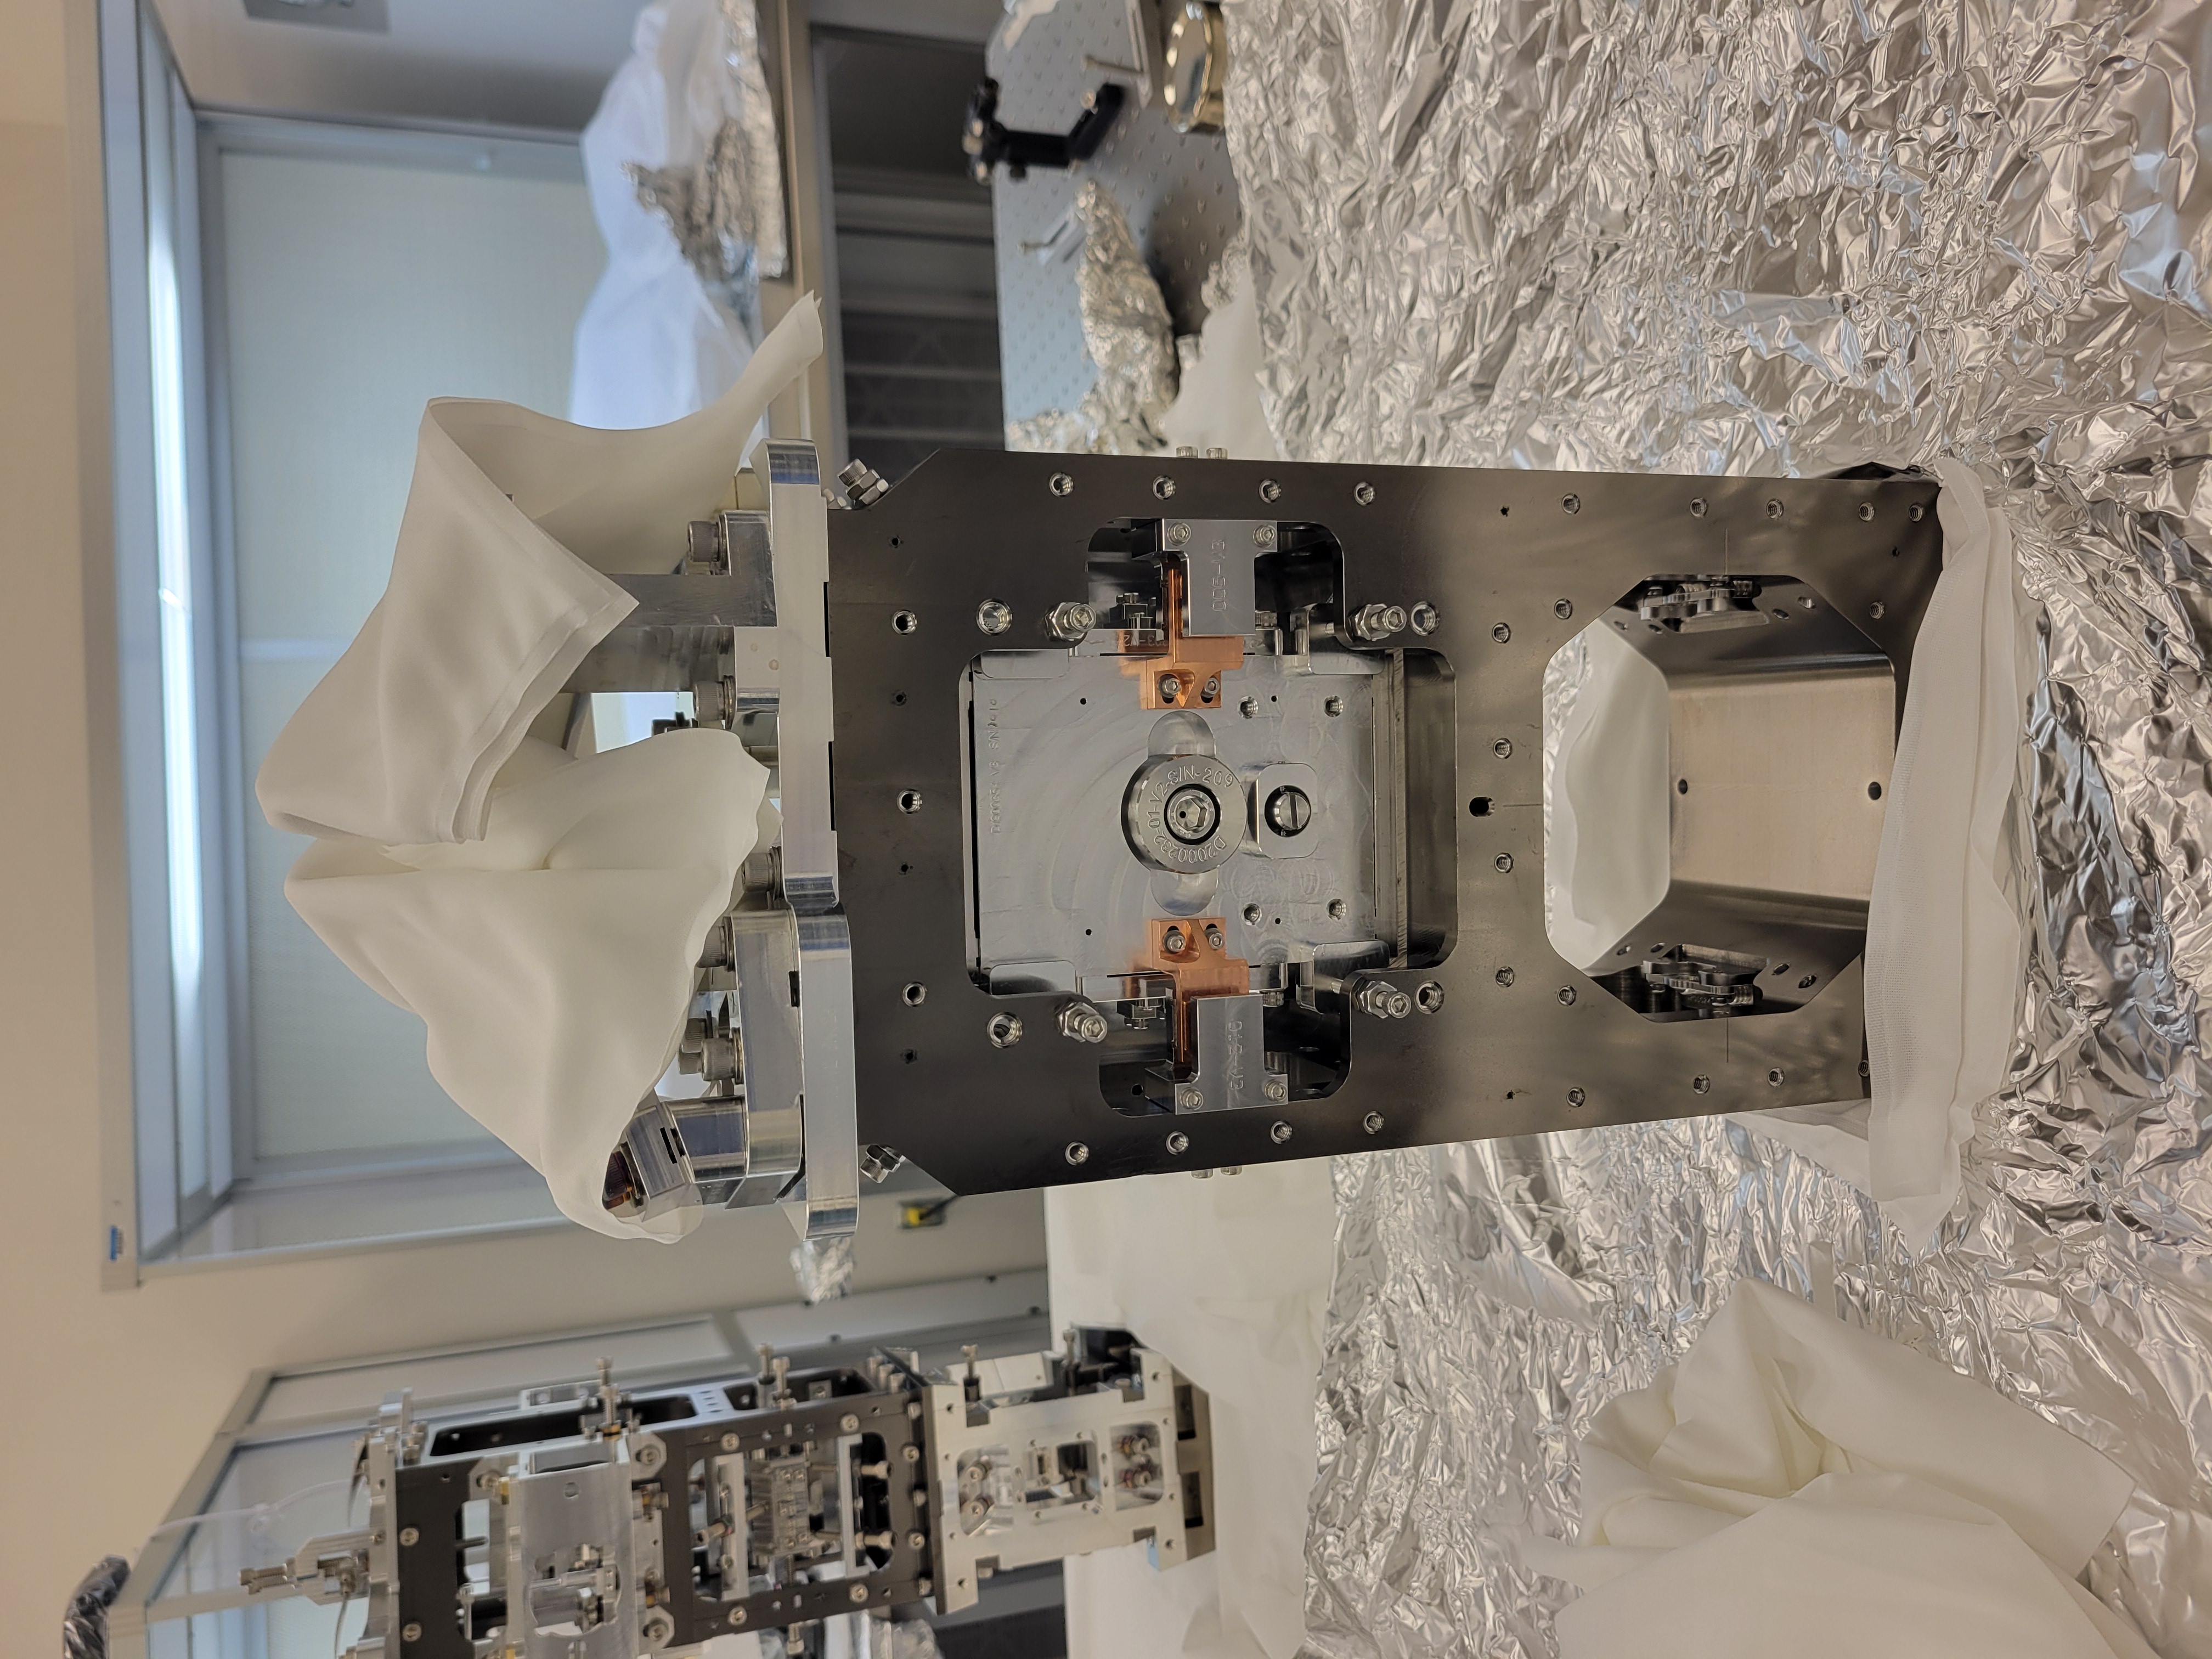
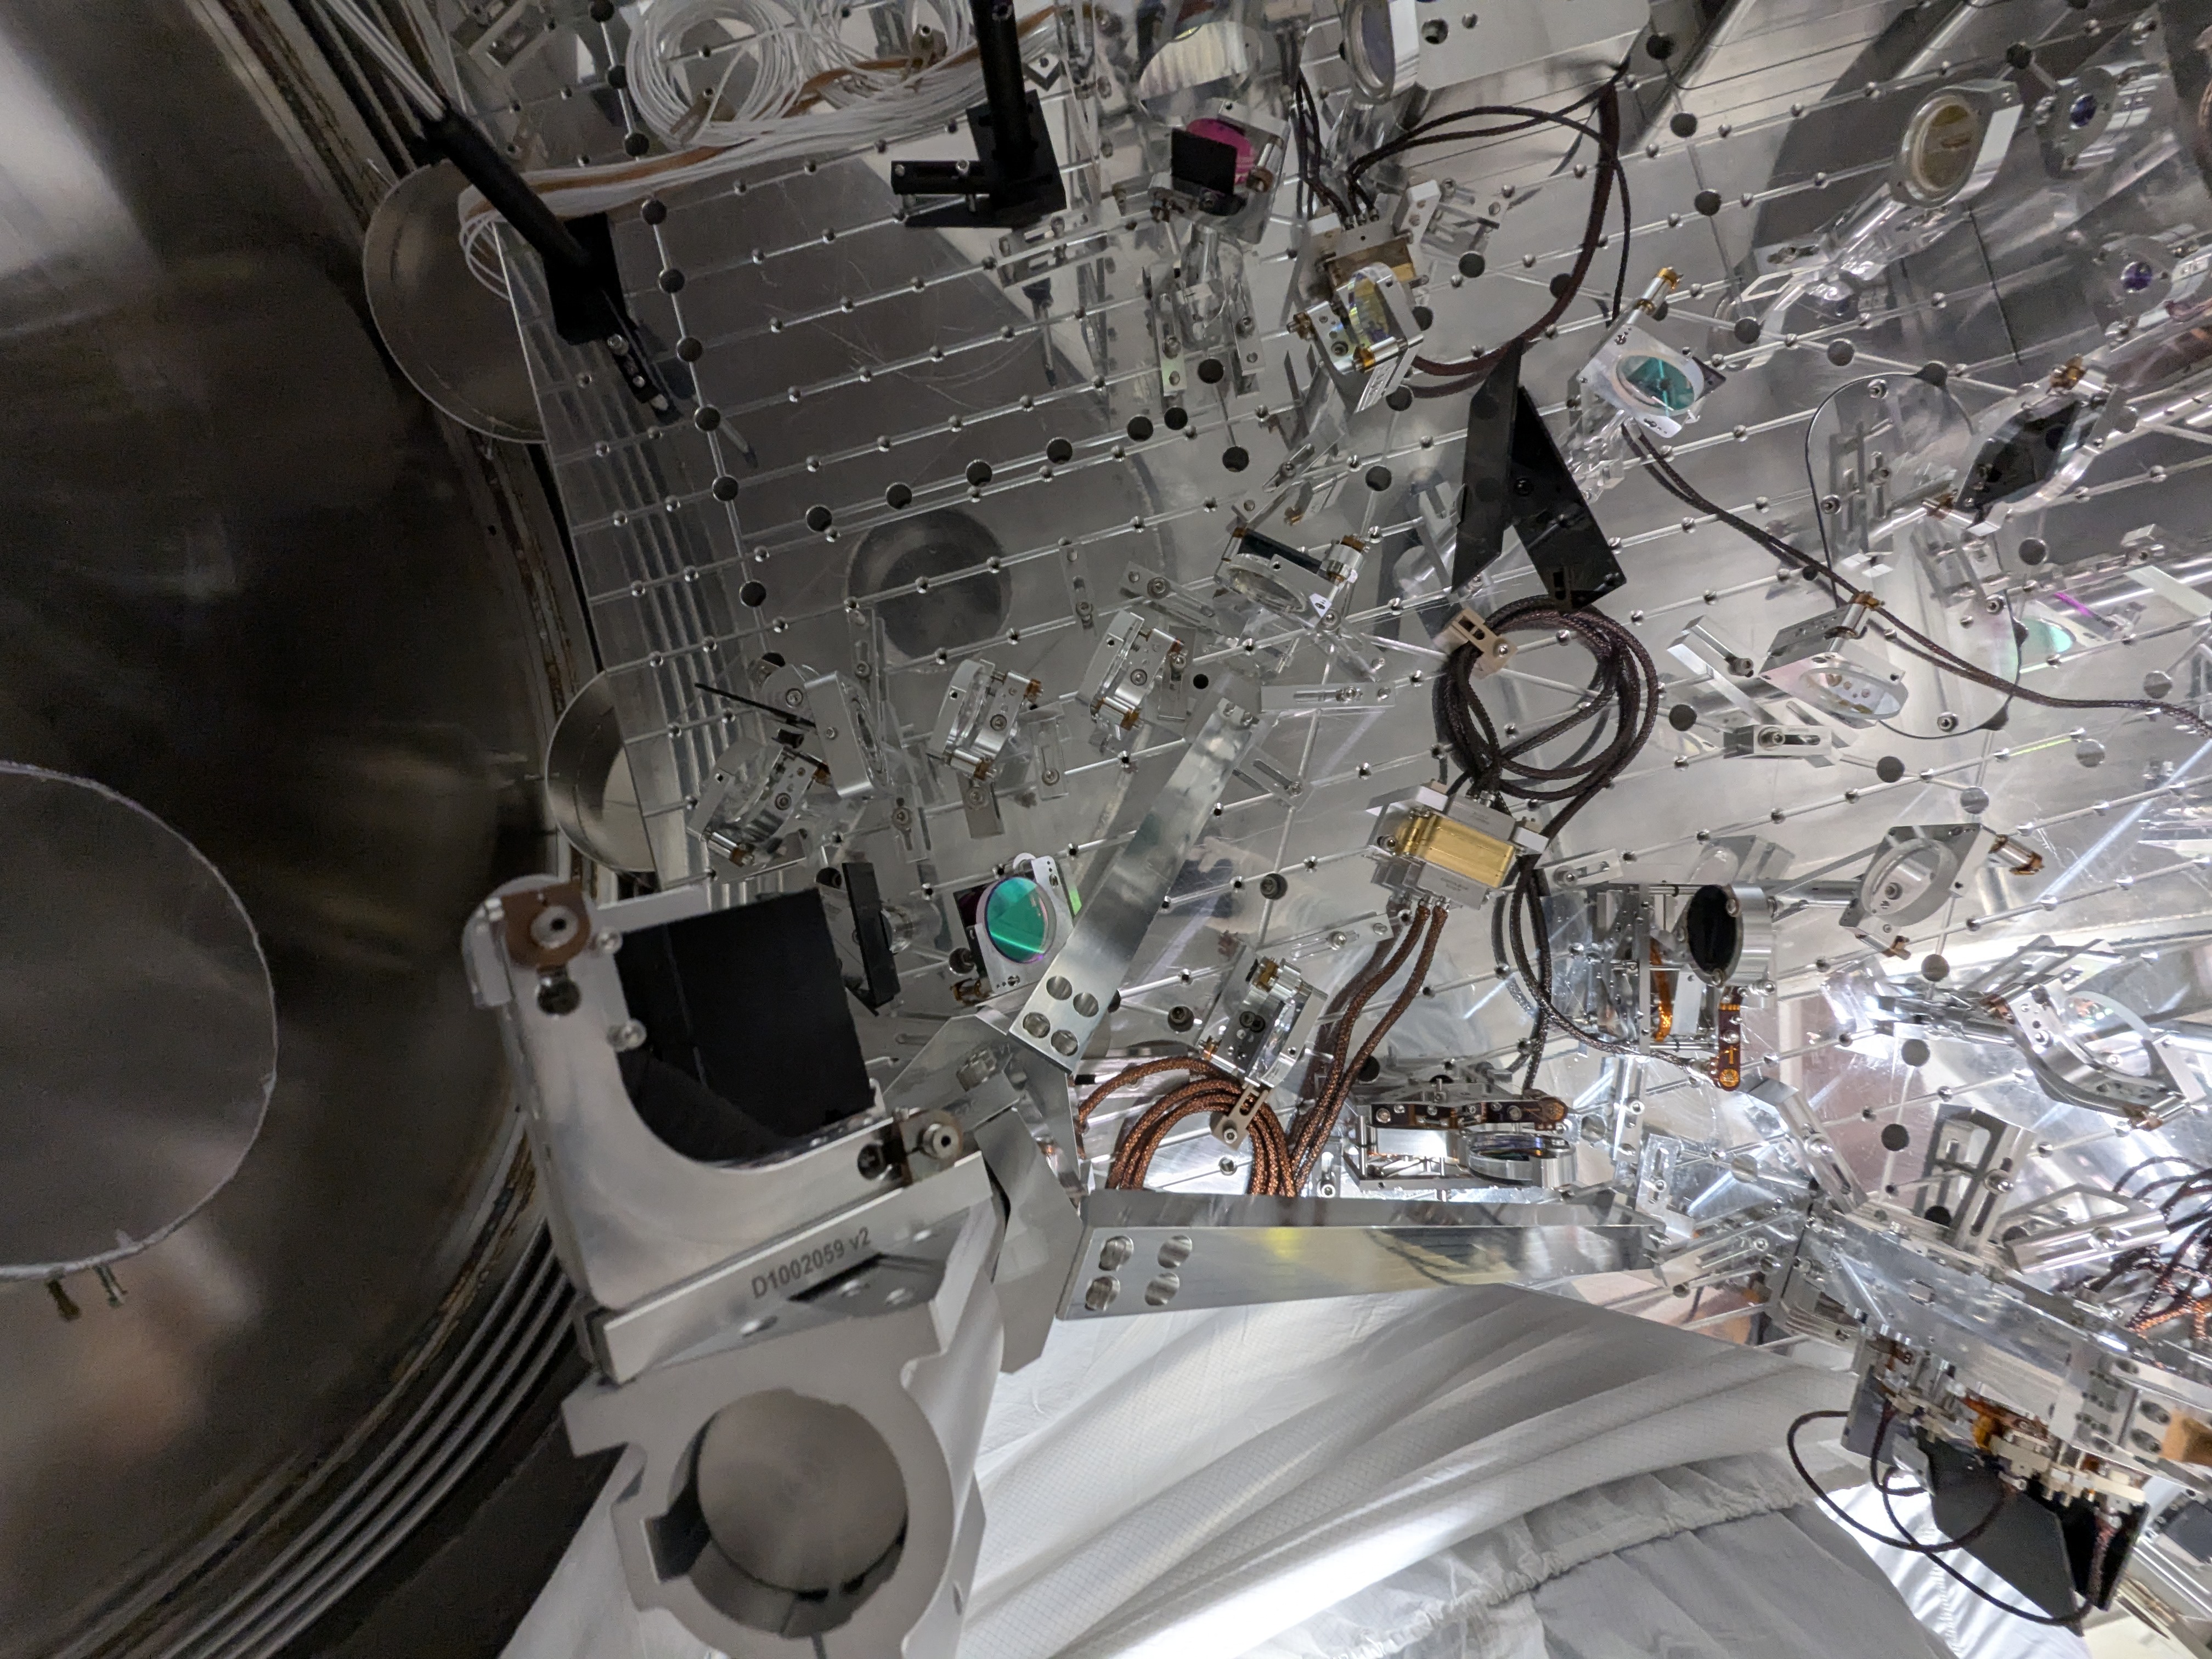
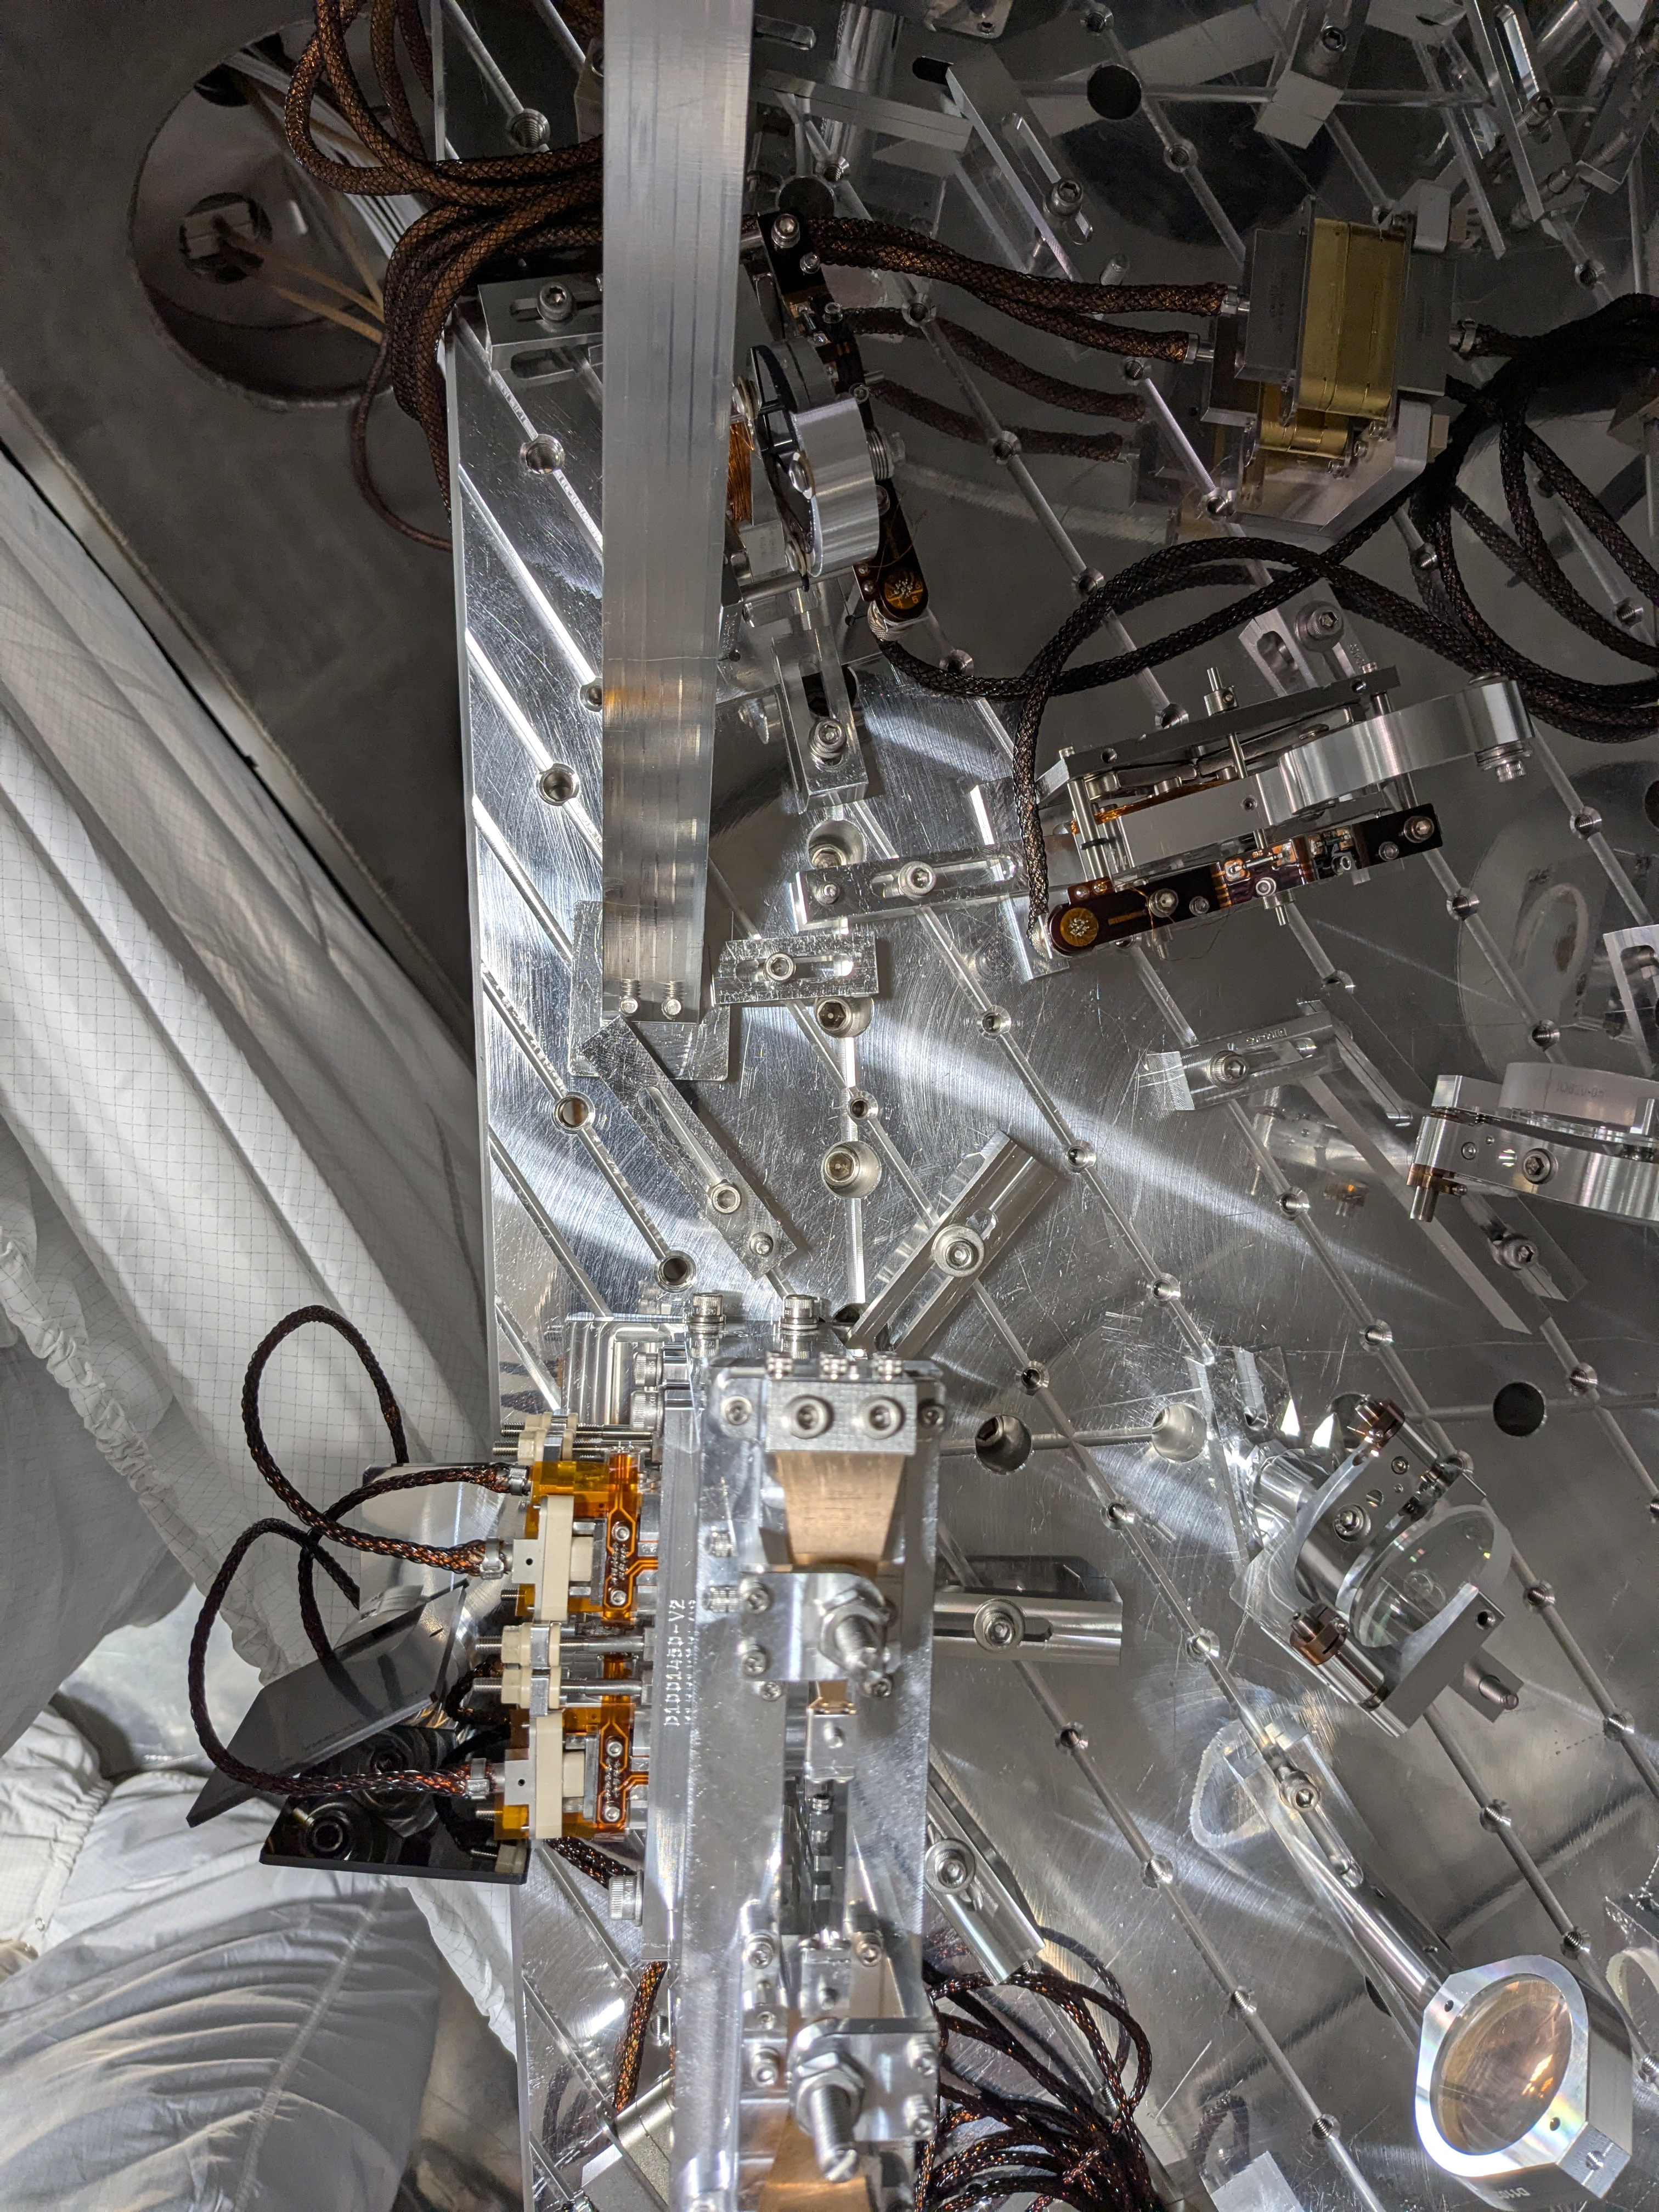
We have intalled the POP periscope stiffener.
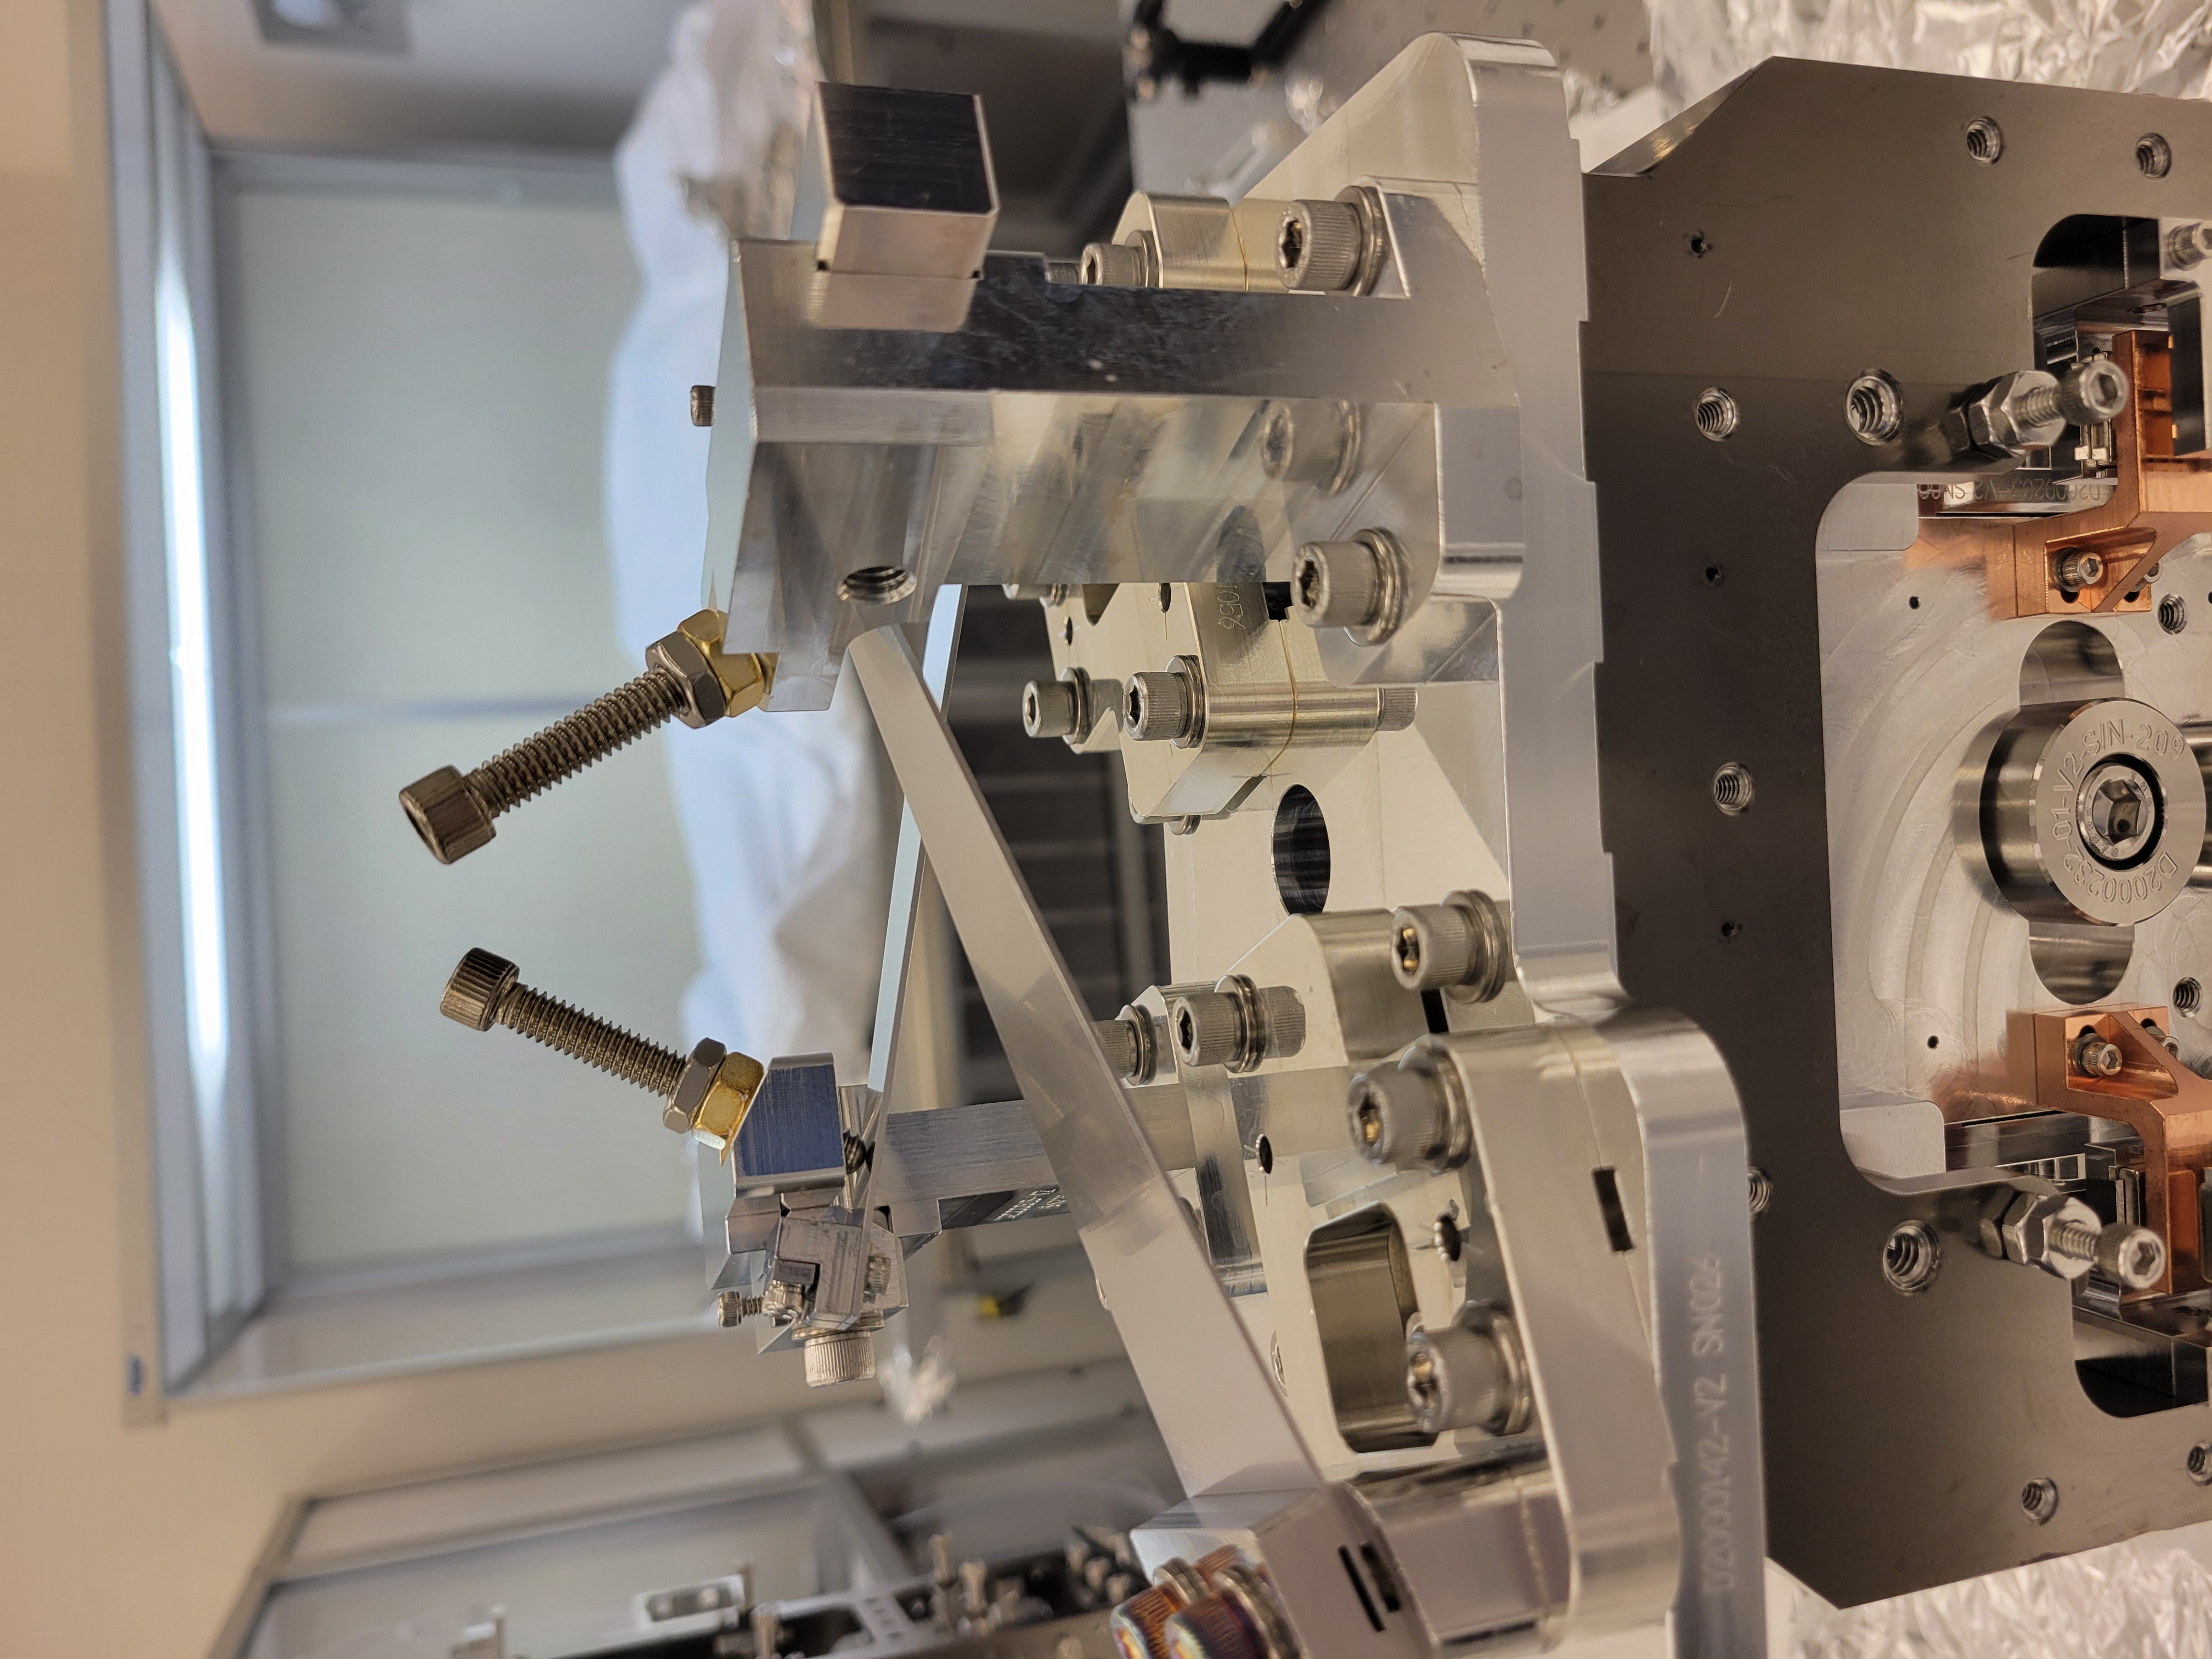
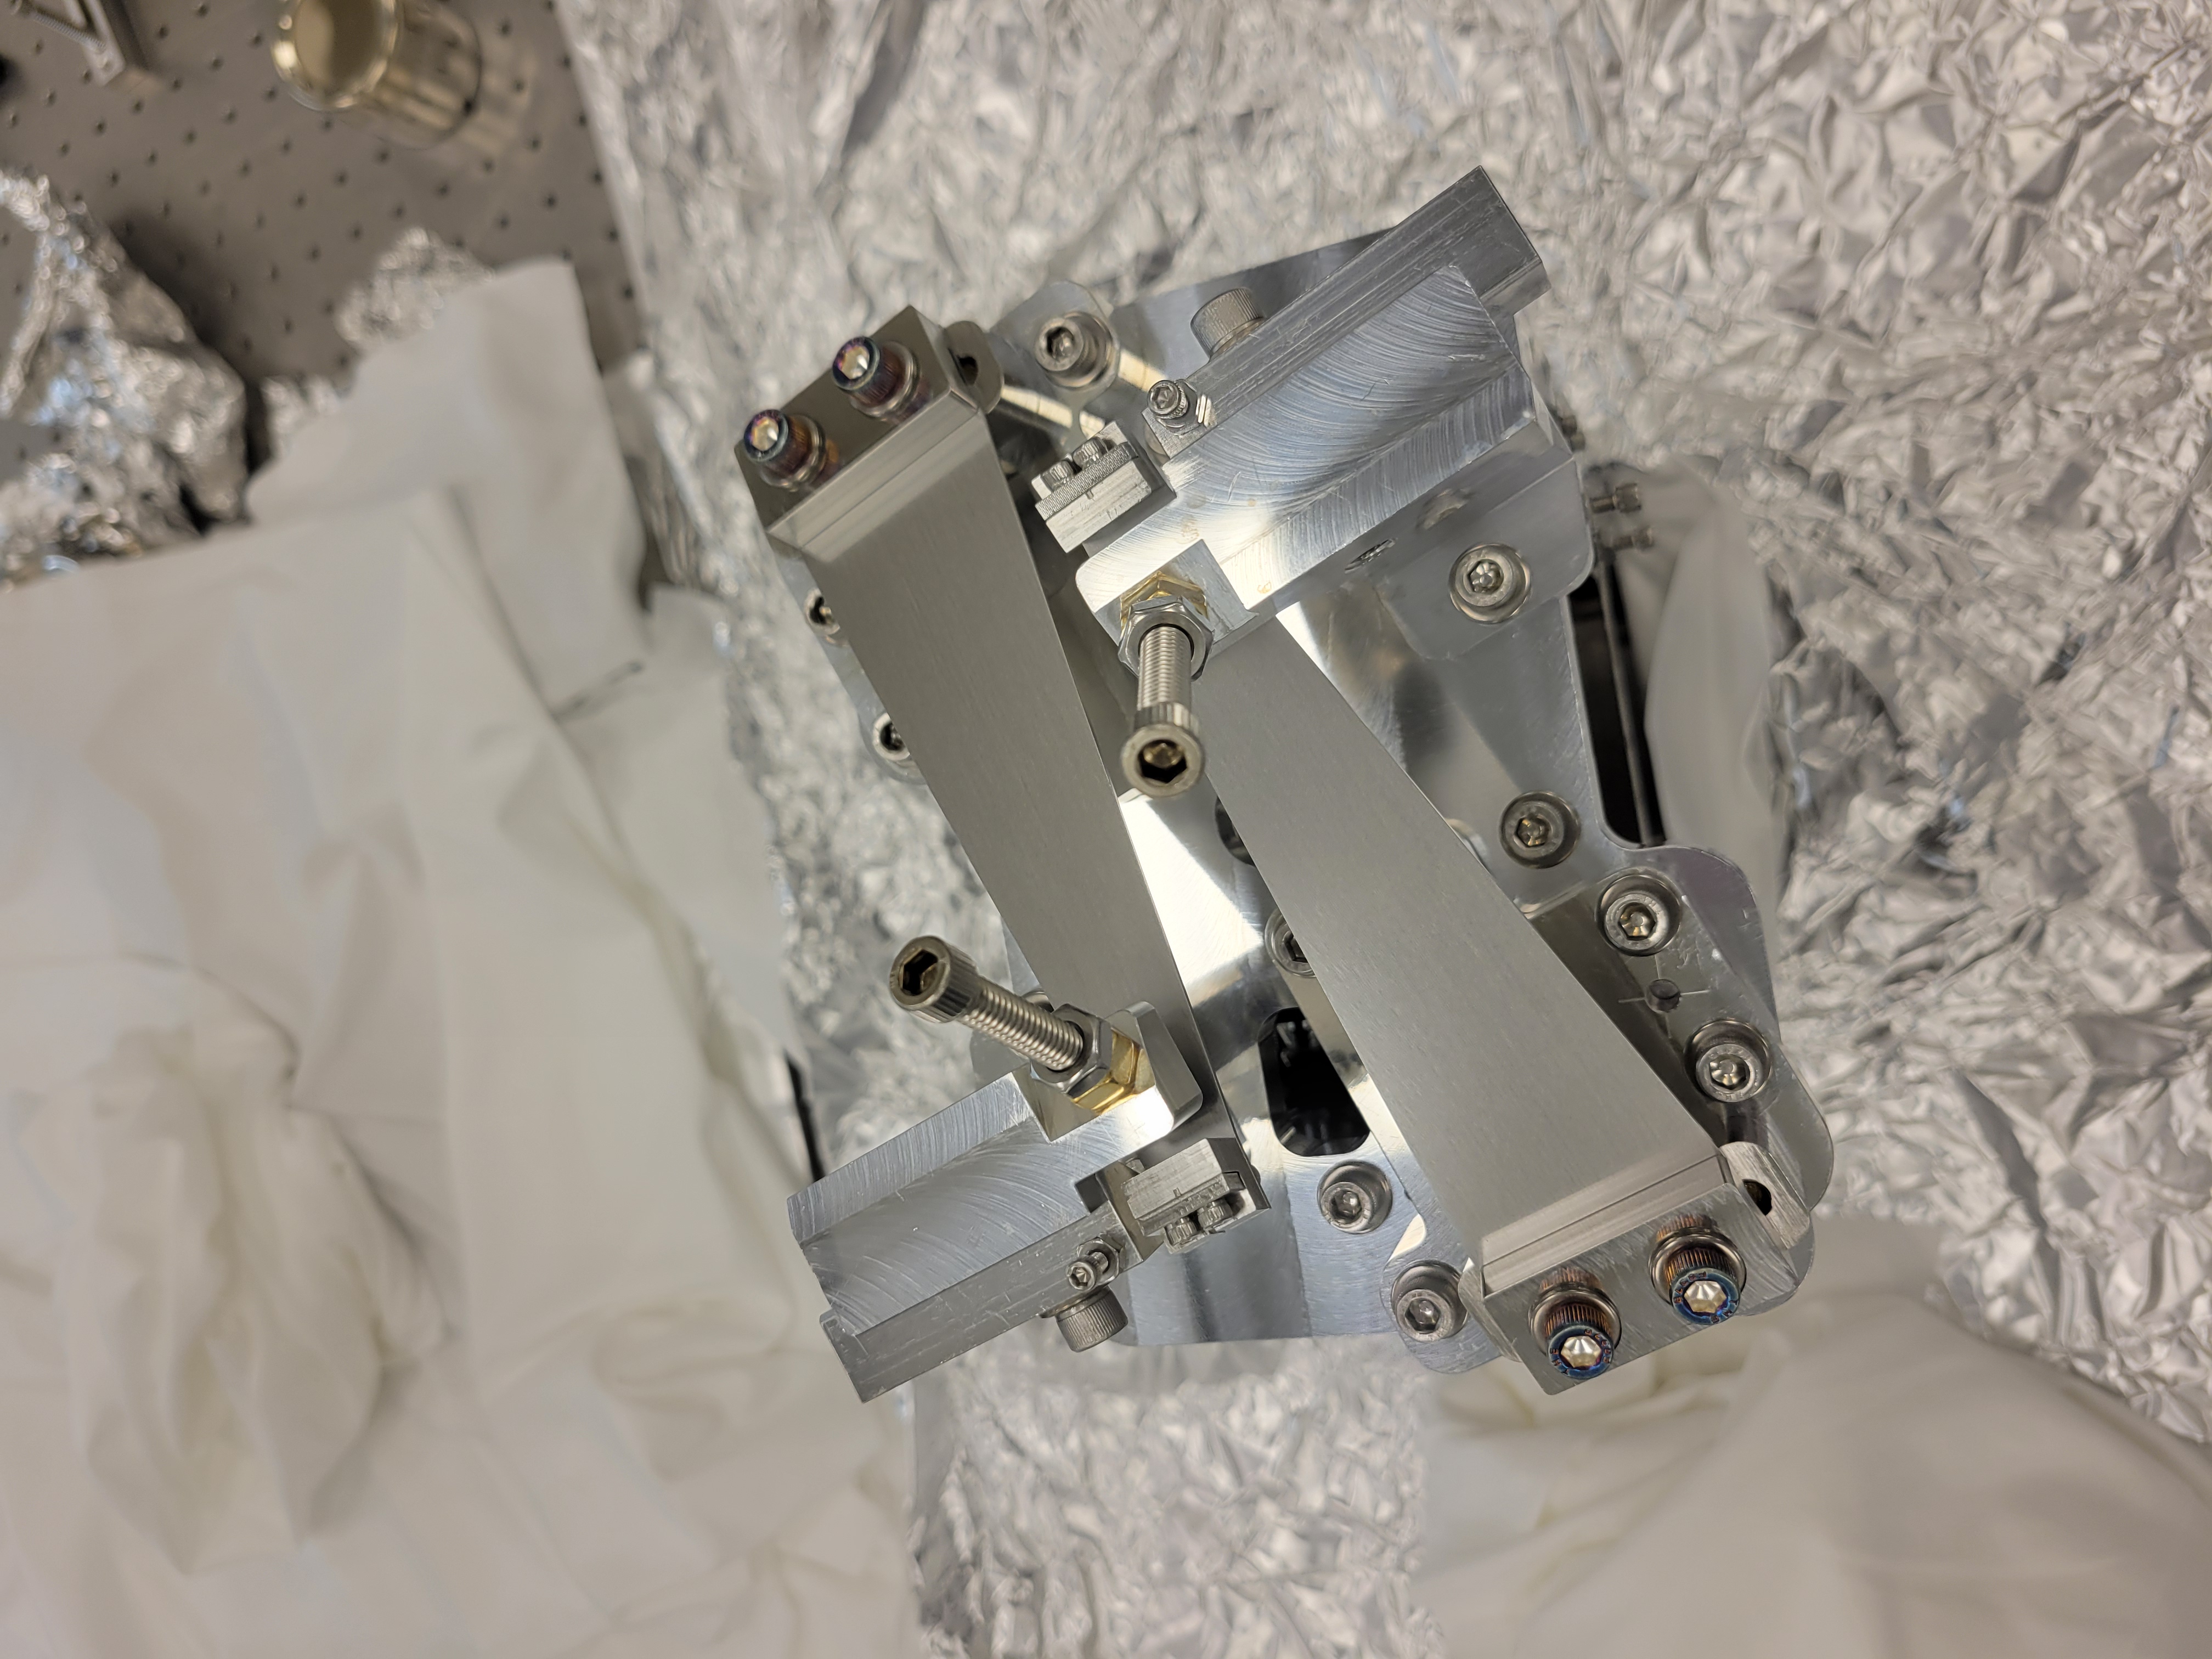
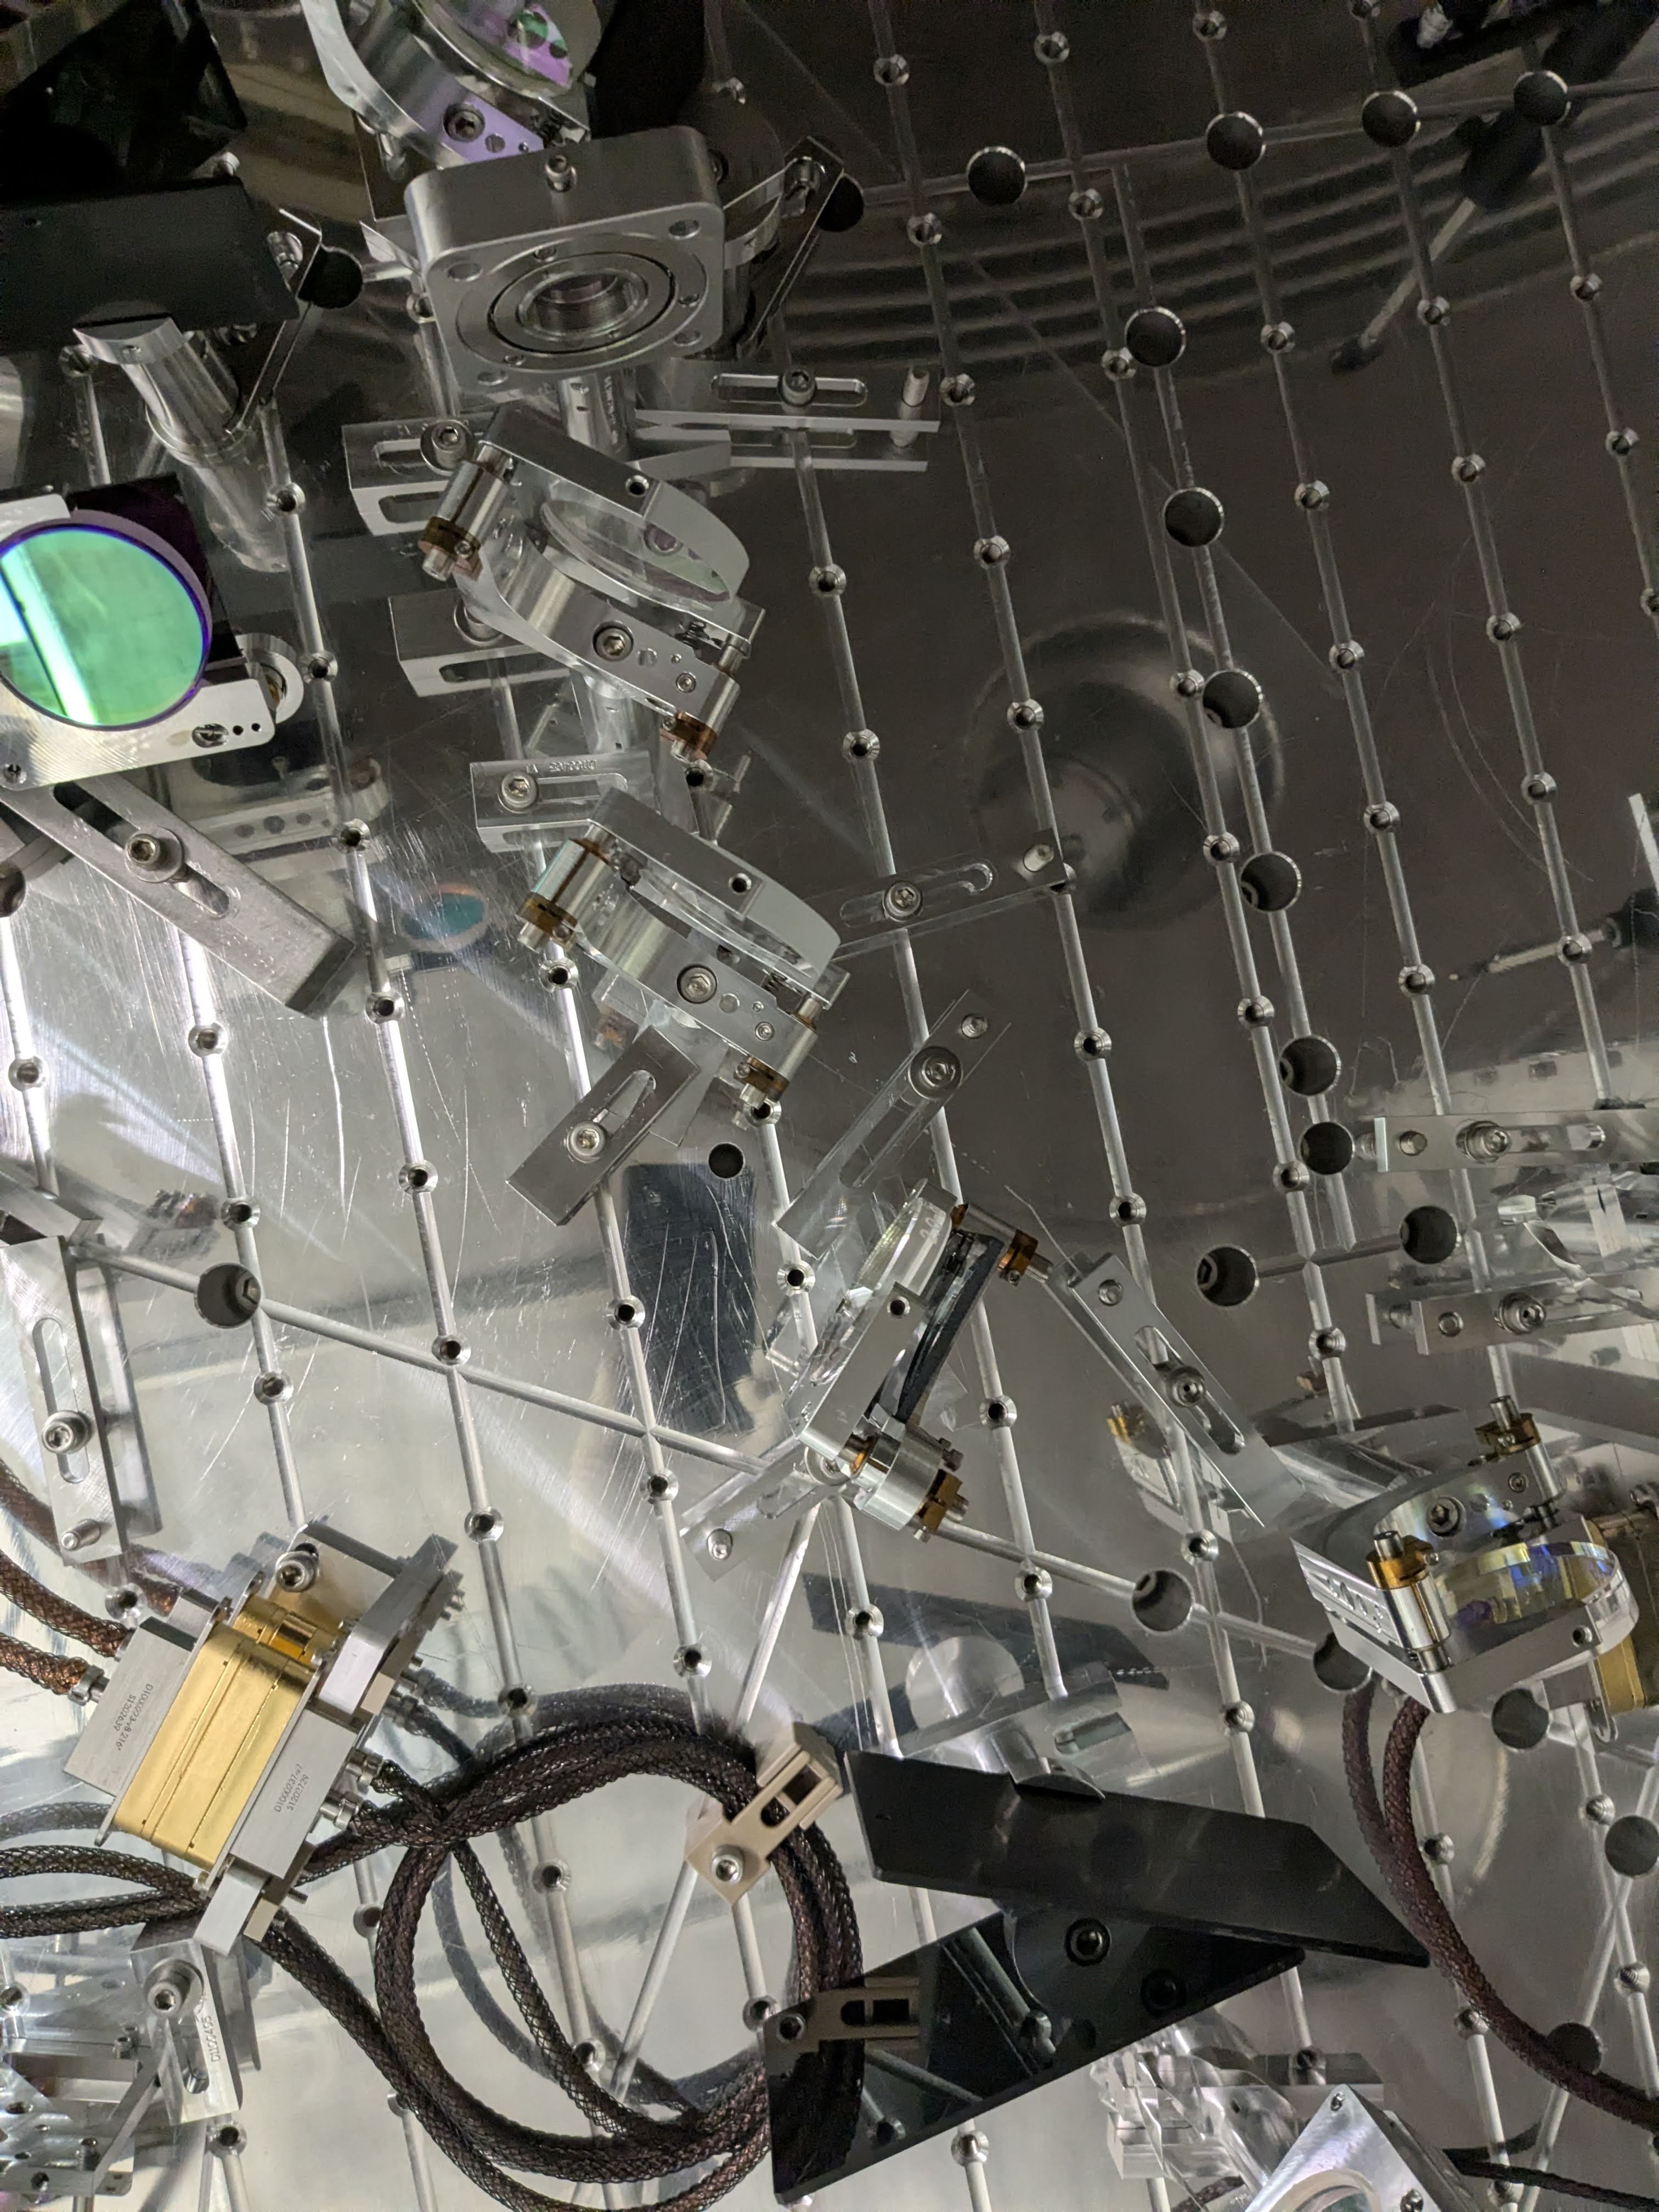
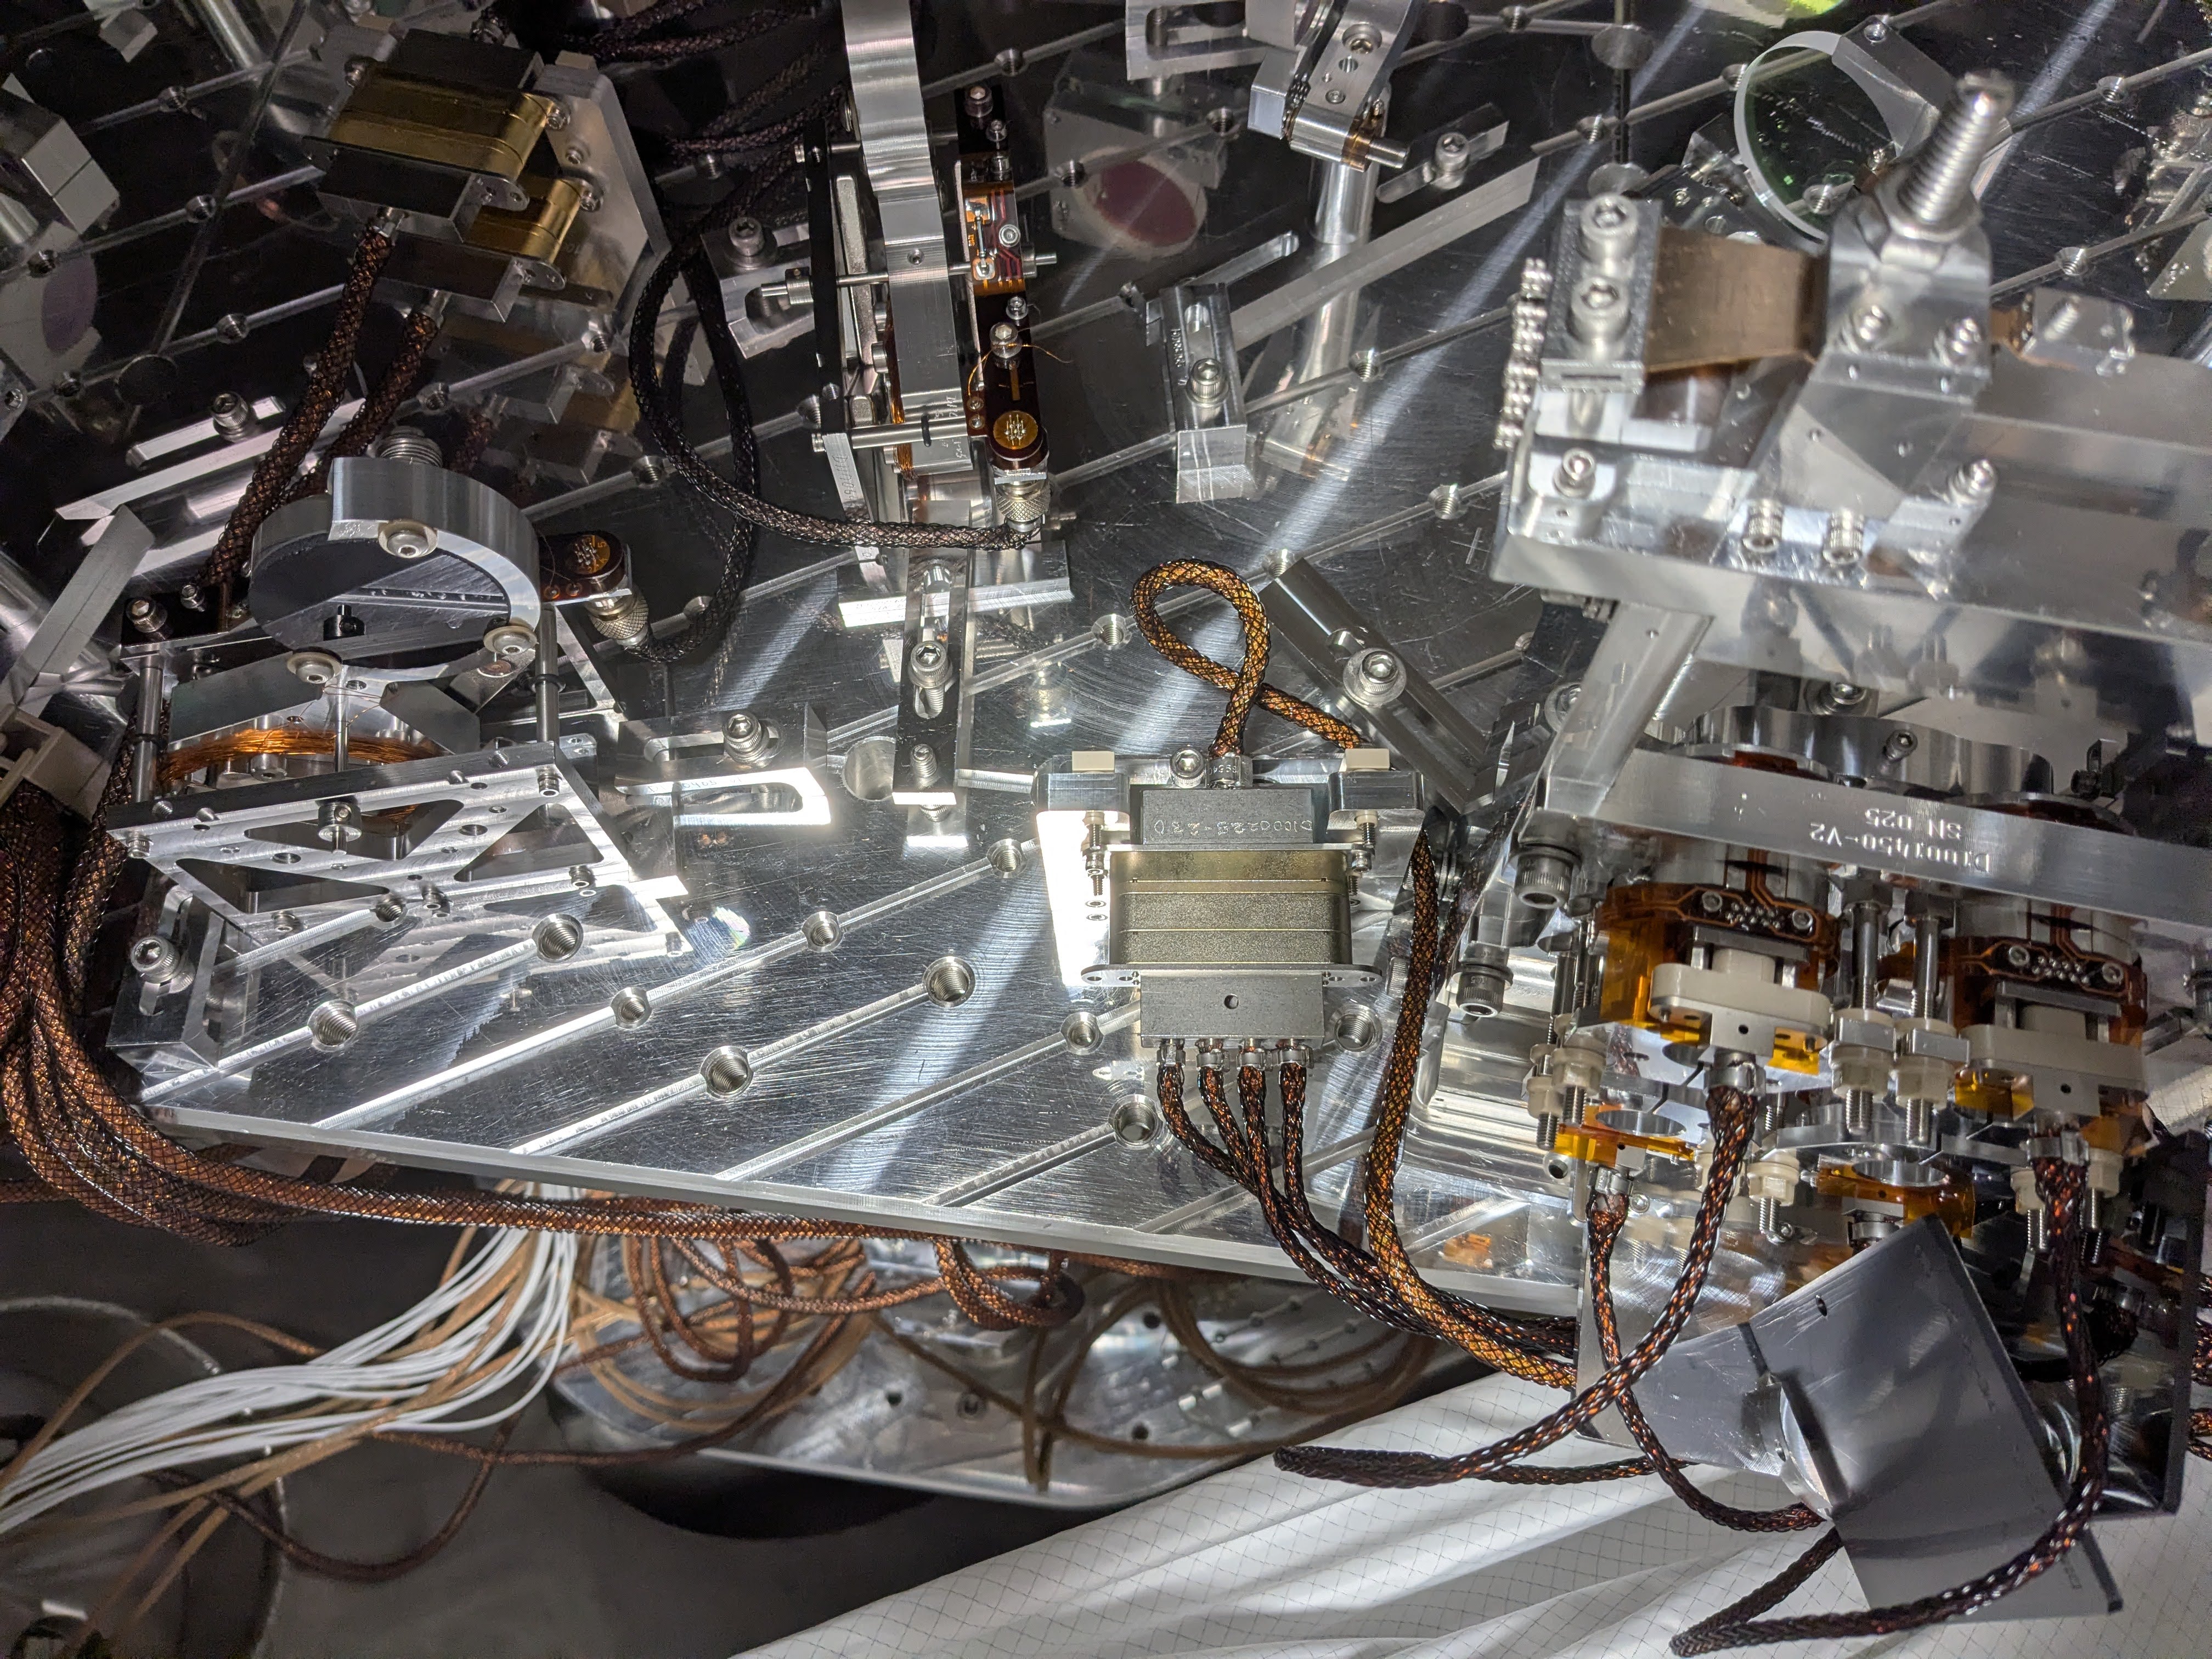
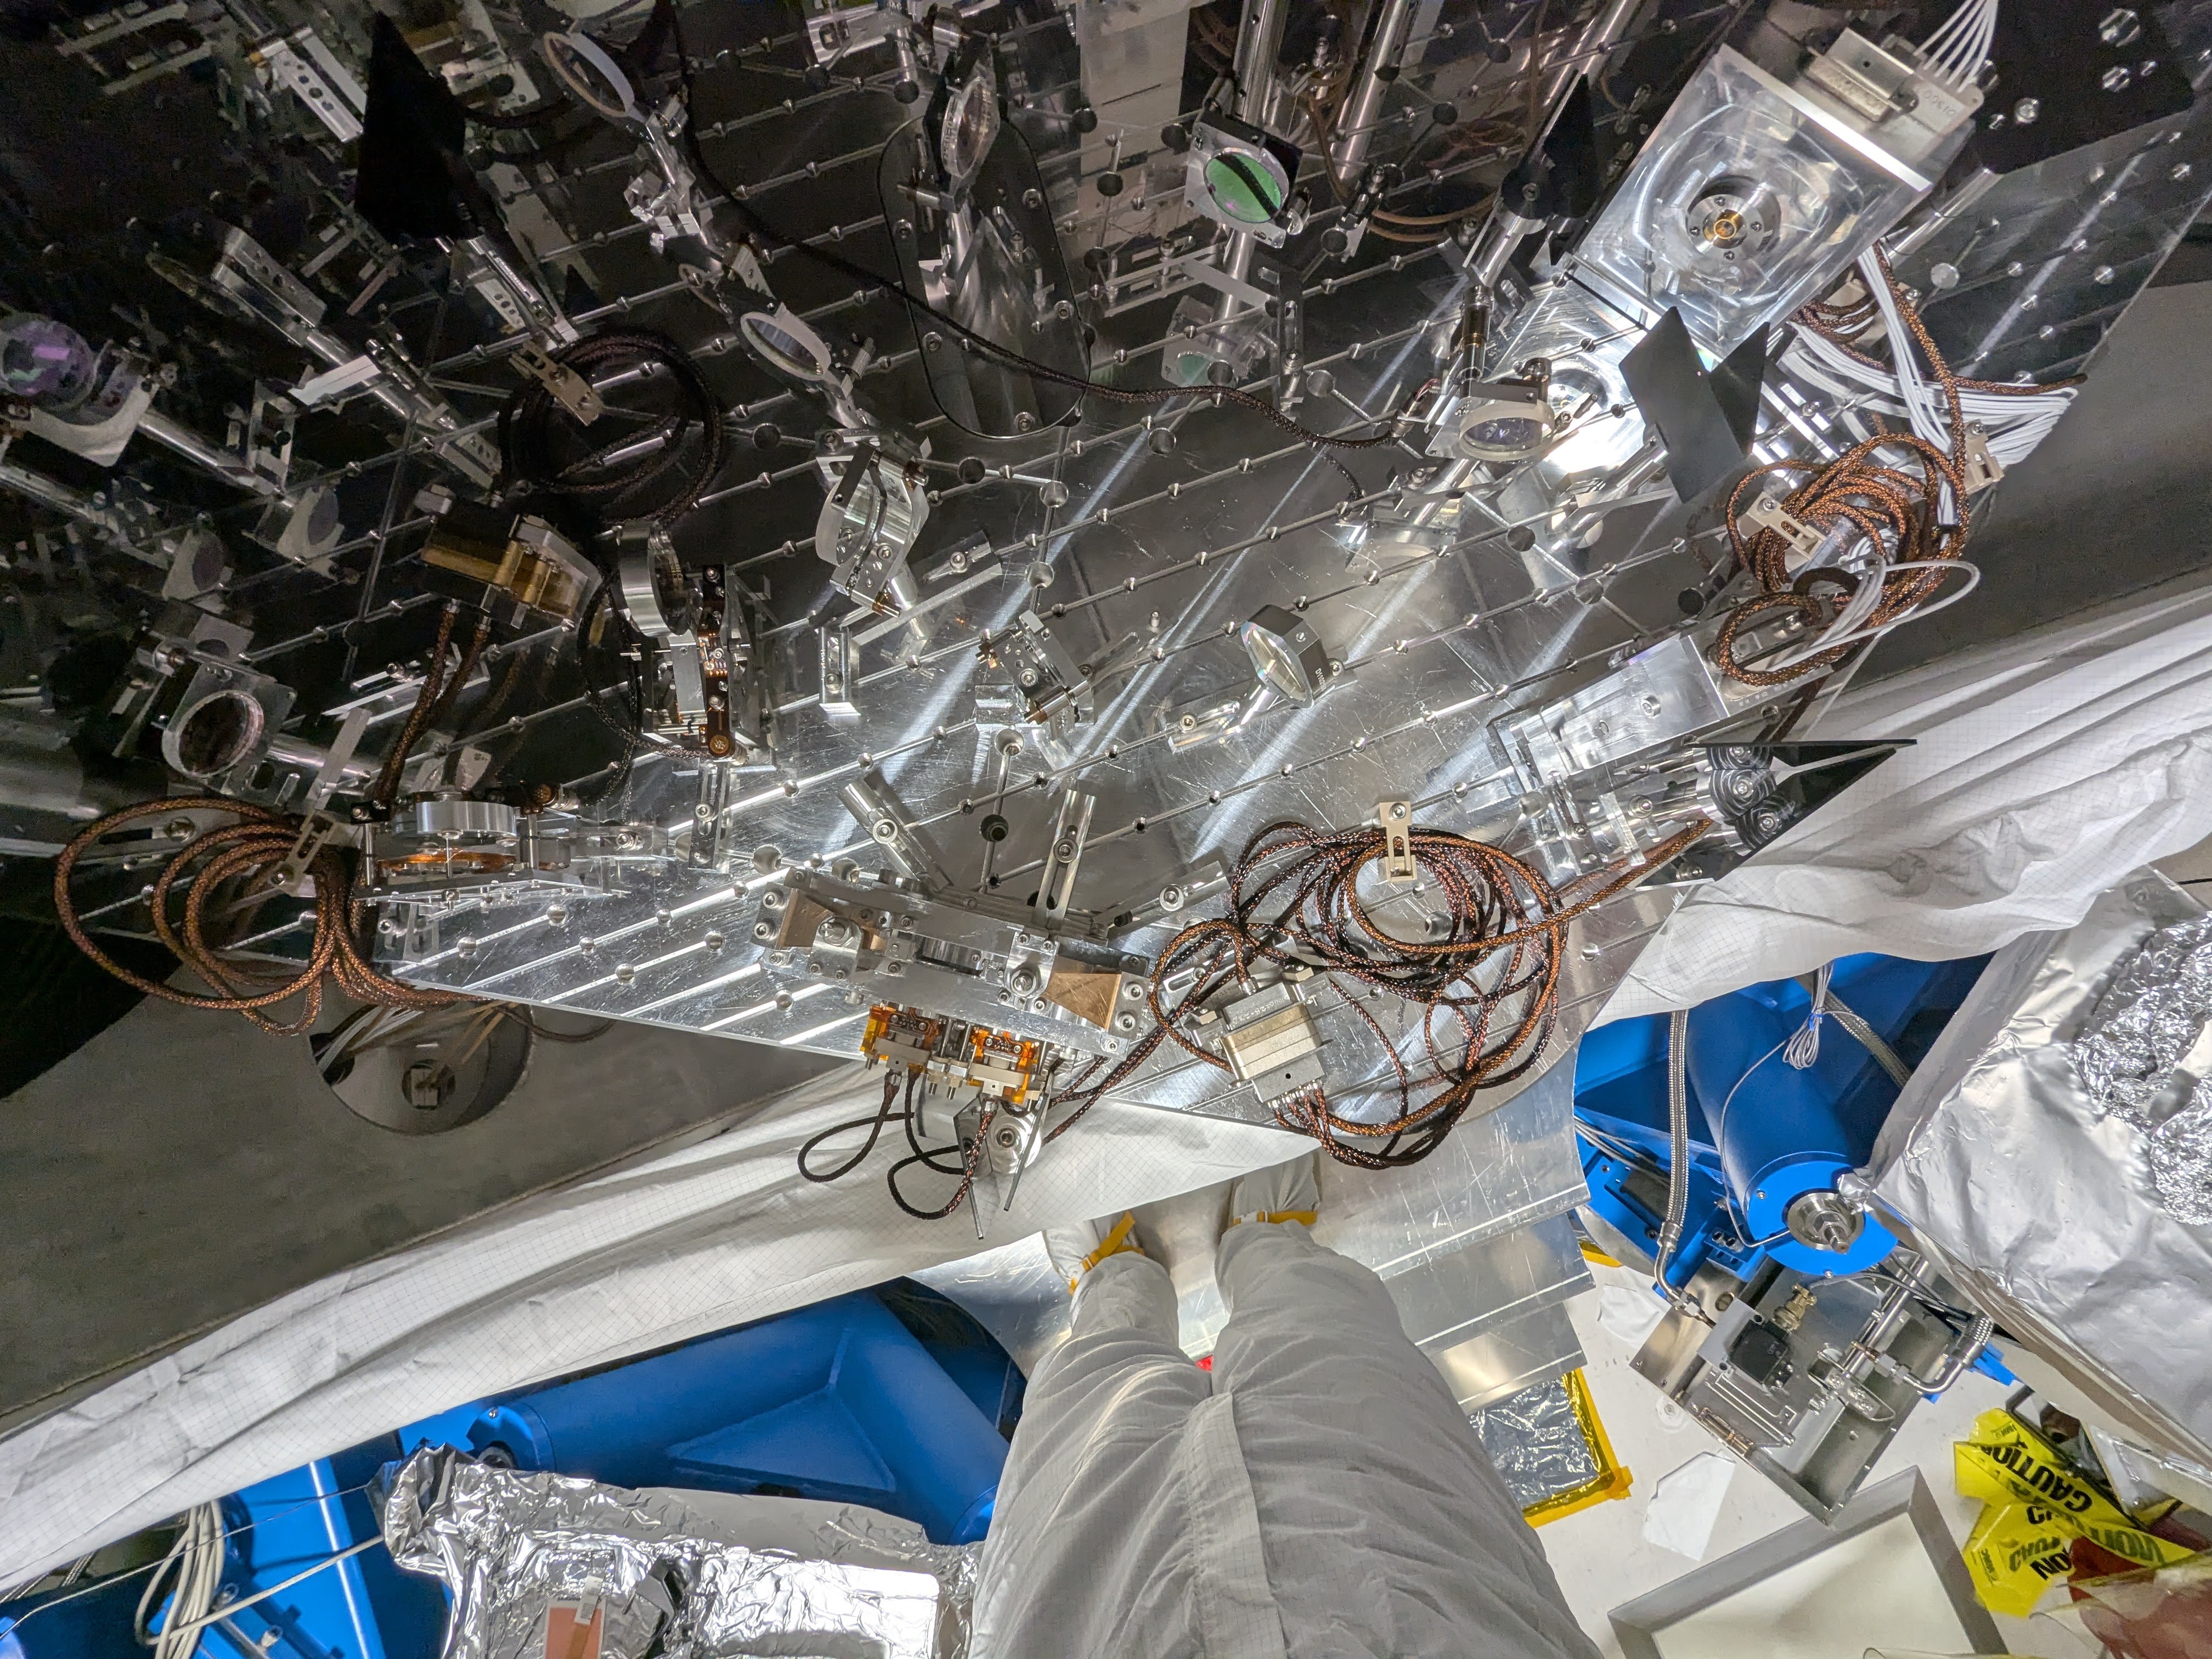
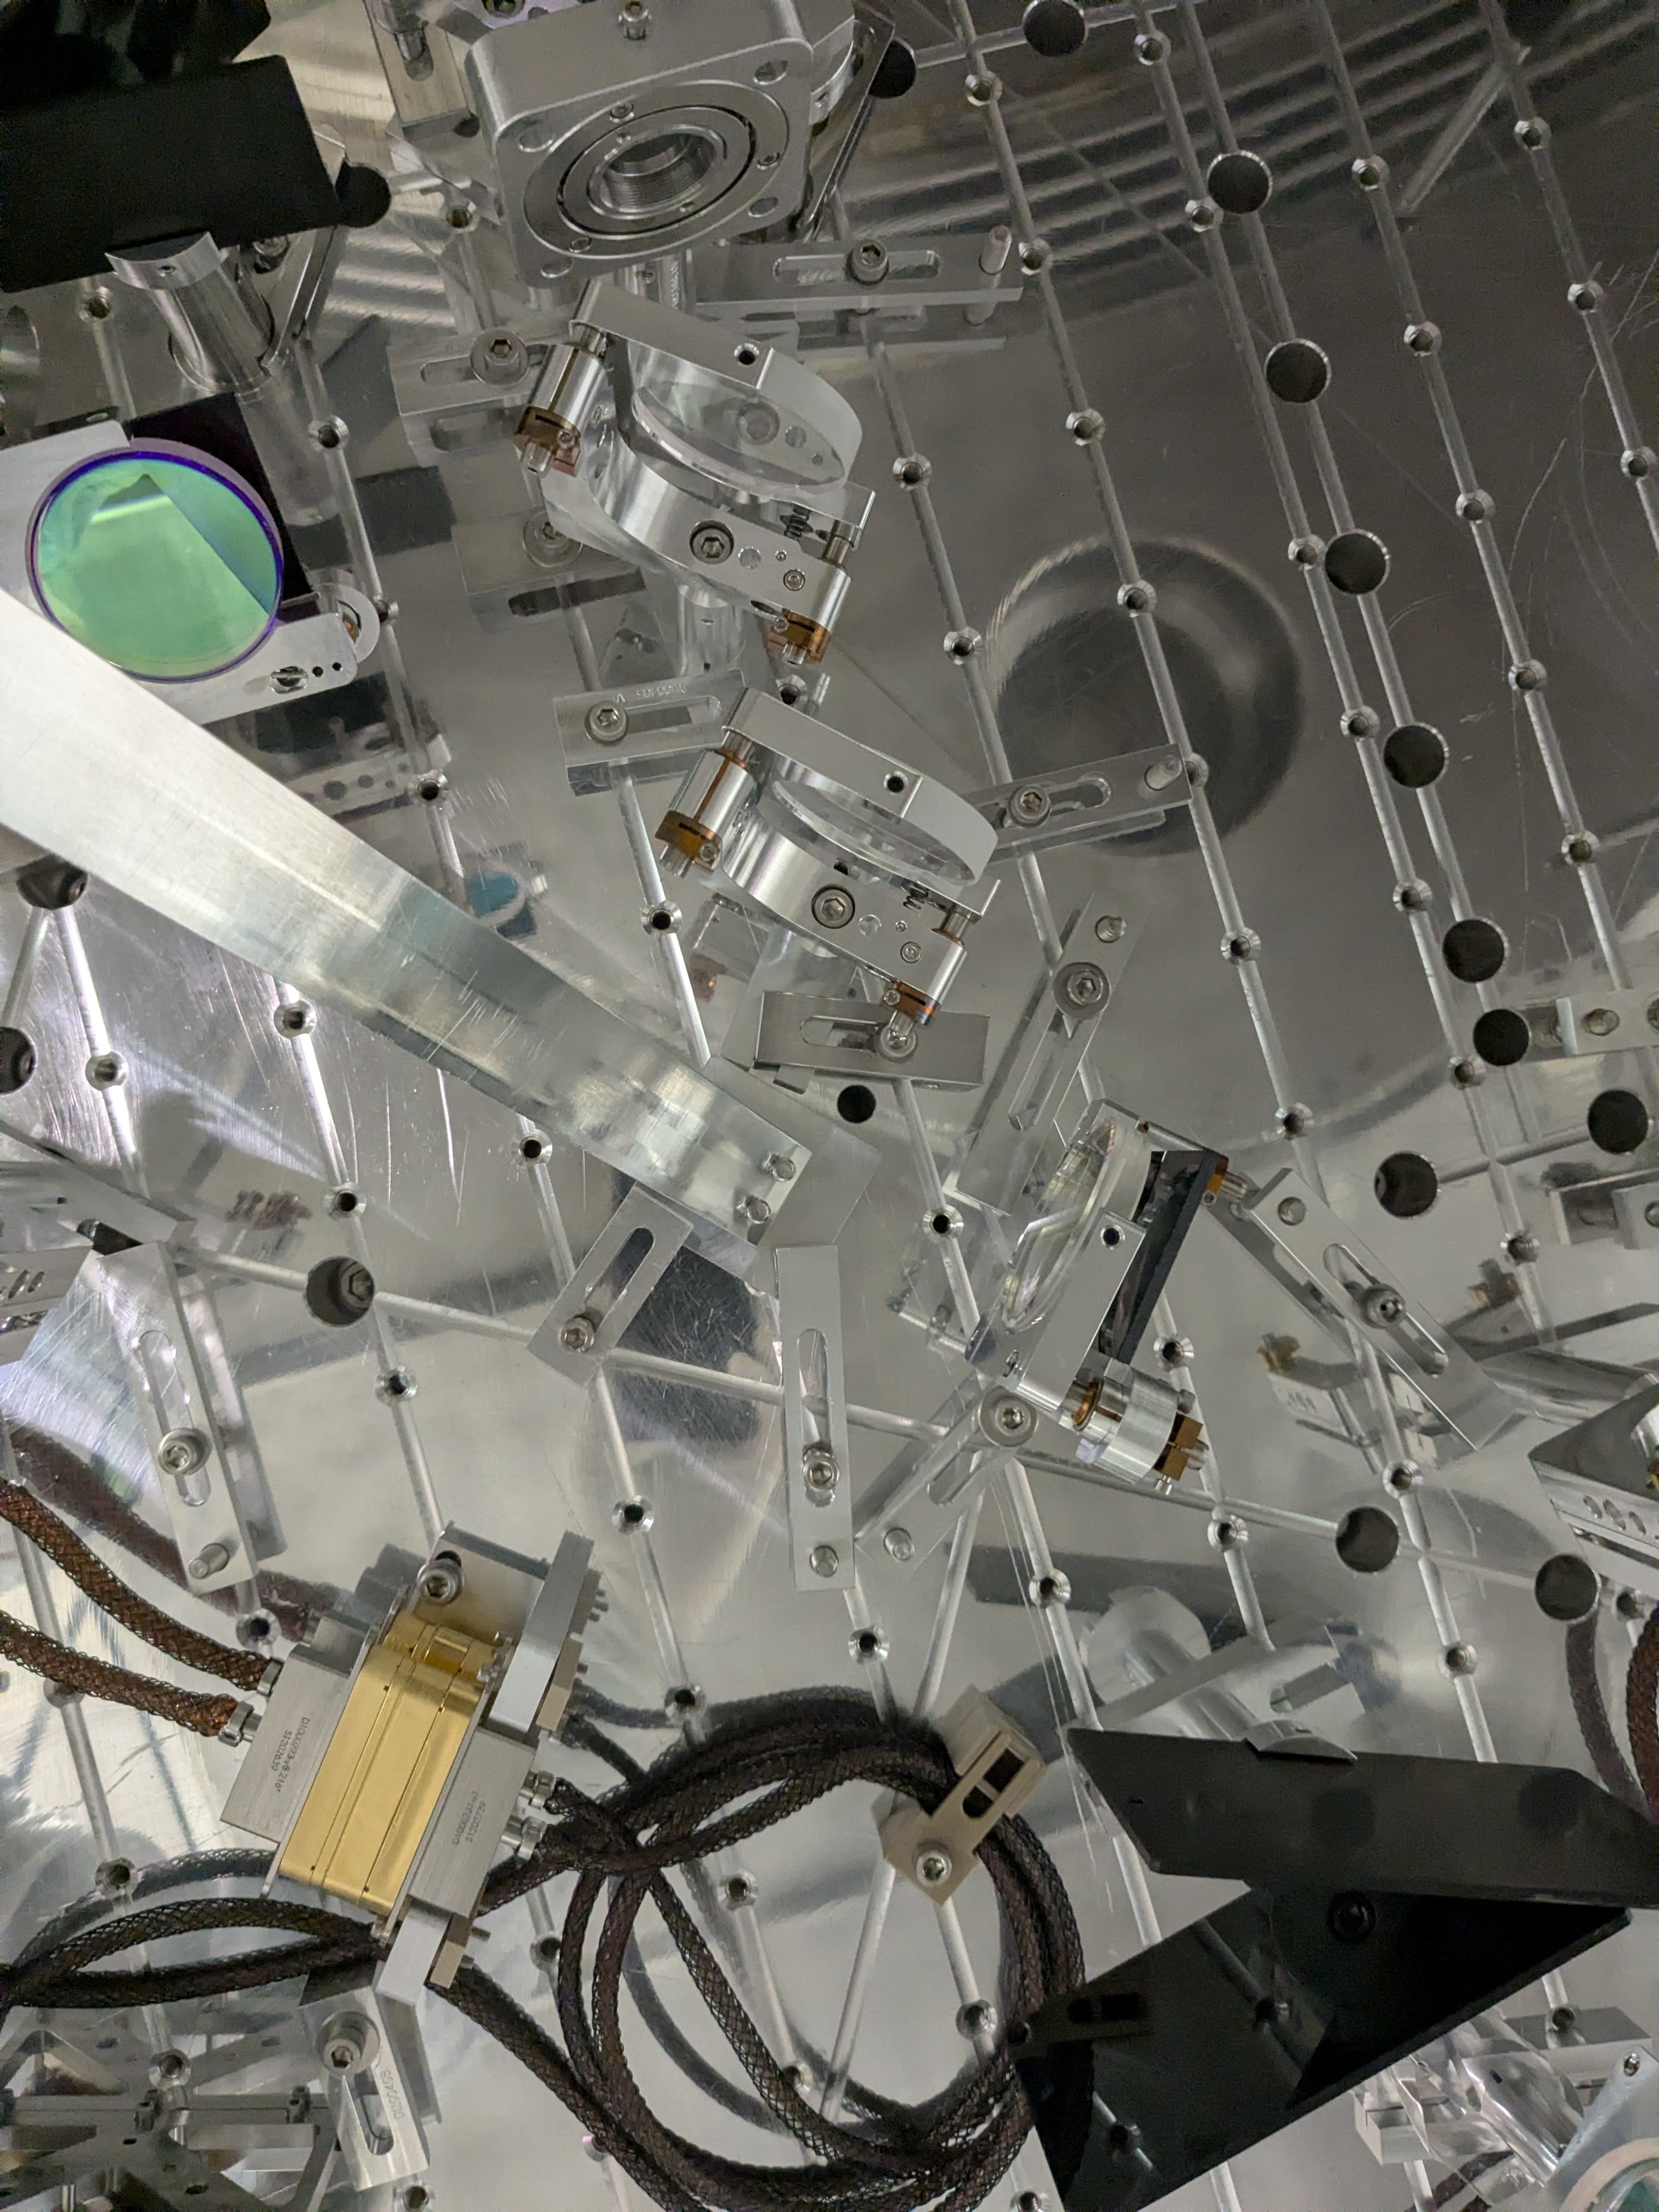
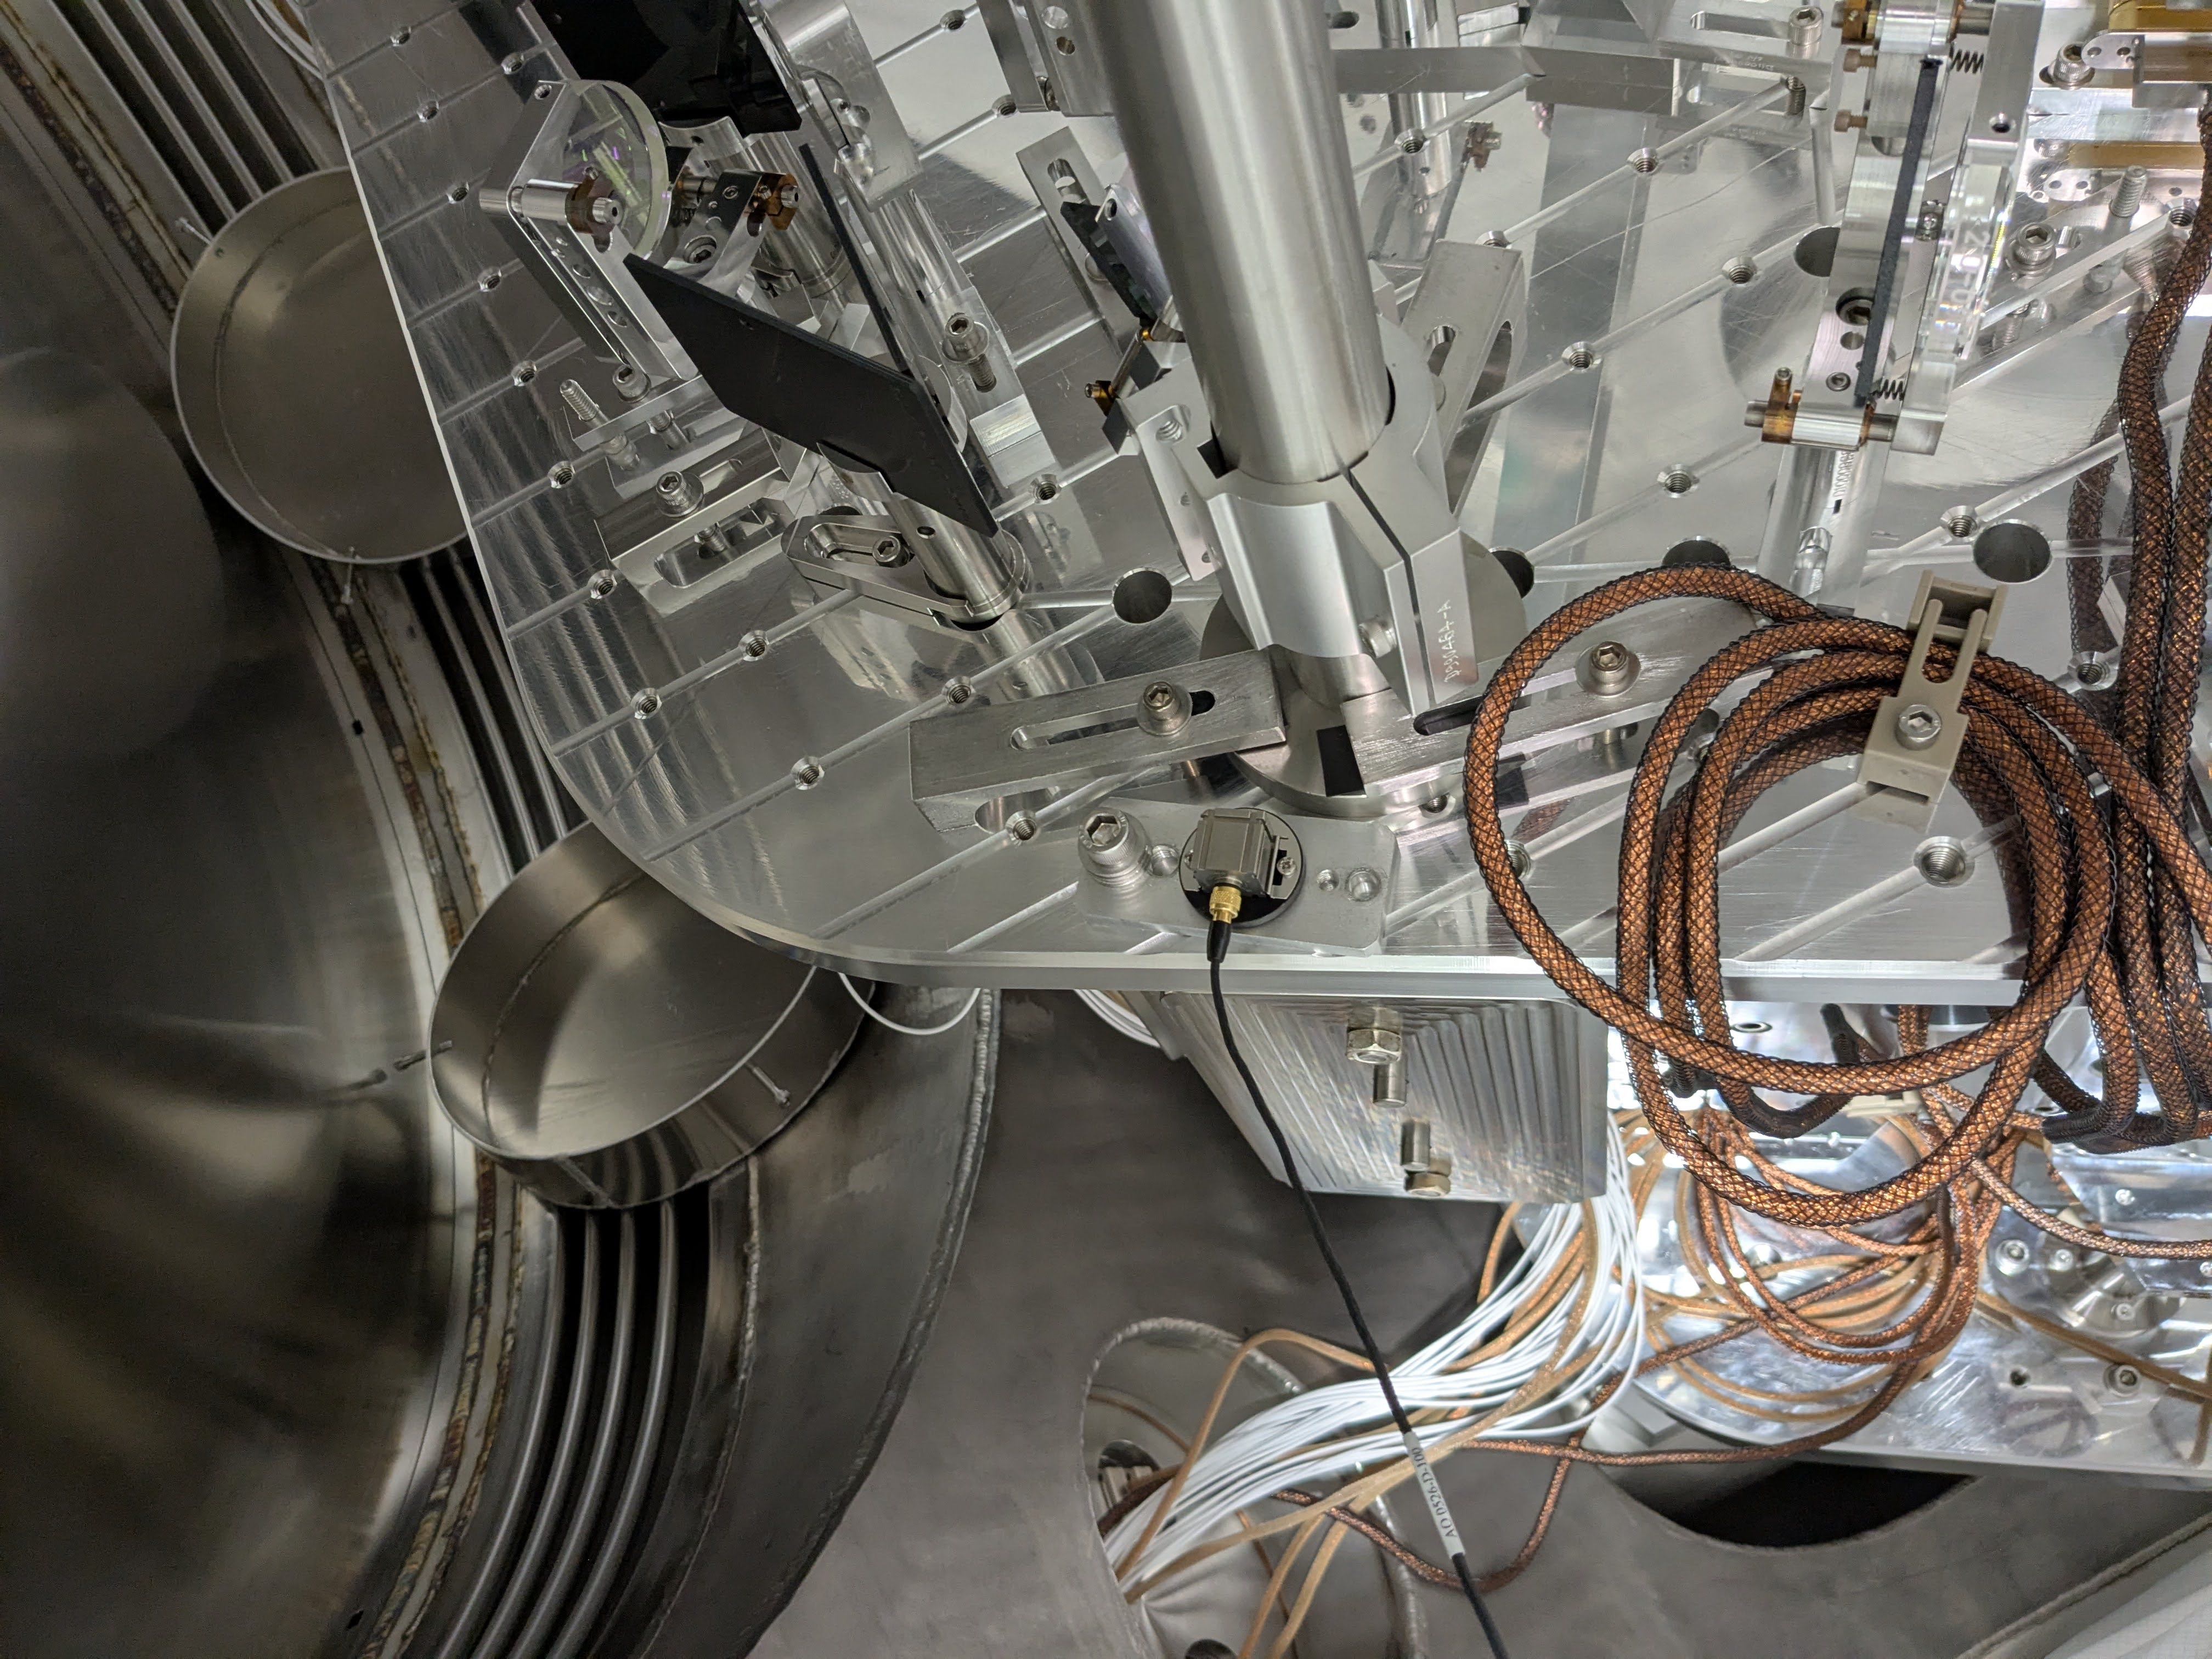
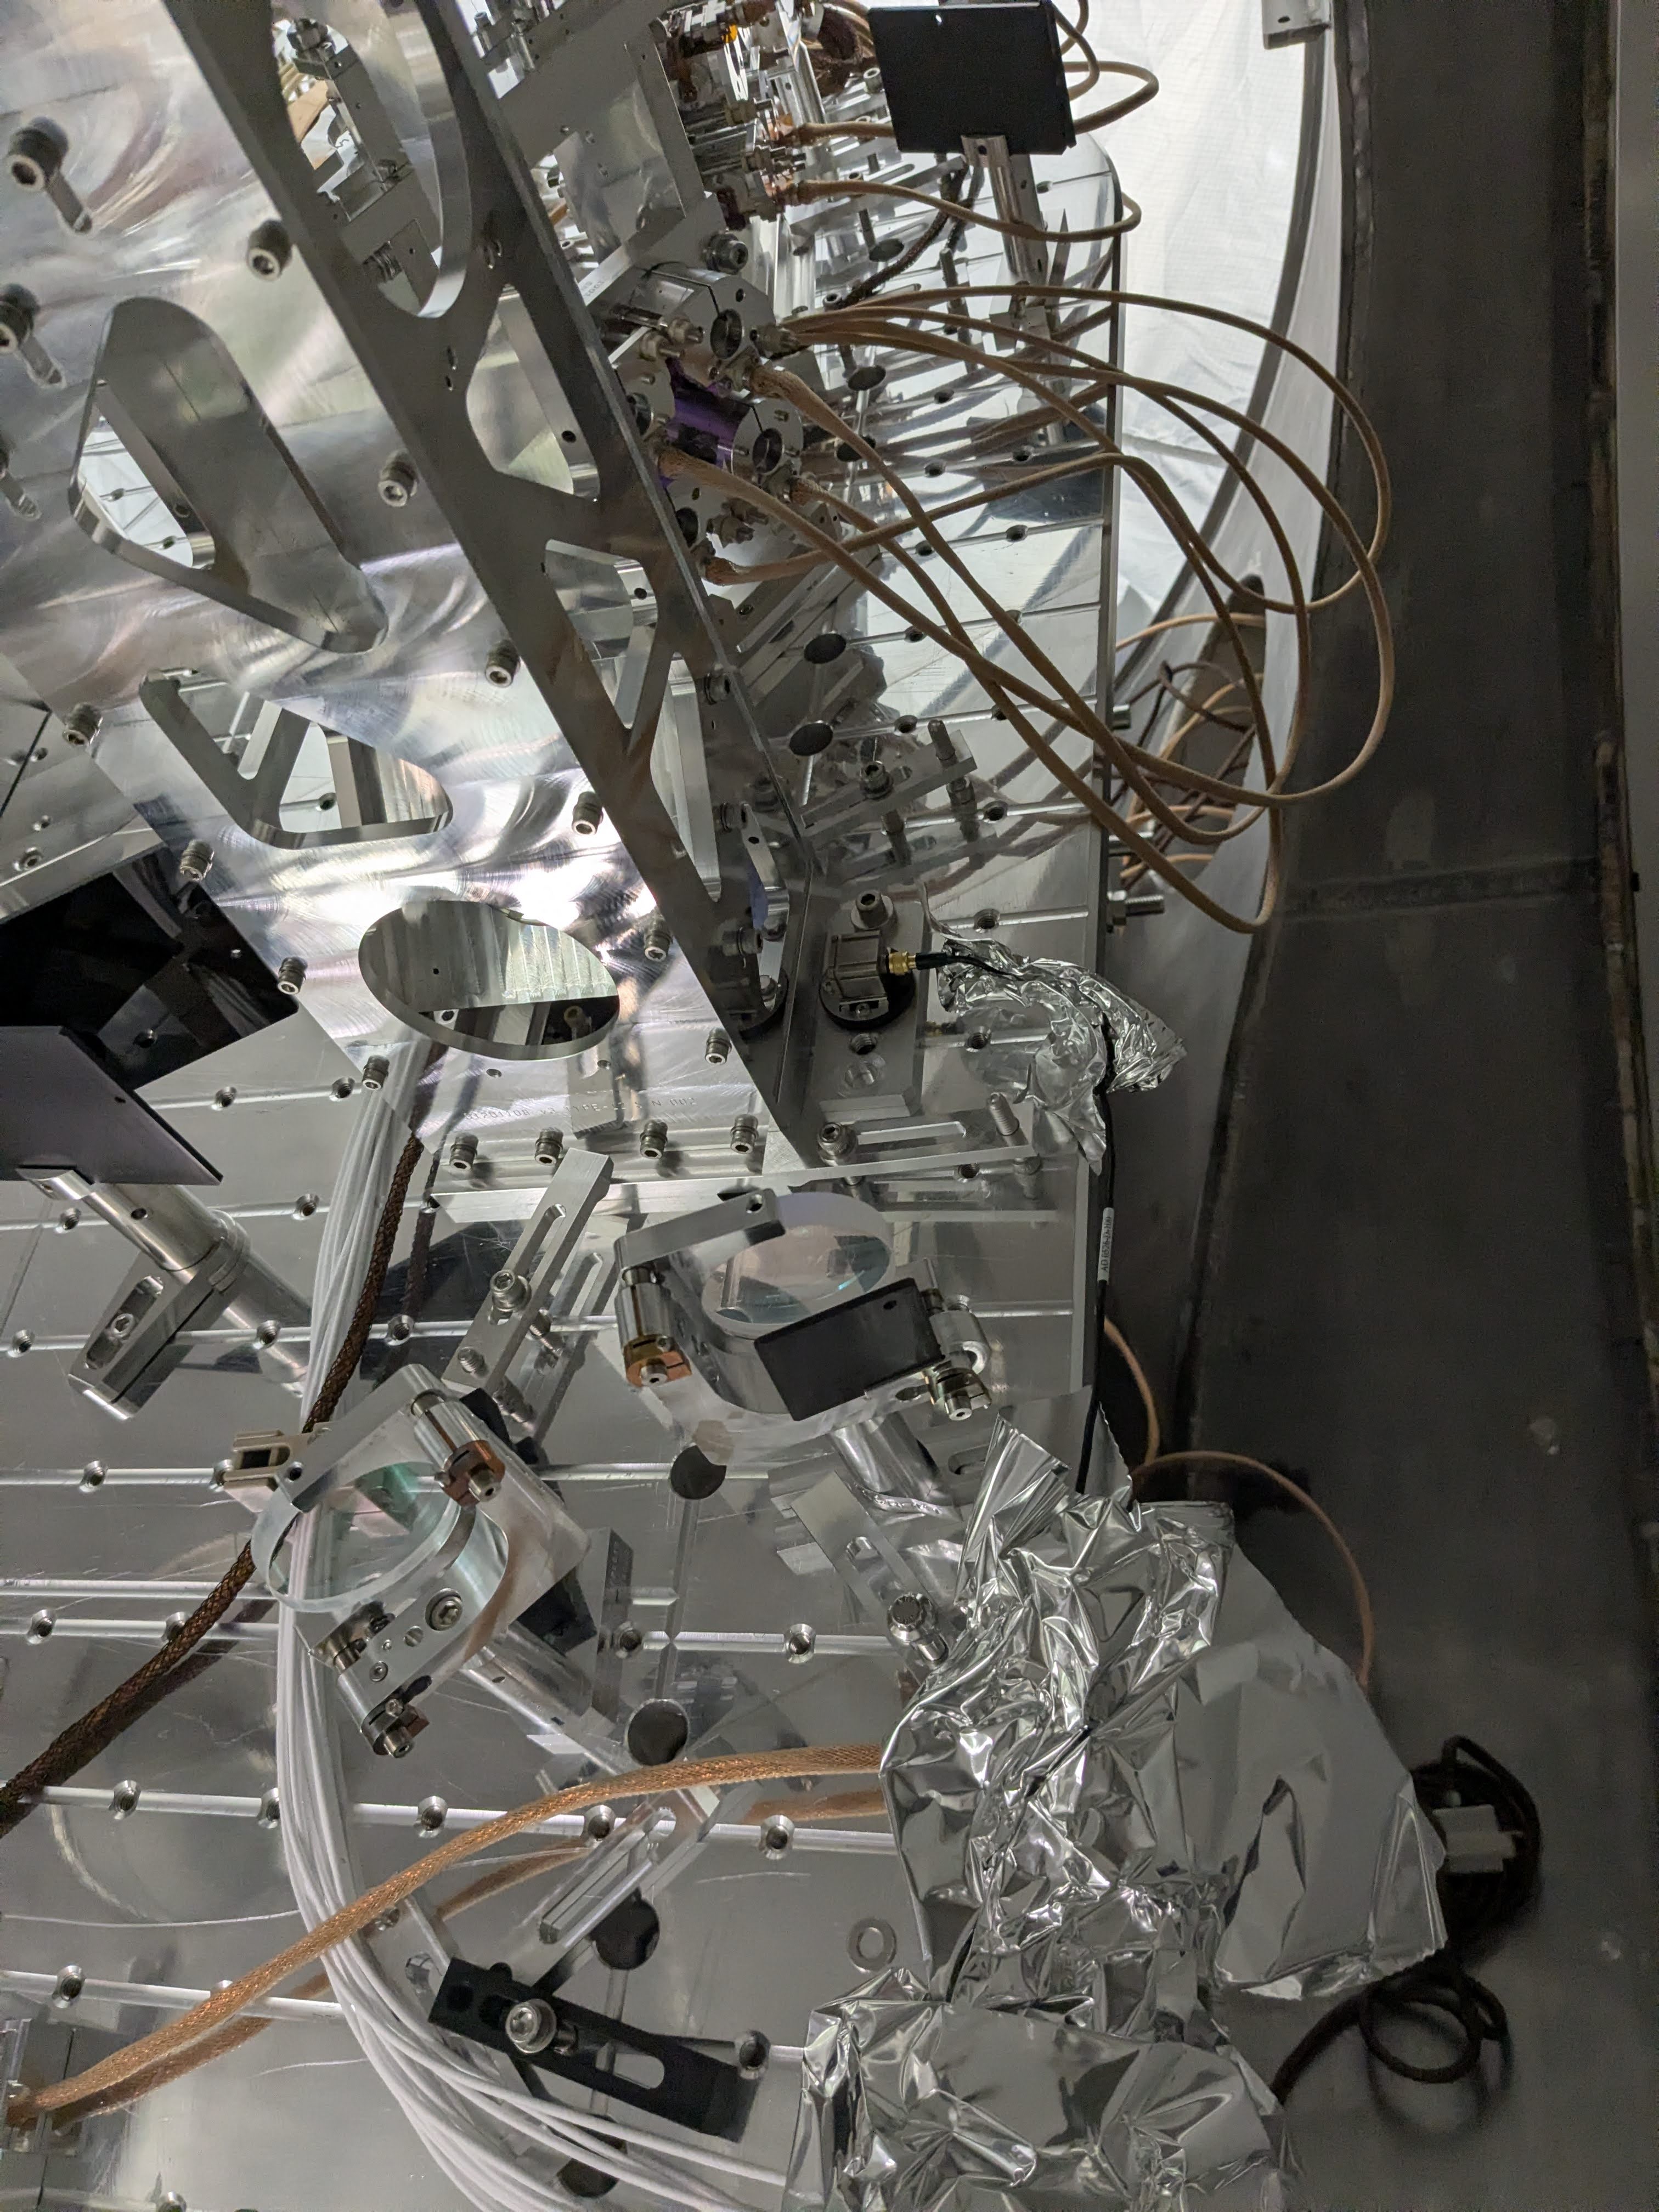
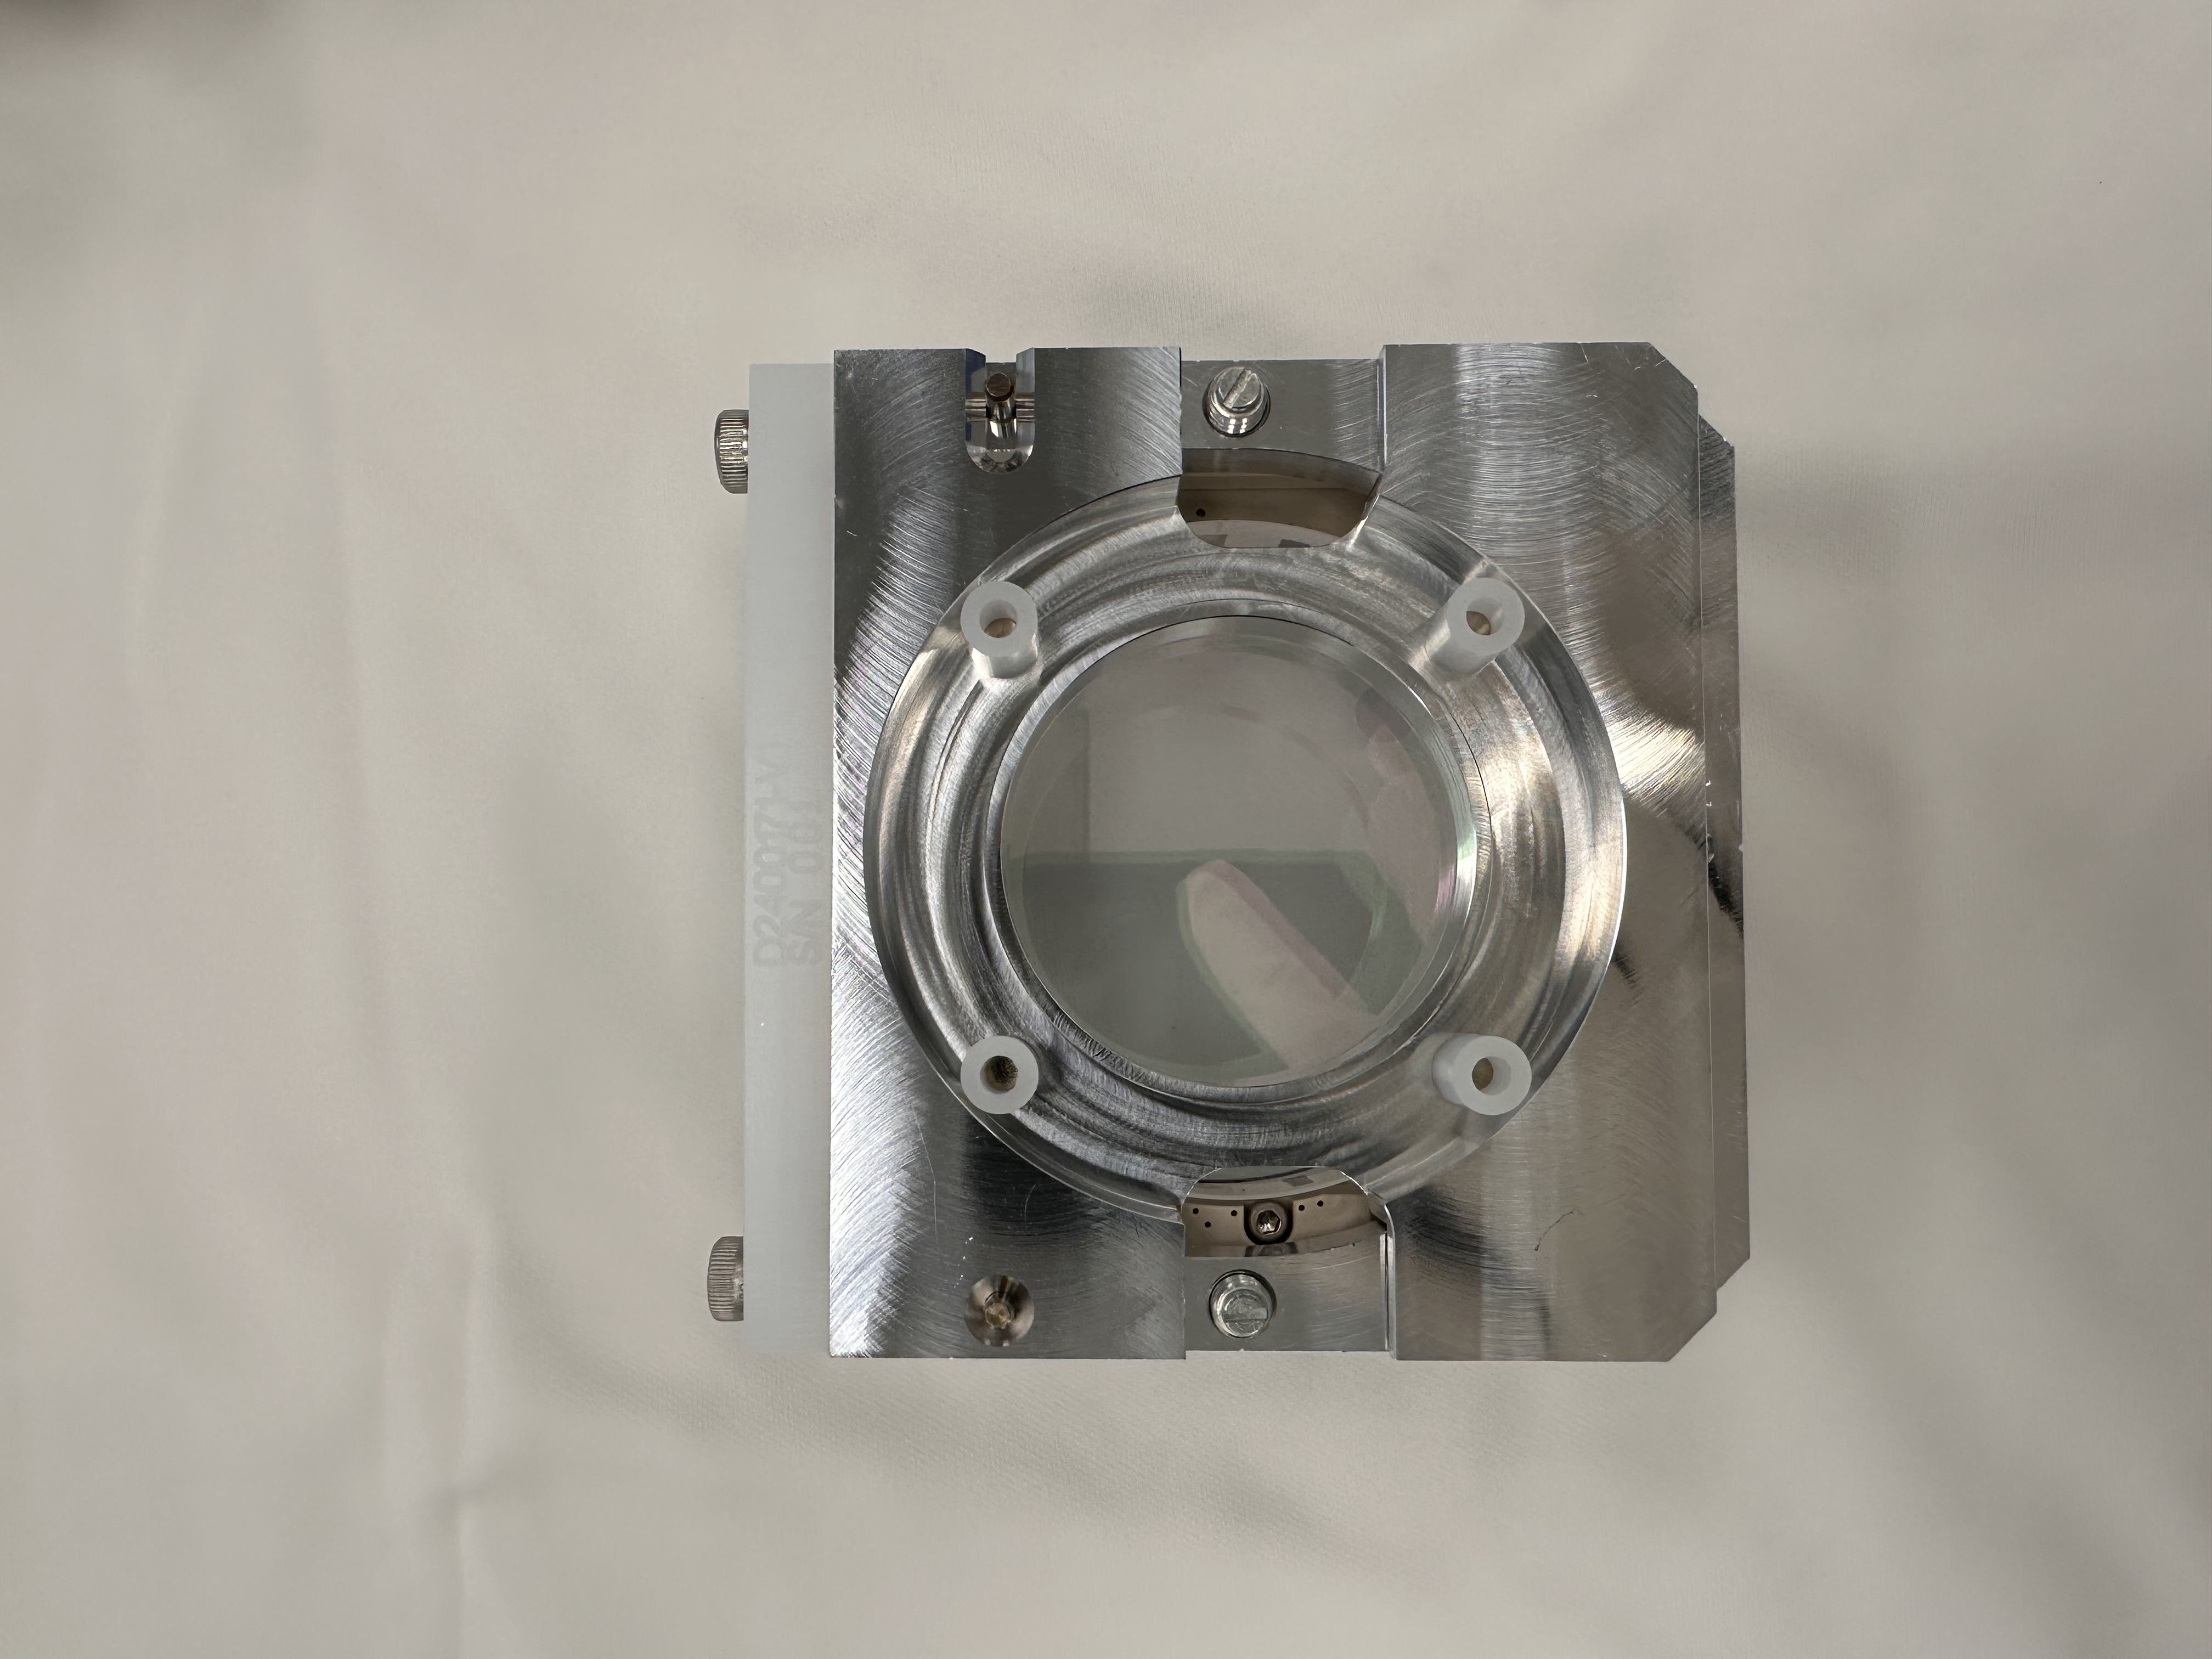
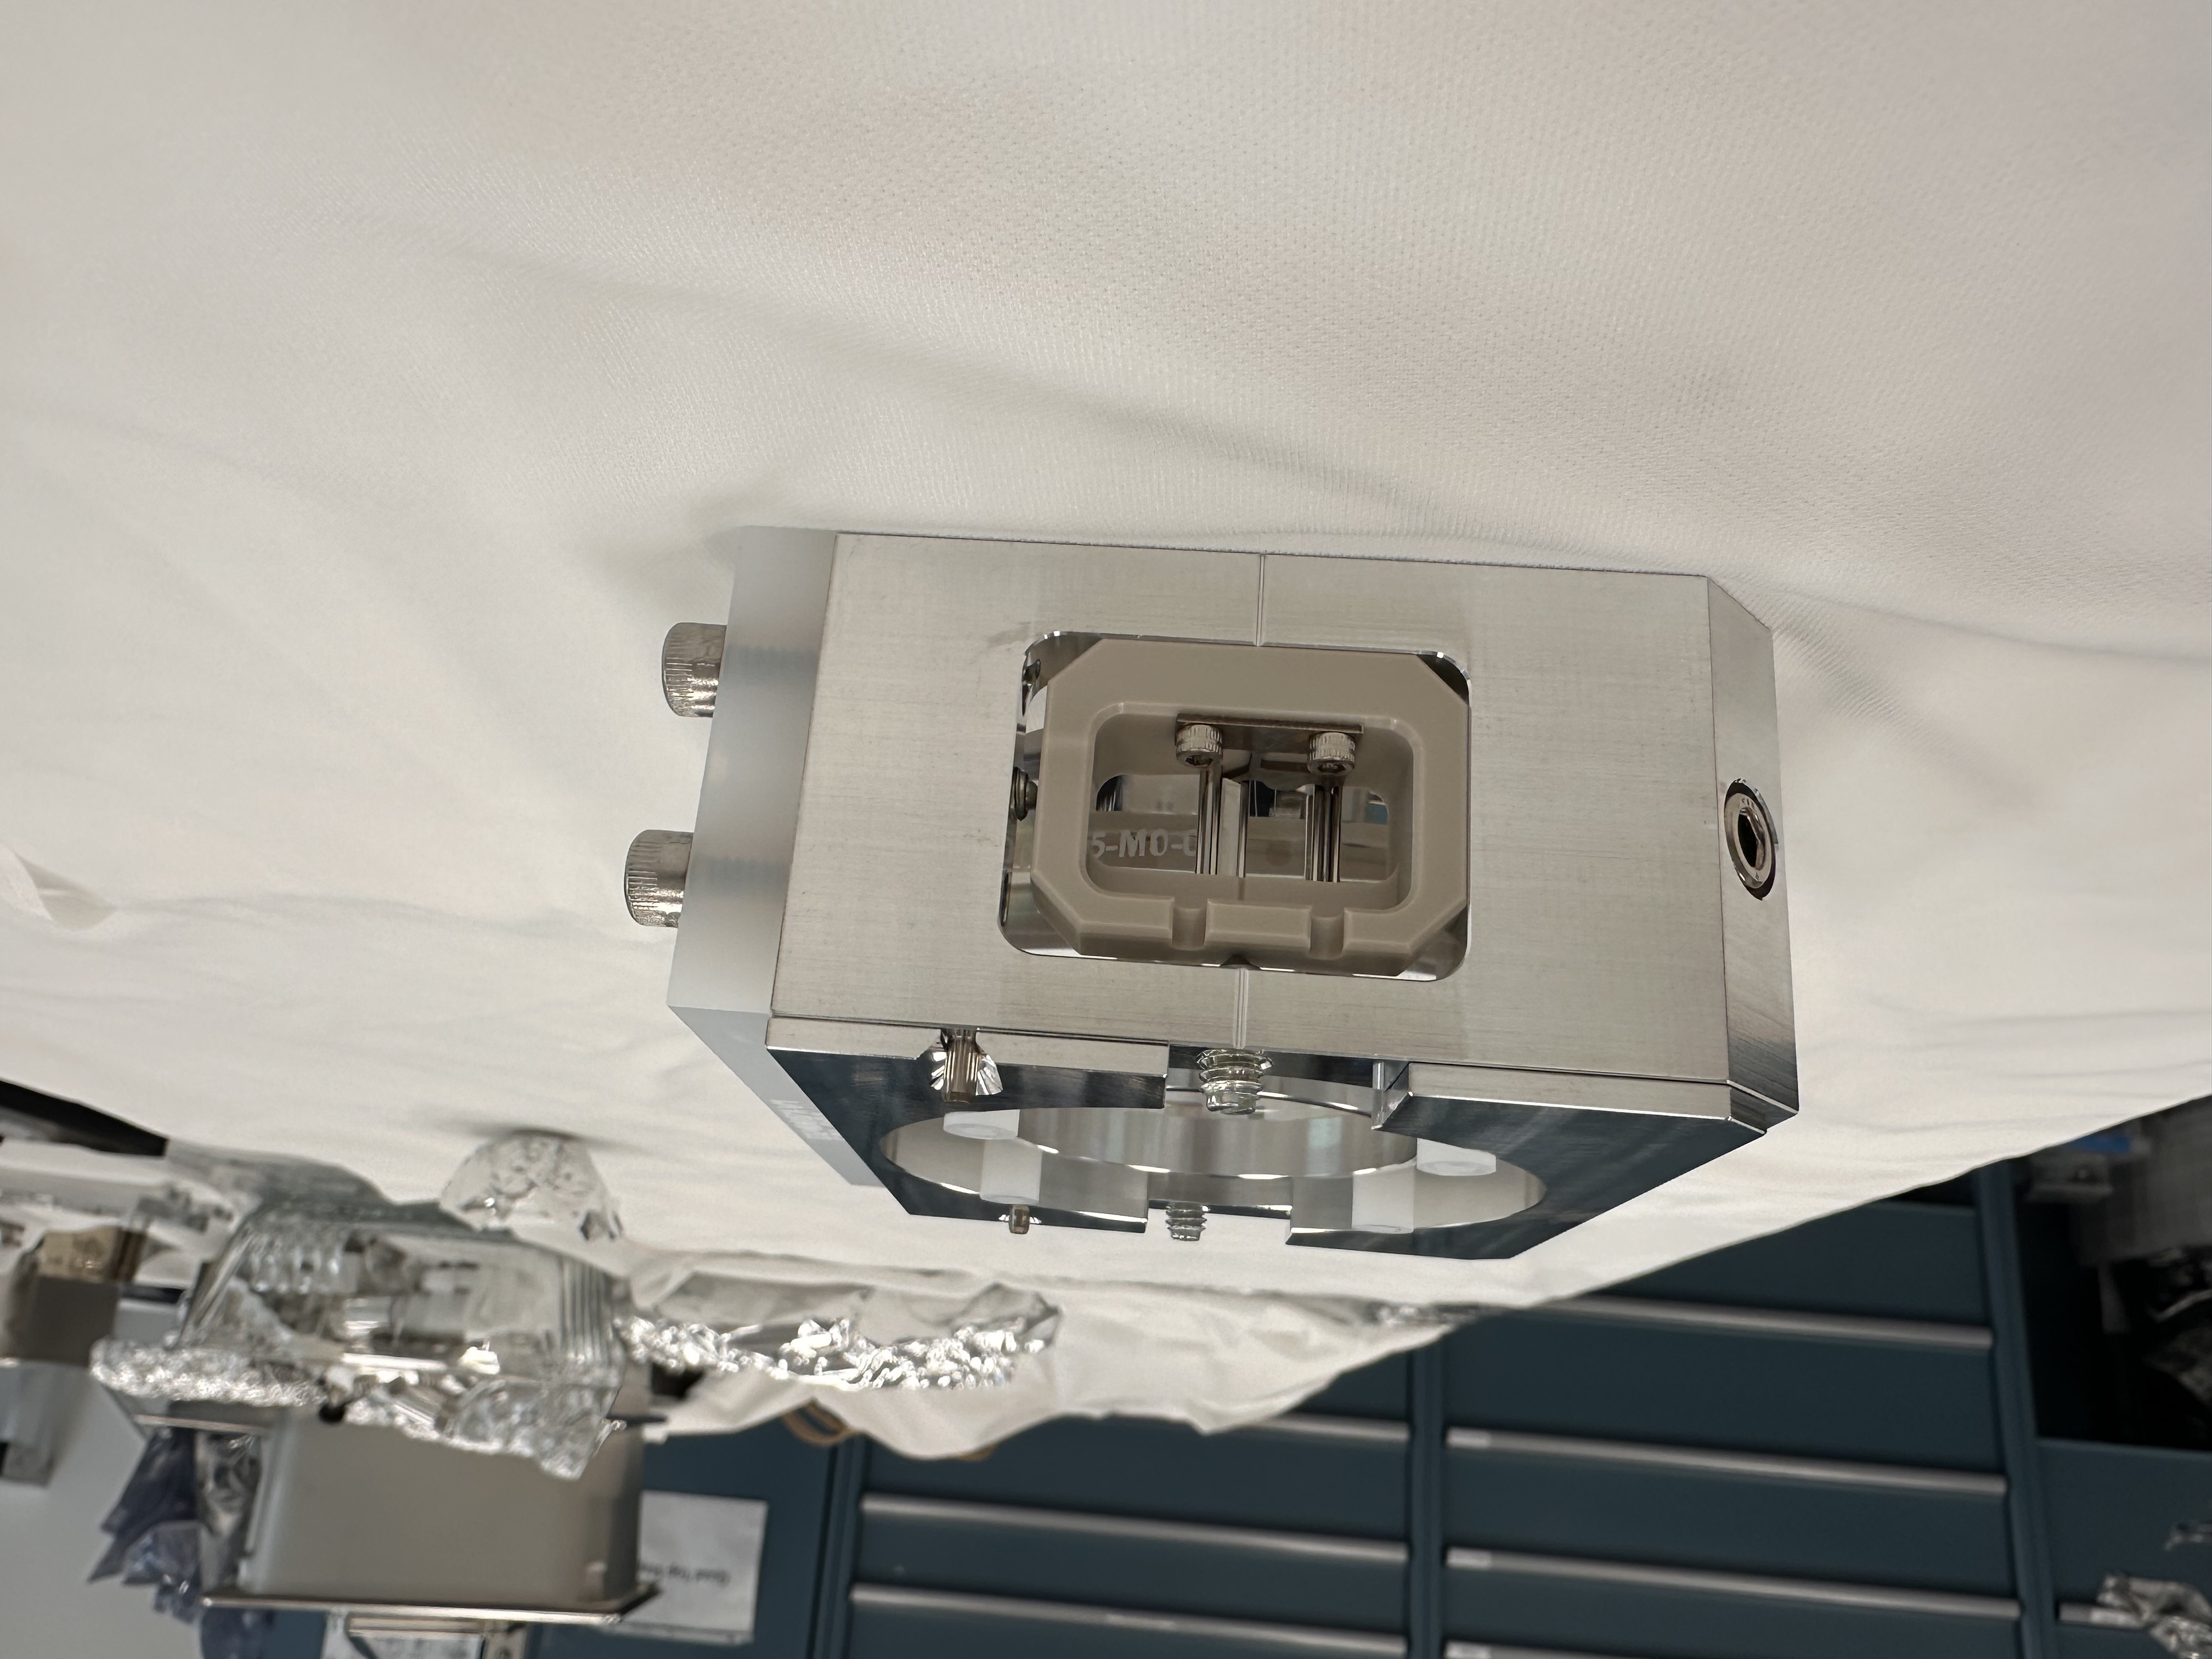
Some dog clamps in the REFL path as well as the cable bracket for PM1 were relocated to accomodate. 1st and 2nd picture are "before" photo. 3rd one is after PM1 cable bracket relocation but before installing the stiffener. There are also three "after" photos showing how things look on the table.
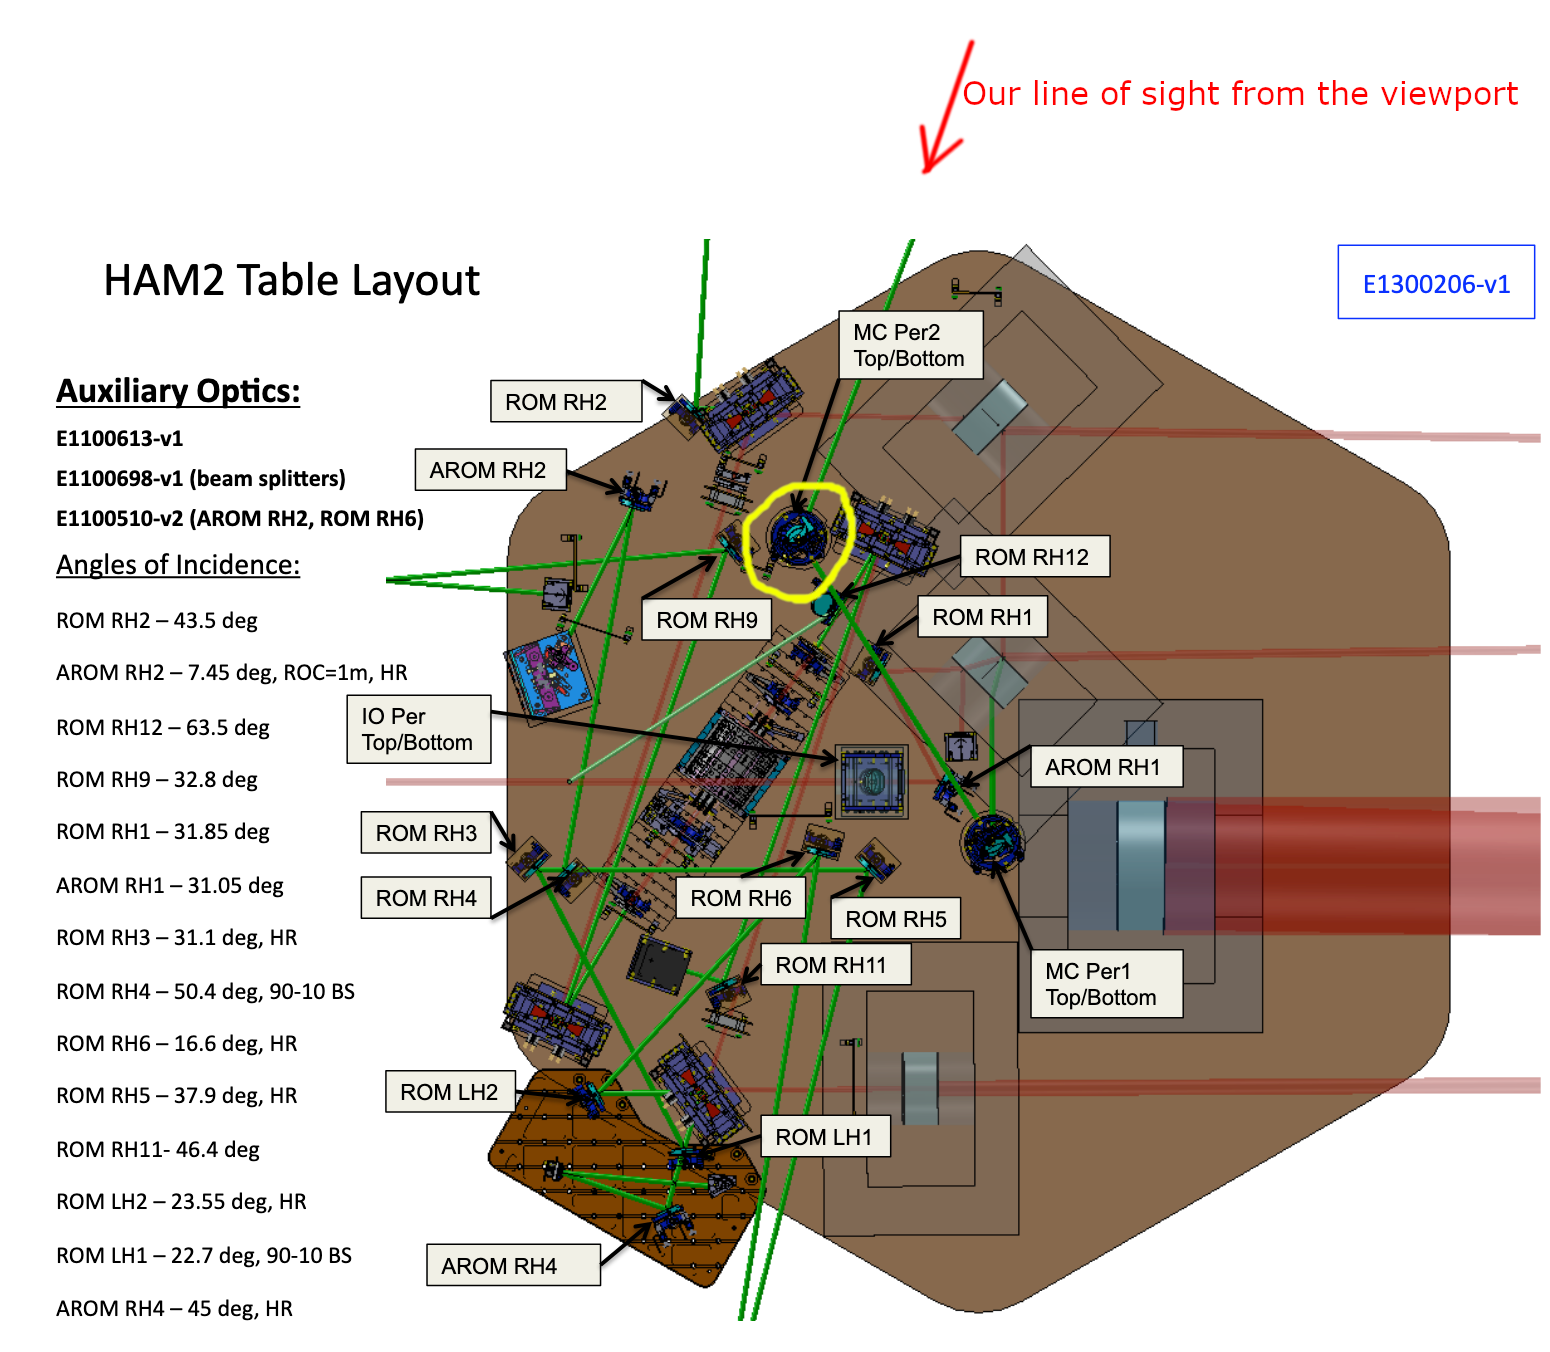
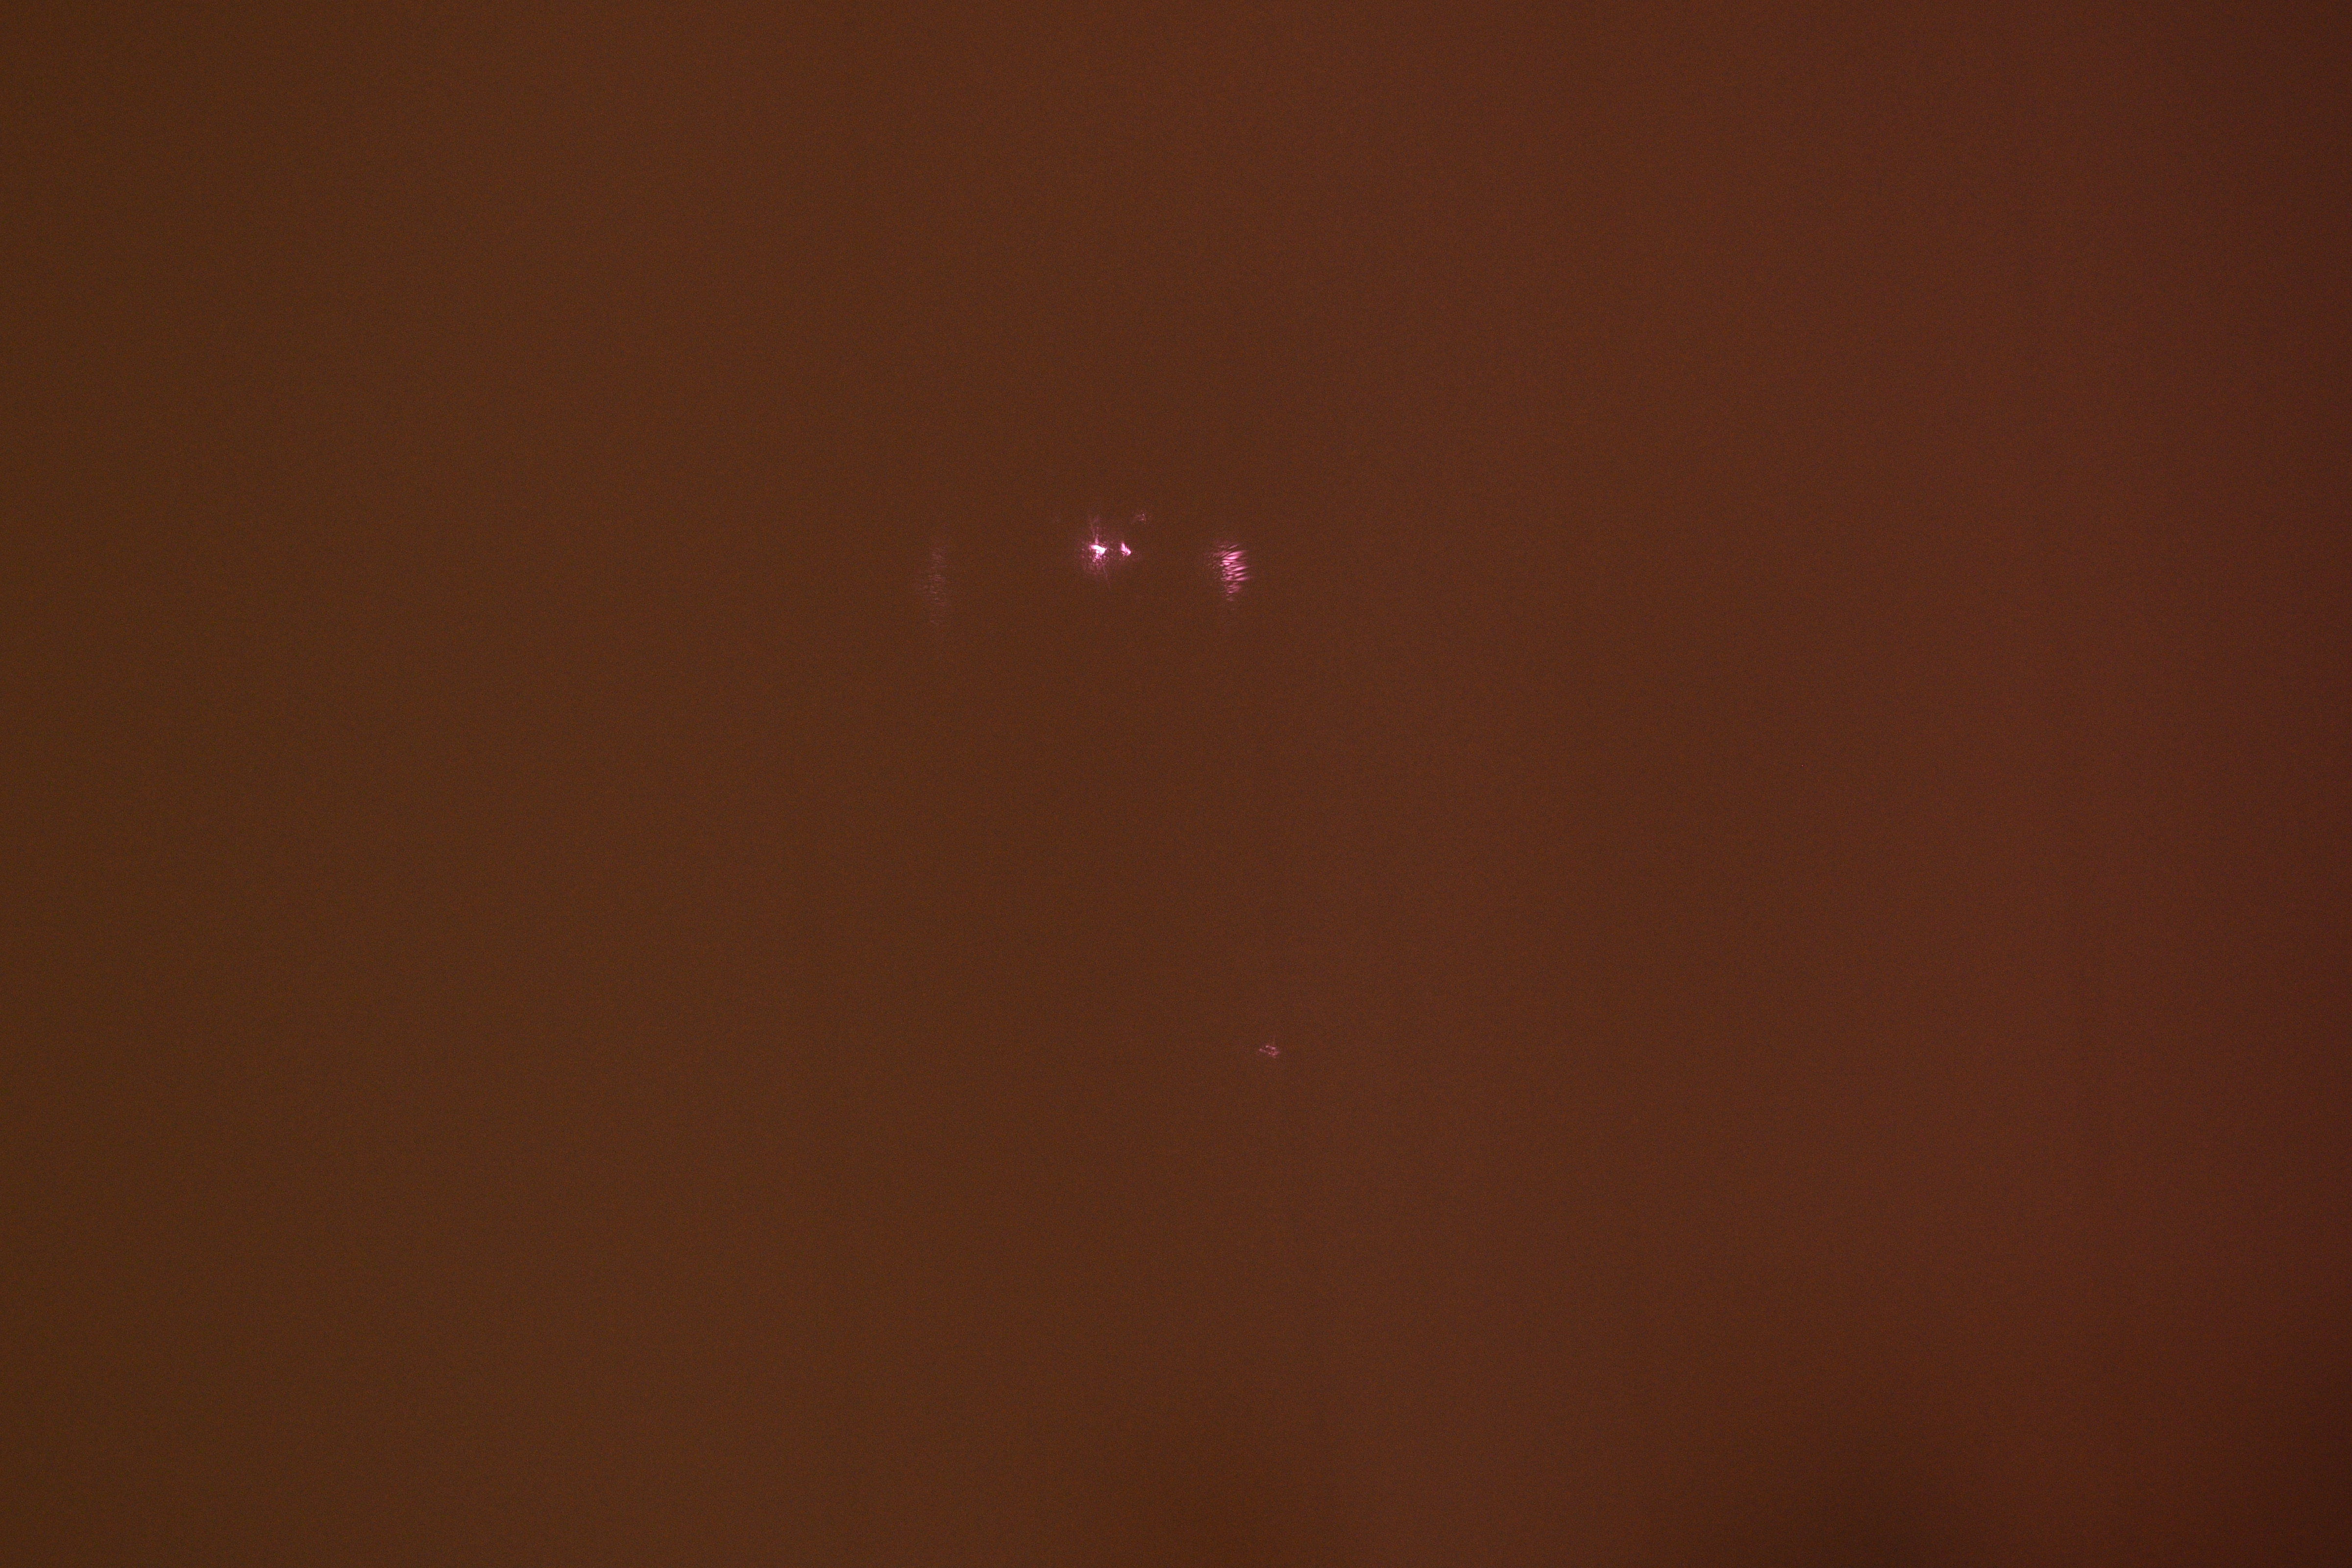
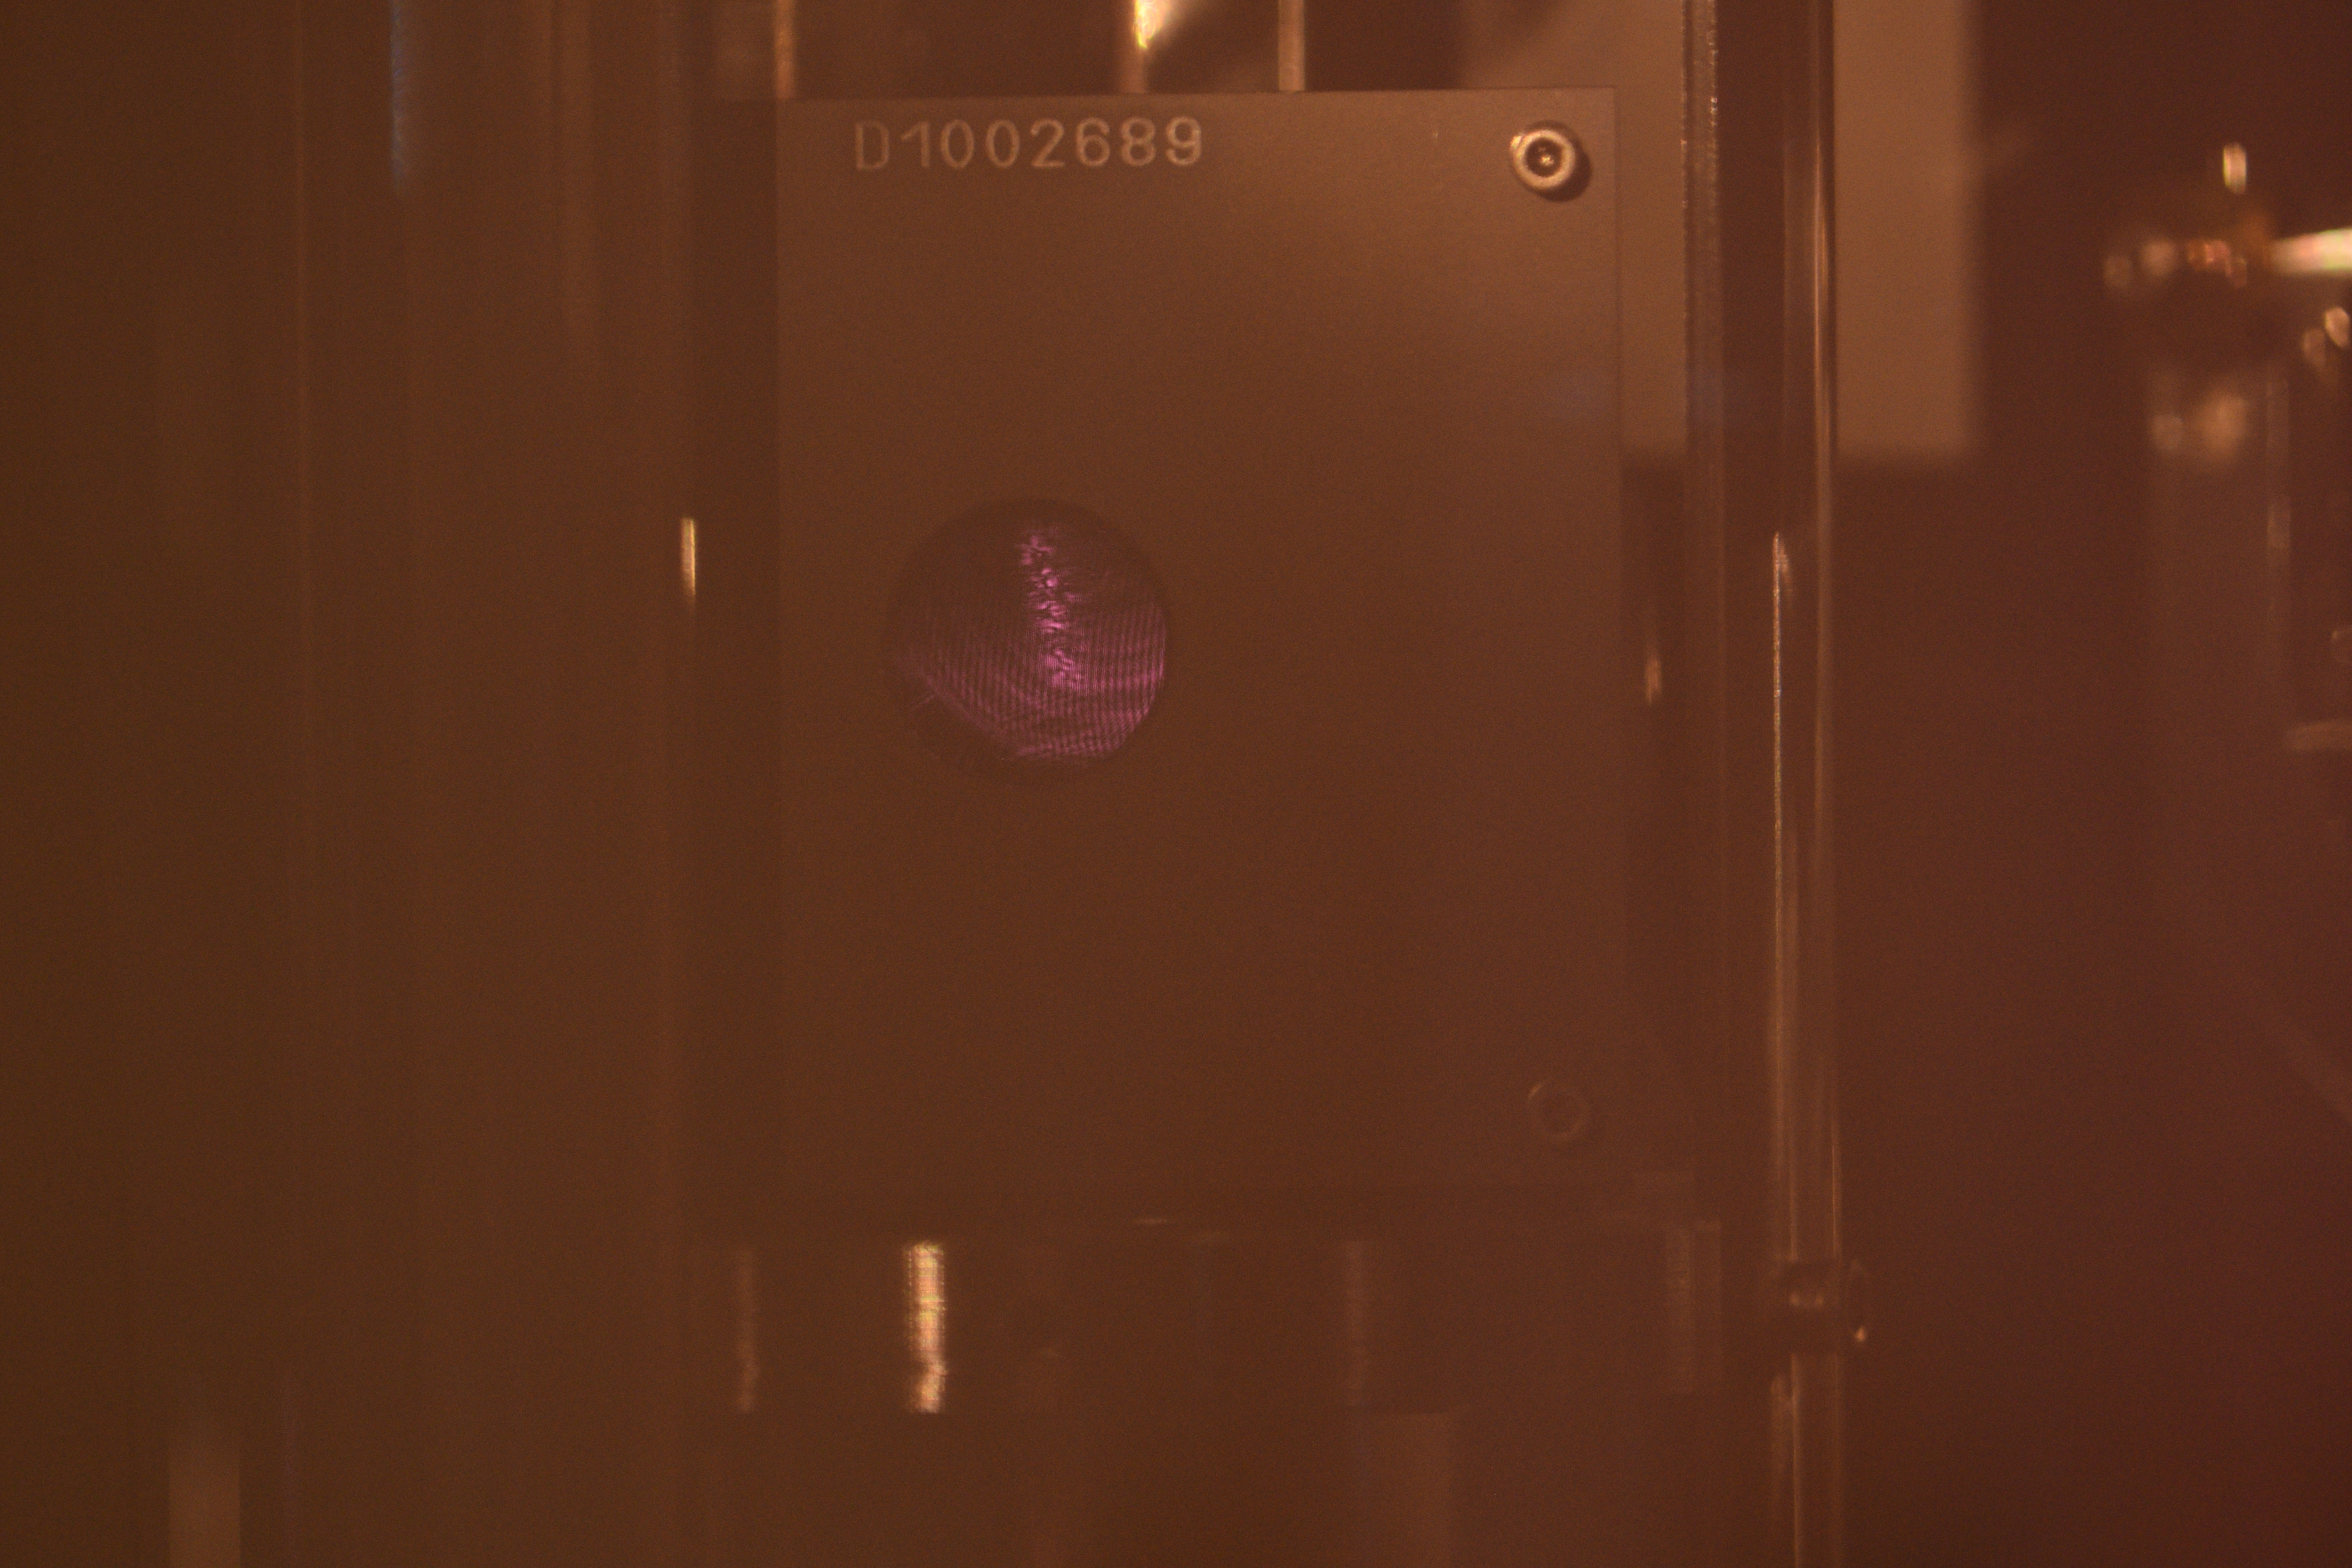
POP beam clearance:
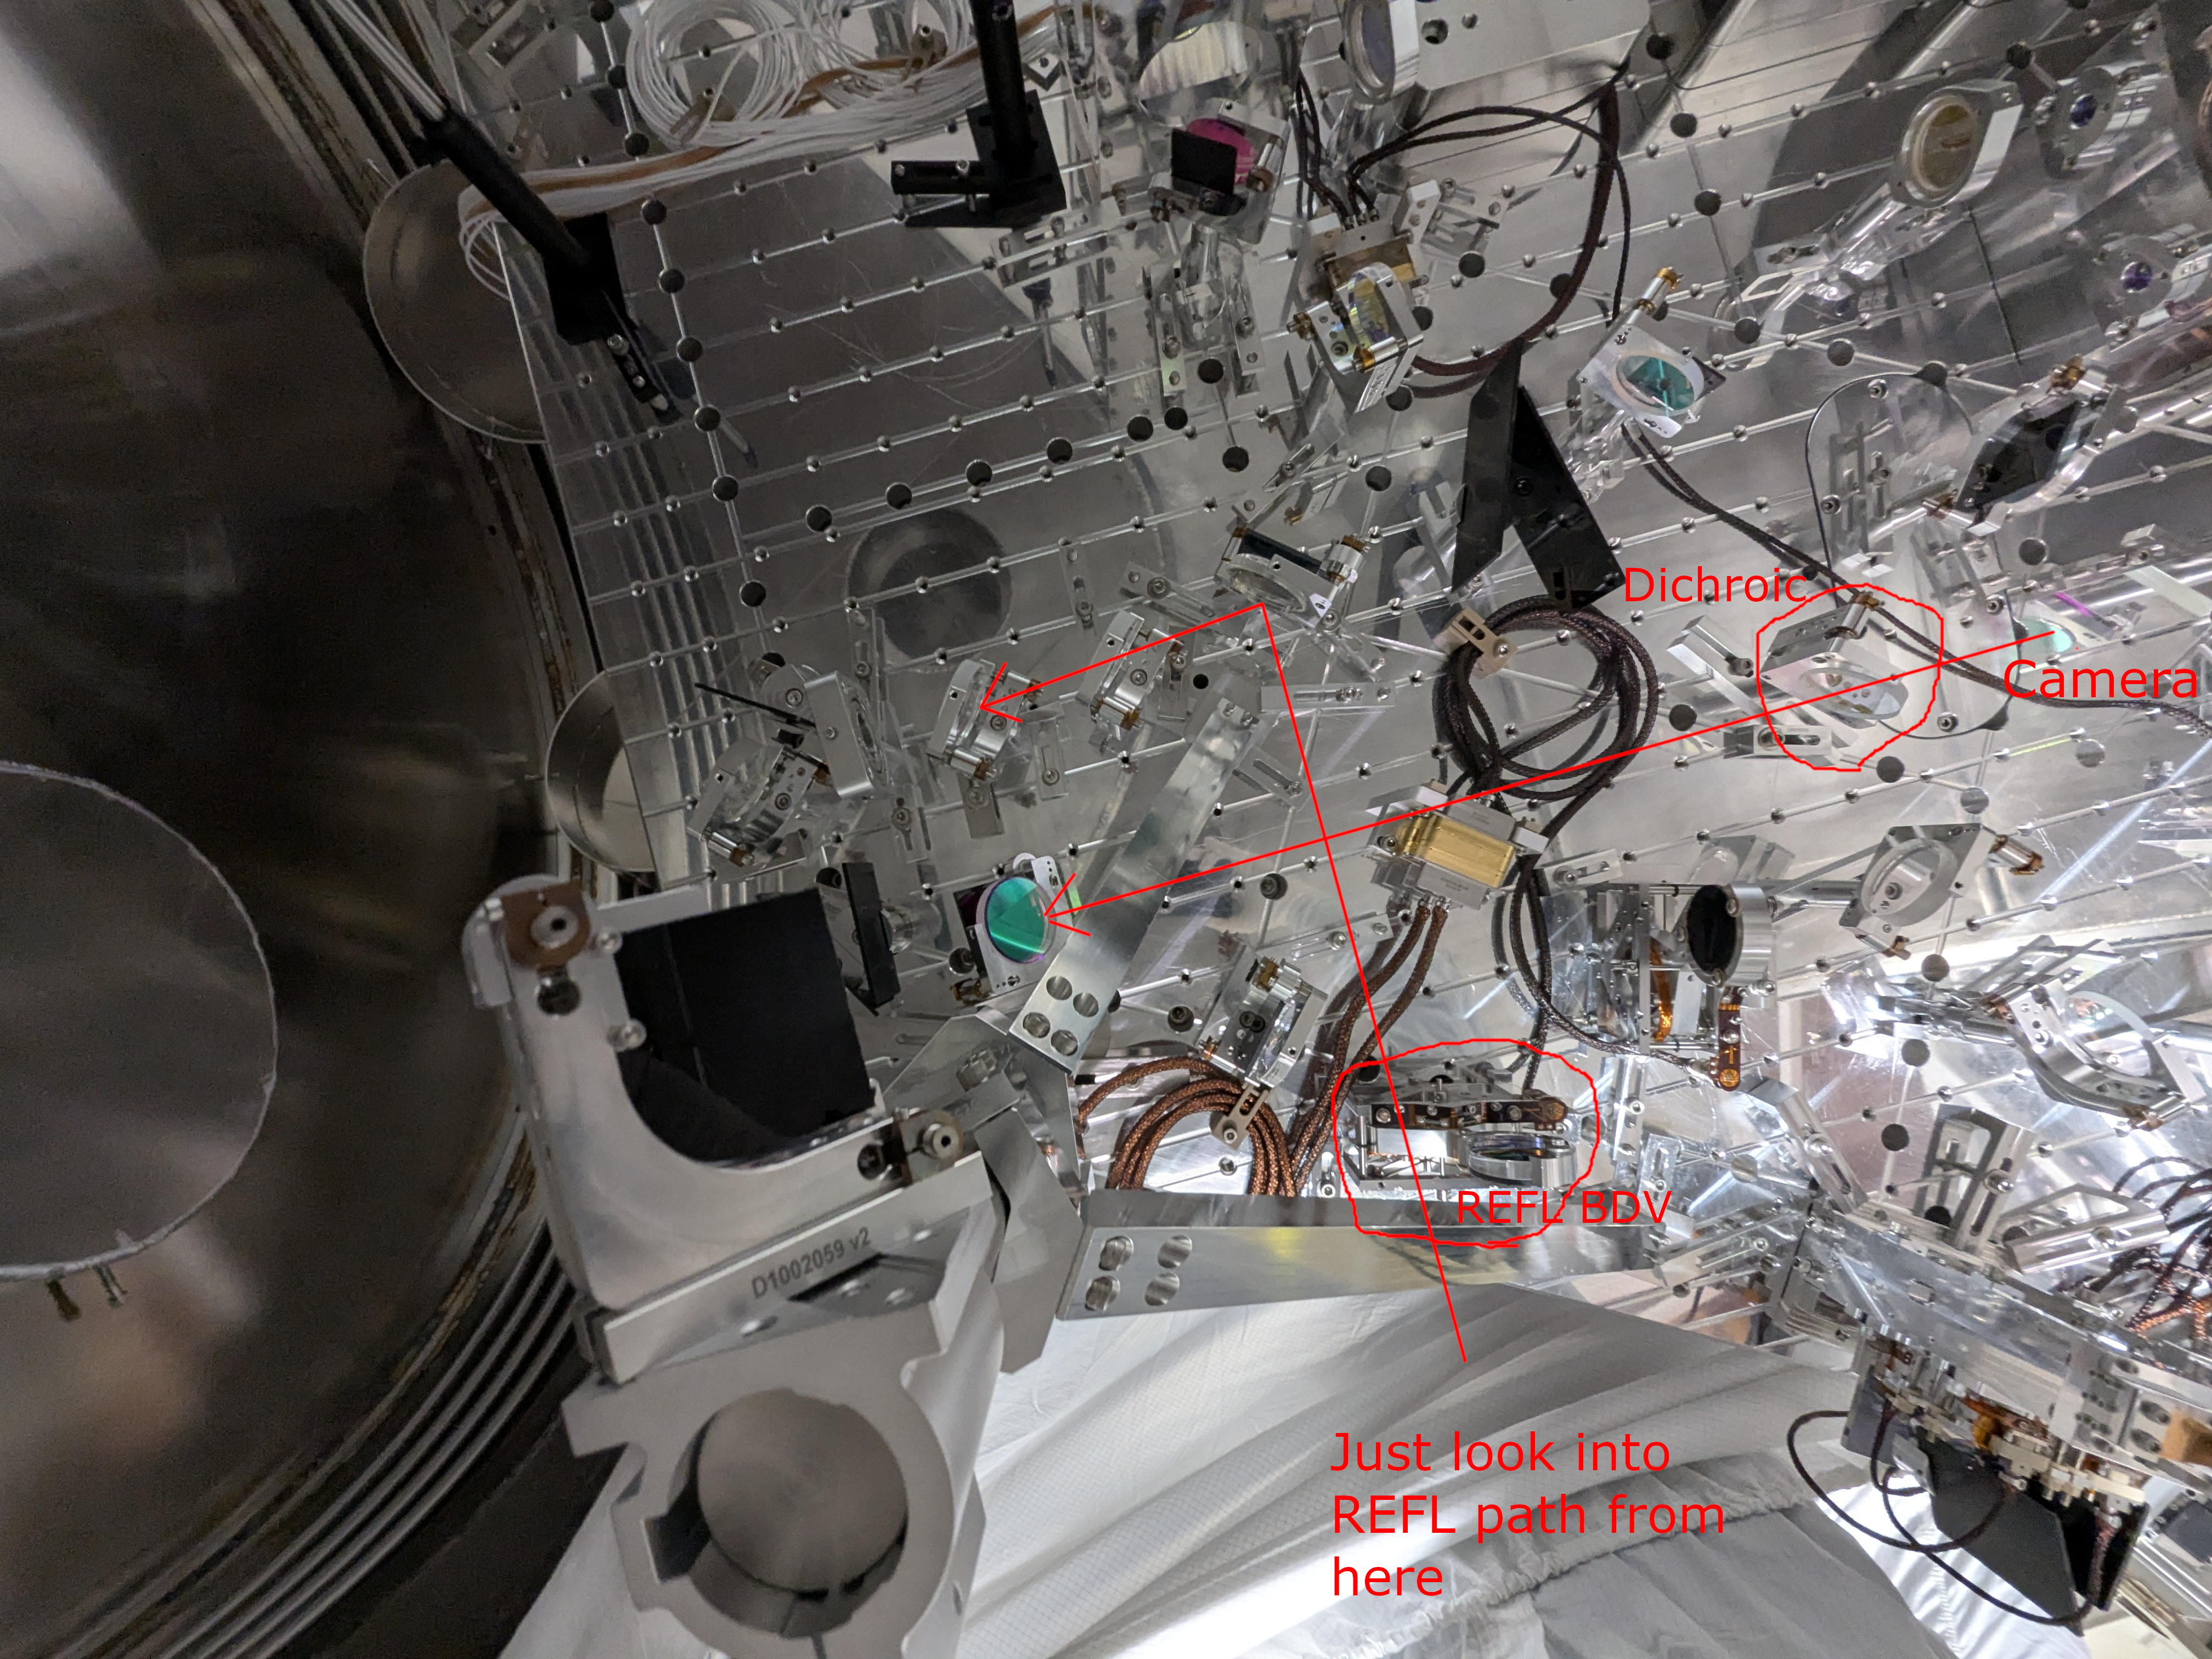
I took the picture of the bottom periscope mirror through dichroic (HR for IR, transmission for green) to see the beam clearance. In the first such photo (POP_beam_clearance.jpg), the camera is close to the center of the dichroic and the short stiffener beam is close to the edge of the optic but not occulting the mirror, so we're OK. Just to make sure that we're absolutely safe, I moved the camera closer to the -Y edge (right on the picture) of the dichroic (POP_beam_clearance_extreme.jpg) and it still looks OK.
If it's hard to understand what was done, look at the annotated photo (the last attachment After_stiffener_installed_annotated.jpg), the cellphone camera was inserted to "Camera" position.
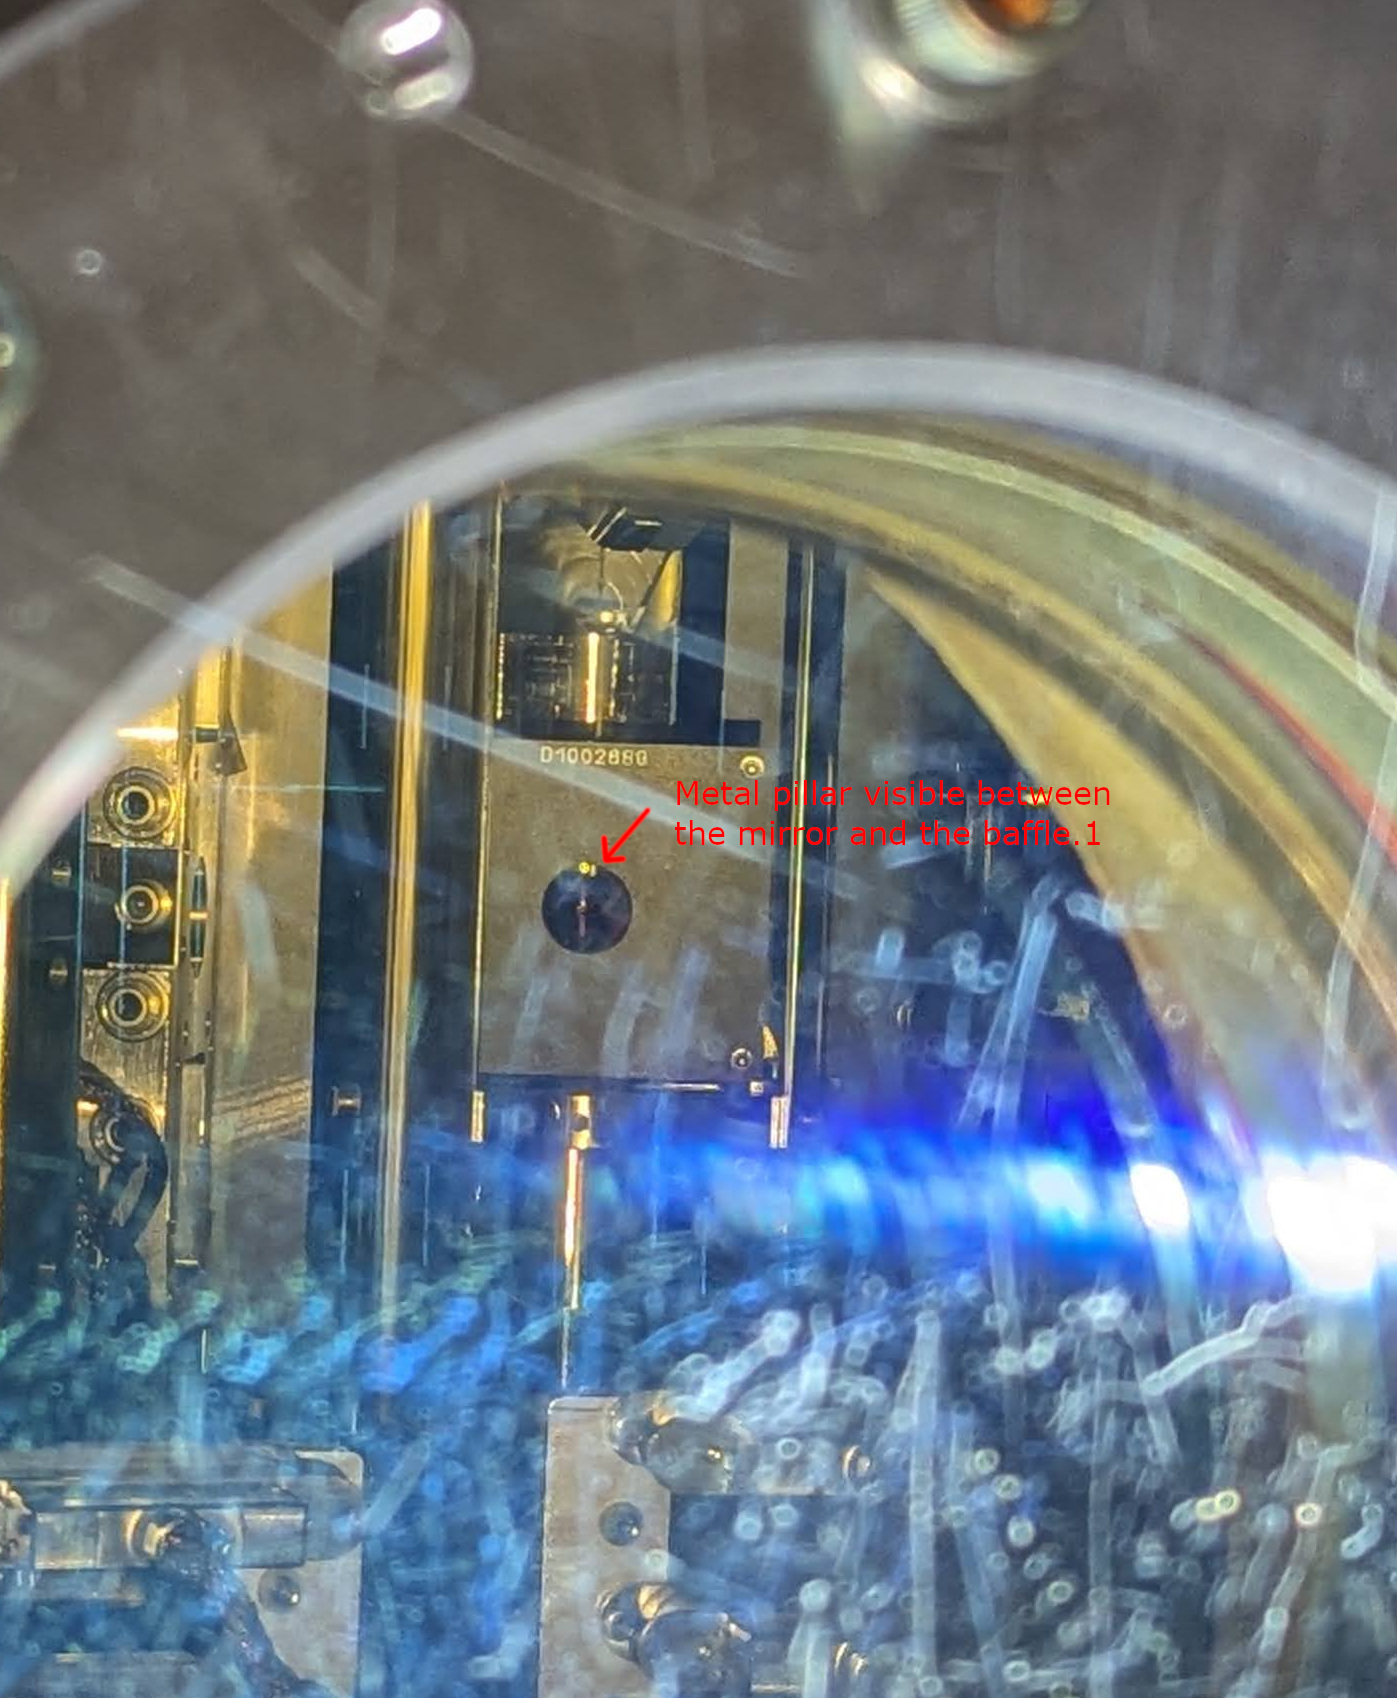
REFL beam path:
I confirmed that the long stiffener beam doesn't interfere with the motion of the REFL beam diverter. Also, when the REFL beam diverter is open, I looked into the last steering mirror for the REFL air path from the viewport position to make sure that the short stiffener beam won't occult the REFL path.
Some hiccups:
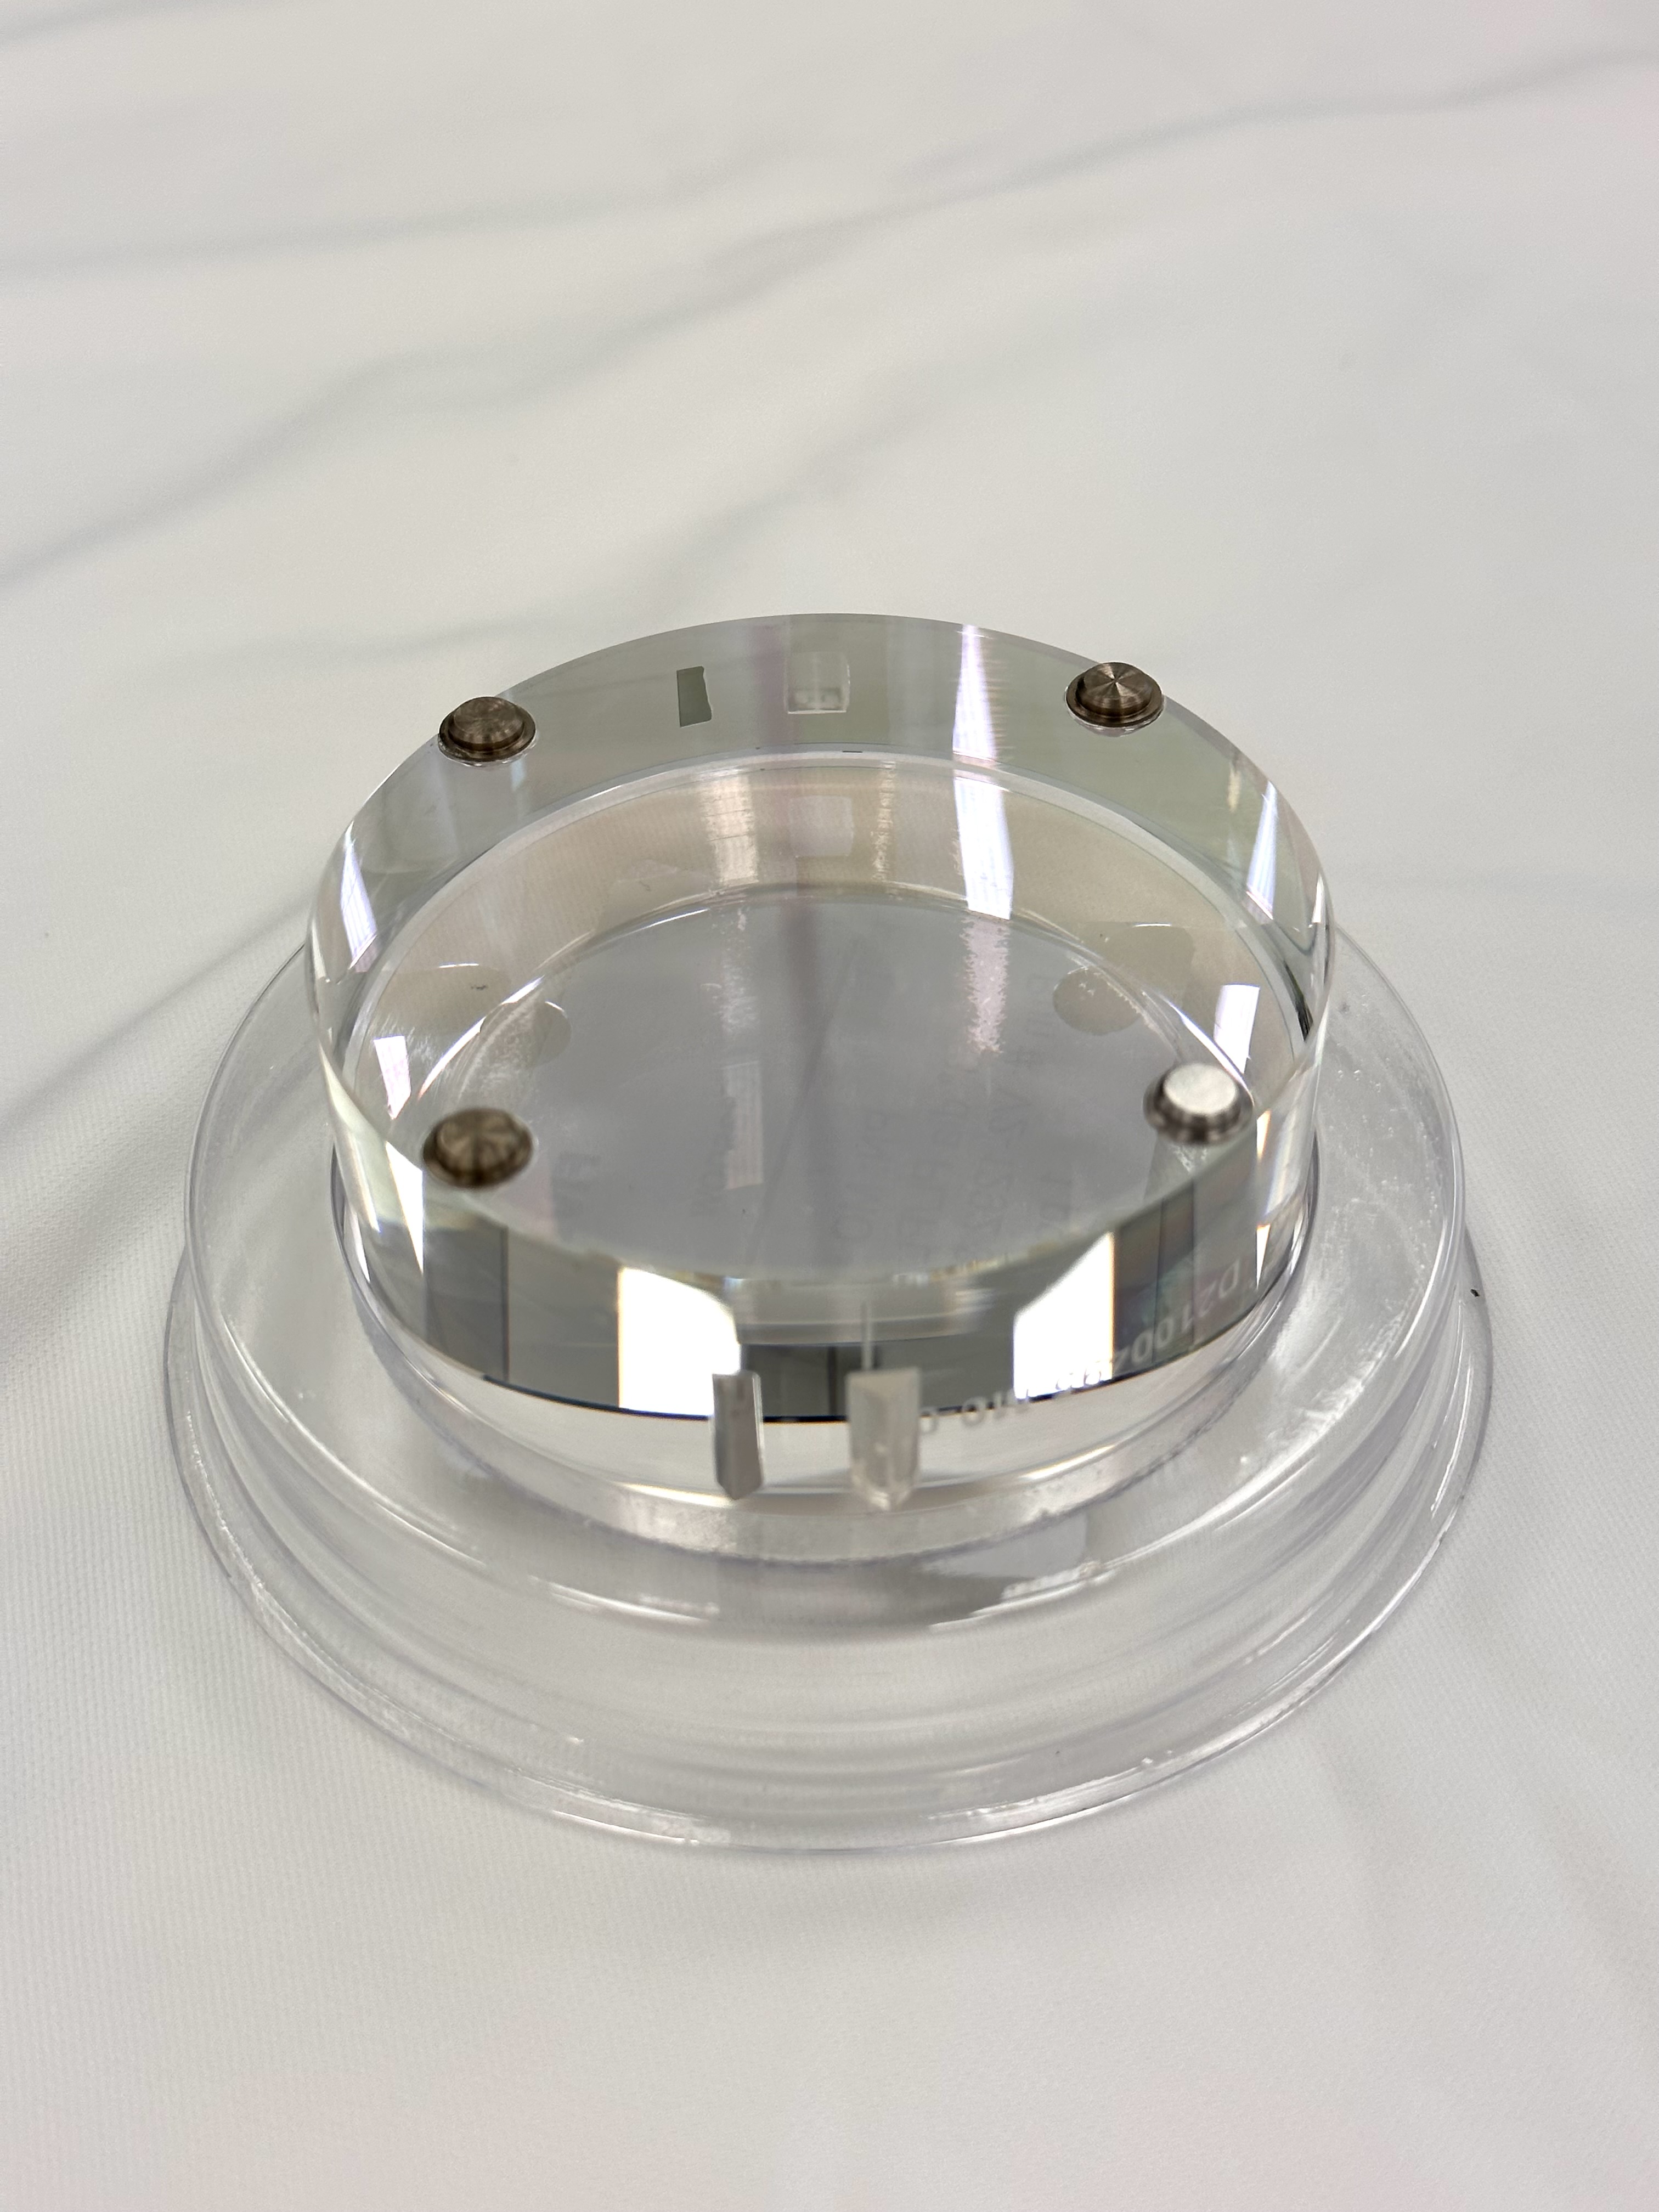
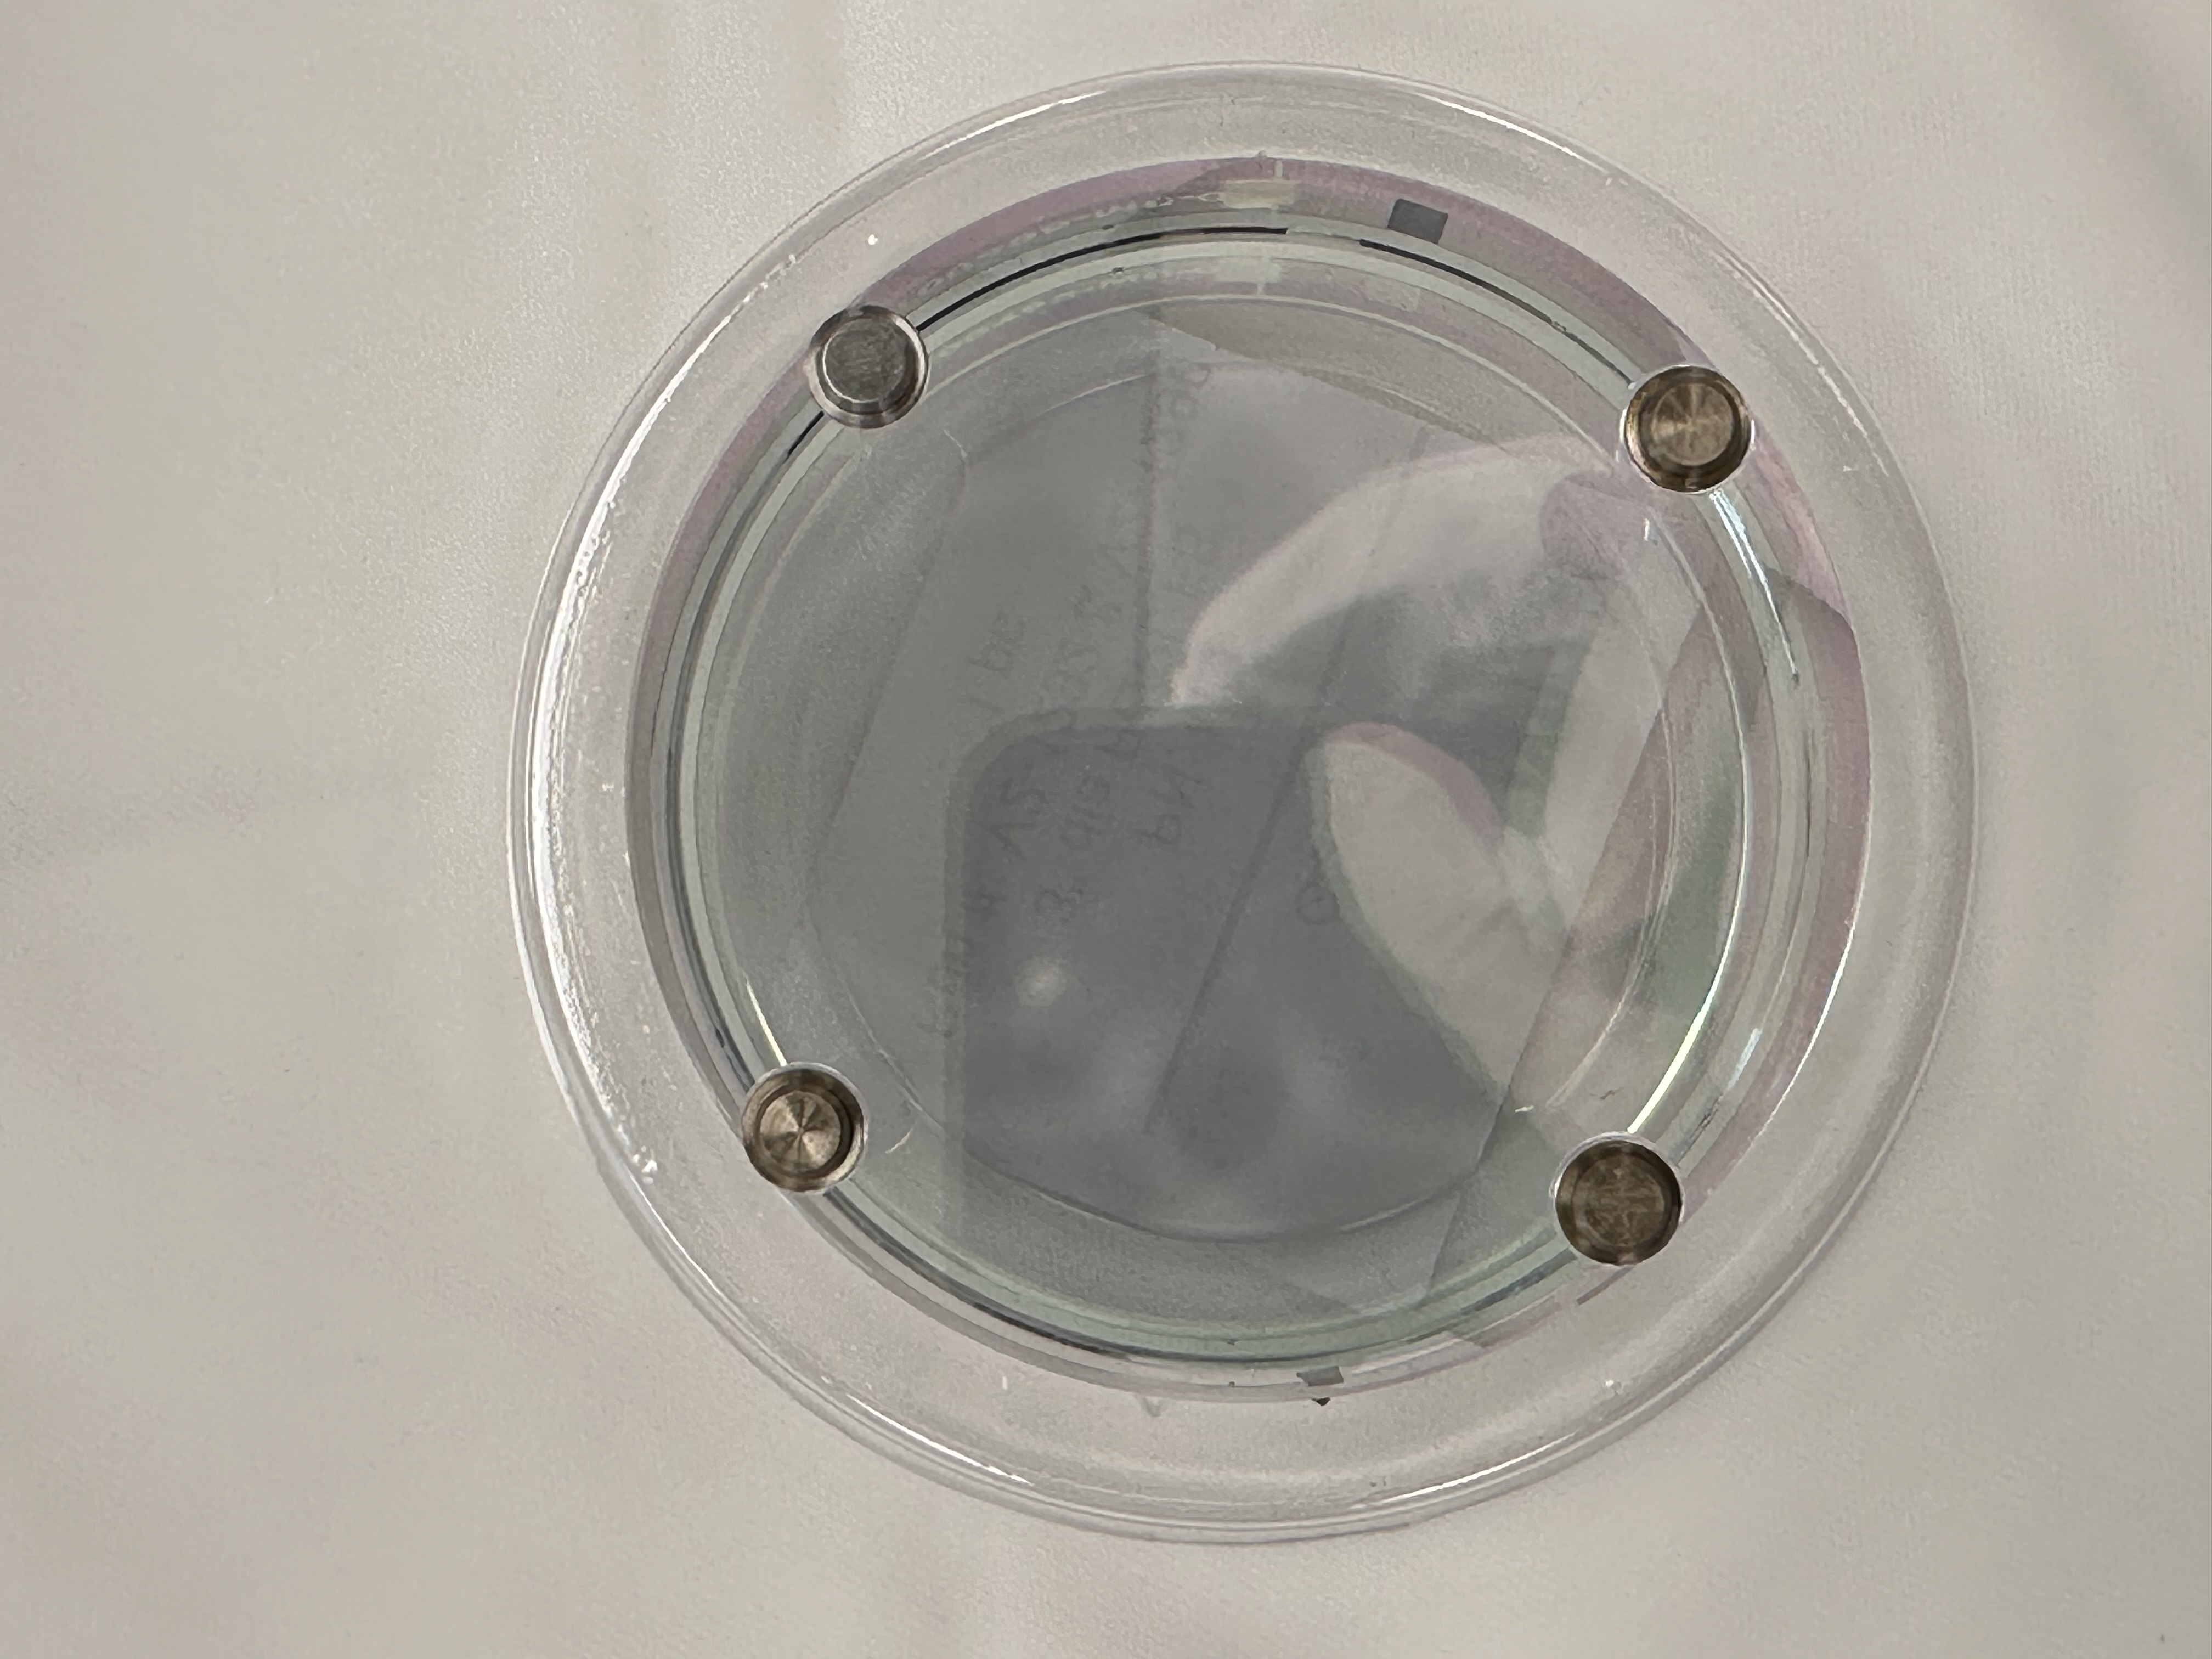
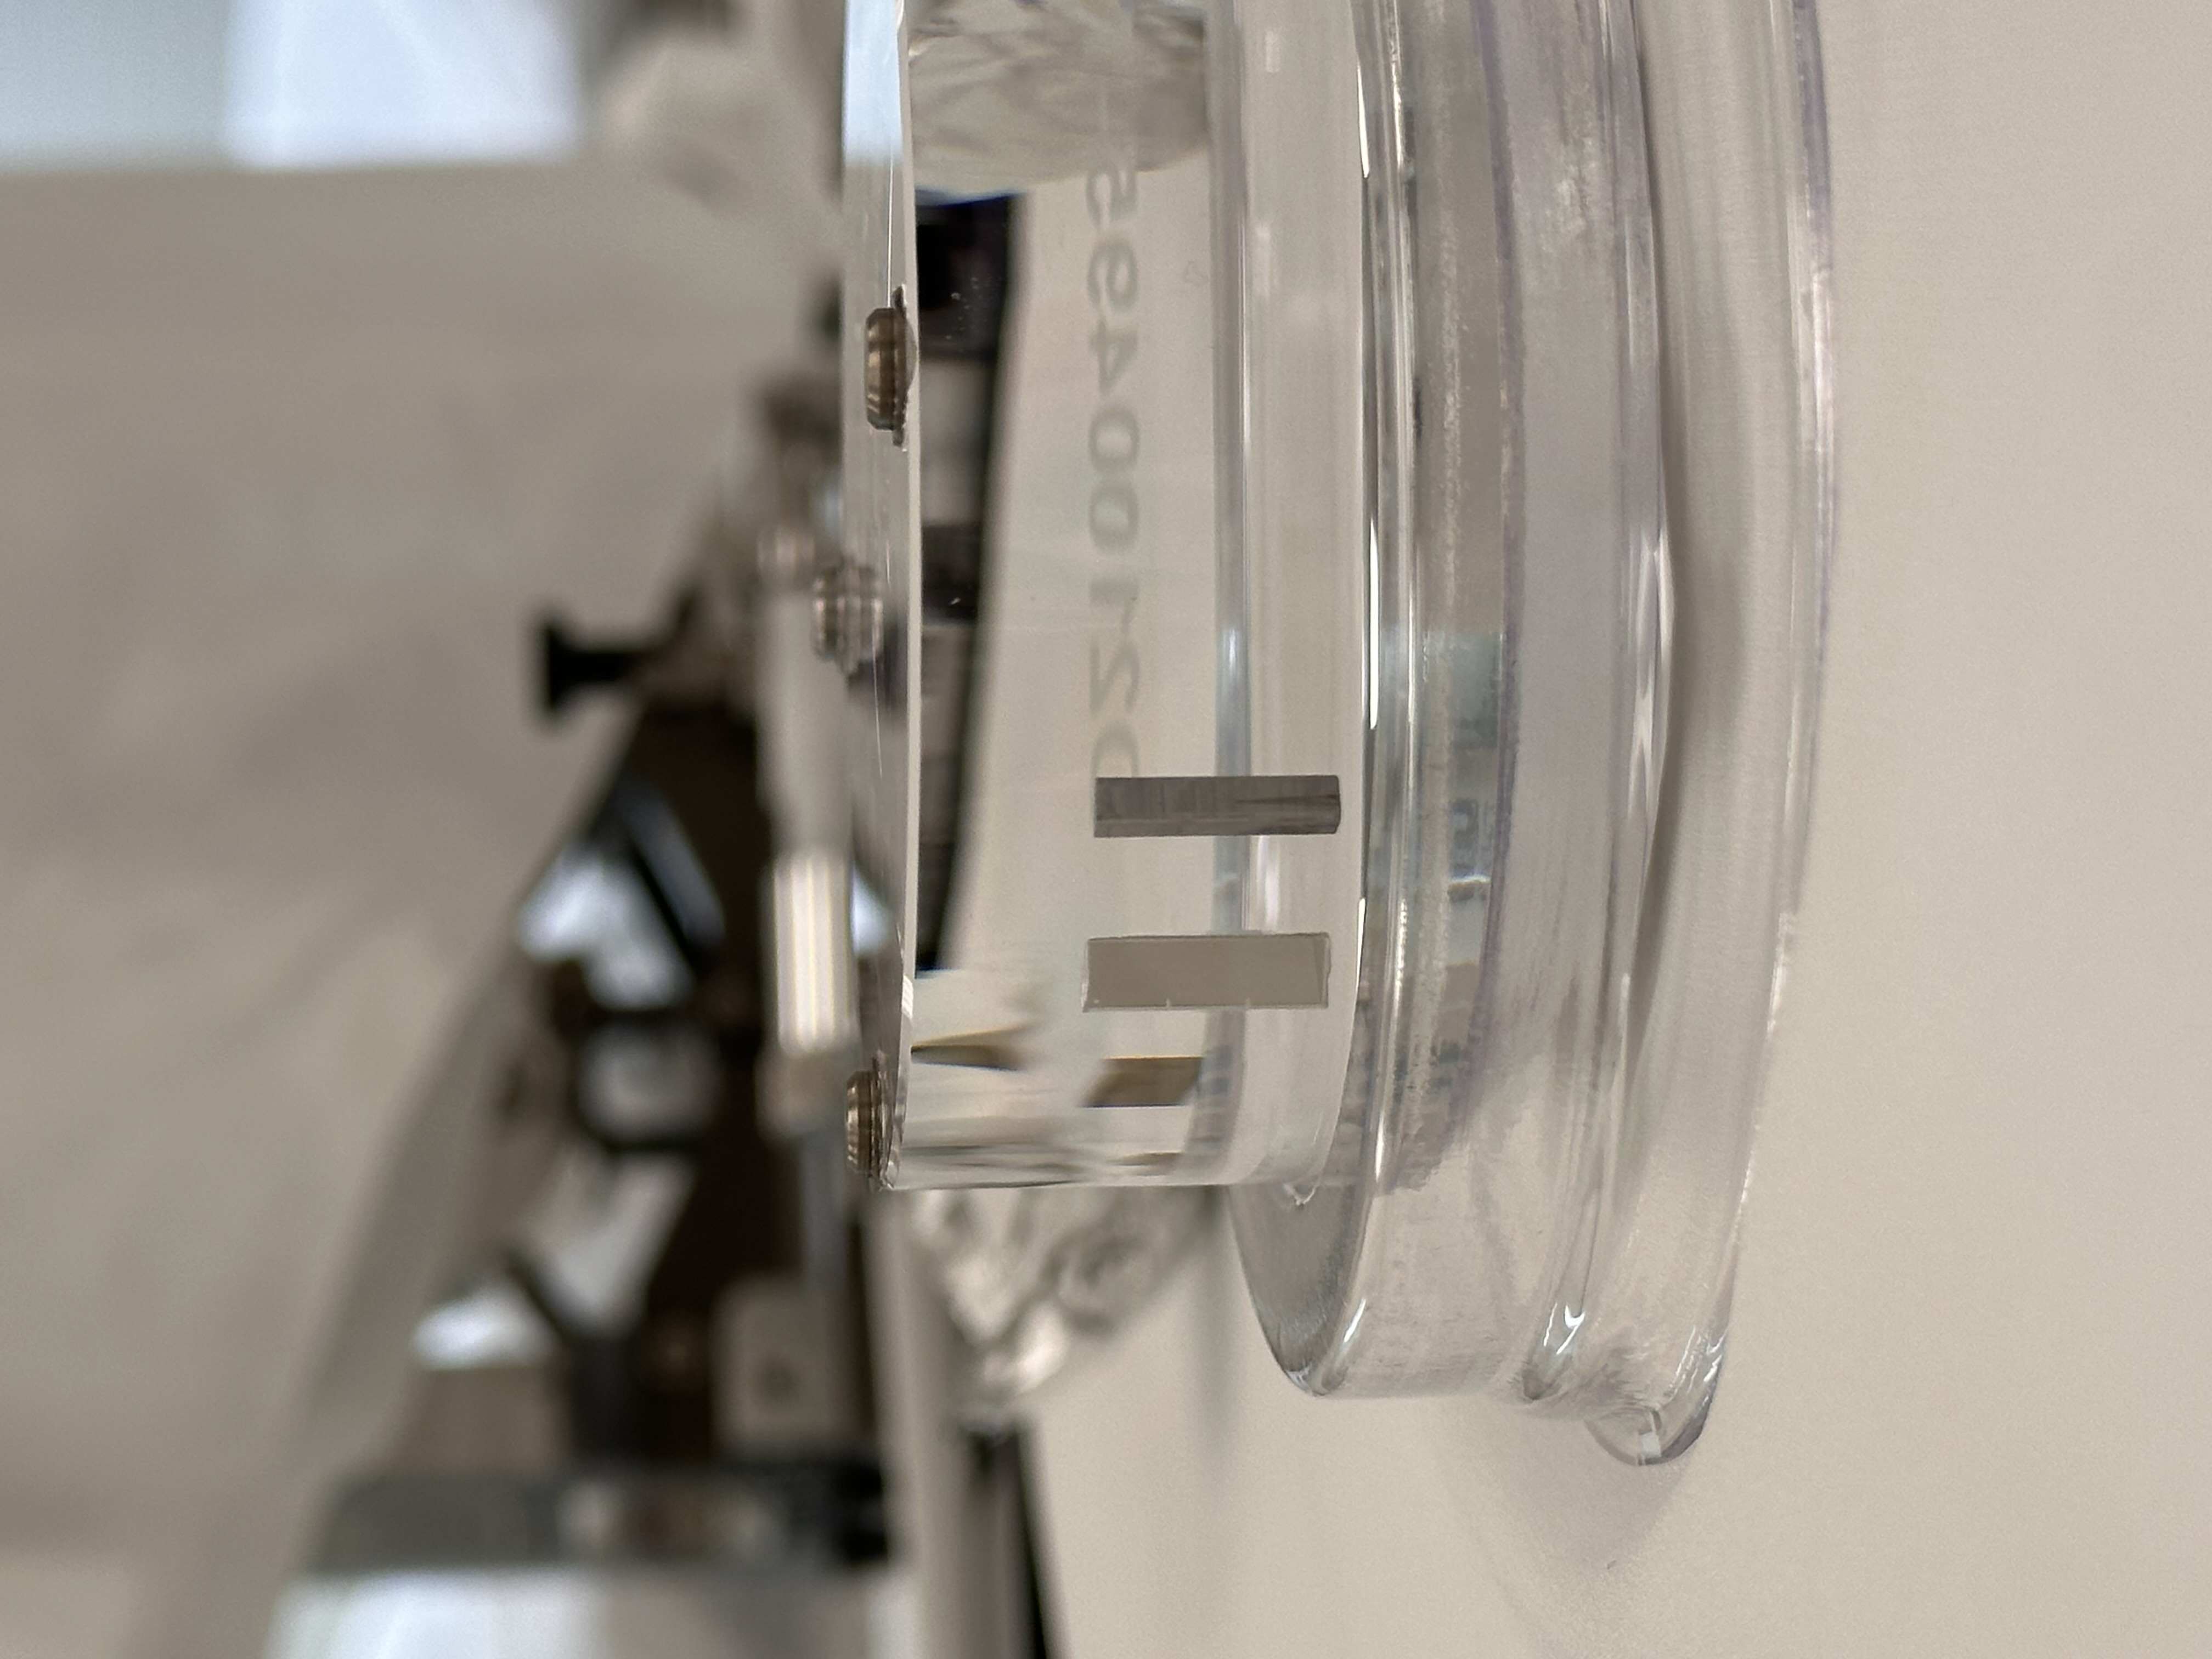
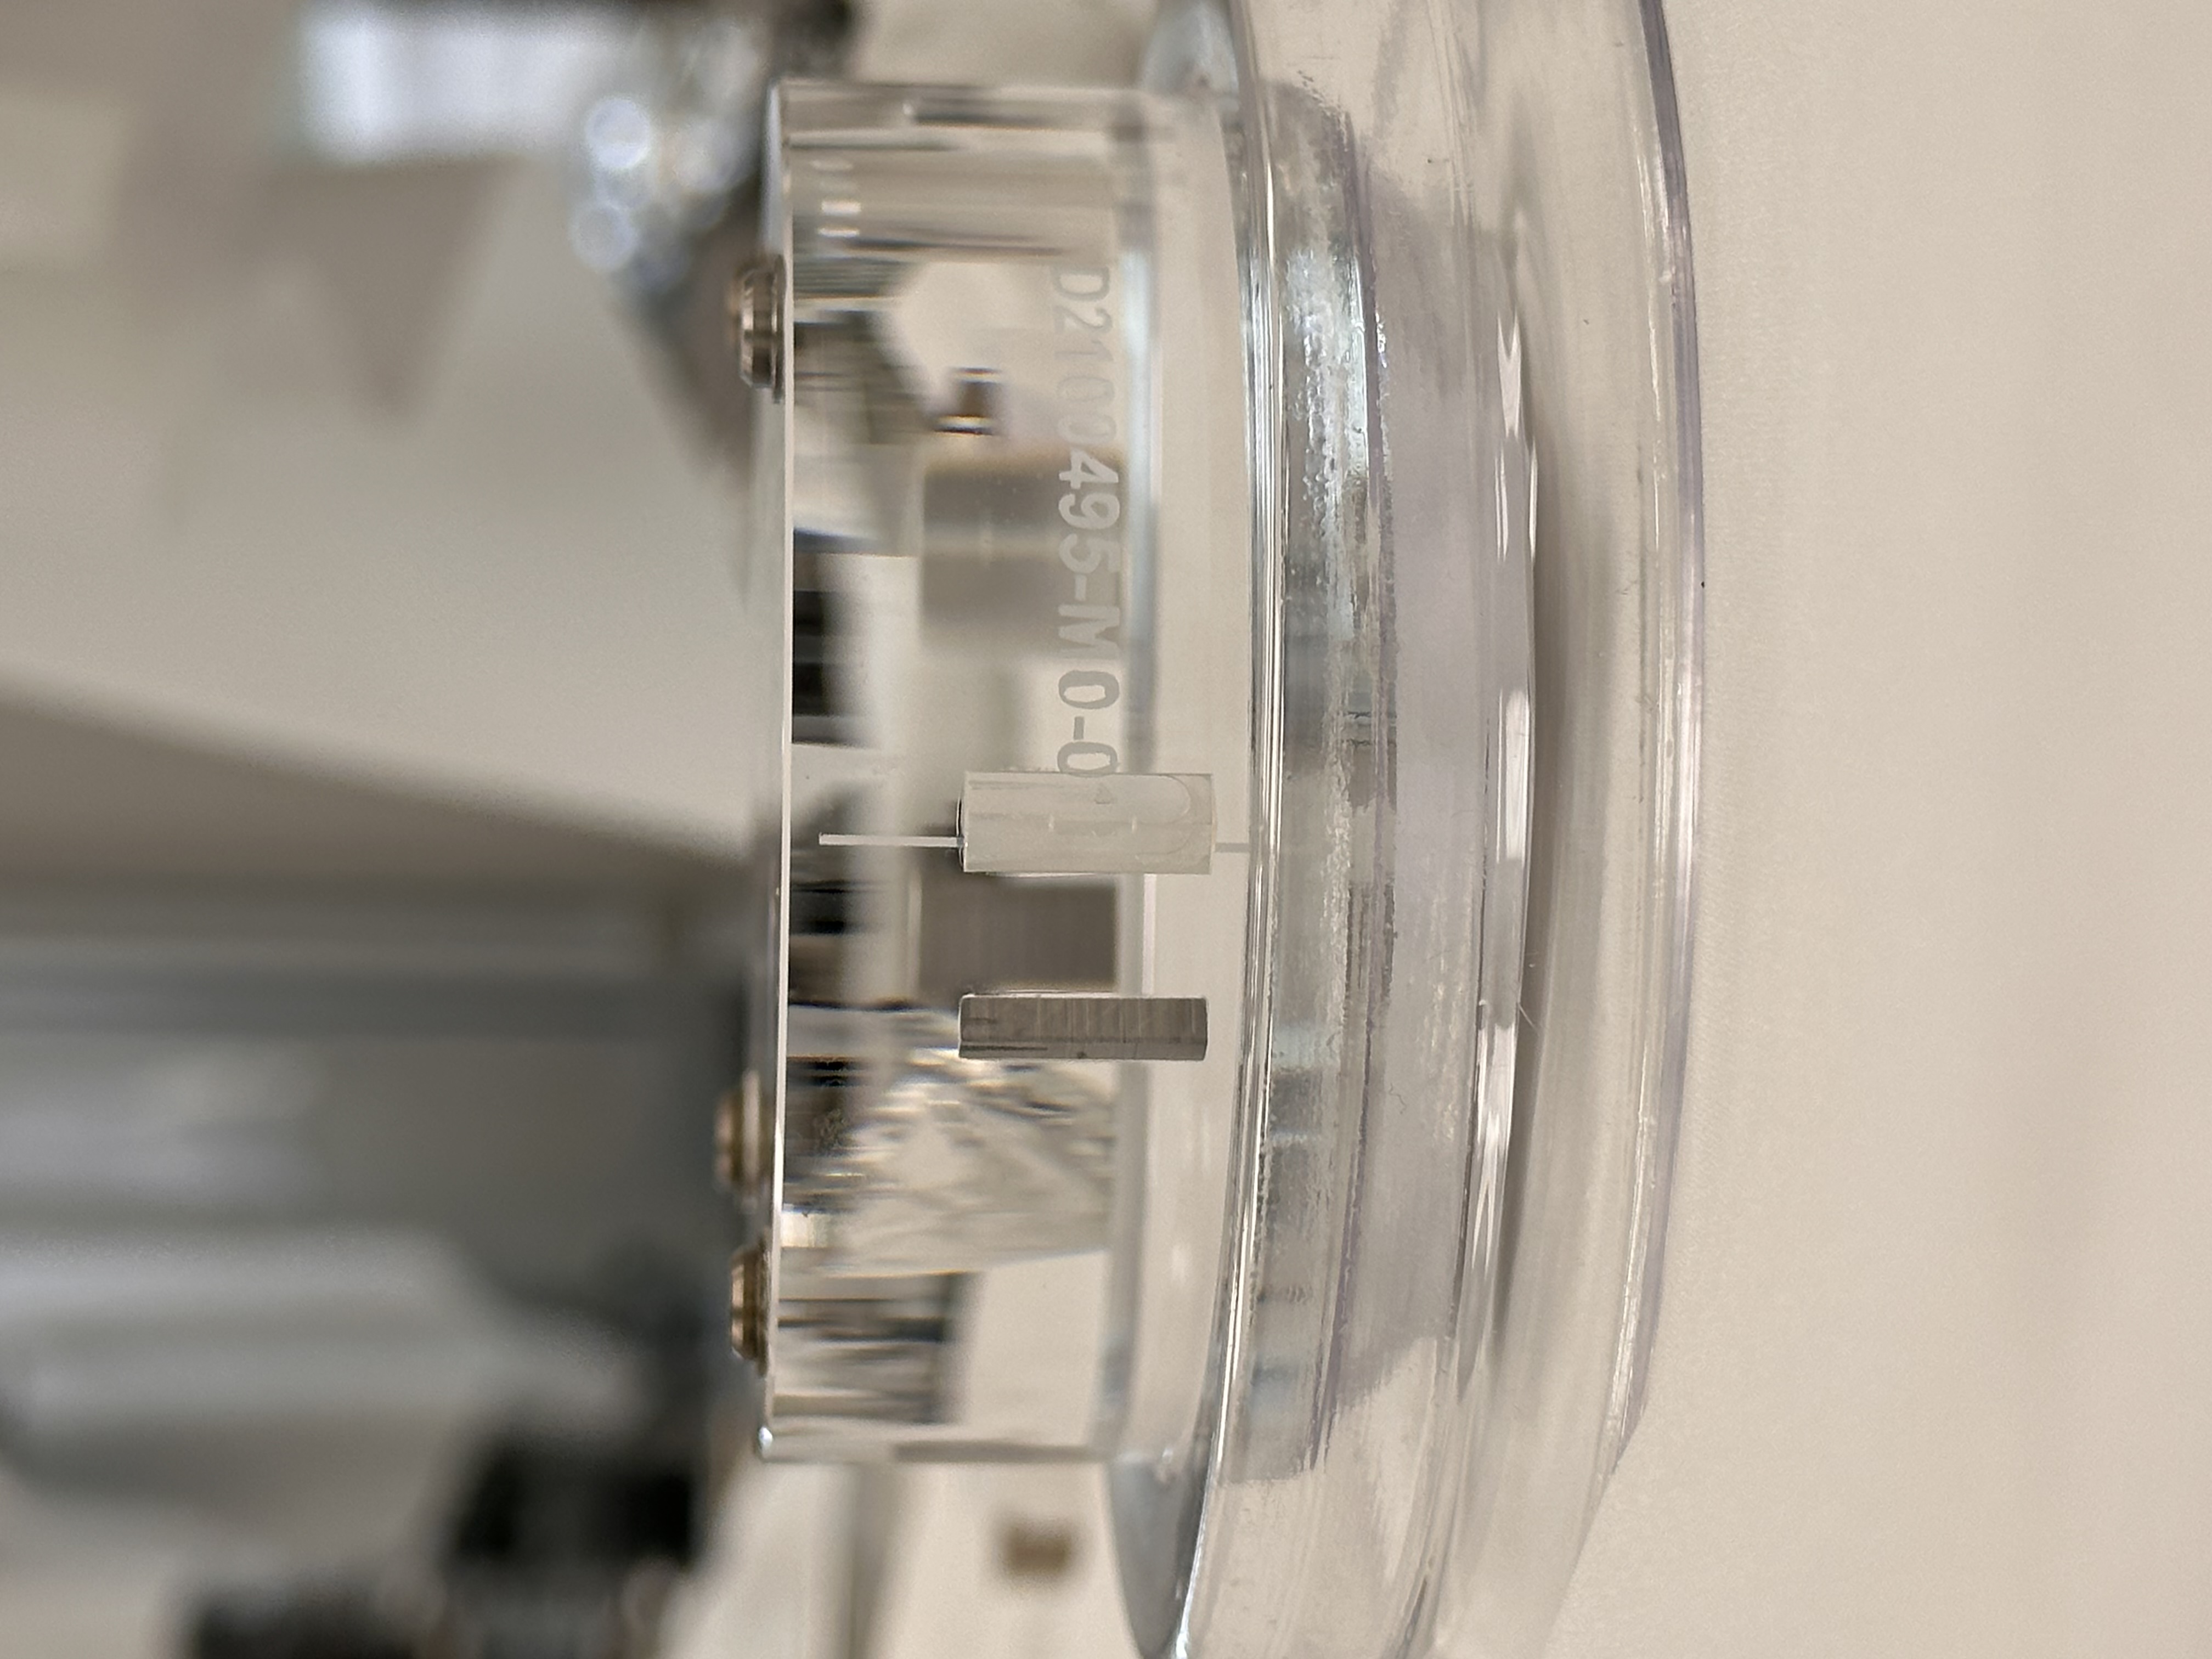
We used D2500433 -11 variant S/N 4 and -1 variant S/N1 even though page 11 of T2500339 suggests it should be -10 and -2 variant, respectively. We didn't have -10 variant, and -2 variant was absolutely too short.
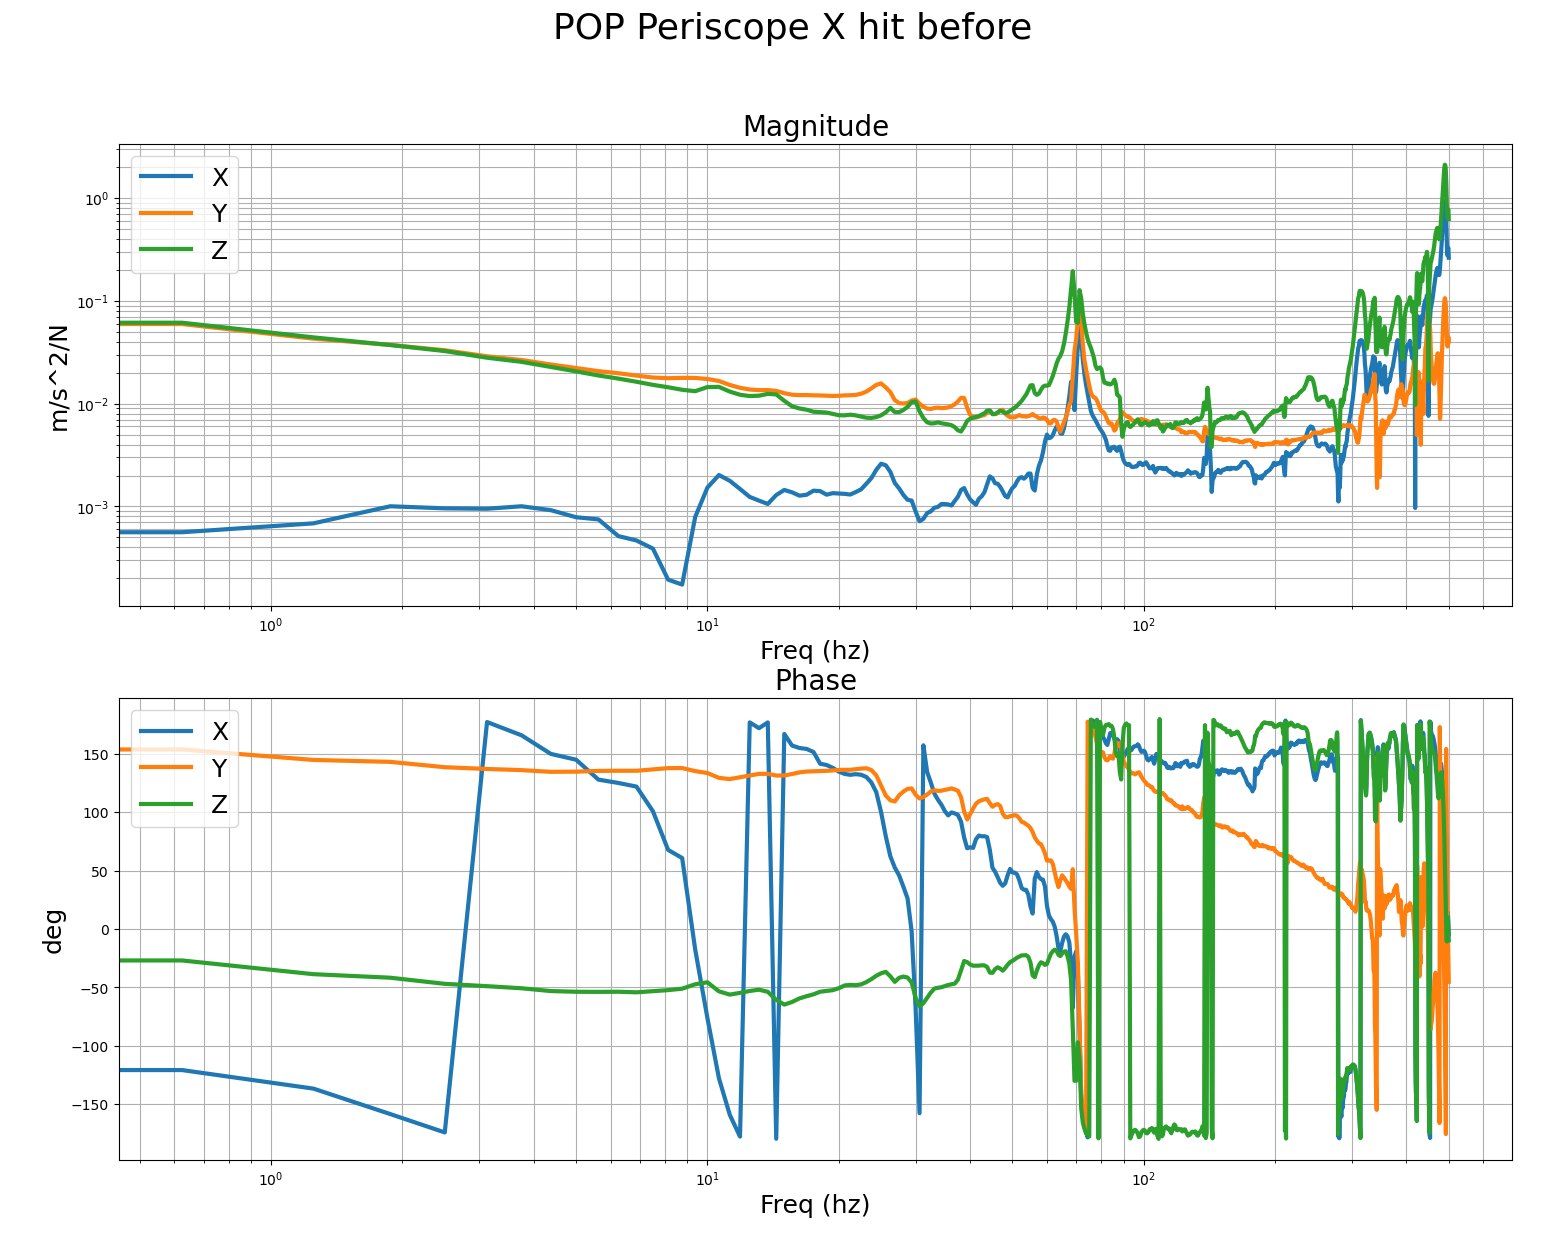
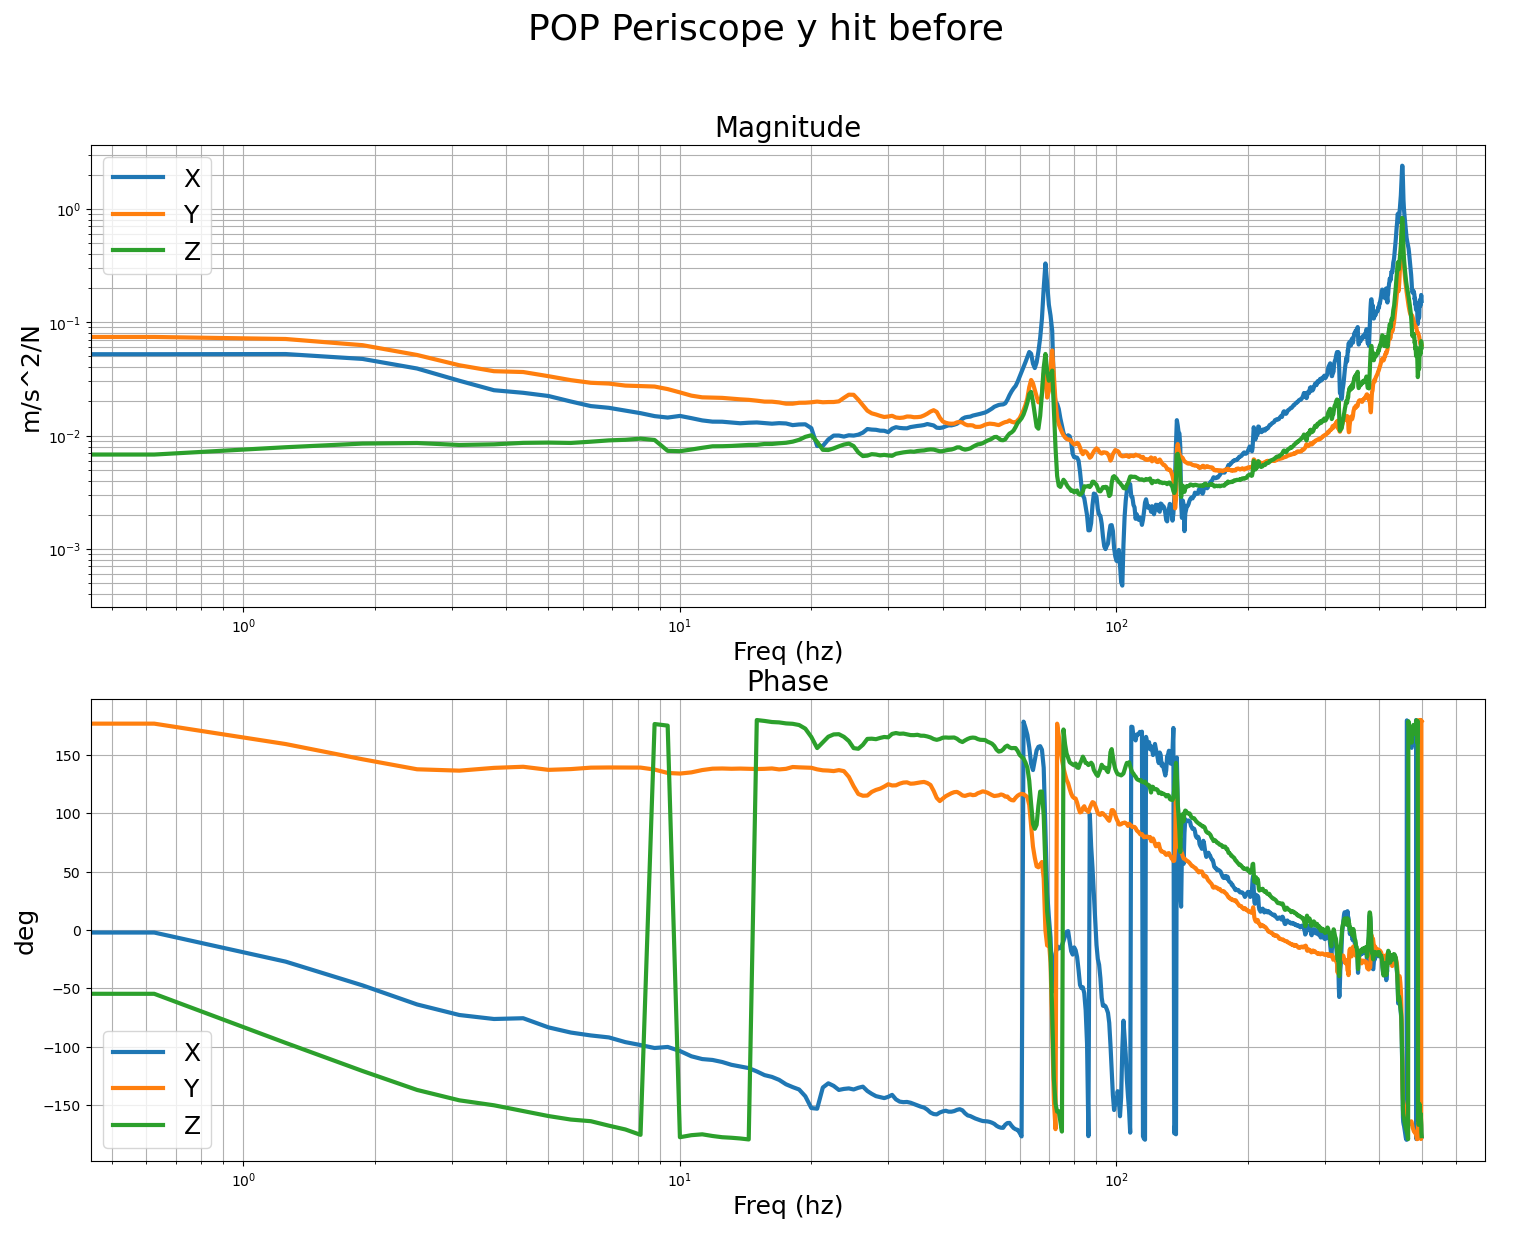
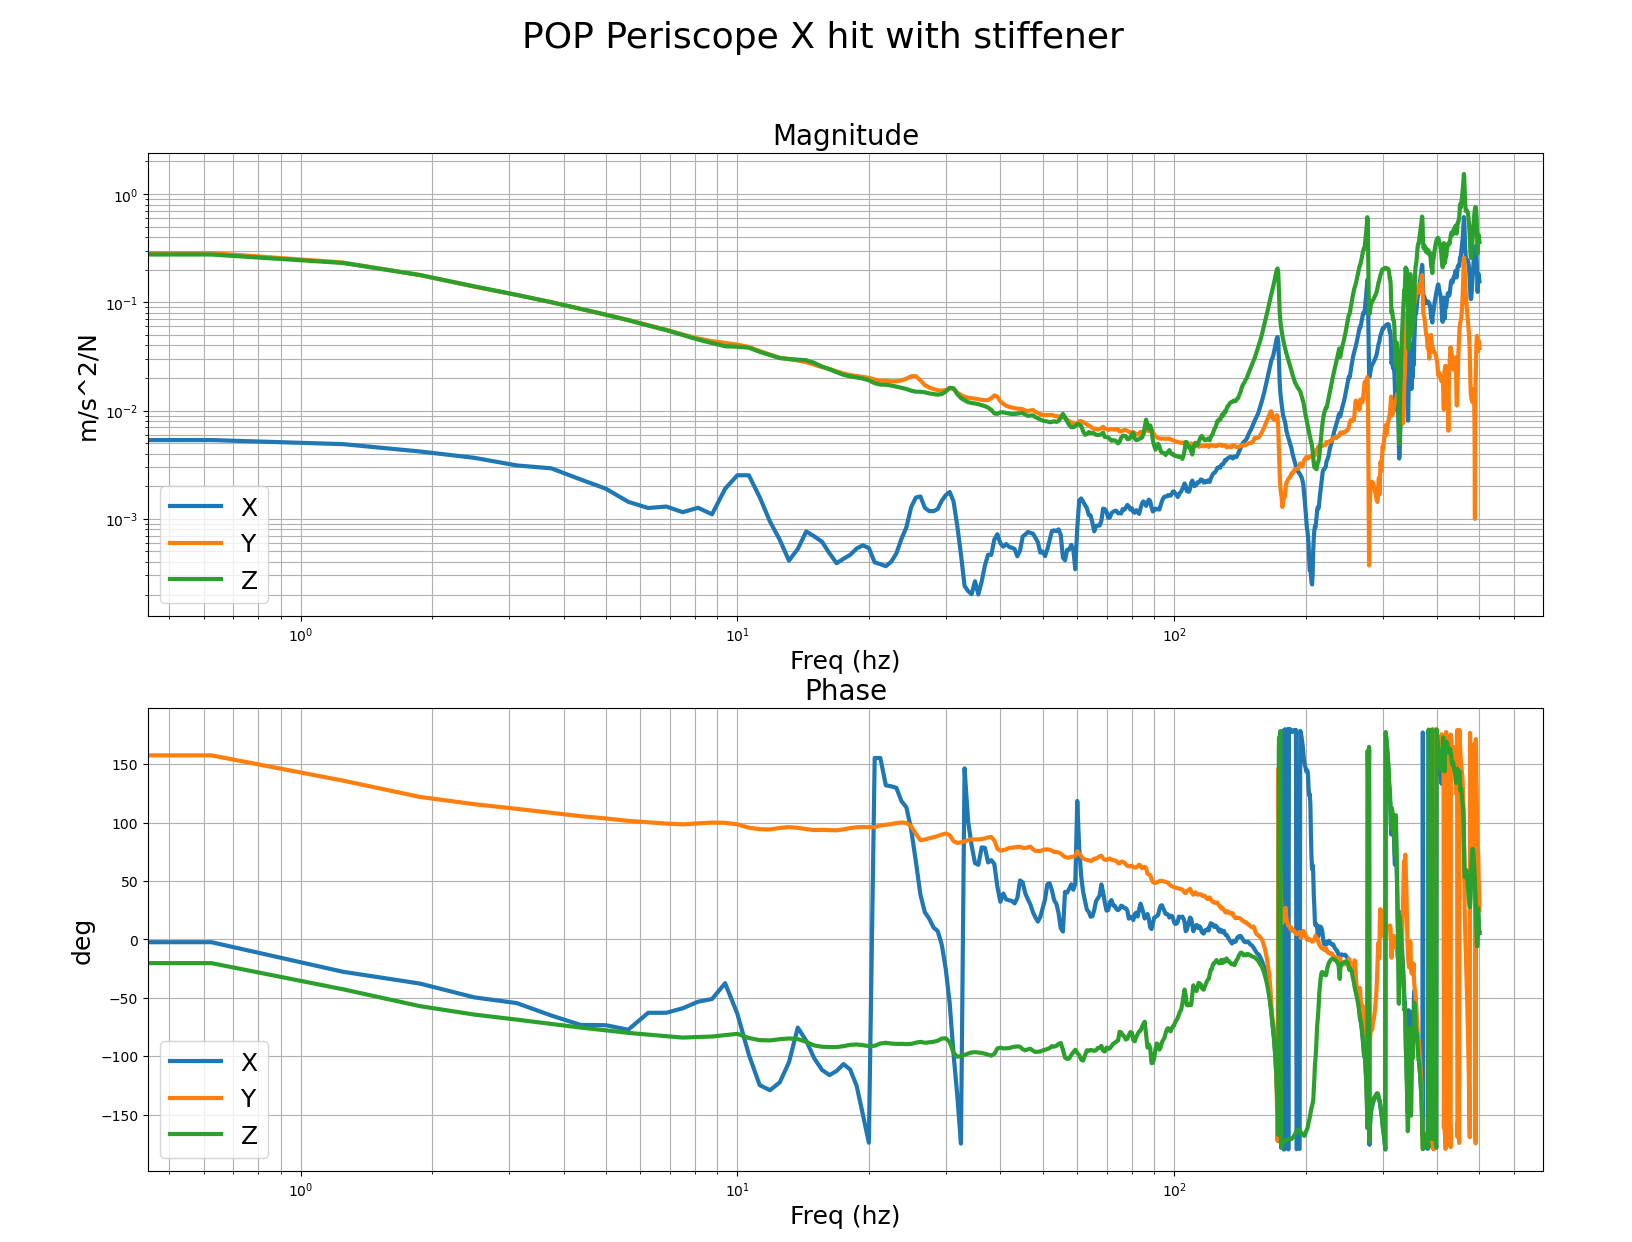
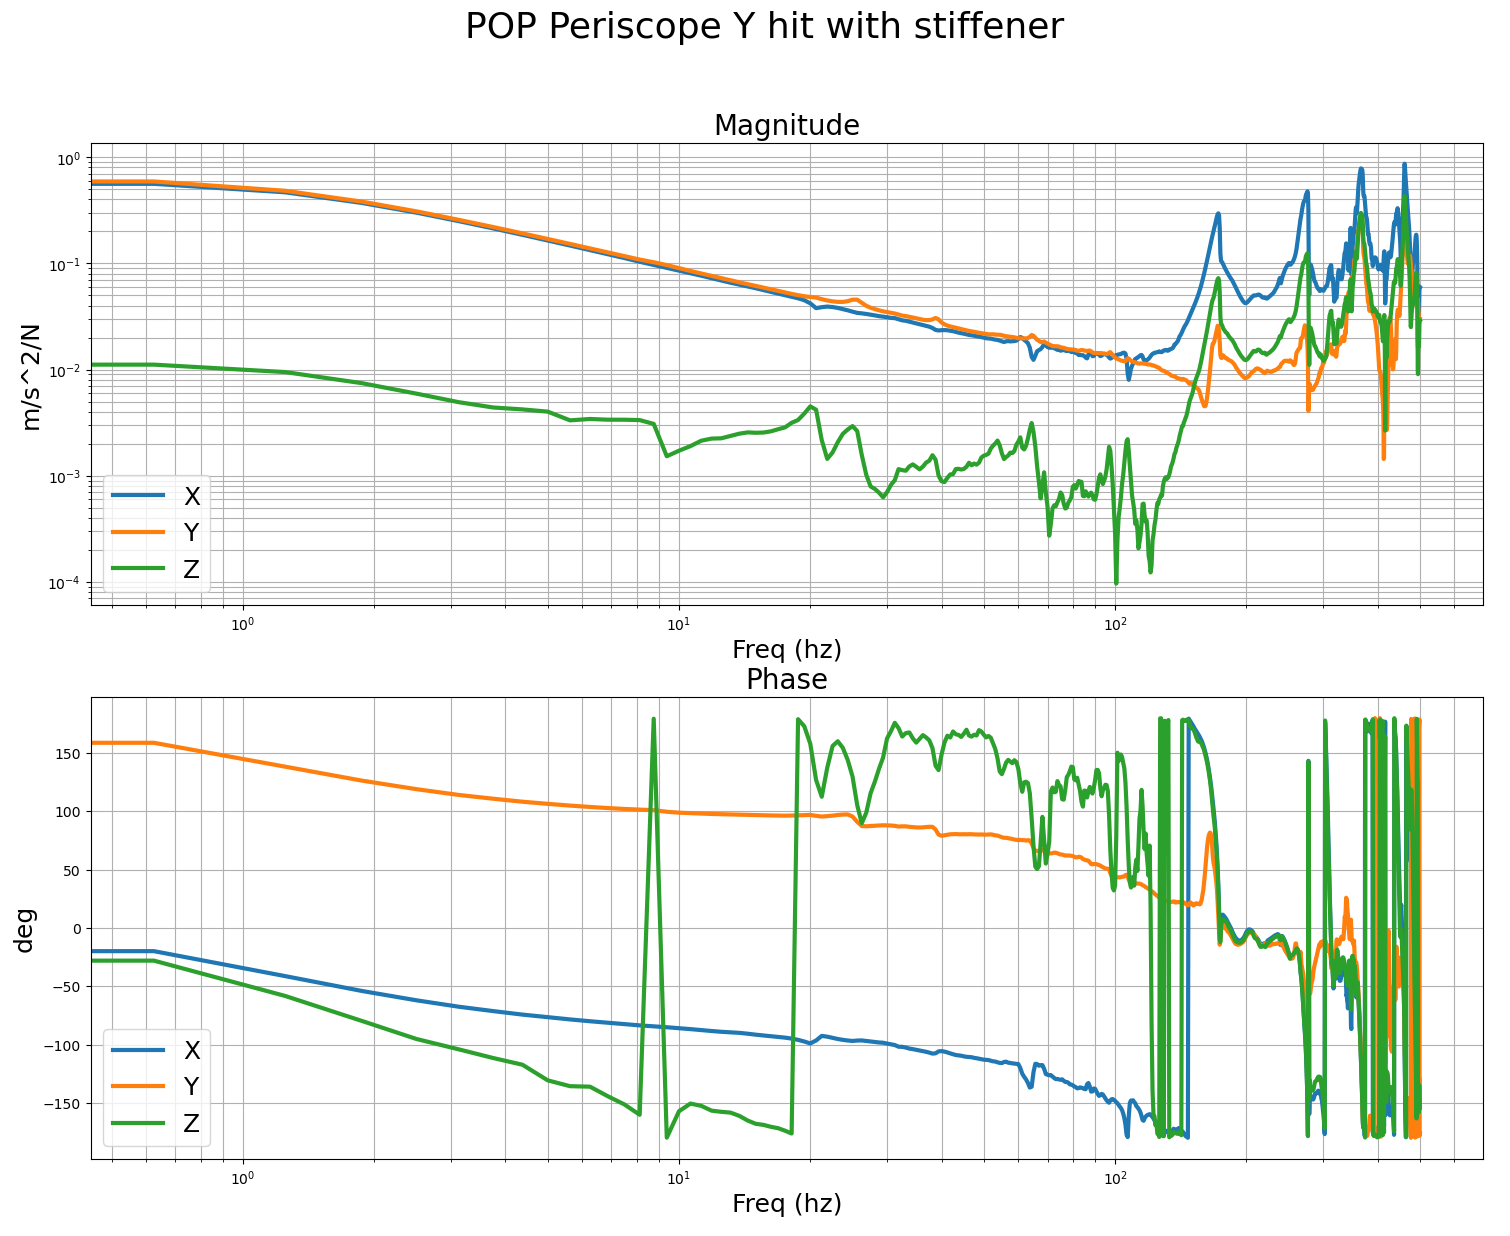
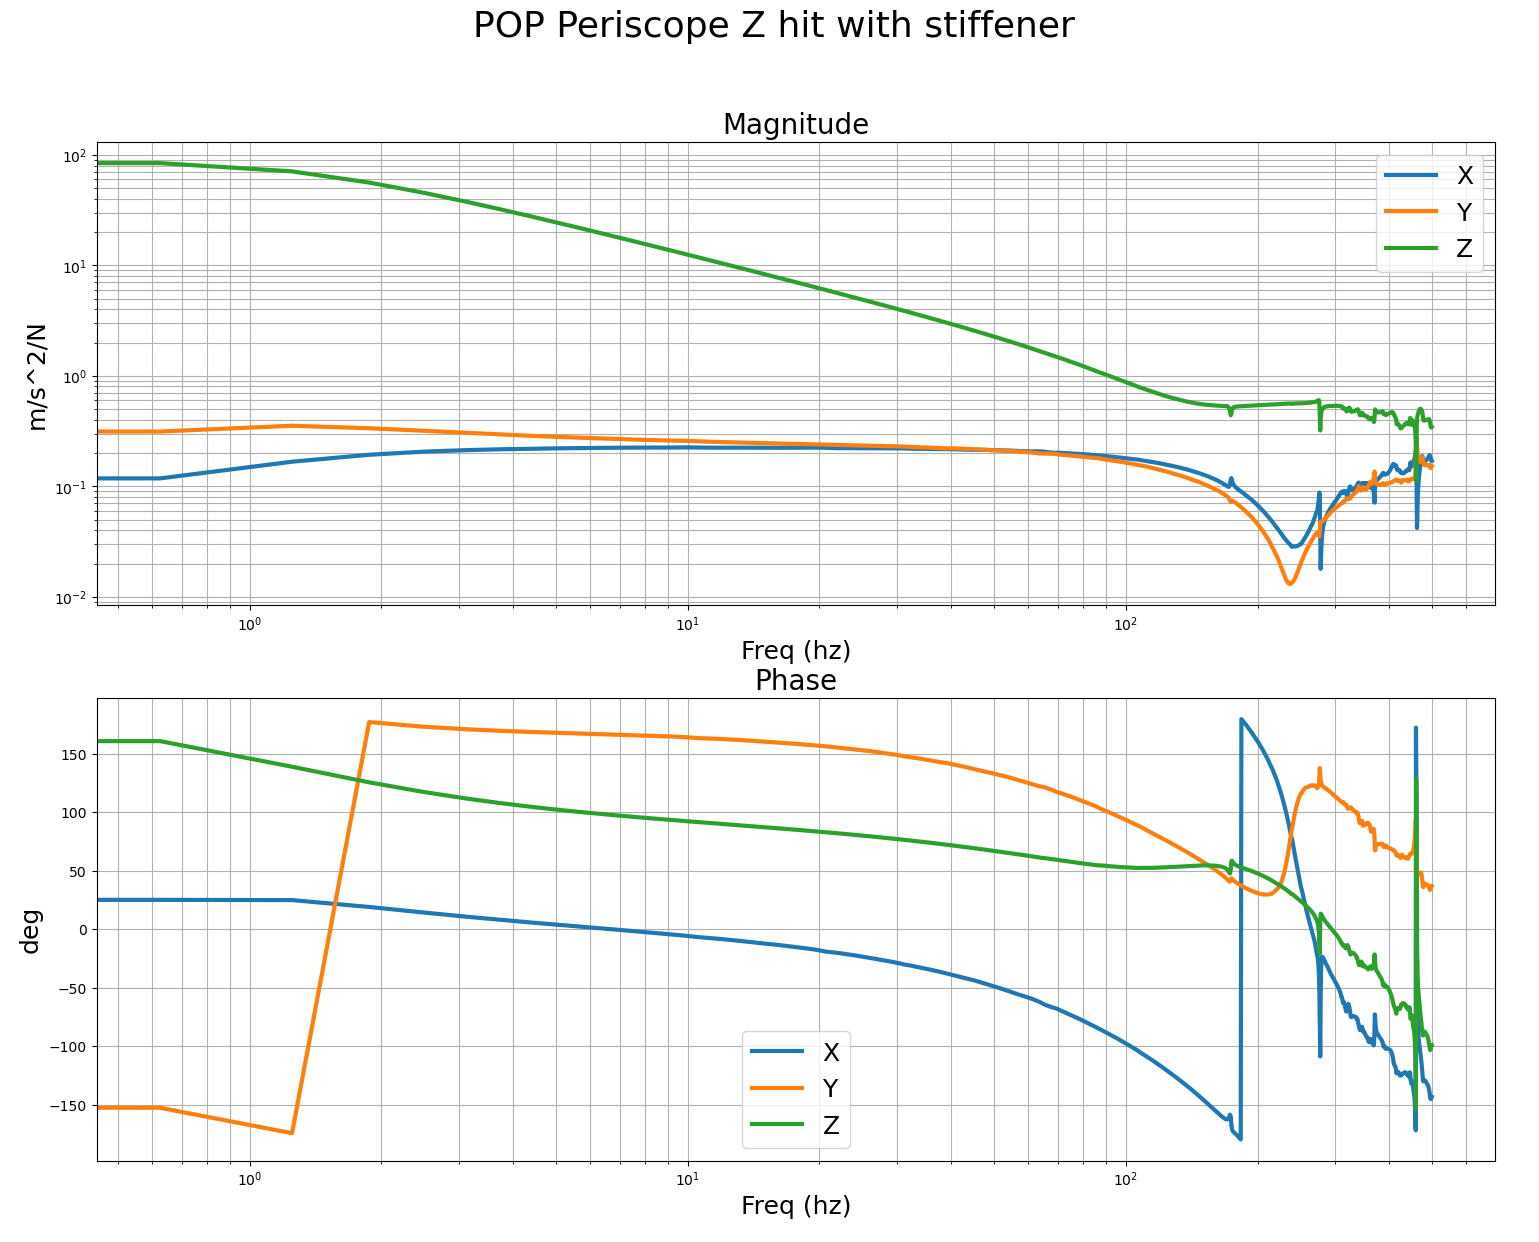
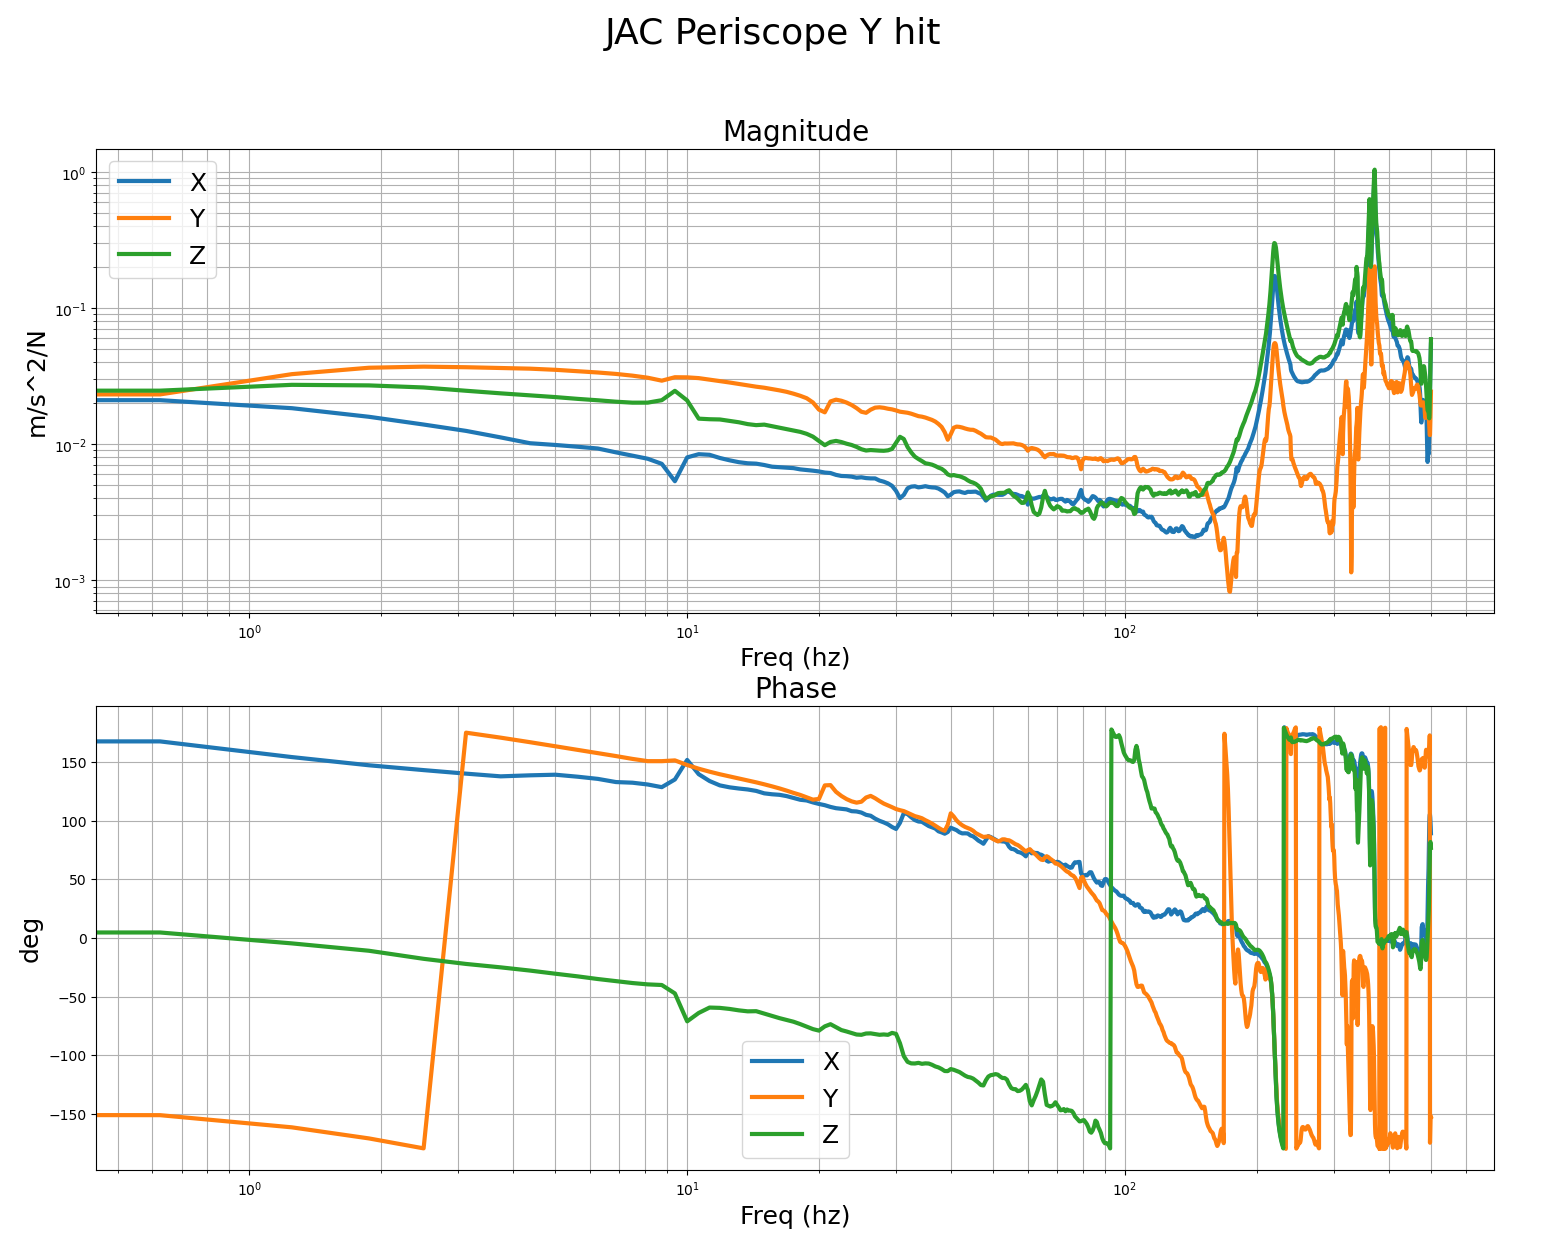
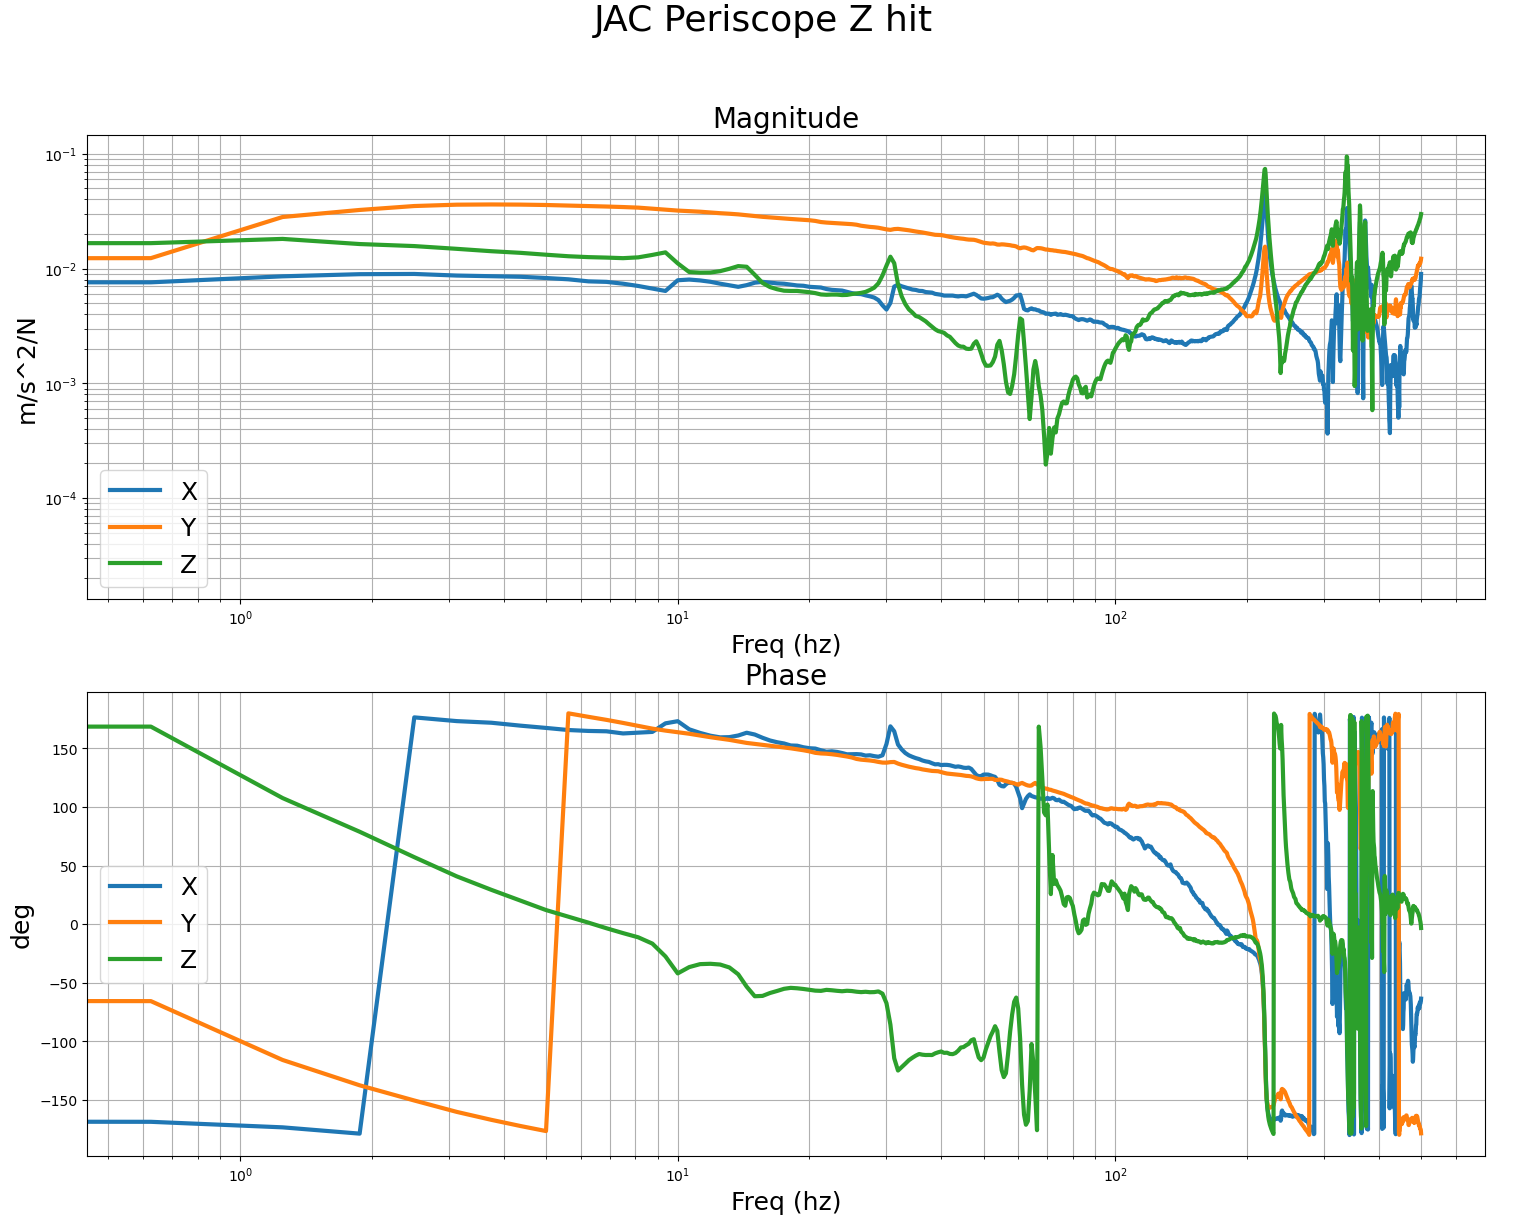
B&K
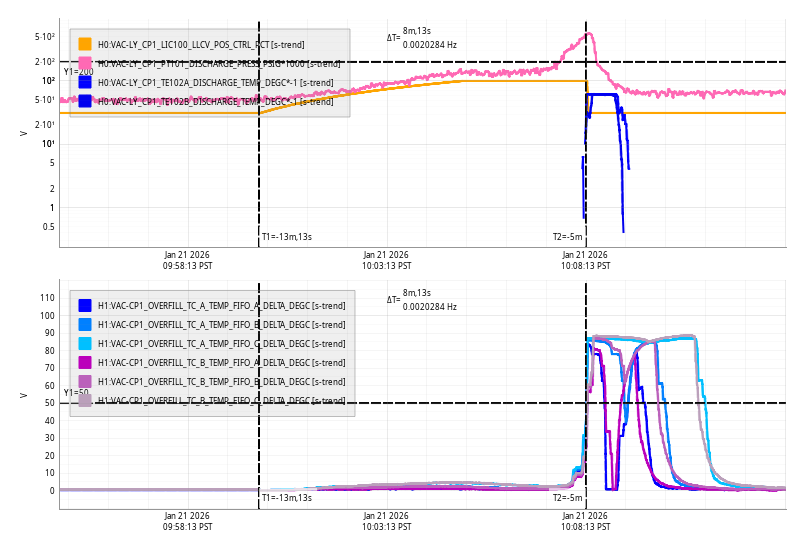
We performed B&K hammer measurements before/after the stiffener installation for POP periscope. Before, there was a 70Hz-ish peak. After, it was pushed higher up in frequency. The transducer was attached to the ISI table and Jim hammered the top of the periscope.
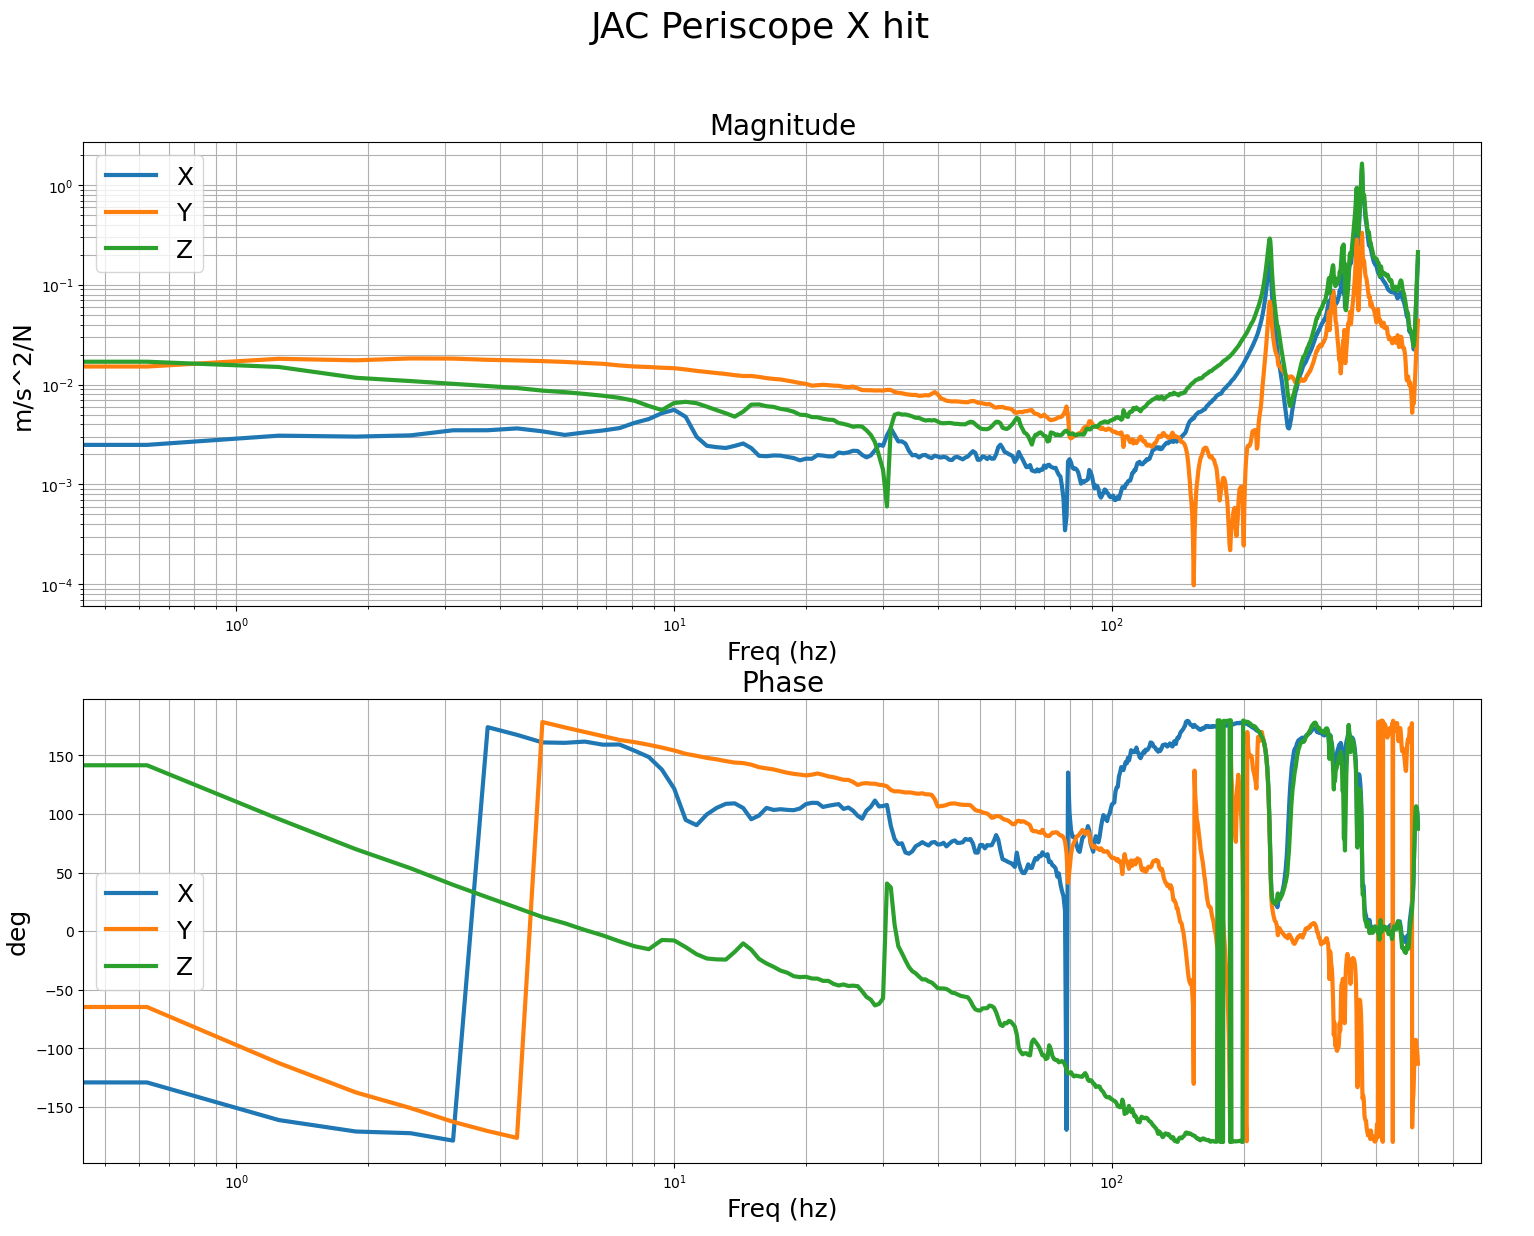
Likewise we did B&K test for the input periscope of the JAC even though it was not absolutely necessary.
We haven't done B&K for the JAC output periscope because it's not even fully clamped down (we will move it).
Jim will post the data.


