In response to Evan's alog (alog 17065), I took a look at the DARM spectra. Here are conclusions at the moment:
- In the 2.8 W configuration, the optical gain seems to have decreased by approximately 9% compared with the noise curve from Feb. 26th (alog 16982) with the assumption that the high frequency band is limited by shot noise. This resulted in a too-good noise curve last night.
-
The origins of this discrepancy is not clear.
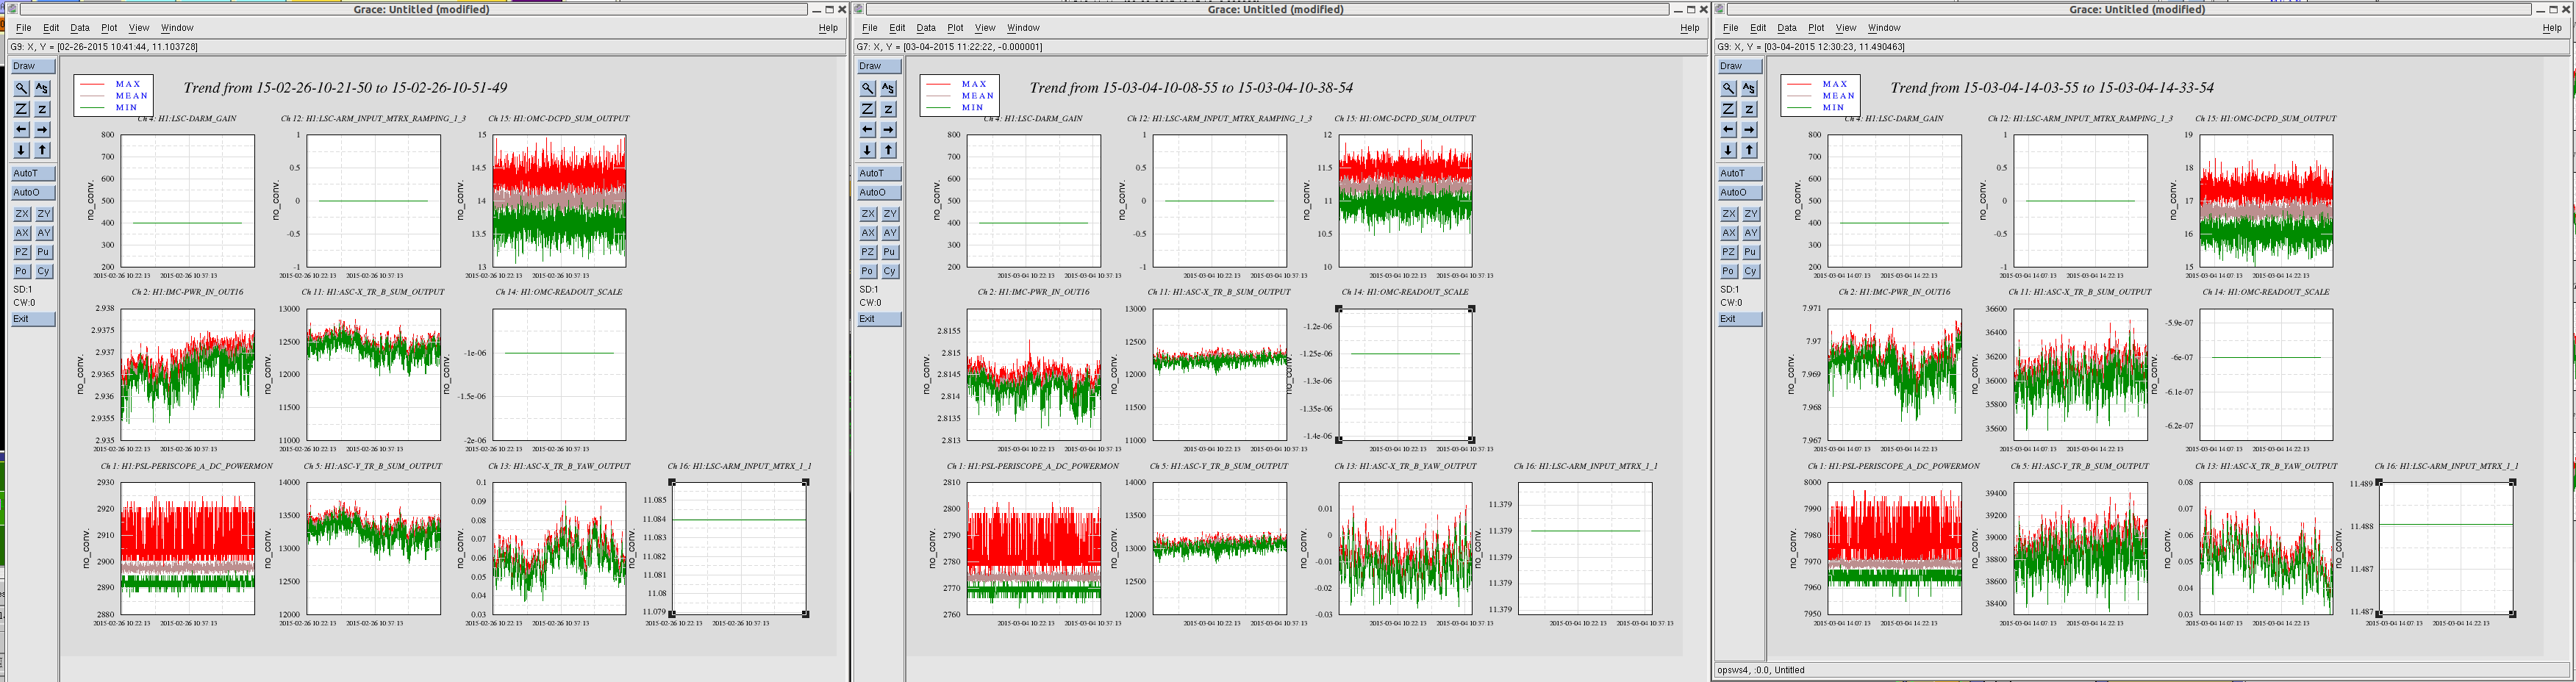
- Note that the arm build up (e.g. ASC_TR_X(Y)_B_QPD_SUM) were lower than that of Feb. 26 th only by 1-2% which is not big enough to explain the discrepancy. See the attached trends for more details.
- One possible factor can be different sensing gain in the digital system such as OMC-READOUT_SCALE and LSC input matrix which the midnight lockers change every time they are transitioning to DC readout. I did not get chance to carefully go through these values yet.
- In the 8 W configuration, the 9% discrepancy was inherited and hence too good noise again by 9% above 1 kHz. On the other hand the power scaling from 2.8 to 8 W seems to have been done precisely.
- A strange thing is that the noise curve at around 2.8 kHz became further too low for some reason in the 8 W configuration. This can not be explained by the 9% overall discrepancy factor. The noise in this region seems lower by 10-ish% than the GWINC curve.
(Noise spectra)
The data sets that I used are from:
- 2015-02-26 10:2:50 (at 2.8 W)
- 2015-03-04 10:08:55 (at 2.8 W)
- 2015-03-04 14:03:55 (at 8 W)
Here is a comparison of all three curves with the GWINC theoretical curves above 400 Hz up to 7600 Hz.
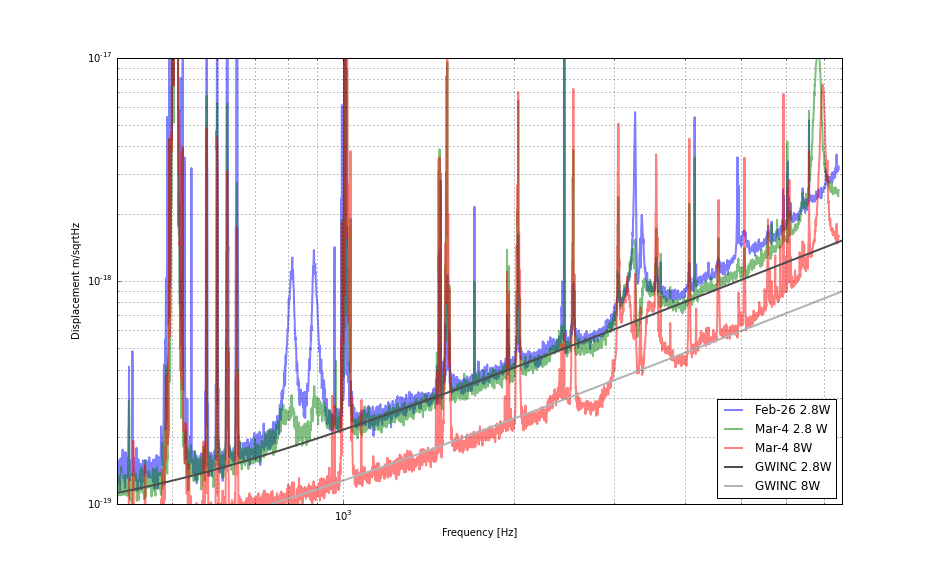
As Evan reported, indeed the measured curves from last night are lower than the GWINC curve in 1 - 4 kHz band while the one from Feb-26 looks fine.
(Discrepancies between the curves)
Now, I want to answer how much the Mar-4 data differed from the one from Feb-26th by taking the ratio between them. I divided the Feb-26th by Mar-4th spectra in 400-7600 Hz band. Then I convert it into a histogram to see how they differ on average. Since there were many peaks whose amplitude varied as a function to time, I excluded them by limiting the histogram range from 0 to 2. The ratio is shown as red bars in the below plot.
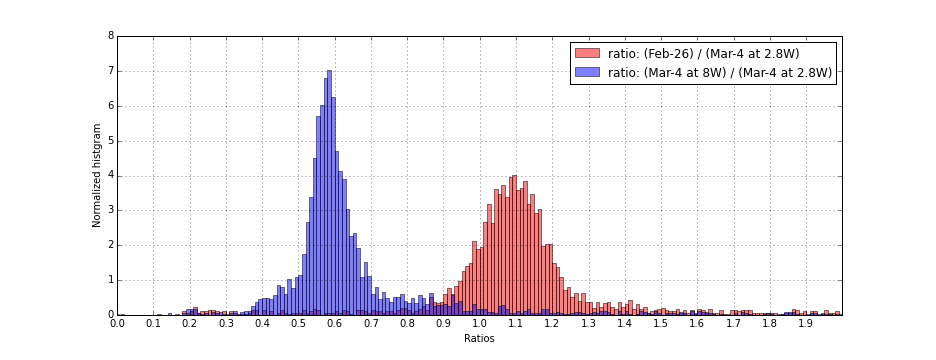
Note that I could have done a fancy Gaussian fit for it, but for now I picked the highest bar in the histogram in order to coarsely estimate the ratio. As shown in the plot, the Feb-26 data had a higher noise level by a factor of 1.09 on average.
Then I did the same ratio analysis for the 2.8 W and 8 W data of Mar-4th. It is shown as blue bars in the same histogram plot. Picking the highest bar, I measured the ratio to be 0.58 which agrees with what we expected i.e. sqrt( 2.8W / 8W) = 0.59. So the power scaling from 2.8 W to 8 W seems to have been done correctly last night.
(Unexplainable dip at around 2.8 kHz in the 8 W data)
However, it is not the end of the story yet. The noise curve of the Mar-4 at 8 W had a funny feature at around 2.8 kHz where the noise go down below the GWINC curve even if i apply the 9 % correction.
The below plot shows "normalized" spectra of all the three data sets. In order to line up all the spectra at the same level, I "normalized" the Mar-4th-2.8W data by multiplying a factor of 1.09. In a similar manner, I "normalized" the Mar-4th-8W data by a factor of 1.09/0.59. In this way I checked the shape of all the spectra.
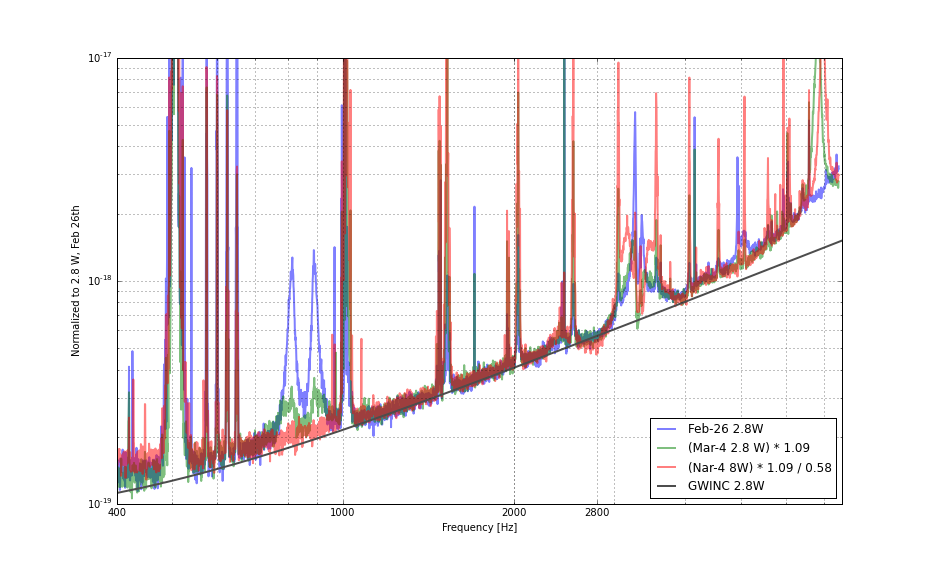
The Mar-4th-8W data was lower by the rest of the two curves by 10-ish %. I did not do a serious histogram analysis.
Finally , if I apply only the 1.09 correction factor to the data from last night, they look like this:
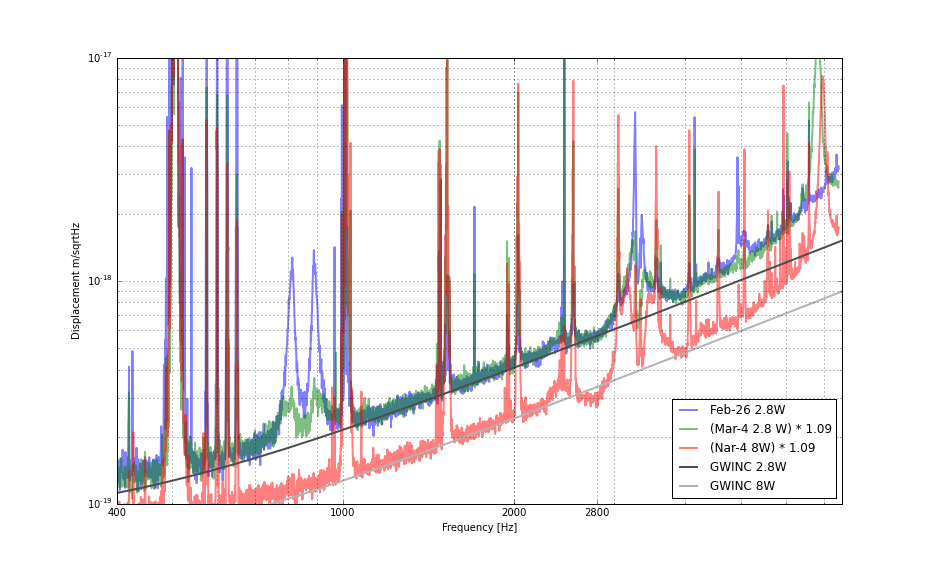
Apparently the Mar-4-8W data is lower at around 2.8 kHz than the GWINC curve.
At least part (maybe all) of the issue here is actually due to the GWINC curves that we're using right now. In particular, I had put in a value for the arm losses that was too high.
By putting in 50 ppm per optic (i.e., 100 ppm per arm, which is closer to reality than the 180 ppm I was using before), I get a GWINC curve that is below the measured calibrated strain curve. This is shown for the recent 8 W lock in the attached noise budget.
Out of curiosity, I've also shown a rough estimate for how much DAC-induced ESD noise we can expect if the proposed low-pass filtering is installed (pole at 1.6 Hz, zero at 53 Hz). Obviously this is subject to the same uncertainty as the current noise trace with regard to the magnitude of the actuation coefficient.

Notes:
- The "GWINC total" and "DAC → ESD [proposed]" curves are not included in the "Sum of all" curve
- For the "DAC -> ESD" traces, the bias voltage was taken as 380 V and the ESD coefficient was taken as 2×10⁻¹⁰ N/V2. This coefficient is just a canned value, so the actual magnitude of these noises may be higher or lower than what is shown here (hopefully lower). The DAC noise is taken from G1401399-v2, page 6.
