stuart.aston@LIGO.ORG - posted 16:50, Wednesday 03 October 2012 (4365)
HAM3 PR2 and MC2 B&K Hammer Measurements
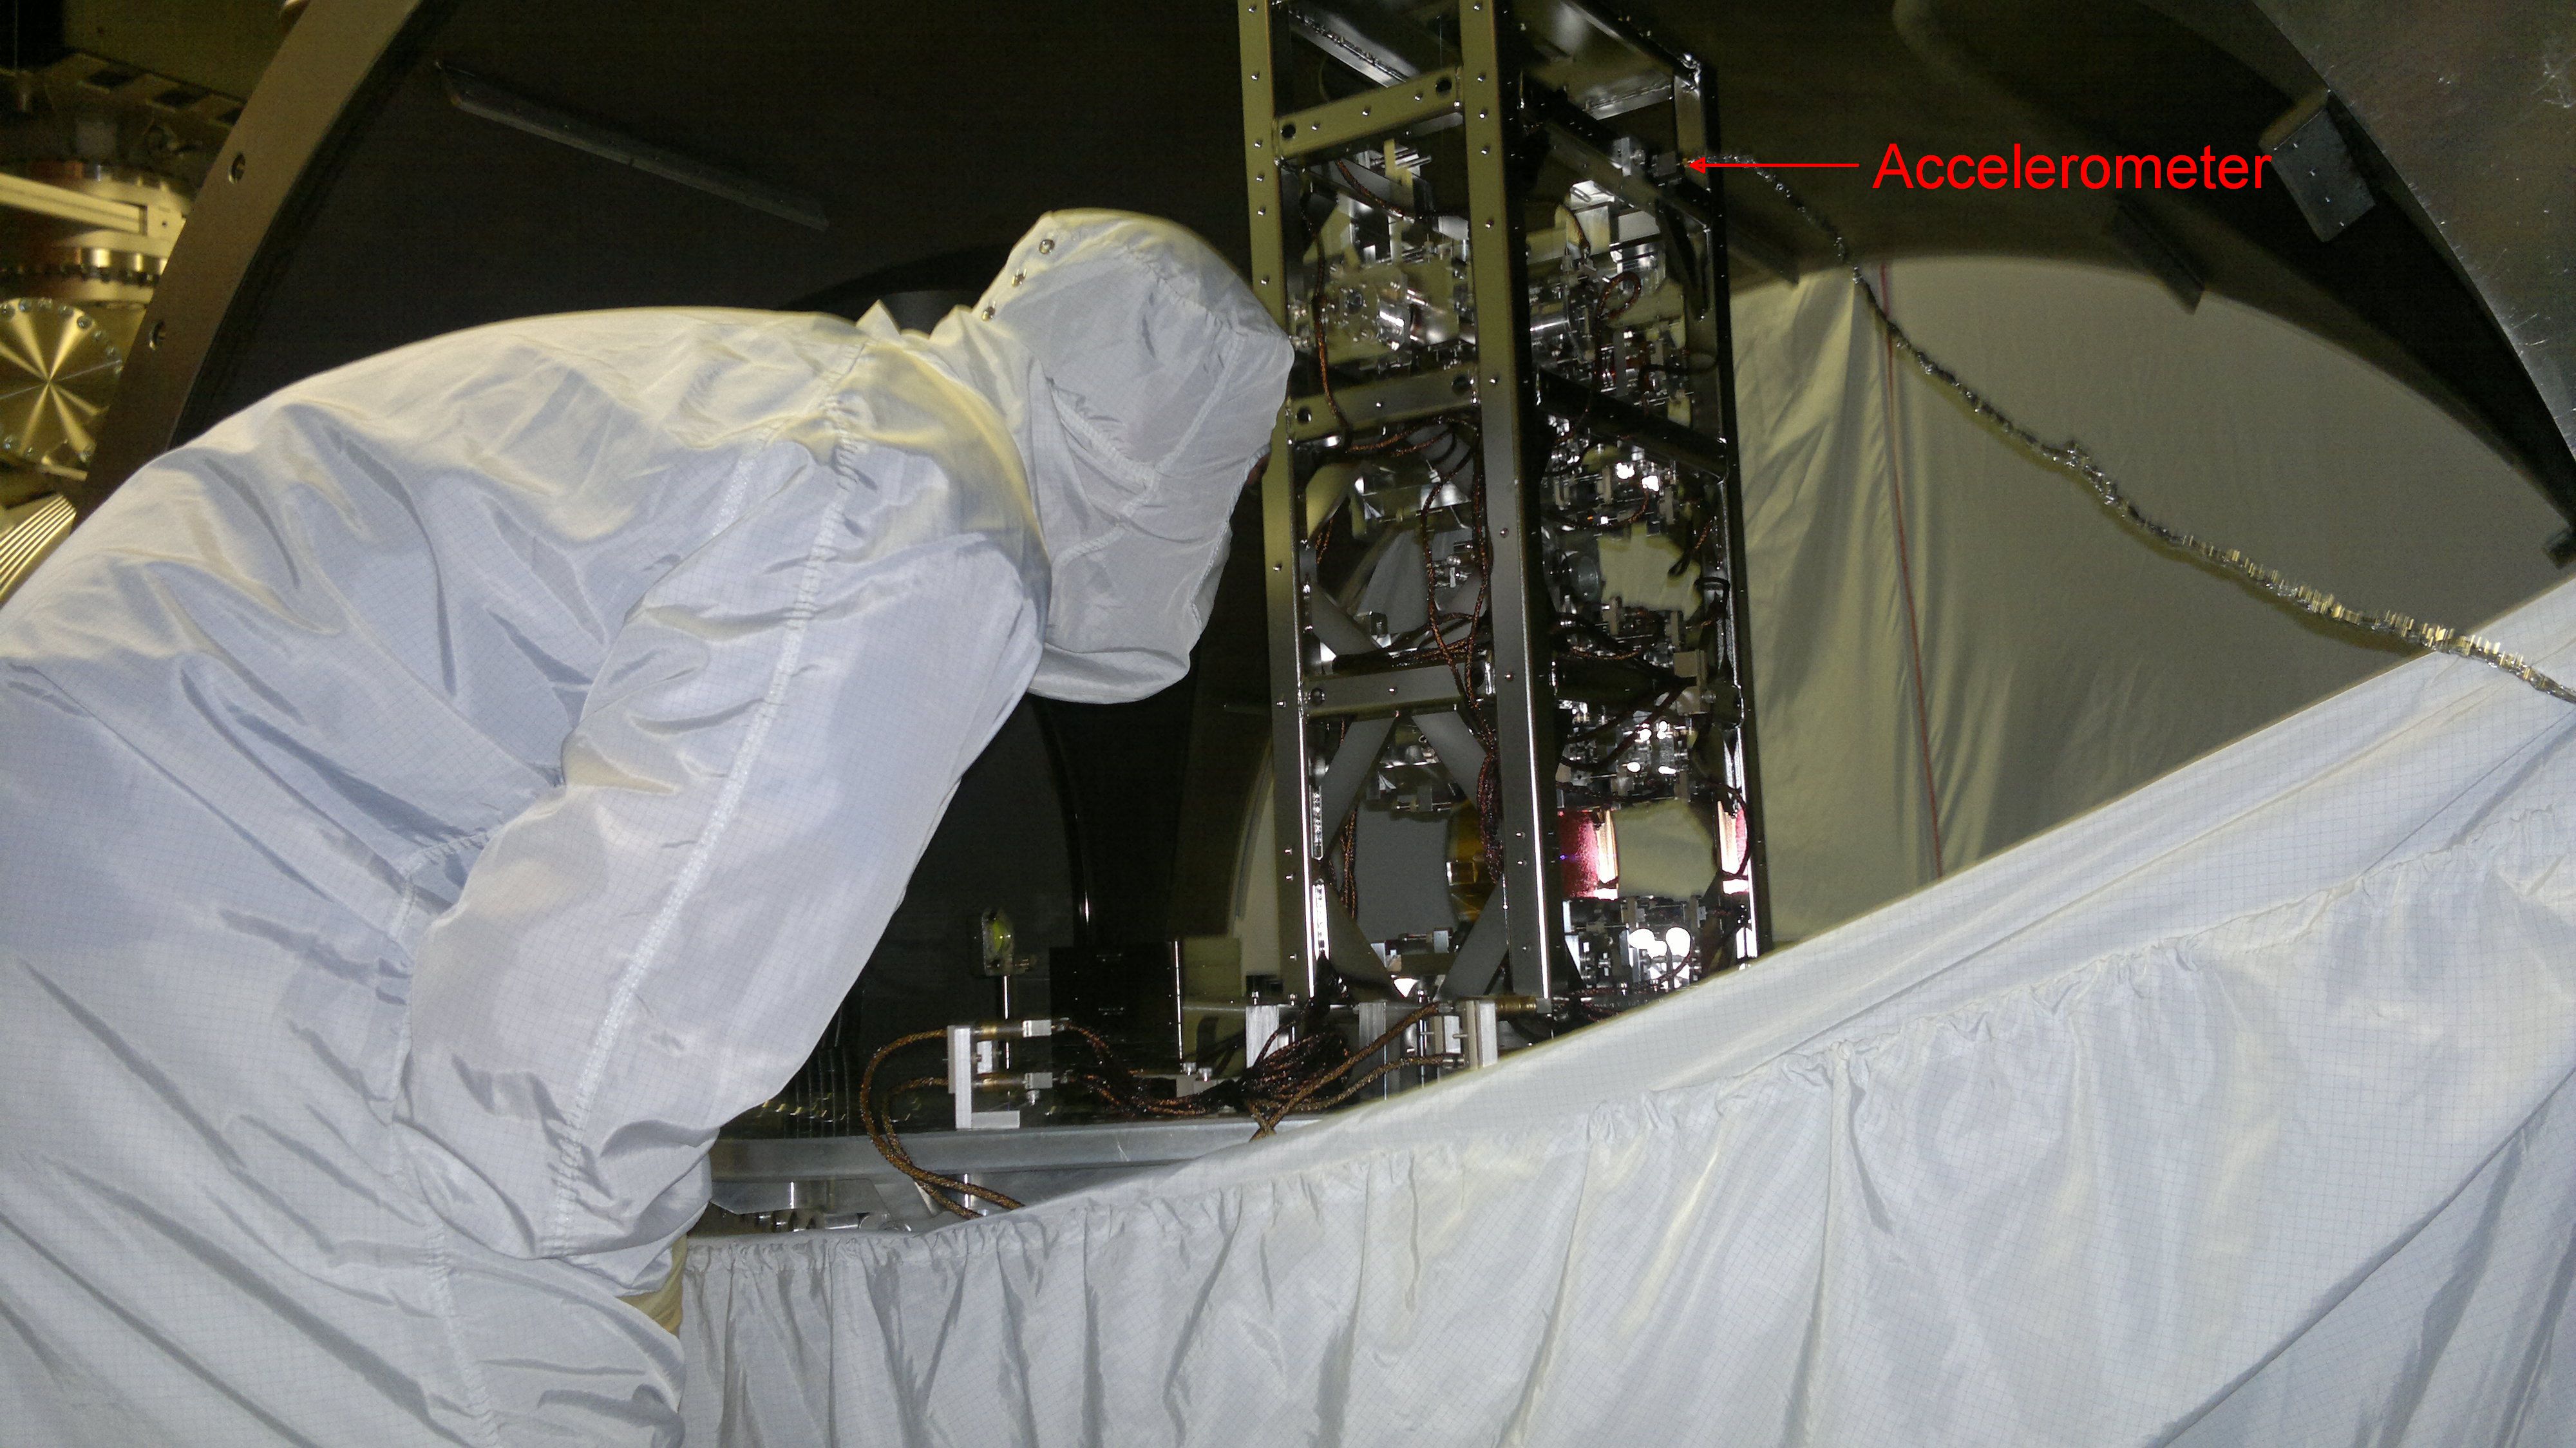
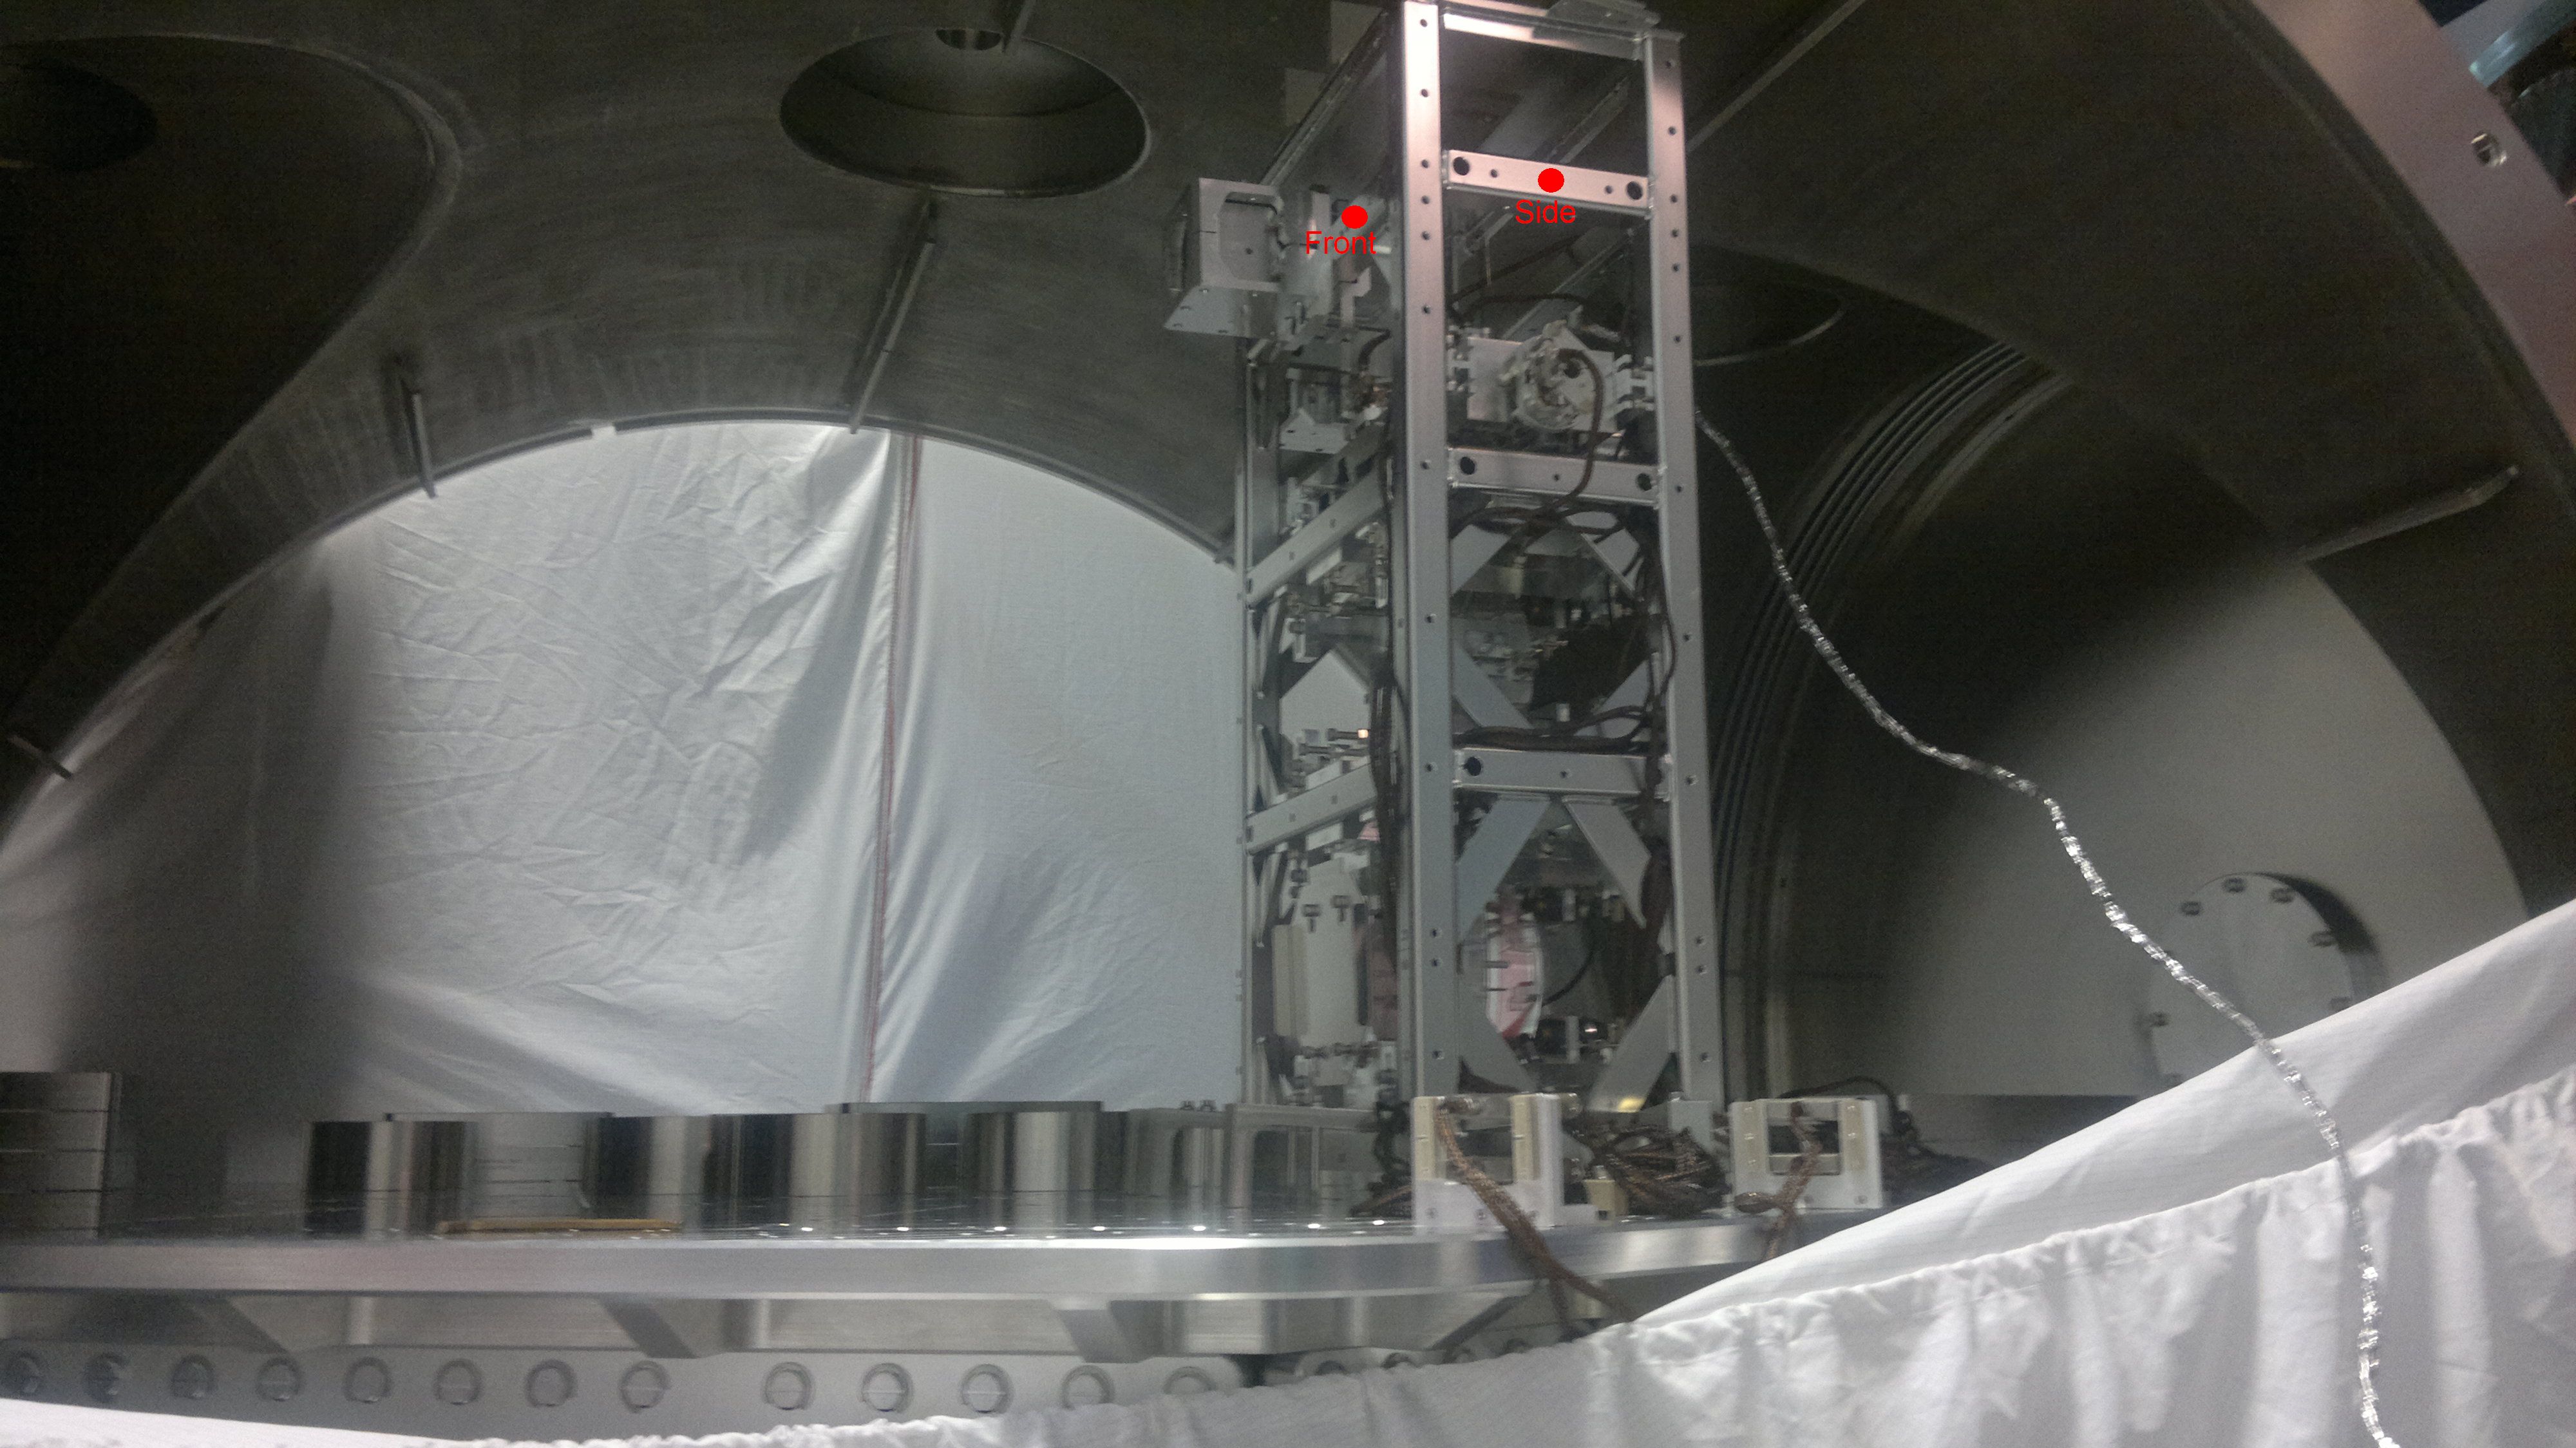
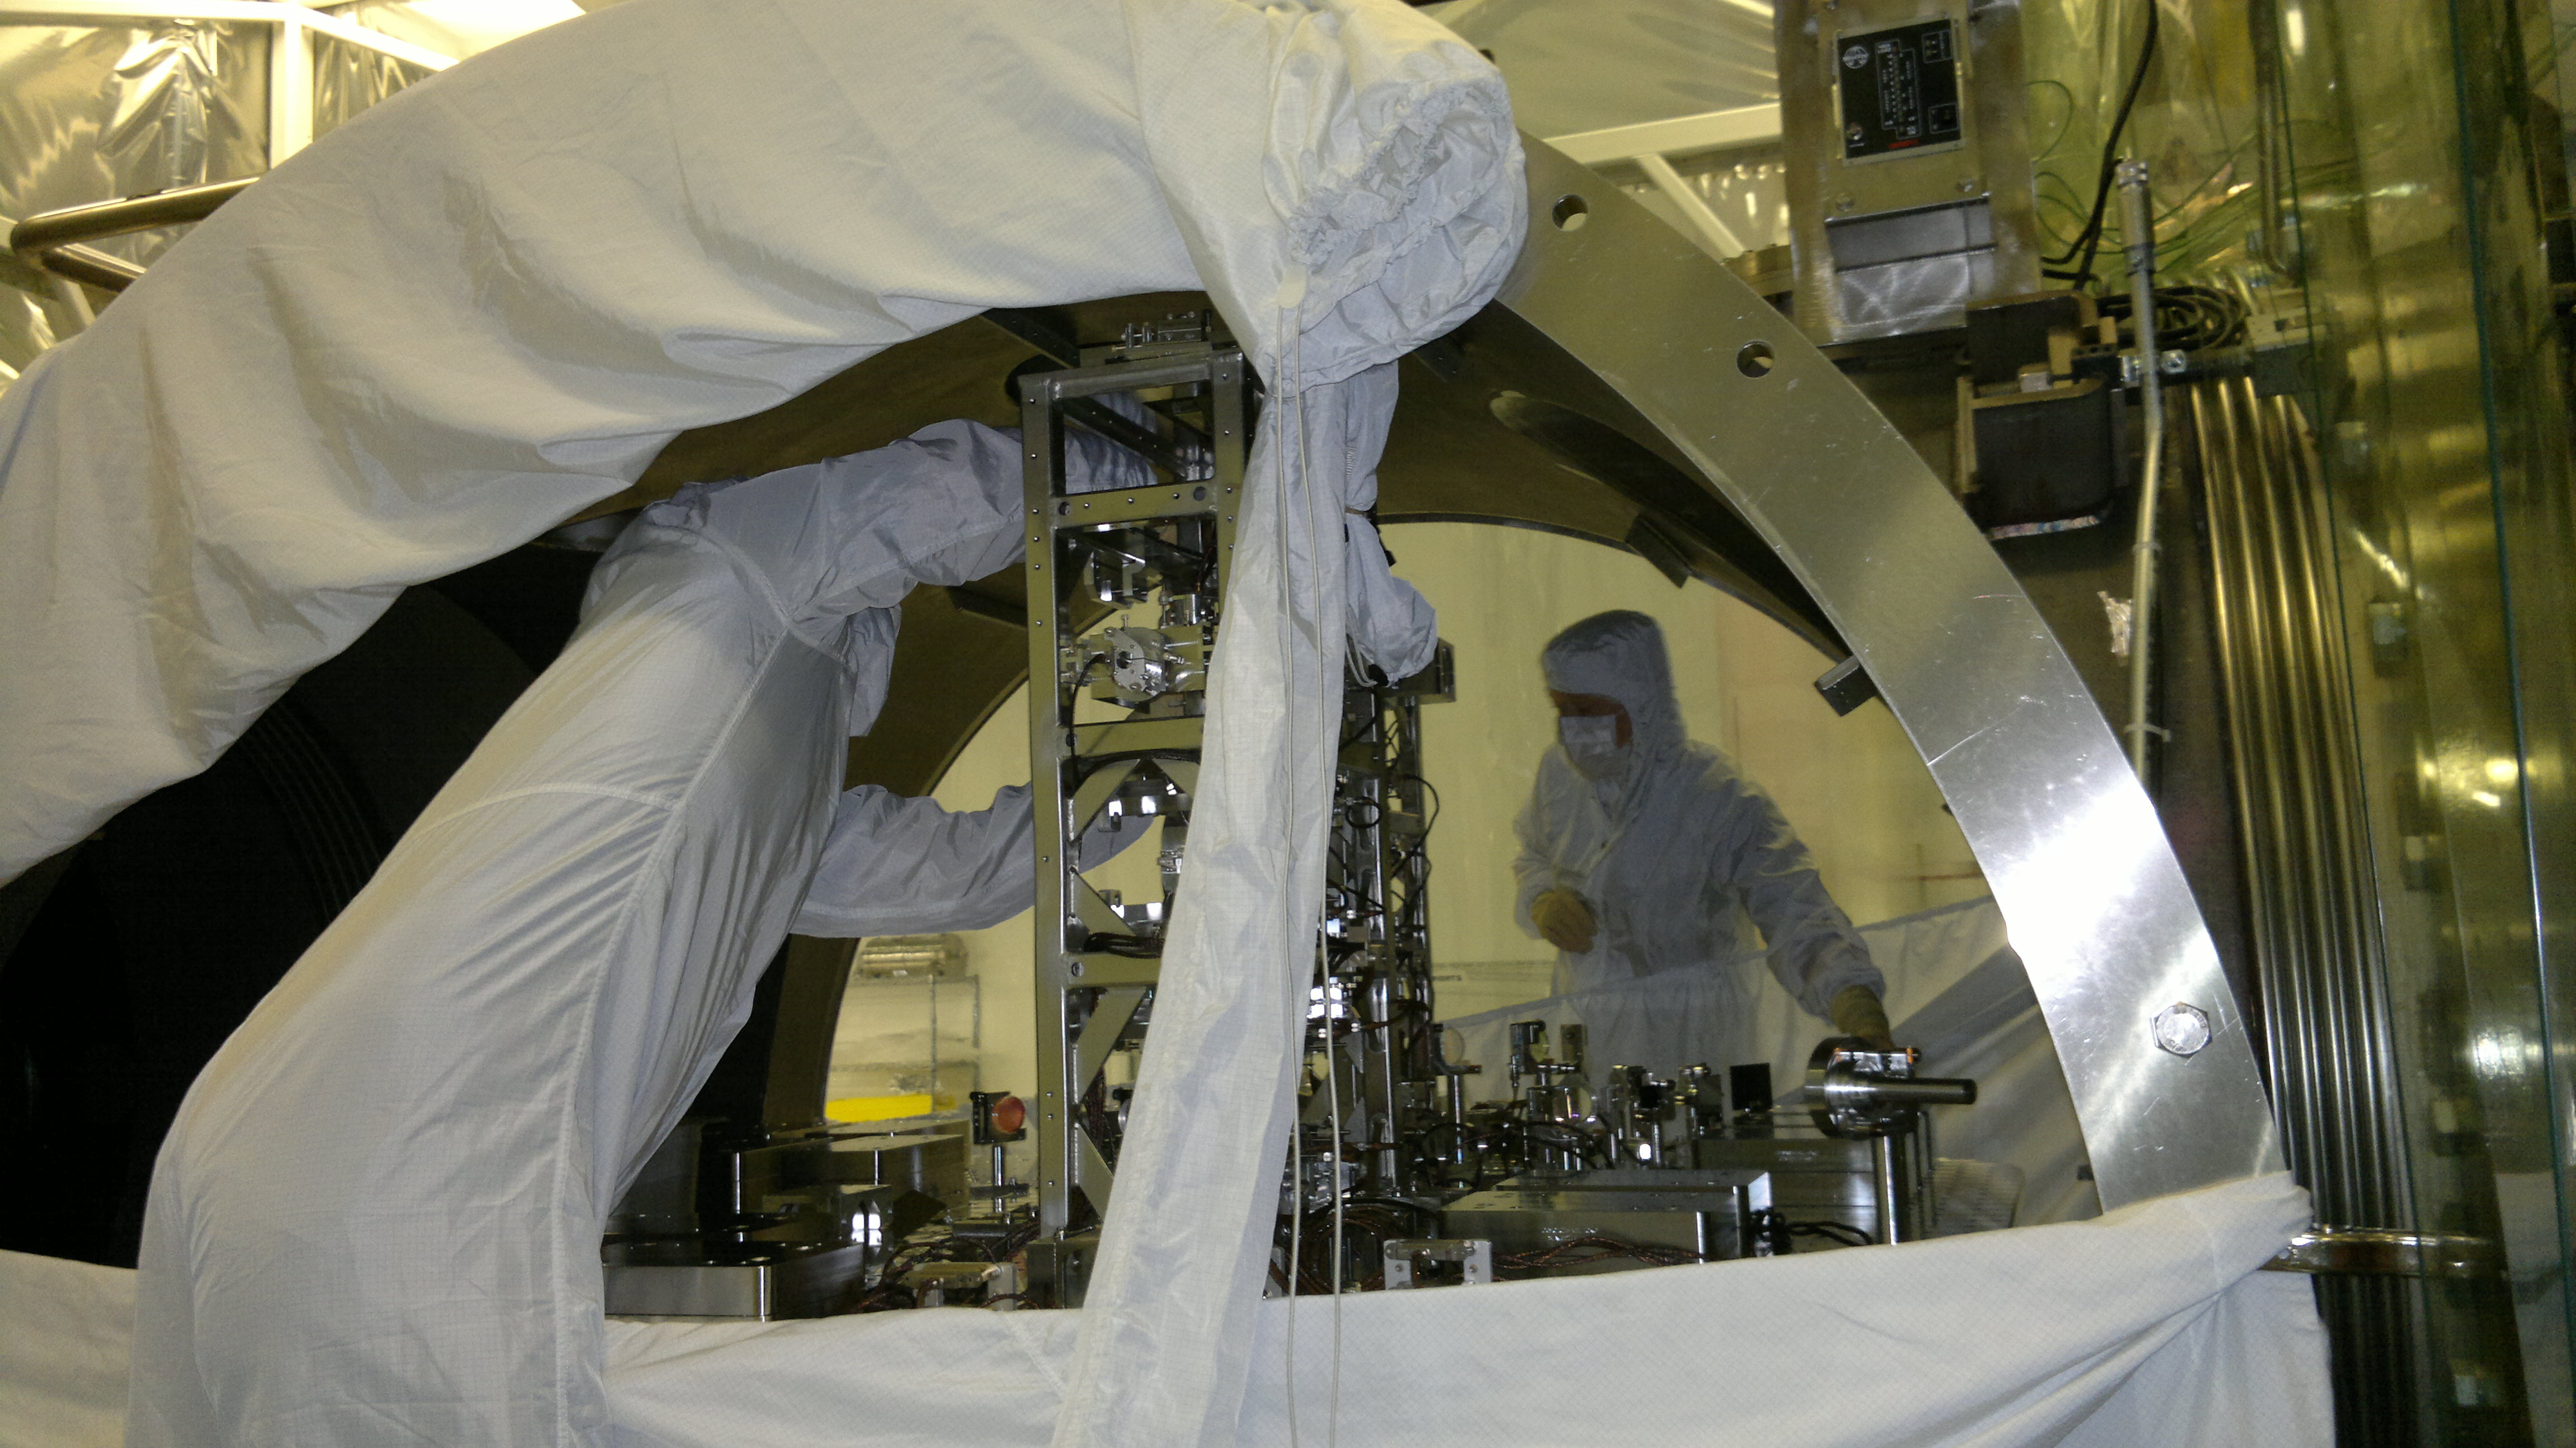
[Stuart A, Betsy B and Travis S]

Following the installation of PR2 (HSTS) and MC2 (HSTS) suspensions into the HAM3 chamber, and confirming that the optics were freely suspended, by running un-damped M1-M1 Matlab TFs (available in LHO aLOG entry 4353), B&K hammer measurements could then commence in-chamber.

Both PR2 and MC2 suspensions were fully dog-clamped down, and torqued to the requirement.

The tri-axial accelerometer was attached using an interface plate, to a horizontal strut near the top of each of the structures, i.e. the opposite side to where the vibration absorbers are fitted.

For convenience, the axes of the accelerometer were aligned with the axes of the suspension (i.e. X = longitudinal, Y = transverse, Z = vertical). The hammer was used in two places to excite the structure, the first being +X at the front of the structure, and the second being +Y on the side of the structure.

Image #554 below shows the LLO PR2 structure, with the accelerometer installed.
Image #547 below shows the LLO PR2 structure, with the impact hammer locations highlighted.
Image #2338 below shows the LHO HAM3 B&K hammer measurement set-up (PR2 in foreground, MC2 in background).

Measurements were taken using the "simple hammer display 3.pls" template available in T1000697. A hammer trigger threshold of approximately 40N was found to work best in all cases.

For PR2, measurements were initially taken without vibration absorbers fitted, and then repeated after installation of the vibration absorbers.

However, for MC2, vibration absorbers had already been installed, and it was deemed too much of a risk (handling & contamination concerns) to remove them. So in this case, B&K measurements proceeded on MC2 with the vibration absorbers already fitted.

B&K hammer measurements have been taken for the following conditions (each corresponding raw data-set available below):-

PR2 - Test 1a - VA not fitted - SUS unlocked - (SIDE HIT)
PR2 - Test 1b - VA not fitted - SUS unlocked - (FRONT HIT)
PR2 - Test 2a - VA fitted - SUS unlocked - (SIDE HIT)
PR2 - Test 2b - VA fitted - SUS unlocked - (FRONT HIT)

MC2 - Test 3a - VA fitted - SUS unlocked - (SIDE HIT)
MC2 - Test 3b - VA fitted - SUS unlocked - (FRONT HIT)

The raw data has been exported from the B&K pulse analysis software and into an excel spreadsheet for comparing and plotting. The spreadsheet and a merged pdf of relevant plots are available below.

On PR2, the effect of the vibration absorbers in damping the first and second resonance modes is clearly visible. The first resonance peak also drops from ~94Hz down to ~89Hz.

For MC2, the first resonance peak is visible at ~91Hz.
Images attached to this report
Non-image files attached to this report


