MC1 MC2 and MC3 Phase 3b M1 to M1 transfer functions have been measured over the past weekend. They all show good agreement with model and previous measurements.
The attached files are showing comparison between model, phase 3a and 3b (except for MC2 3b vs 3b)
MC1 (allhstss_2013-05-29_Phase3b_H1MC1_ALL_TFs.pdf)
- model in blue
- phase 3a on march 2013 with ISI locked and suspension undamped in orange
- phase 3b on may 2013 with ISI damped and suspension undamped in cyan
- phase 3b on may 2013 with ISI damped and suspension damped in pink
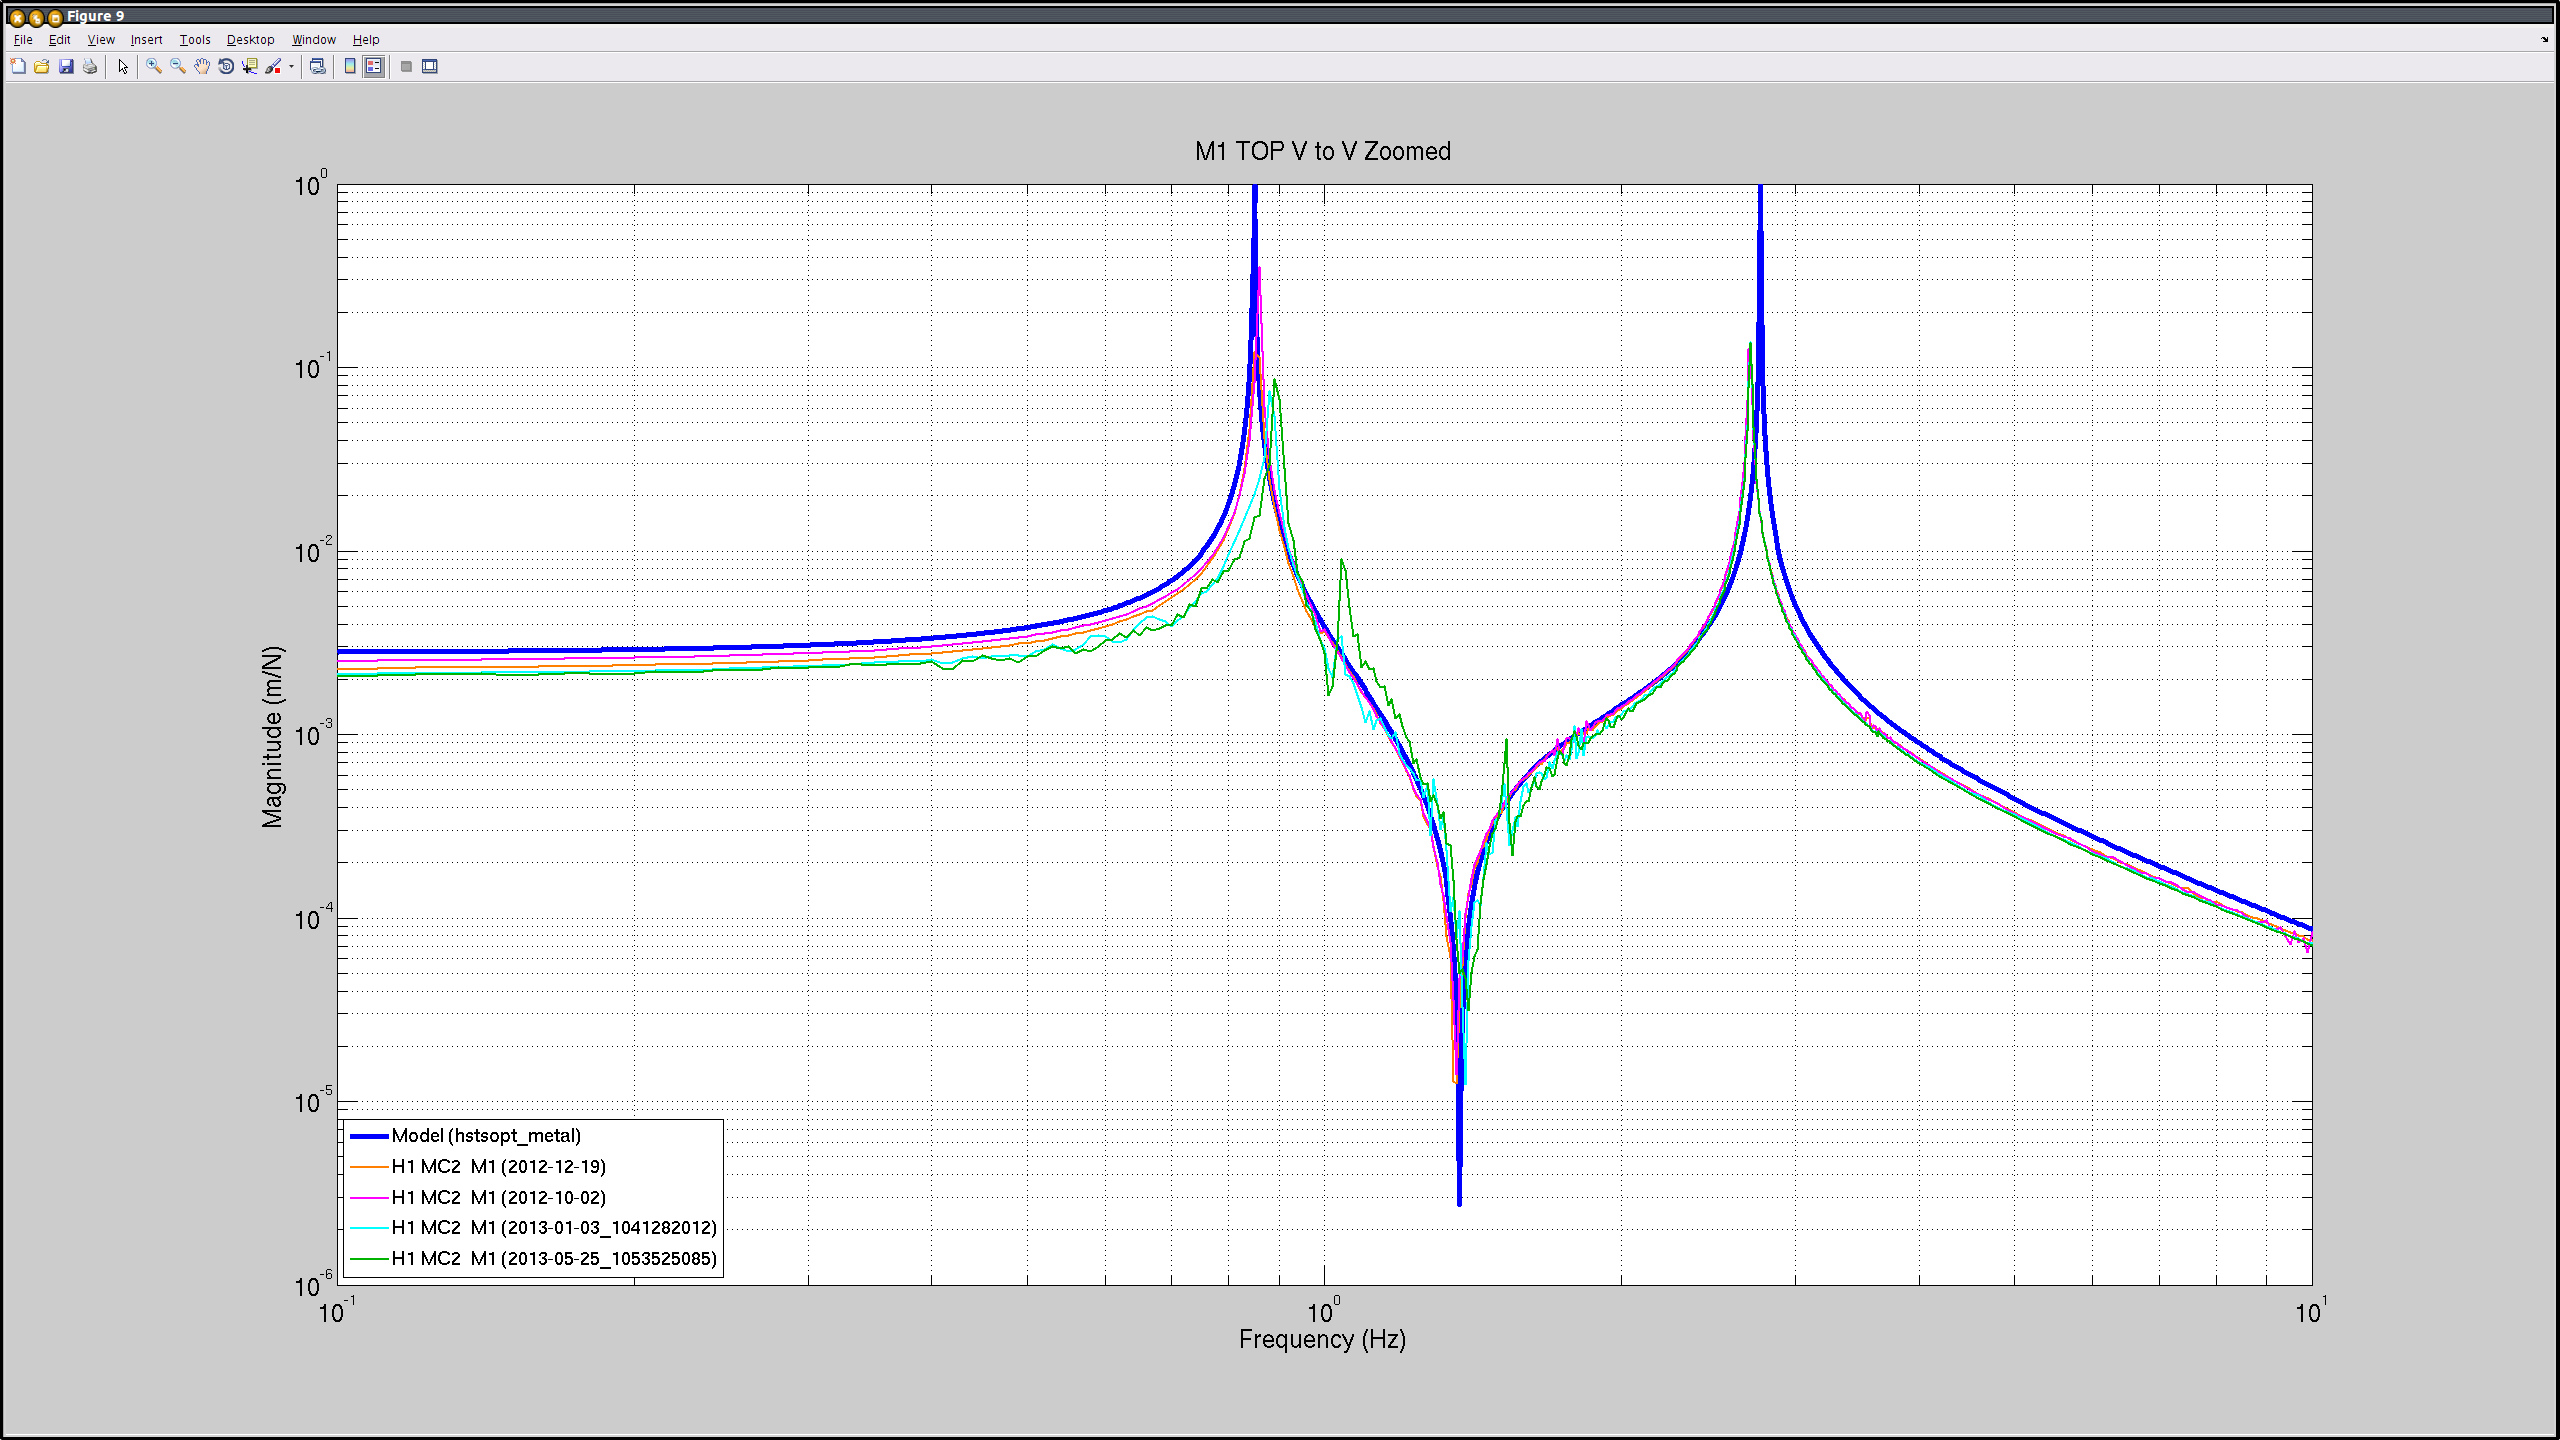
MC2 (allhsts_2013-05-29_Phase3b_H1MC2_ALL_TFs.pdf)
- model in blue
- phase 3b on january 2013 with ISI unlocked and suspension undamped in orange
- phase 3b on may 2013 with ISI damped and suspension undamped in pink
- phase 3b on may 2013 with ISI damped and suspension damped in cyan
MC3 (allhsts_2013-05-29_Phase3b_H1MC3_ALL_TFs.pdf)
- model in blue
- phase 3a on march 2013 with ISI locked and suspension undamped in orange
- phase 3b on may 2013 with ISI damped and suspension undamped in pink
- phase 3b on may 2013 with ISI damped and suspension damped in cyan
files and data have been commited on the svn under the following directories :
/ligo/svncommon/SusSVN/sus/trunk/HSTS/Common/{MatlabTools/Data}
/ligo/svncommon/SusSVN/sus/trunk/HSTS/H1/${MC1/MC2/MC3}/SAGM1/${Data/Results}

All of those top stage transfer functions look good.
The only thing to note is that MC2 has its pitch (1Hz) and roll modes (1.5Hz) coupled into the vertical mode as seen on the 3rd page of the 2nd pdf. It is significantly reduced by the damping
This coupling increased after pump down (orange/pink vs cyan/green).