Ibrahim A, Oli P, Mark B, Betsy W
Context:
M3 on the beam splitter has secondary prisms that are placed along the barrel below the primary prisms. These secondary prisms are placed at a location below the primary prism, and if placed in the correct spot, act as a clamp, damping the oscillations moving down the wire loop into the optic. We've been working on finding the optimal secondary prism position for the BBSS.
Experiment:
The experiment for determining this position was developed for the BSFM in 2011(T1100086), and we used a similar setup for our three (successful) runs for the BBSS. This is basically how the experiment is set up to work:
- A biased solenoid is placed a few millimeters away from one of the M2-M3 loop wires. The solenoid is driven at the wire’s predetermined resonance frequency using a waveform generator.
- The wire goes from M2 down through M3’s fixed primary prism and (the reason for this experiment) moveable secondary prism.
- Phonograph needle is rested on wire below the secondary prism and the other end is connected to a spectrum analyzer. Five FFT averages are taken to give us an attenuated peak at the resonant frequency. This is a reading. We took 4/5 measurements for each location, where each measurement consisted of five 8-second averages.
- We move the prism down by a millimeter or two and take more readings.
- From the results, we determine the lowest amplitude peak/highest attenuation and note the prism position.
- This becomes the new BBSS secondary (glued on) prism position.
Results + Commentary:
Note: Mark has an upcoming alog about the run of data and issues that we took when he was here, but in LESS IMPORTANT Auxiliary Investigations we will be focusing on the data from the second and third runs, but here in the results will still be showing the data we got with him.
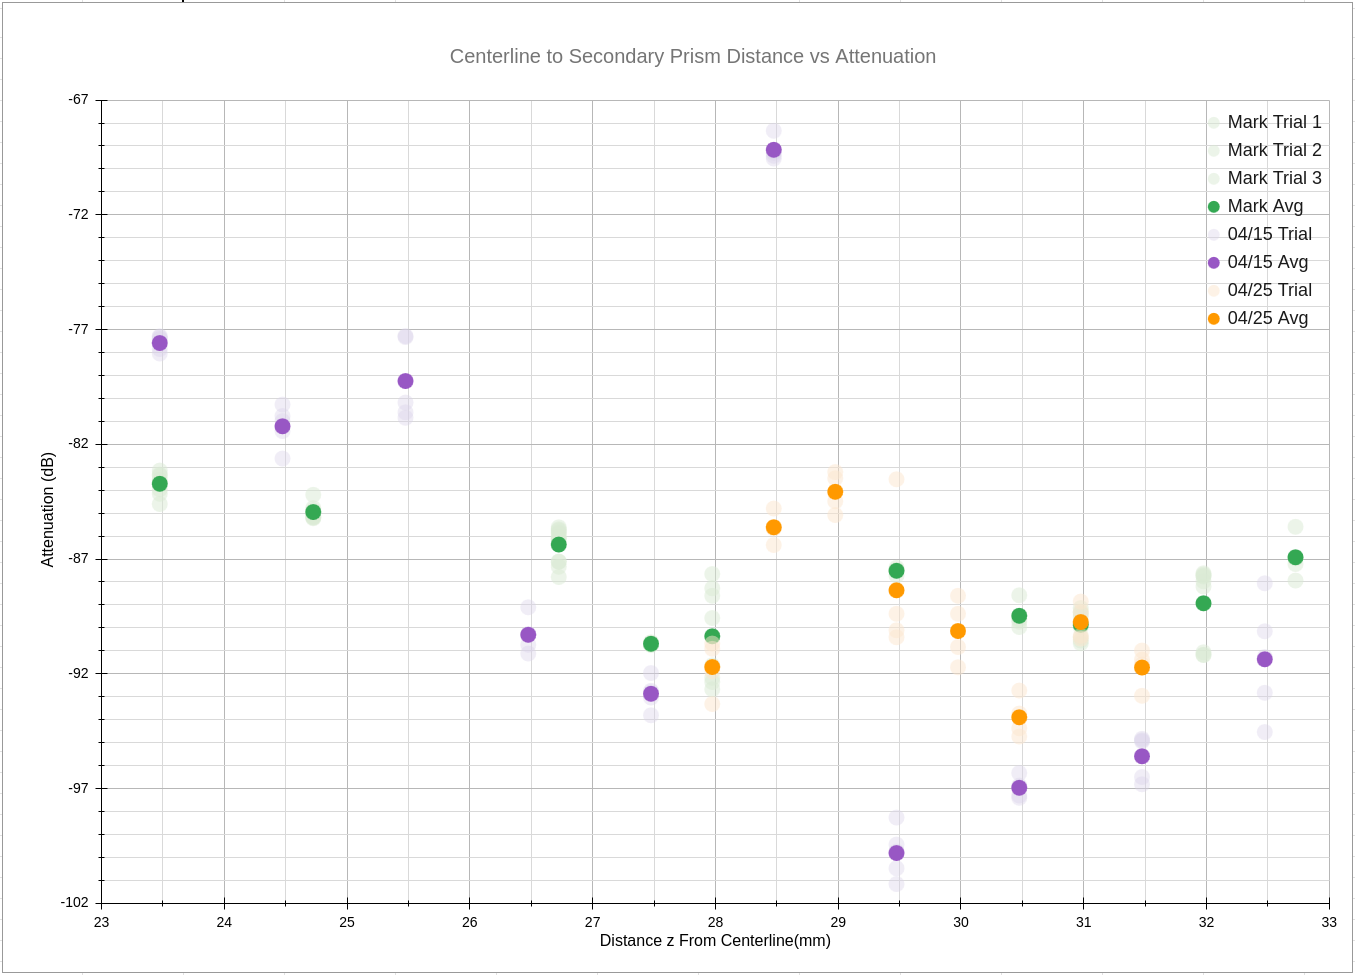
The plot attached shows the attenuation measured versus the position (positive distance relative to the mass’ centerline) of the secondary prism. Each color is a separate run, and the more negative the attenuation, the quieter the reading was, so we are looking for a location with the lowest values where the secondary prism would do the most damping.
We found that there is a region between ~29.00mm and ~31.5mm below the horizontal center of the mass where the amplitude is minimized. There are approximately three anomalous data points in between, with one confirmed being due to cross-coupling of above wire. As of now, we’re still working on understanding this data and have spoken to Mark B and Jeff K about how we can go about accurately interpreting the raw data (including essential questions about the calibration and setup. See below.)
LESS IMPORTANT Auxiliary Investigations - Details, Details, Details
Read for Clues/Hints (things we noticed, changed etc.):
- Mass Locking: When Mark Barton was at LHO, we “almost locked” the Test Mass in order to help damp any motion that we caused when we adjusted the experiment for a new reading. This locking was not meant to take the load off the wires but we realized that given differing amounts of “just touching”, our attenuation amplitudes changed by over 20dB systematically. Importantly, the attenuation difference did not change the resonant frequency, which is what really matters. Given this, we proceeded with an “almost locked” Dummy Test Mass.
- Cross Coupling: The expected behavior for this experiment is that there is a minimum/dip in the resonant frequency amplitude where we can optimally glue the secondary prism. At certain positions along this trend however, we noticed a marked and visible vibration in the wire. Upon further investigation, we found that the wire segment directly above it (Top Mass - PUM) was also visibly vibrating. Upon meeting with Mark and checking records, we found that this was more than likely an nth harmonic of that upper wire causing cross-coupling. Thus, these “anomalous” positions should be avoided.
- Needle Changes: One of the three data sets we have was taken with a different needle because the one used for the first run had broken, and we had another needle become permanently cocked out of place and give us erroneous readings before we swapped the needle again and were able to get a good second and third run. We took “no contact” or noise floor measurements for each new needle. The noise floor measurements for each run were taken and we are working on calibrating the two needle sensitivities to better represent our data.
- Needle Touching: We tried to see if there was an effect in noise with the needle touching head on vs. on the side of the wire. We found that while the location of the needle on the wire didn’t really matter, the amount of tension between the needle and the wire does add some damping to the wire. As such, we attempted to ensure that the needle was resting on the wire rather than applying any force to it. We also tried to replicate the location/contact area of the needle for consistency.
- Cable Changes: We noticed that moving BNC cables too close together or having them sway in the cleanroom air contributes to noise. To tackle this, we used small weights to secure them to the ground and separated them as much as possible.
- Solenoid Distance Changes: For unknown reasons, and despite our wave function generator having the same output throughout, the wire would vibrate visibly at certain times than others for the same frequency. After playing with certain distances, we landed on the original 2.5mm for the sake of consistency. An effect we did notice is that if the solenoid was actuating too strongly, it would move the wire laterally back and forth with some oscillatory behavior. This would move the entire mass. At our 2.5mm, we tried to ensure that the wire was still visibly vibrating but not so much as to cause translation movement in the masses or the wire.
- Resonant Frequency Experimentation (Largest Persistent Confusion):
- Mark gave us this suggestion to see the effect of frequency changes on the wire for different prism positions. We realized that when we sweep the frequency over +-2Hz, there was definitely more oscillation in some points than others. This was the case for each position we tried. I.e. The resonant frequency of the wire changed slightly as the prism moved down (and even just with a prism in vs. without), and as such, the actuation frequency from the solenoid was not (and could not have been) exactly at the resonance of the wire.
- What is confusing to us here is that if the entire point of the experiment is to shake the wire by some constant amount to measure the attenuation below the prism, how can we be sure that this attenuation is maximized if the amount that the wire is shaken changes and in fact, depends on the prism position? (by virtue of the res. Freq. moving slightly by each move).
- E.g. At position 16, the wire was vigorously shaking (due to coupling) so obviously our reading was just … louder.
- E.g. At position 18, the wire was so far away from the attenuation frequency that it was not moving at all so obviously our reading was just … quieter. We spanned the frequency at the same actuation strength and found that the resonant frequency had moved all the way from 303 to 307 Hz - so obviously the wire isn’t resonating/shaking things as much.
- We tried taking readings where we just match the visible vibration at each prism point but quickly realized that this would just yield us the same results each time because it tells us nothing about the attenuation of the actual resonant frequency we want to damp just how good this prism system was at damping any vibration.
- With 2 needles, this effect would be negated because we could just take signal A and signal B and compare the attenuation before and after the prism. We have the tools for this if it is worth doing.