jeffrey.kissel@LIGO.ORG - posted 14:28, Monday 17 March 2014 - last comment - 19:33, Monday 17 March 2014(10795)
March at LHO: In like a Lion, out like a Lion, and a Lion in the Middle
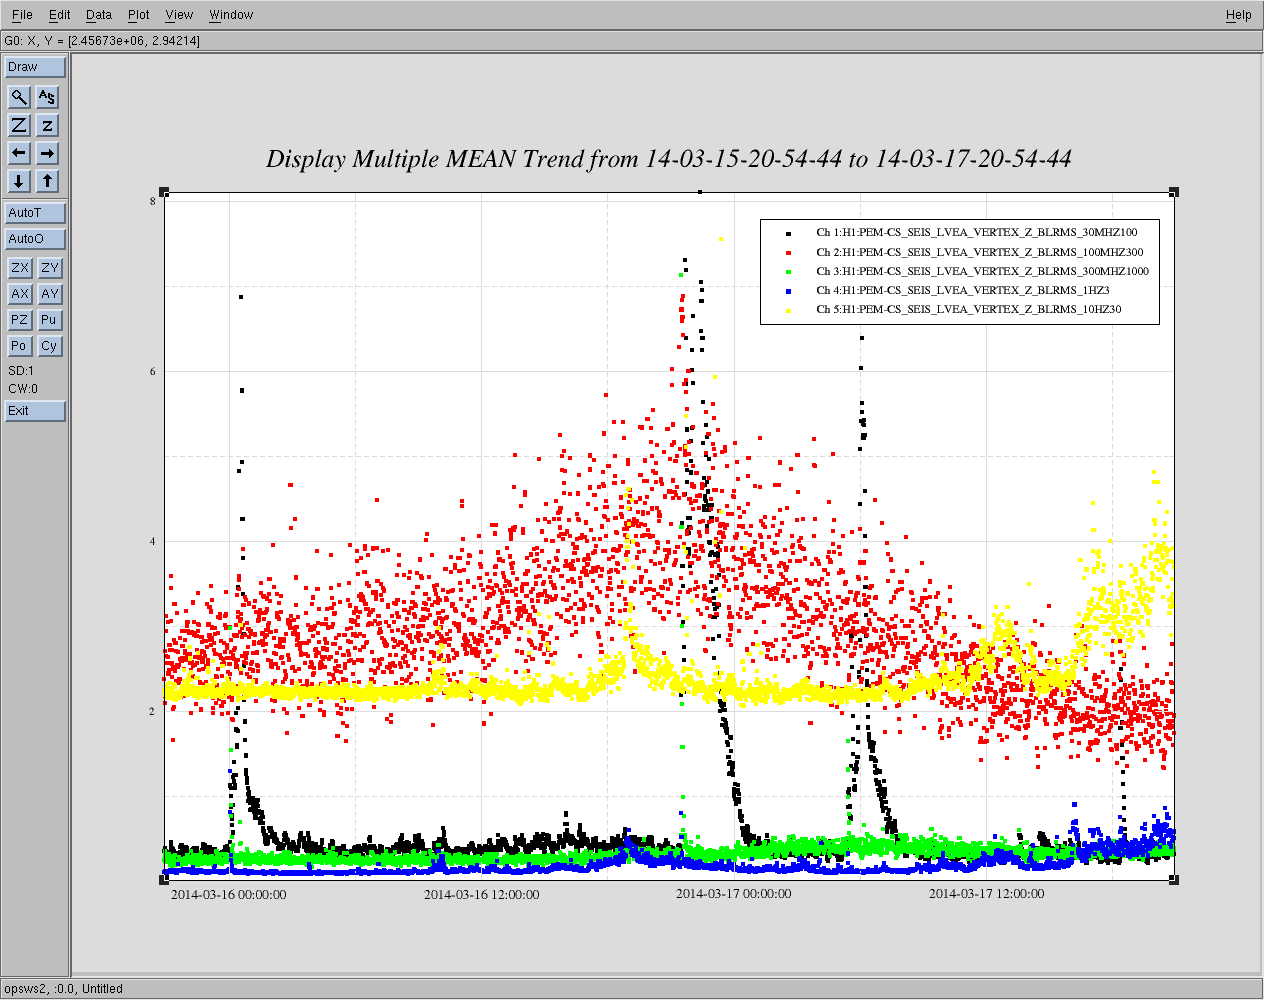
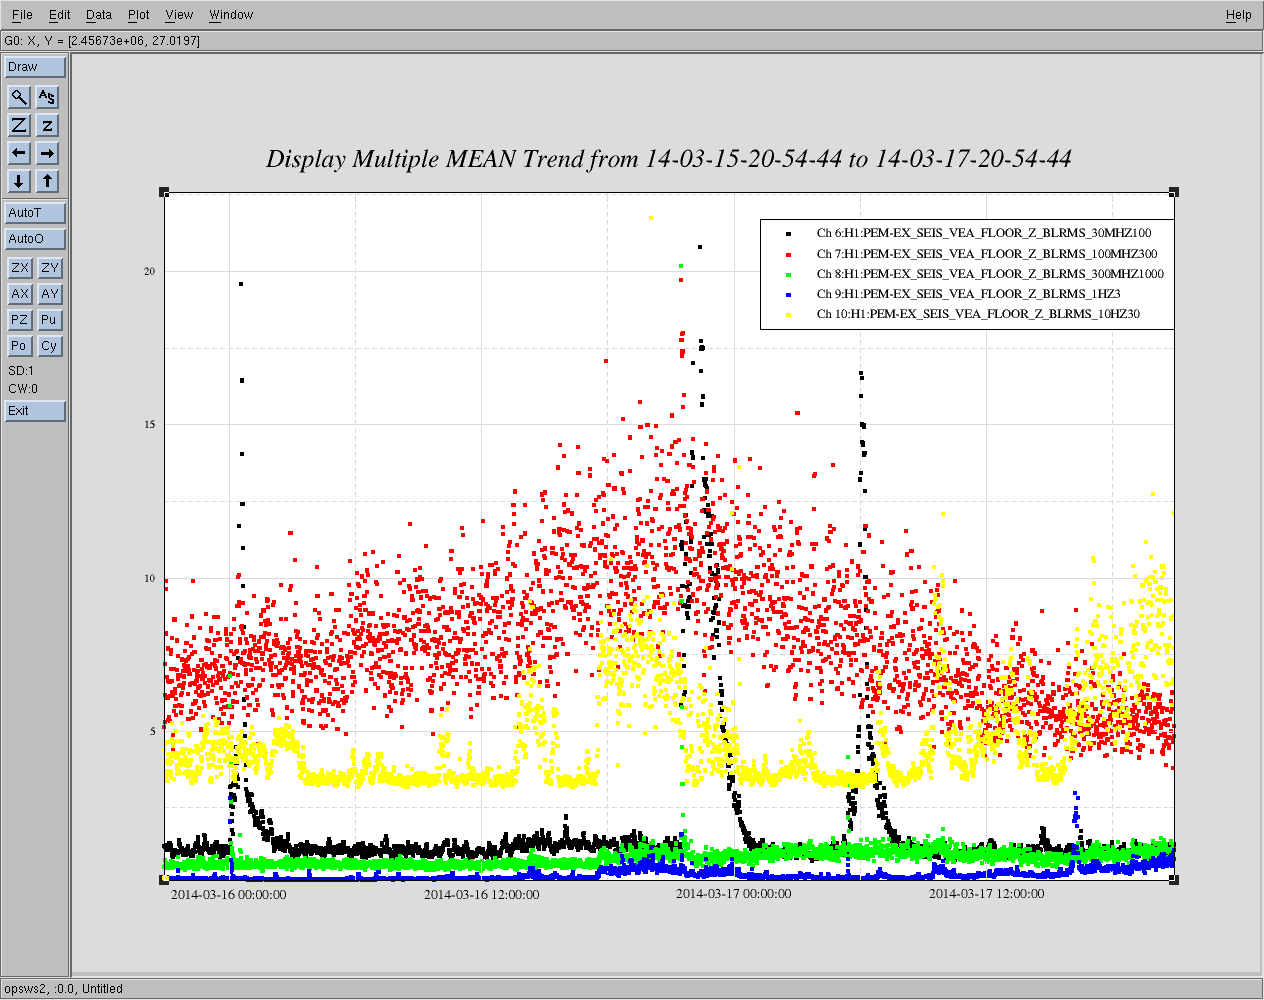
J. Kissel

We're really getting pummelled by ground motion, especially the past few days. I attach plots of the band-limited RMS in the Z direction of PEM ground inertial sensors in the corner station and the X end station over the past 48 hours. We've been hit by earthquakes (in the 30-100 [mHz] band), high-micro seism from windstorms and spring ocean activity (in the 100-300 [mHz] band), and gusts of wind and anthropogenic noise (in the 1-3 and 3-10 [Hz] bands). I think this is an excellent representation of why we've had so much trouble trying to find a configuration of the isolation systems that "just works" -- the characteristics of the input motion radically change constantly on a ~3-hour timescale. Not to mention there are times (like in the middle of the plot, 2014-03-16 21:50 UTC) where the earth is just down right angry with all three bad things at the same time.

I apologize for the ambiguity in calibration, I have an email out to Robert asking the proper calibration into physical units. The FOMs with these channels on the wall suggest that the channels are calibrated into "[decaum/s]" in the frames (which I think is 10 * 1e-6 [m/s]) but with no calibrations in the DMT template (and none on the data viewer trace, obviously), I get different numerical values. pem.ligo.org suggests that both the corner-station and endx should be 0.0076e-6 [m/s]. I think whatever units they are, they're at least self-consistent. I'll take spectra at choice times to gather the diversity; stay tuned.
Images attached to this report
Comments related to this report
Here're the promised, associated spectra. I attach an annotated version of the BLRMS too, with vertical lines demarcating the UTC time in the same colors as the traces on the spectra.

As indicated by the legend, I chose representative times that reflected the variety of ground motion:
2014-03-16 15:45 UTC - High micro-seism
2014-03-16 18:05 UTC - High micro-seism + Gusty Wind
2014-03-16 21:45 UTC - High micro-seism + Large Earthquake, in Chile + Gusty Wind
2014-03-17 05:50 UTC - Medium micro-seism + Cluster of Small Earthquakes (Chile, Again in Chile, Philippines, Puerto Rico, and Mexico, at magnitudes 6.2, 5.0, 5.1, 3.0, and 2.8 respectively).
2014-03-17 18:45 UTC - Low micro-seism + Gusty Wind

Notes:
- While we don't necessarily expect to be able to stay up during large earthquakes, it's good to see a sort of upper bound, and the contrasting color of the ground motion as it fills in the 30 to 100 [mHz] band.
- It's interesting to see that during periods of high microseism, the peak at 55 [mHz] seems to be present regardless of whether the winds are gusting or not (comparing BLUE and RED) .
- Further, there exists times (i.e. MAGENTA) where there is lots of gusting winds, but the microseism is relatively low.
- Most importantly we see that ground is sort of oscillating between requiring more isolation in the 30 to 100 [mHz] band and in the 1 to 10 [Hz] band.
- The variations in the 30 to 100 [mHz] band can be as much as a factor of 100 during earthquakes, but not too much change between windy and not windy, maybe at most a factor 5 in a small range between 40 and 80 [mHz].
- There's very little to no change in the region of the lowest SUS resonances between 0.2 and 0.6 [Hz] between all of these seismic bad times
- Naturally, gusty wind times are the worst at high frequency, but again the variation is only a factor of 3 to 4. We should be able to ride this out.

Let's see what the HEPI L4Cs say, maybe the gusts have an interesting affect playing with the pier flag poles.
Non-image files attached to this comment

J. Kissel

Here're the HEPI L4Cs for each of the times described above. While they show the same sort of variety at the microseism and below (where they can sense the ground motion above their self-noise), the most interesting is how much more varied the tilt spectra are (in this case RY) in the 0.3 to 1 [Hz] band -- exactly where the translation degrees of freedom claim there's very little difference. And naturally the ITM reacts differently than the ETM, just to make things difficult.

For ITMX, both high microseism conditions and gusty wind show elevated tilt in the 0.3-1 [Hz] band, by about a factor of 10. Only the during the medium microseism + small earthquakes did the L4C hit it's (tilt) noise floor.

For ETMX, there's quite a variety, with gusty winds alone being the worst-case scenario.

But the moral of the story is that, where translation degrees of freedom get tossed around by an order of magnitude between 0.03-0.3 [Hz] and 1-10 [Hz] during these excurisions, the tilt fills in the 0.3-1 [Hz] gap with its own order of magnitude variation, and as we know *both* tilt and translation of the table affects the optics just about equally.

So -- if we want to operate the isolation systems during these 90th percentile times, we're gunna have a lot of automation and blend tailoring to do, but just increasing the blend frequency won't necessarily win. Further, when we *do* #movetheblendup, the green still can't handle the loss in performance.
Non-image files attached to this comment
The data for the above measurements can be found in the following templates:
/ligo/svncommon/SeiSVN/seismic/BSC-ISI/H1/Common/Data/
2014-03-16to17_GroundMotion_ASDs.xml
2014-03-16to17_HEPIPierMotion_ASDs.xml

There's way to many curves for me to export, but all curves shown are stored as references so you can export them at your leisure and use them in any models.
                          Ground Motion           Pier Motion
2014-03-16 15:45 UTC       Ref.   0-11            Ref.  0-23
2014-03-16 18:05 UTC       Ref.  12-23            Ref. 24-47
2014-03-16 21:45 UTC       Ref.  24-35            Ref. 48-71
2014-03-17 05:50 UTC       Ref.  36-47            Ref. 72-95
2014-03-17 18:45 UTC       Ref.  48-59            Ref. 96-119

All plots and templates are committed to the repository as of this entry.