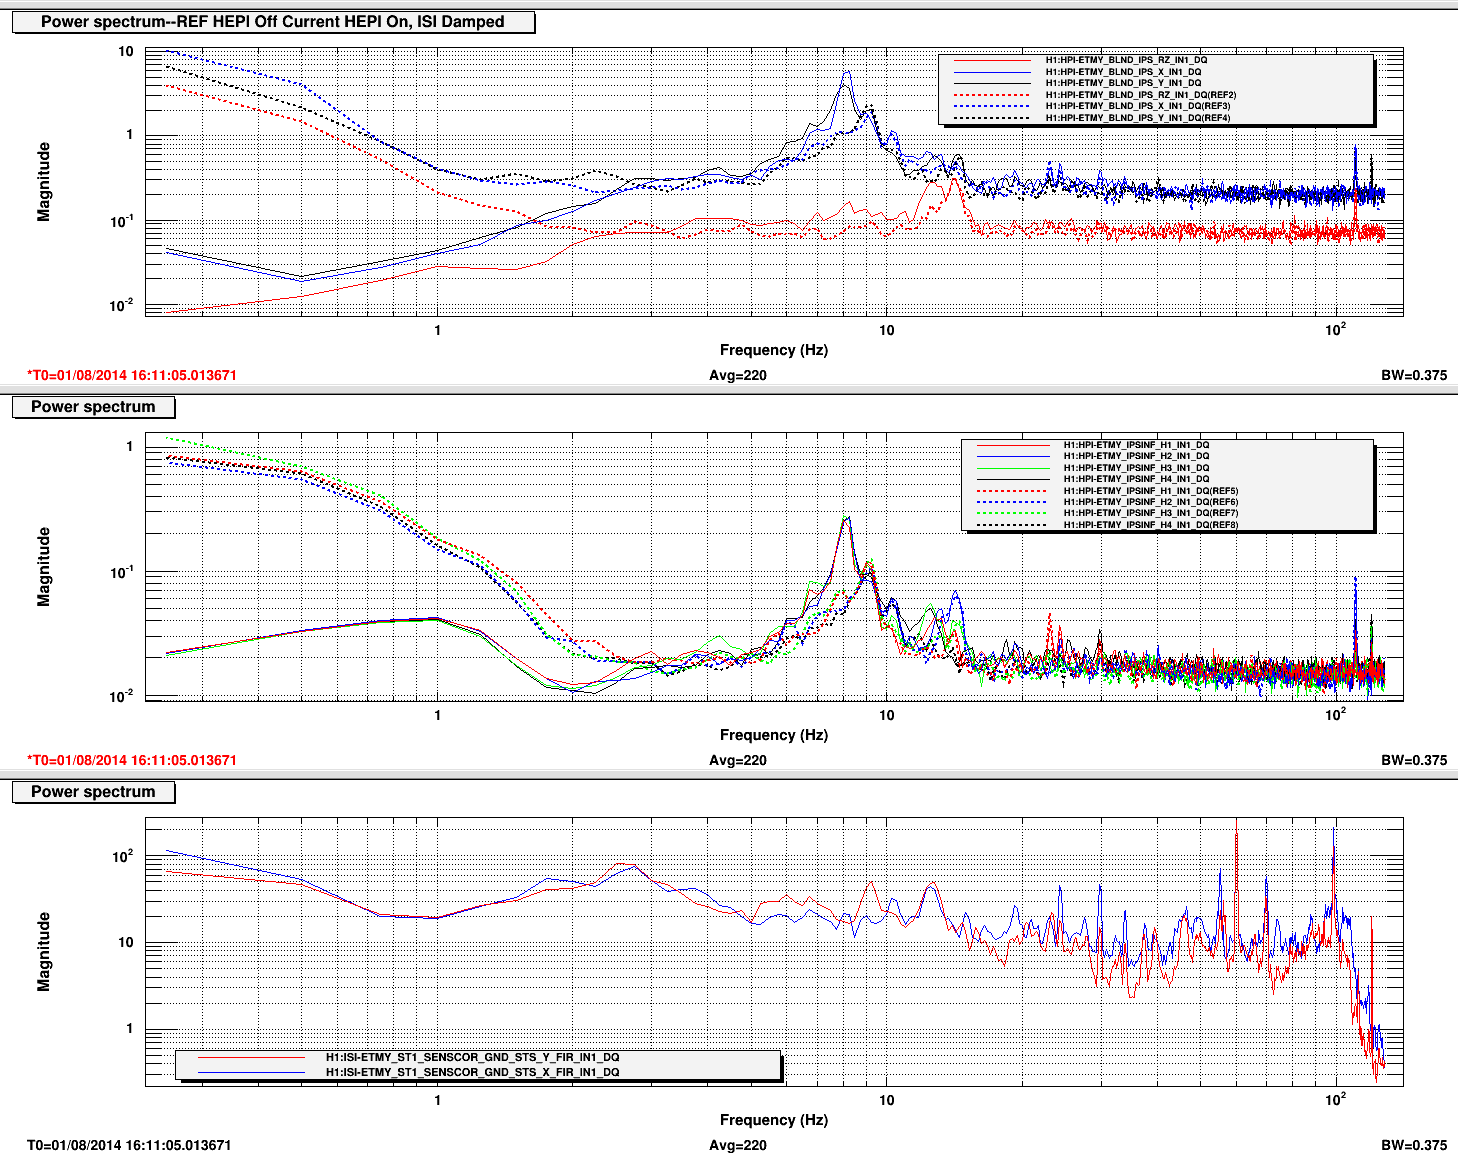
This plot is interesting. It seems the only moderately pronounced peak in the horizontal ground spectrum wanders, seen from 8 to 11hz changing quite rapidly.
The attached plot's current traces are with HEPI loops closed and the ISI Damped. While the middle graph shows all four local IPSs have the strong 8hz peak (the dashed REFs are with the HEPI loops open), the peak only shows in the X & Y and not the RZ cartesian traces (top graph). Also, note the bottom graph where the ground sensor pretty much has nothing at 8hz but does have a minor peak just above 9hz that is also peaking up in the local sensors.
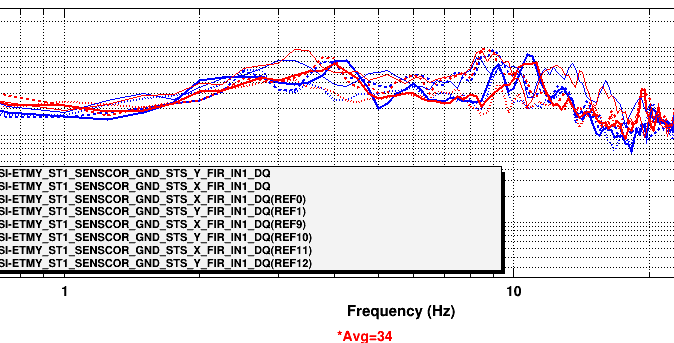
The second plot shows just the ground Seismometer with X & Y traces from last night (Dashed) and the others from this morning. The peaks in that area come and go and wander around so it may or may not be a problem or just a red herring (are those edible?)
I am attaching the spectrograms for the X, Y, and Z directions of the STS Seismometer in ETMY.
I used 19 continuing hours, starting 2014-07-22 01:00:00 UTC.

There is a feature that is present all the 19 hours:
Around 10.5 Hz  in X direction.
Around 9 Hz in Y direction.
Around 10.5 Hz in Z direction.

More features can be seen wandering along the 19 hours around 3-5 Hz and 8-10 Hz, for X, Y, and Z directions.

In the spectrograms, each count is 1 nm/s /sqrt(Hz).
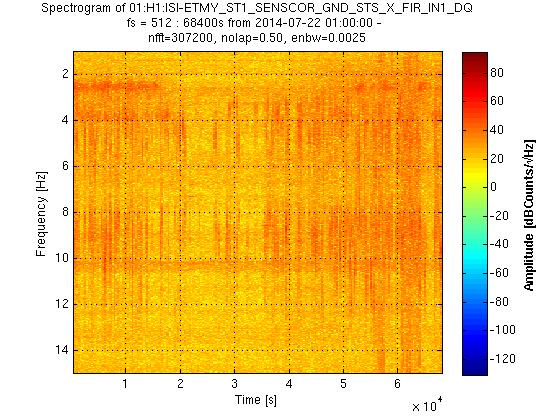
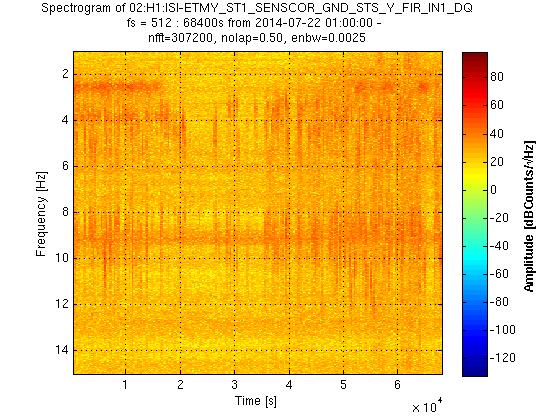
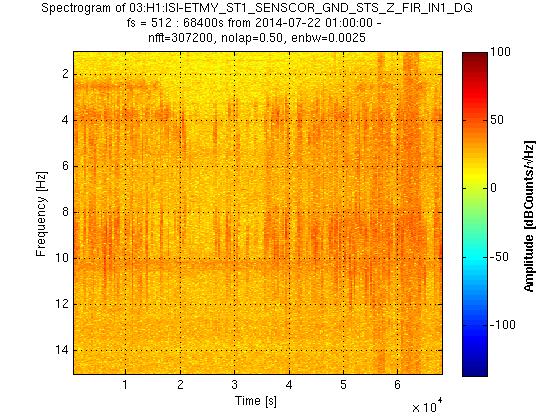
Continuing with the investigation on the 8 Hz, I am attaching the spectrograms for the X, Y, and Z directions of the GND STS in EY.

Comments on the spectrograms:
- Feature wanders between 7.5 to 12.5 Hz.
- Depends on the time of the day.
- It is present every 15 to 30 minutes.
- Displacement amplitude higher than 2 nm.

6 hrs were used for each spectrogram, starting:
- August 01, 2014 00:00:00 UTC (Figure 1)
- August 01, 2014 06:00:00 UTC (Figure 2)

The 8 hz motion seen here is most likely related to the "pier resonance"
Laura Nutall has a nice set of plots in the DCC https://dcc.ligo.org//LIGO-G1400820
which show this motion.
Likely you are seeing the floor component of this motion. Rich M. has data showing that (at MIT) the slab bending is an important component of this motion
I investigated the GND SDS and PEM MIC channels using the coherence tool at 100mHz bandwidth and found several peaks between 5 and 9 Hz. I've attached some slides with zoomed-in plots.