Borja
It has taken me quite a long time to process all the data I had on the several experiments that were run at ETMX as suggested on my previous Log. It is late already and I still have to think about how to plot all the data in a more friendly way (probably tomorrow). But here goes a quick update.
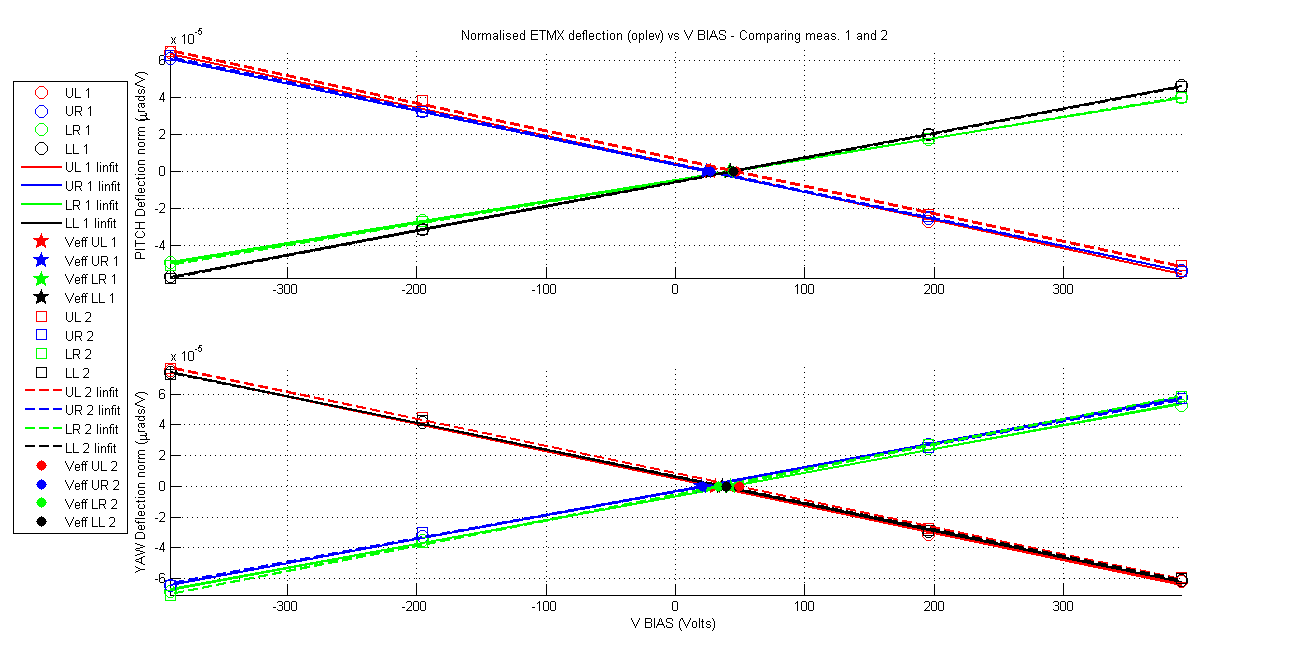
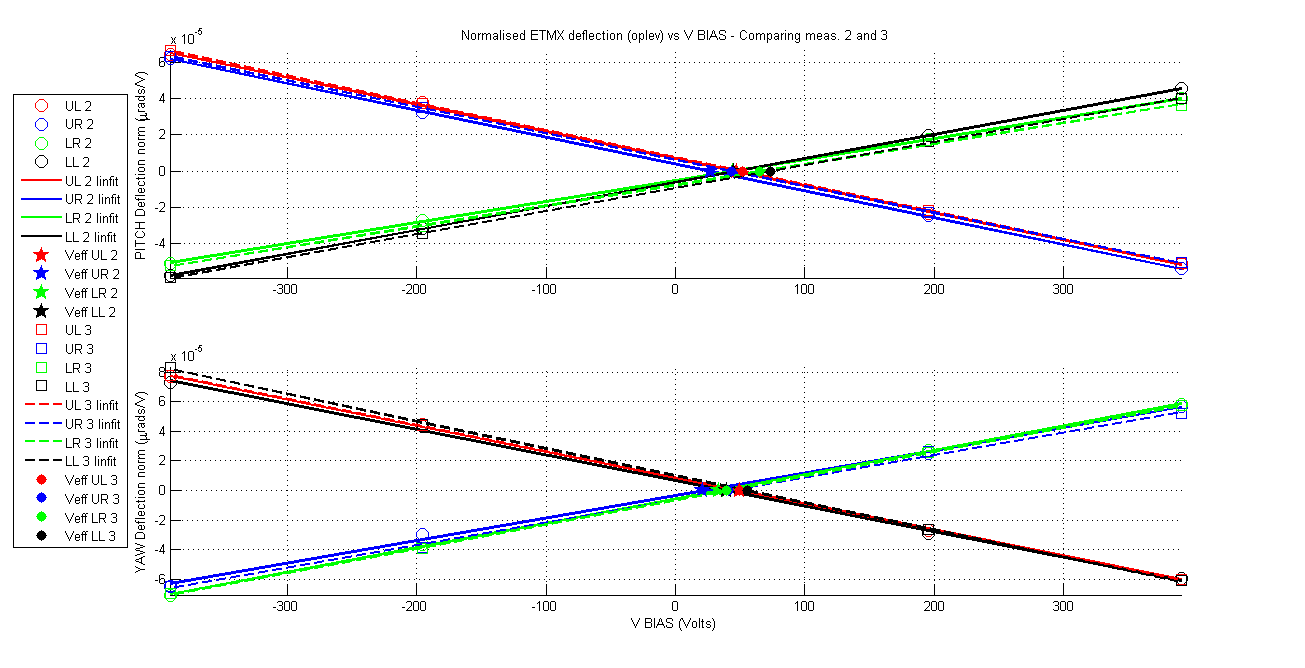
As a reminder, ETMX charge measurements showed relatively small effective BIAS voltages which translates into relatively low charge. This charge probably were left overs from the process of removal of the "first contact" 1 month ago when End X was vented. Several charge measurements taken over a period of 4.5 days showed consistent charge values (within 25Volts or so) in all quadrants in pitch and yaw as shown in the next table:
|
|
UL - 1 |
UL - 2 |
UL - 3 |
UR - 1 |
UR – 2 |
UR - 3 |
LR - 1 |
LR - 2 |
LR - 3 |
LL - 1 |
LL - 2 |
LL - 3 |
|
Veff PITCH [V] |
27 |
47 |
52 |
24 |
27 |
43 |
42 |
44 |
65 |
42 |
45 |
73 |
|
PITCH slope [10-7 µrad/V] |
-1.5217 |
-1.4957 |
-1.5087 |
-1.4697 |
-1.4823 |
-1.4598 |
1.1381 |
1.1597 |
1.1450 |
1.320 |
1.3208 |
1.2718 |
|
Veff YAW [V] |
31 |
50 |
50 |
20 |
21 |
41 |
43 |
33 |
39 |
36 |
40 |
56 |
|
YAW slope [10-7 µrad/V] |
-1.7726 |
-1.7629 |
-1.7780 |
1.5631 |
1.5270 |
1.5215 |
1.5498 |
1.6476 |
1.6333 |
-1.7523 |
-1.7287 |
-1.8404 |
ETMX was an ideal test bed because I saw no issues with the wiring (all quadrants could be driven) and there were no illuminators On, the ion pump had the gate valve closed and the only known charger that was active (for a long time) was the cold cathode at the top of the ETMX chamber. Although the consistency of values above may discard it as an effective charger for the test masses. Two main charge experiments took place with mass in the last few days:
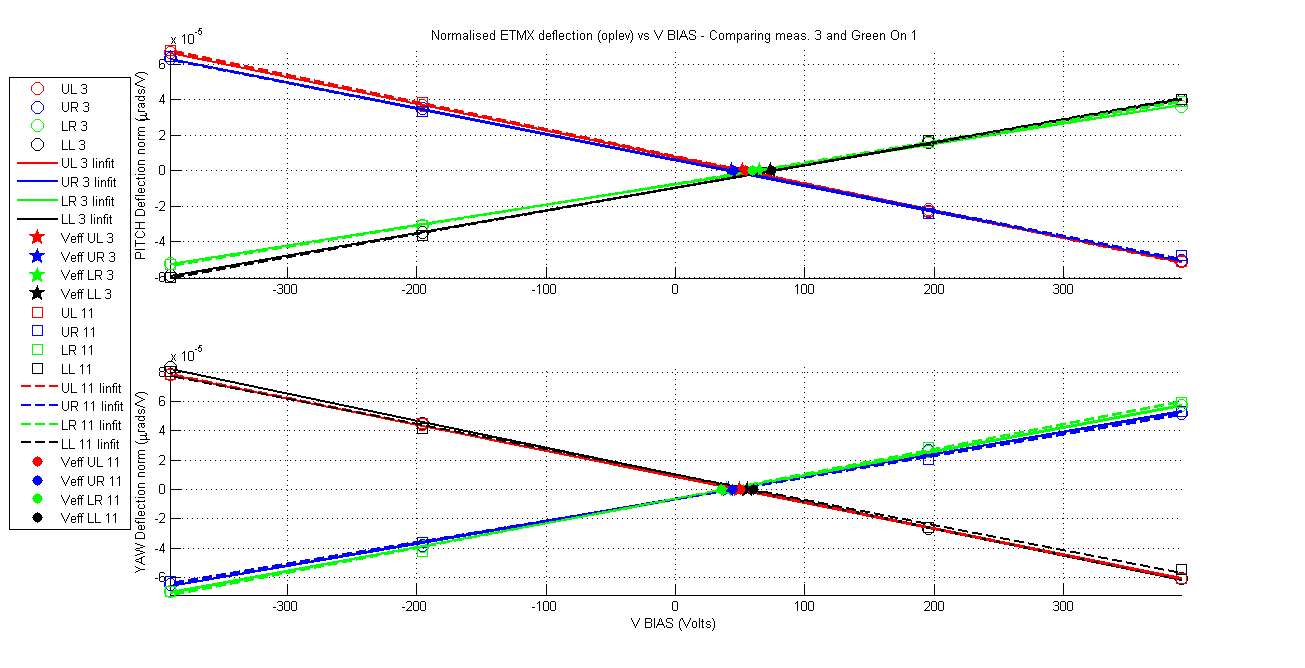
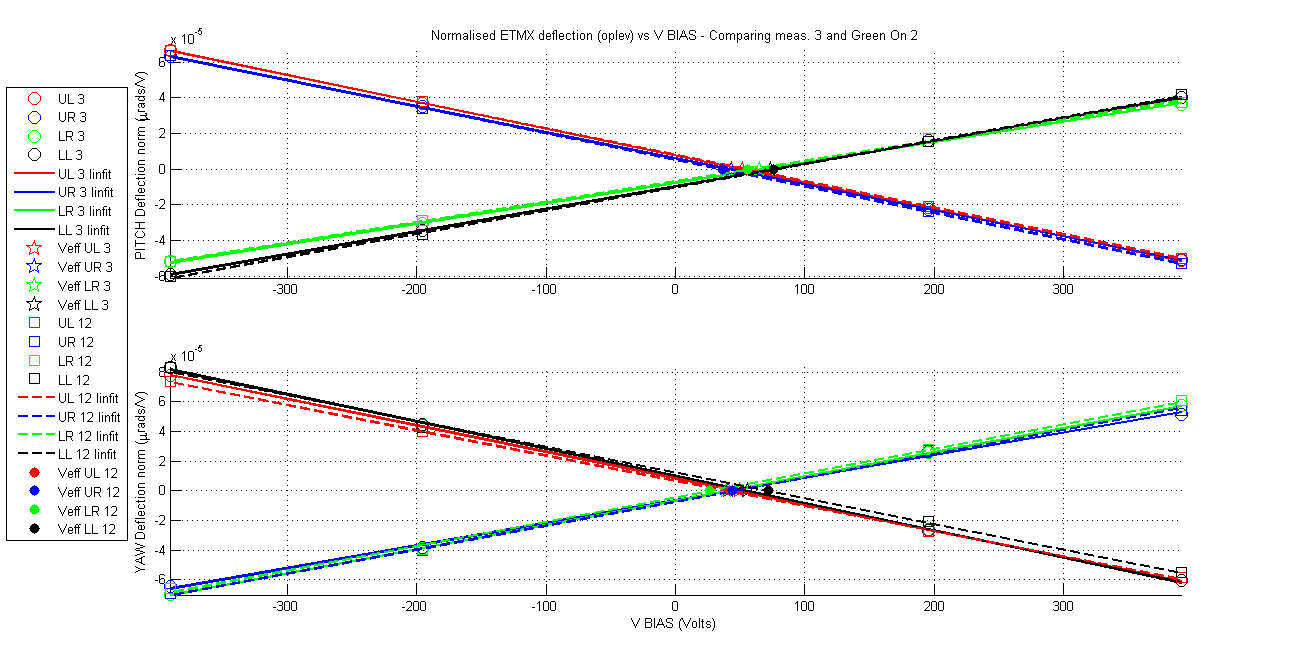
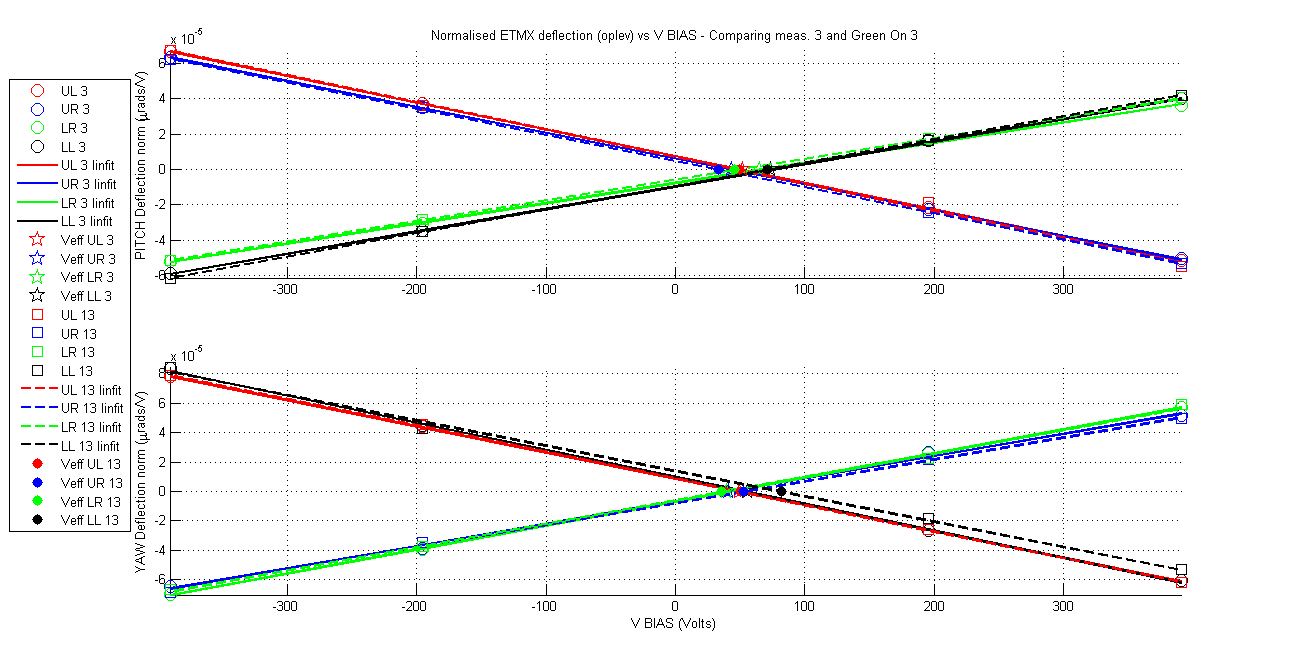
1) Green light charge effect: Between UTC 2014-08-20 23:00:00 and UTC 2014-08-22 20:45:00 the green laser was turned on at ETMX at a maximum power of 57.5mW going into the periscope which translated to 46mW actually hitting the test mass. This is a factor of 4.5 below the expected resonant power during future normal operation of aLog (about 35mW from laser into ETM and with a finesse of 12 it means a power build up of 6) but it is the maximum I could get from the laser. Here is the summary of the measurments that took place for an interval of 46 hours. It is clear that no charging trend is observed and the change in effective voltage of less than 20V is within the normal deviations of the measurement method accuracy. The fact that green light does not seem to charge the mass is certainly good news.
|
|
UL - 11 |
UL - 12 |
UL - 13 |
UR - 11 |
UR – 12 |
UR - 13 |
LR - 11 |
LR - 12 |
LR - 13 |
LL - 11 |
LL - 12 |
LL - 13 |
|
Veff PITCH [V] |
54 |
56 |
49 |
45 |
36 |
34 |
60 |
56 |
46 |
74 |
75 |
71 |
|
PITCH slope [10-7 µrad/V] |
-1.5323 |
-1.4900 |
-1.531 |
-1.4399 |
-1.4847 |
-1.4790 |
1.1846 |
1.1536 |
1.1701 |
1.2979 |
1.3075 |
1.3217 |
|
Veff YAW [V] |
50 |
41 |
50 |
44 |
44 |
53 |
36 |
26 |
35 |
60 |
72 |
82 |
|
YAW slope [10-7 µrad/V] |
-1.7868 |
-1.7005 |
-1.8022 |
1.4754 |
1.6140 |
1.4918 |
1.6887 |
1.6420 |
1.5905 |
-1.7231 |
-1.7344 |
-1.7184 |
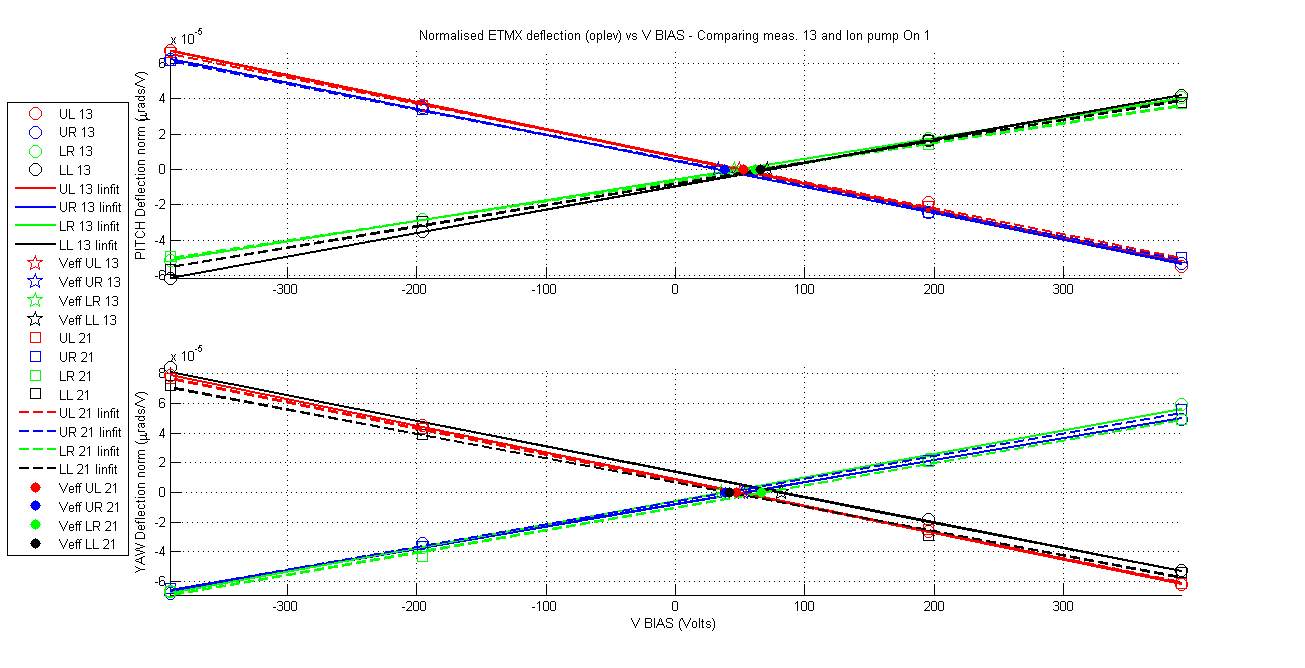
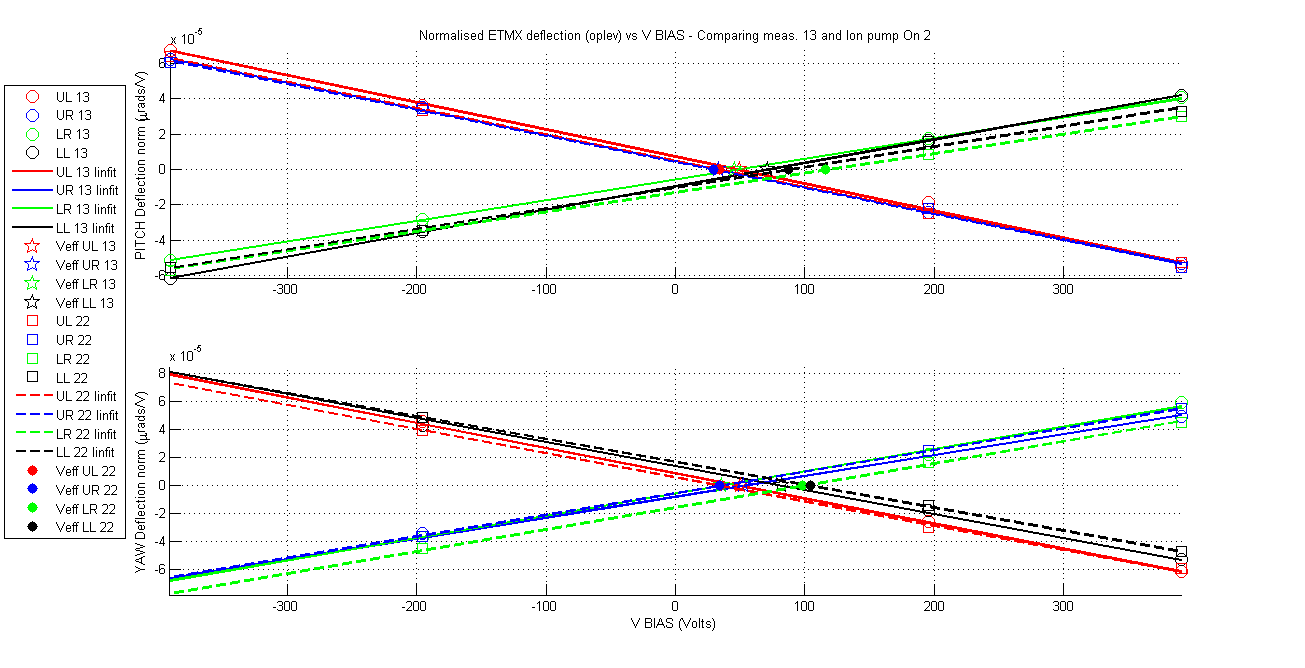
2) Ion pump charging effect: After the green light was turned off in End-X, we opened the gate valve of the ion pump to see its charging effect, the gate valve was opened at about UTC 2014-08-22 20:40:00 and again we measured three times for an interval of 37 hours. The summary table is given next:
|
|
UL - 21 |
UL - 22 |
UL - 23 |
UR - 21 |
UR – 22 |
UR - 23 |
LR - 21 |
LR - 22 |
LR - 23 |
LL - 21 |
LL - 22 |
LL - 23 |
|
Veff PITCH [V] |
53 |
34 |
56 |
37.5 |
29 |
46 |
62 |
116 |
55 |
66 |
87 |
73.5 |
|
PITCH slope [10-7 µrad/V] |
-1.478 |
-1.4889 |
-1.4727 |
-1.4403 |
-1.4715 |
-1.4265 |
1.1073 |
1.0992 |
1.0760 |
1.2048 |
1.1582 |
1.2074 |
|
Veff YAW [V] |
47 |
34 |
64 |
39 |
34 |
37 |
67 |
98 |
61 |
42 |
104 |
60 |
|
YAW slope [10-7 µrad/V] |
-1.7636 |
-1.7234 |
-1.7046 |
1.5308 |
1.5451 |
1.5446 |
1.5125 |
1.5742 |
1.5275 |
-1.6396 |
-1.6419 |
-1.6559 |
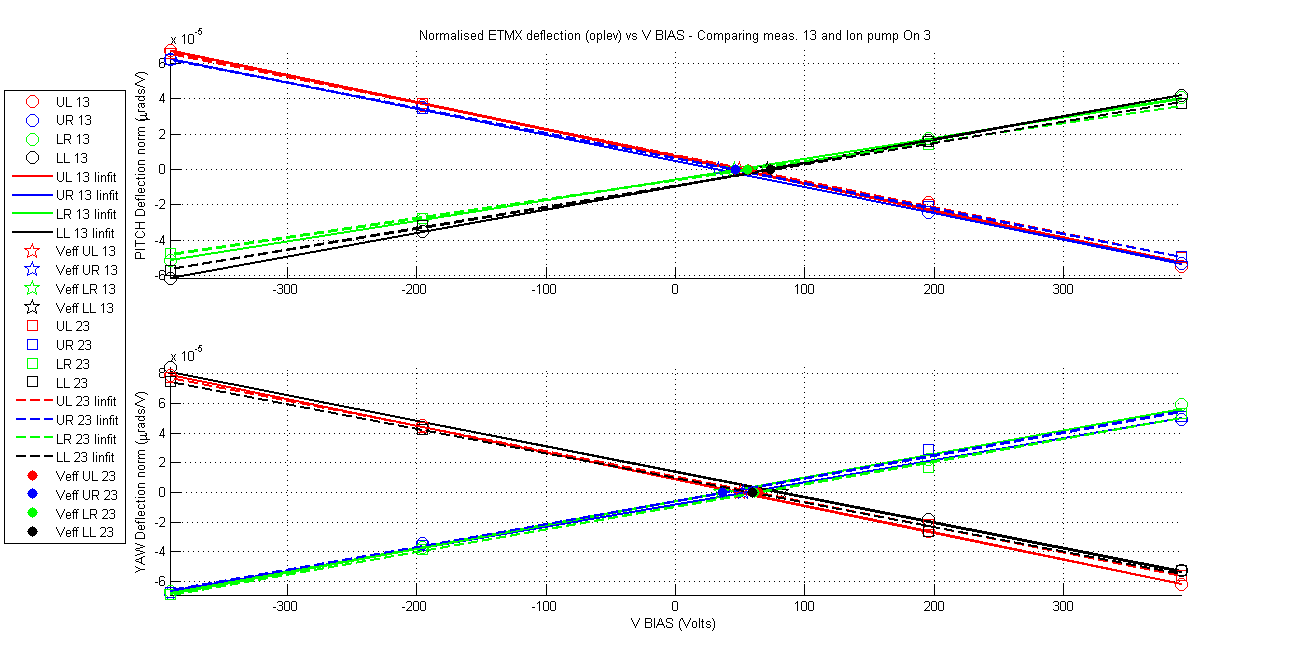
In this case also the effective voltage variation is within the 20Volt resolution with the exception of two quadrants (LL and LR) we observed in the middle measurement (in blue) a considerable votage difference with the measurements that took place before and after although only obvious for one of the deflection orientations (Pitch for LR and Yaw for LL). The fact that the increase in effective voltage took place in the middle measuremnt and then went back down may indicate that the charge change is not real or that a complex mechanism of charge dissipation or cancellation took place after the charge. I will run another charge measurement tomorrow to see if there is actually a charging trend but why would only be isolated to those quadrants?