Yesterday, Fabrice and I transferred the Livingston blend filters from the ITMY ISI to all the other BSC's. When I went to turn on ITMX, the ISI starting ringing up dramatically when I tried to engage the horizontal loops. Because we had to transfer the filters by hand, I immediately suspected I had screwed up a filter somewhere. I compared the blends between ITMY and ITMX, and found no difference. I did a diff between the a couple of archived foton files and the installed filters and found no differences beyond what I had to do to install the filters (i.e. no changes in any filters other than the blend filters I installed). When I started a rolling DTT spectra of the isolation loops (the ISO outs), I found that there was an instability in the Y isolation loop at 730 hz. When I looked at the filters I designedin matlab, I saw that there was indeed feature there, but I had sufficiently suppressed the feature. When I took an open loop measurement of the plant, however, the feature had evolved and was now a magnitued of 3 higher. I also found, looking at the foton digital filter, that there was again mismatch at 730 hz of about a factor of 5. At the time Fabrice and I decided that there must have been a change in the plant, added a notch and moved on.
This morning with, Jeff's help, we've found a few more interesting details:
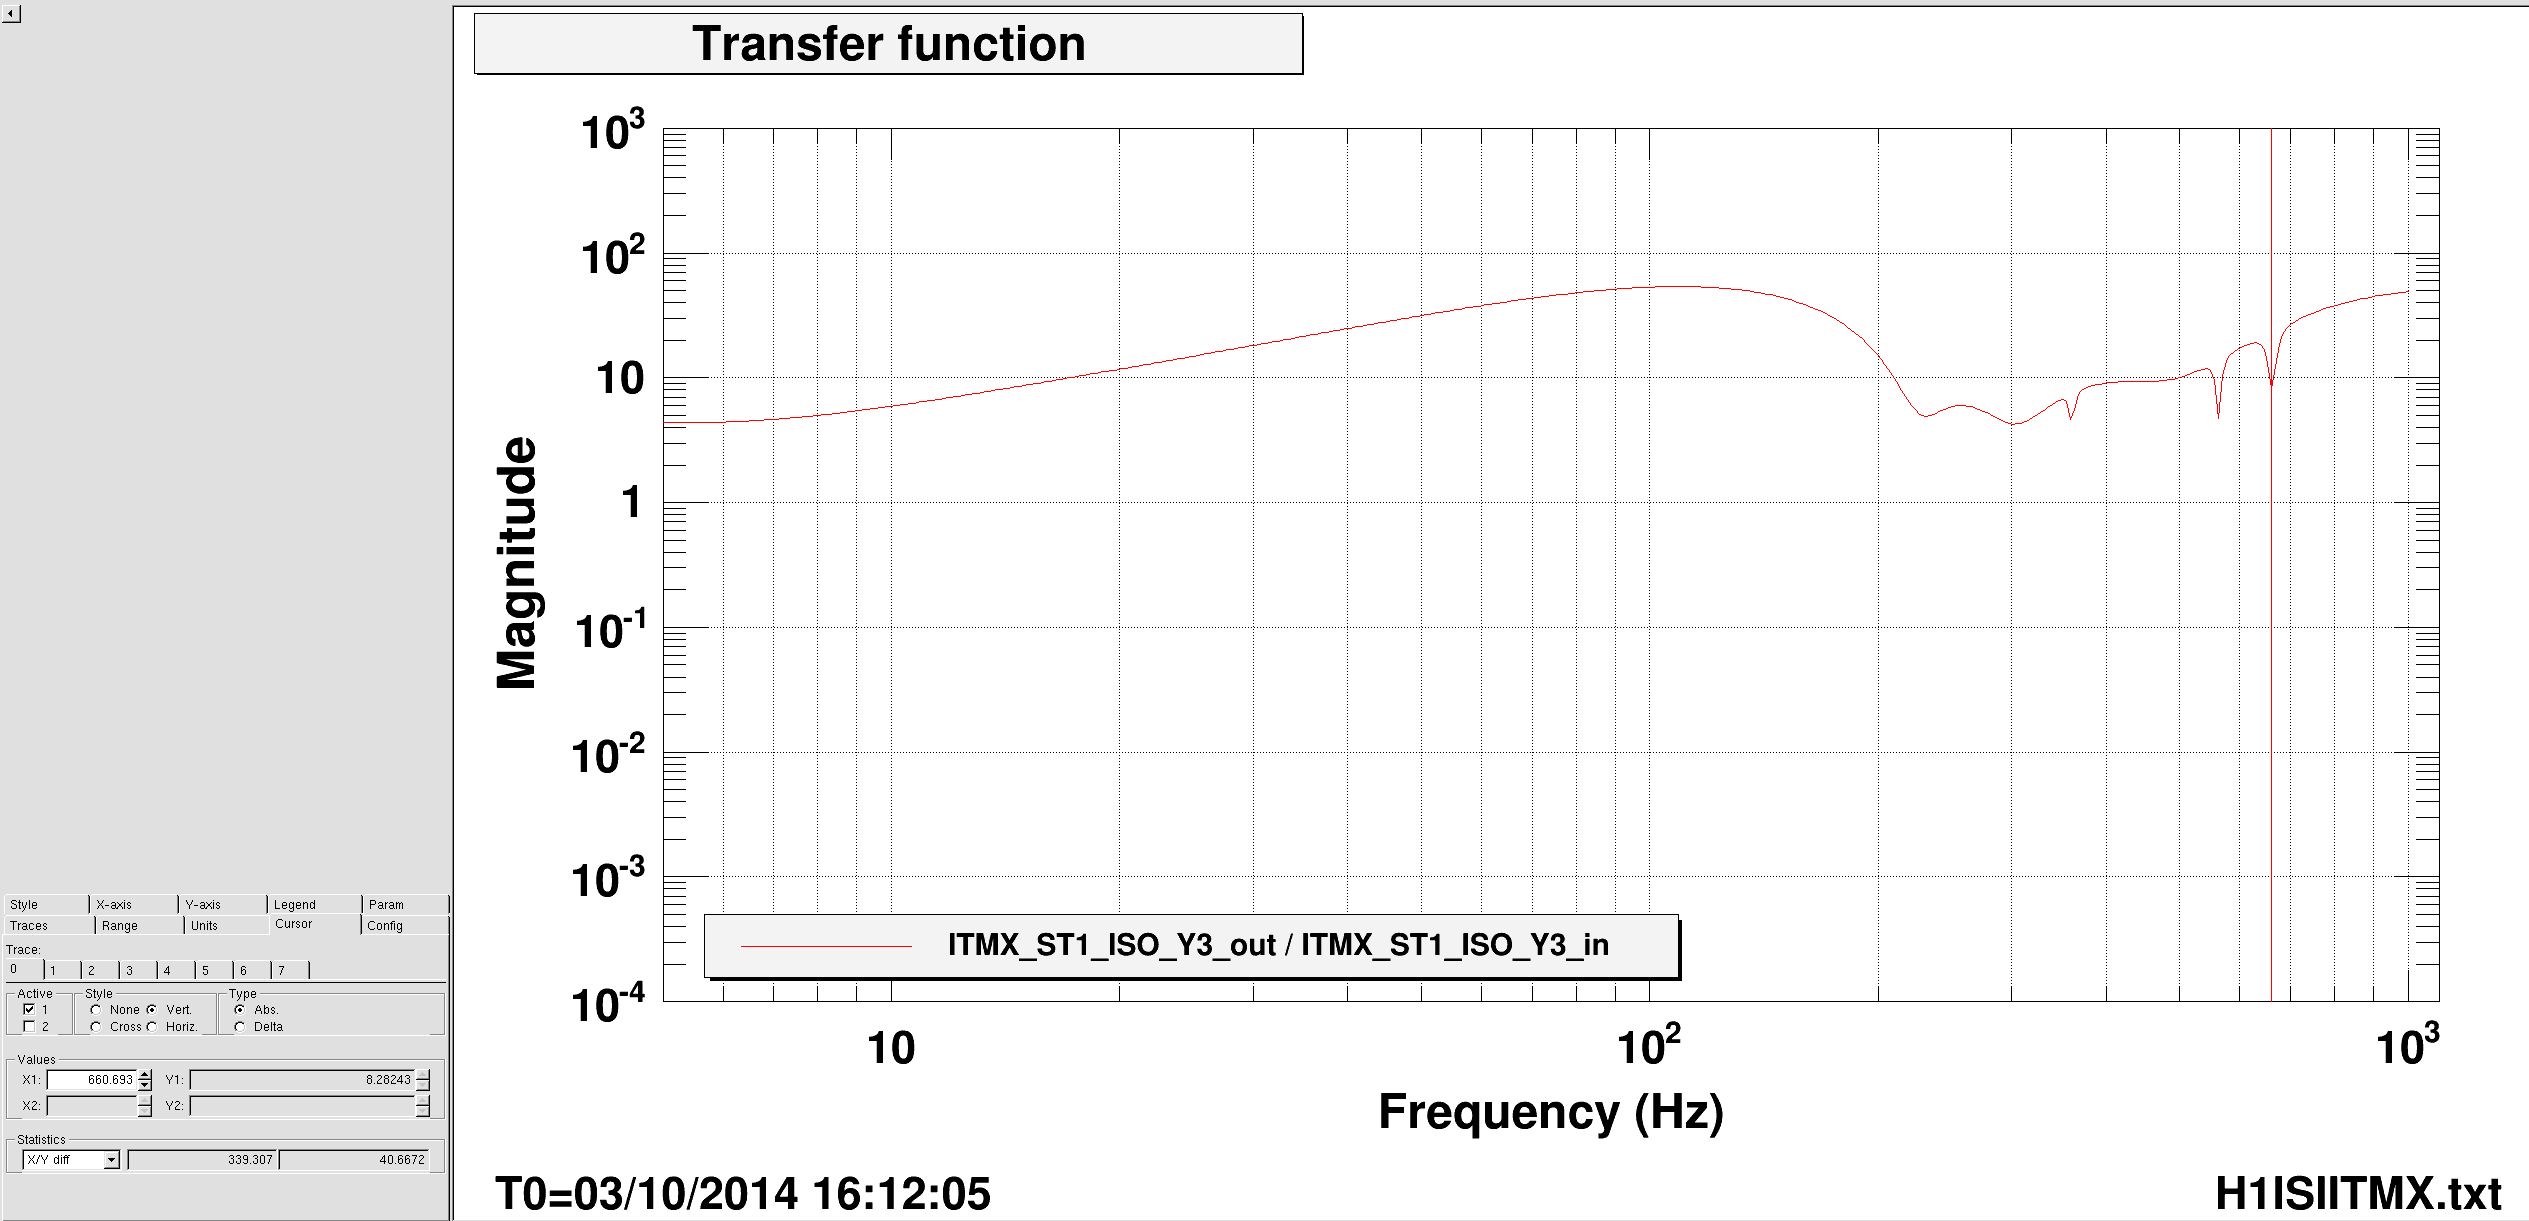
1. the foton filter does not agree with my matlab design (foton is in the first png, matlab design is my second figure). Up to about 400 hz, they agree well enough, but I have 2 high frequency notches that are not in the same place in foton. The notch I put at 730 hz has been shifted down to more like 660 hz.
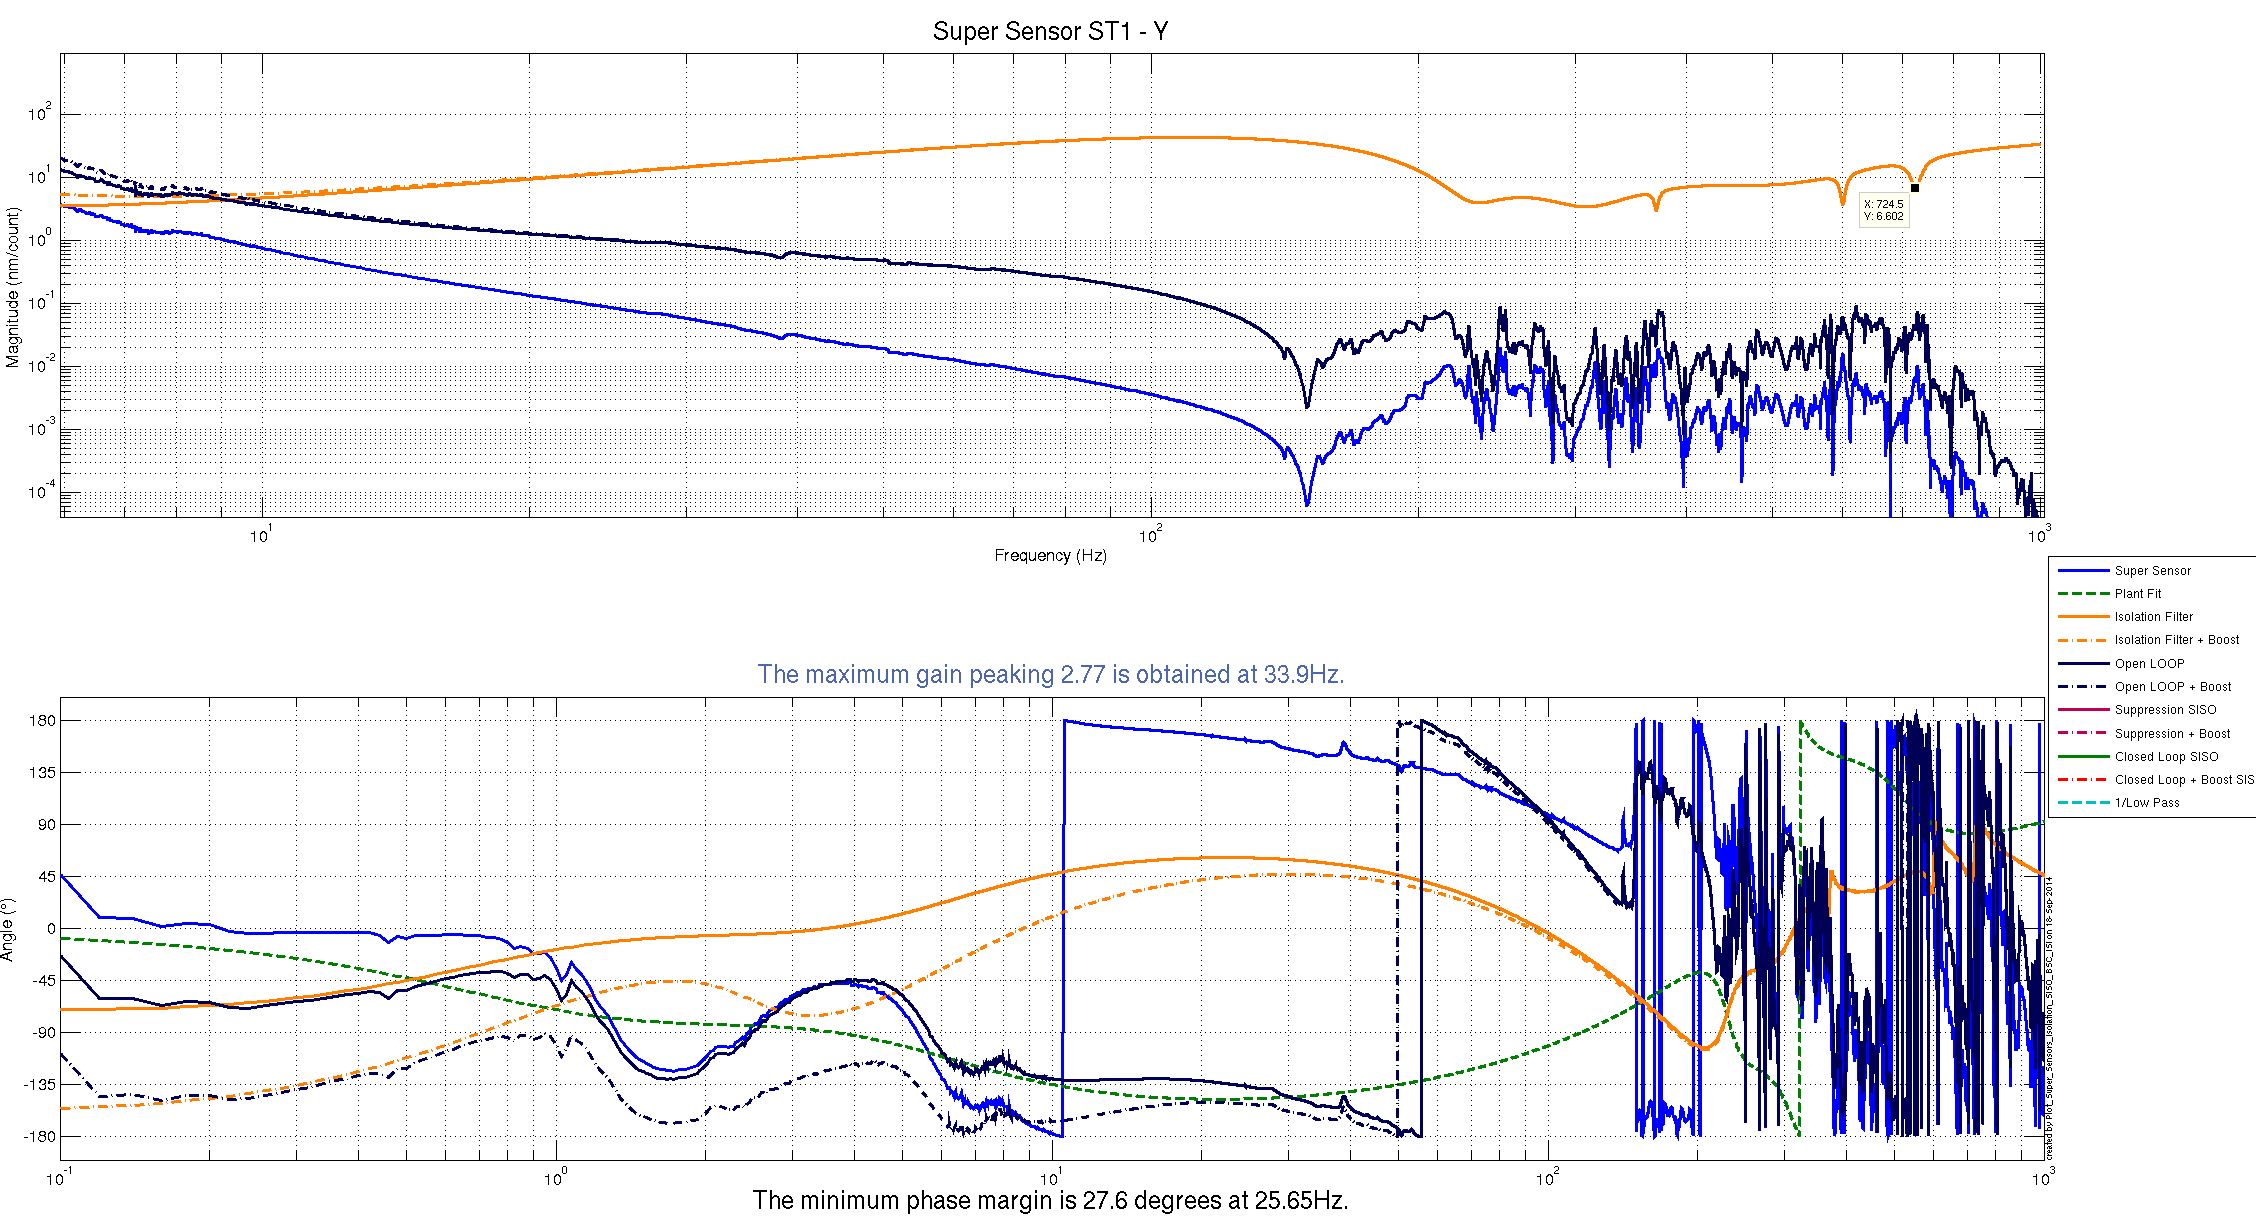
2. Looking more closely at the plant measurement I took on the 16th and the DTT measurement yesterday, we have less gain margin at high frequency than we thought we did. The comparison is show in my third plot(pdf), provided by JeffK. The green line is the measurement used in matlab, blue is the DTT measurement from yesterday. The difference is explained by a downsampling filter between the DQ channels we used to measure matlab tfs and the higher data rate channels we measured in DTT, shown on the bottom of Jeff's plot.