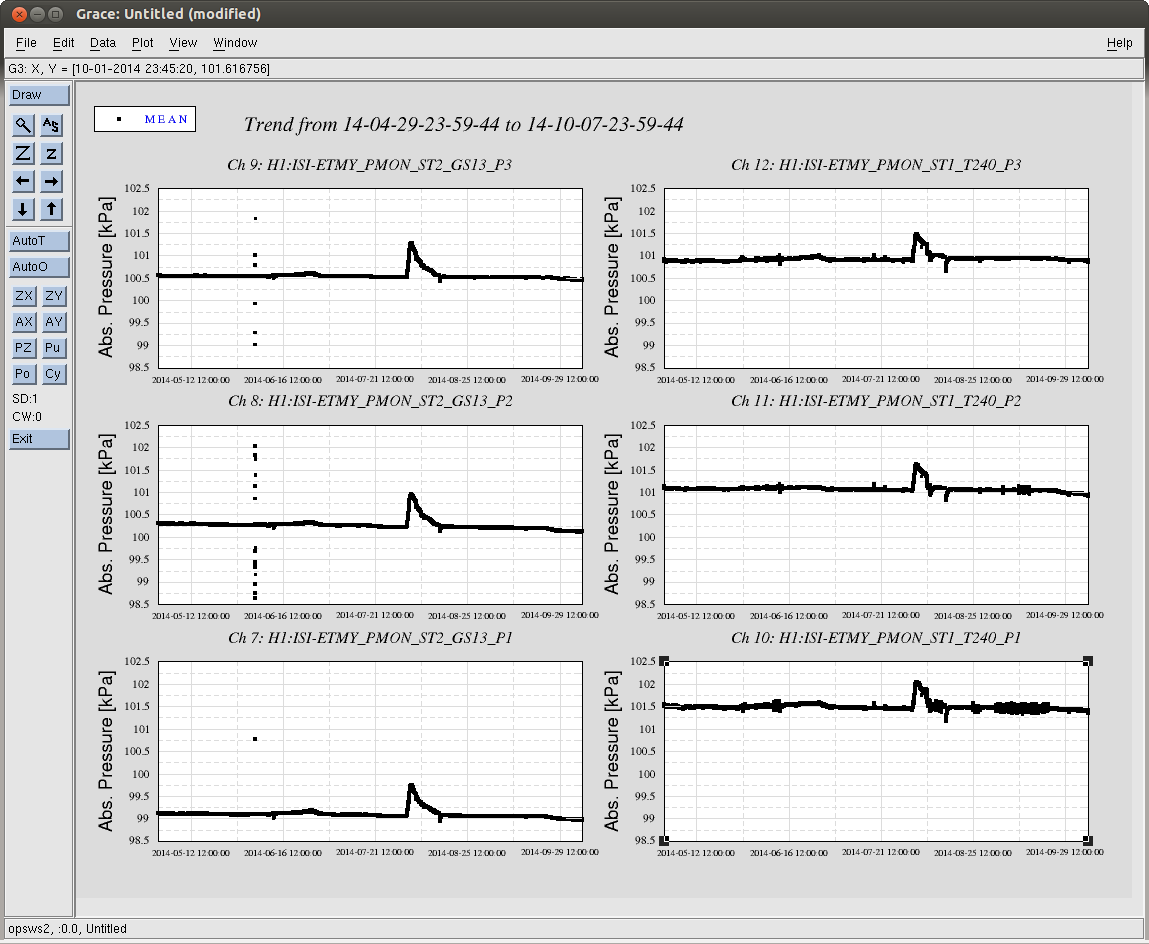
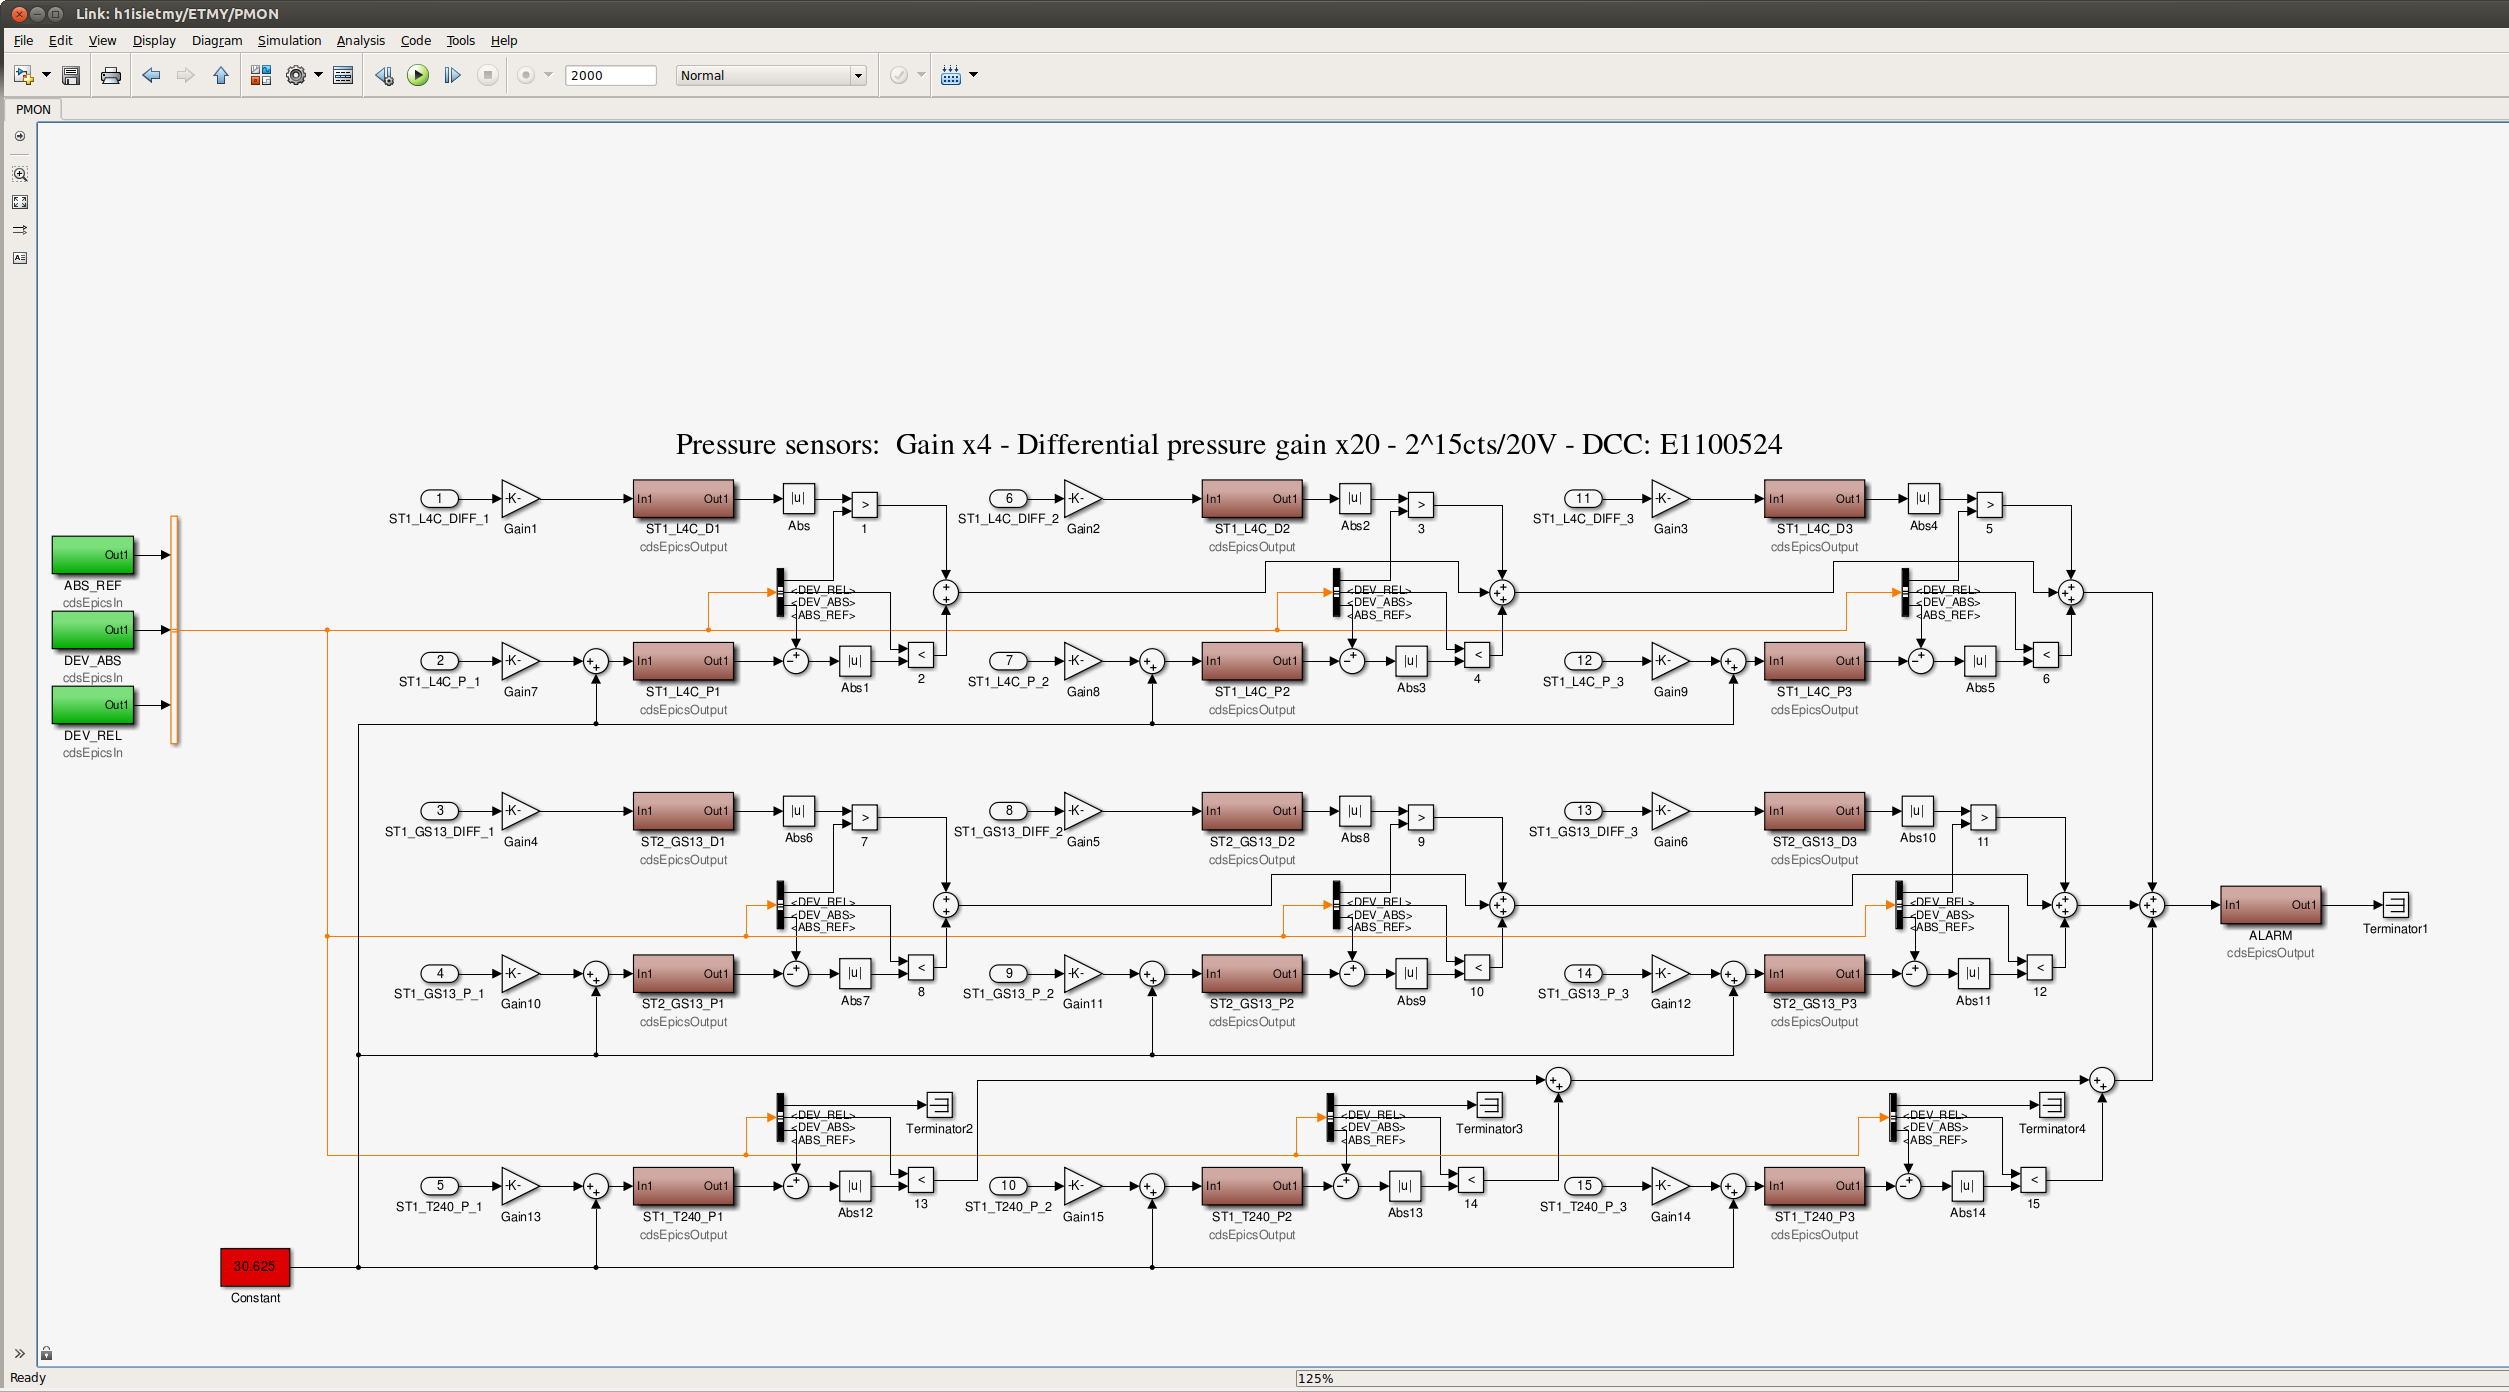
J. Kissel

I happened to have the H1 ISI ETMY overview screen open and noticed a blinking red light in the bottom corner alarming that the pod pressures are low, indicative of a potential leak. Jim informed me that Gerardo had noticed this earlier as well (both interactions verbal, no aLOG). Further investigations reveal that, though the sensors indicate a slow leak over the past 5 months on all three L4Cs; the leak rate is ~0.25e-6 [torr-Liter/sec] (see attached 2014-10-09_H1ISIETMY_L4CPod_LeakRate.pdf) -- a rate that is 1/4th of what has been deemed acceptable (see T0900192). Indeed, for further comfort -- though Brian's original guess (see G1000561, pg 15) says that the pod pressure sensors might only be able to sense 5e-6 [torr.Liter/sec] - level leaks -- it appears that we are indeed at least a factor of 8 more sensitive than that.

Though I don't understand it well enough to make adjustments, the action item is to
(a) adjust the threshold to represent 1e-6 [torr.Liter/sec] (if we're still OK with that number). and
(b) have @DetChar or @Operators make a similar study on the rest of the chambers across the project to ensure that the rest of the pods aren't leaking any worse than these L4Cs.

Note that this ETMY is the second oldest ISI (save the LASTI ISI) in the project, as it was installed just after ITMY for the H2 OAT.

Details / Logical Path / Figures
--------------------------------------
On the MEDM pod-pressure screen (accessible in the bottom right corner of the overview), Corner 1 L4C and Corner 2 and 3 T240 are blinking around 96-97, 100-101, and 100-100 [kPa] respectively, which directly correspond to the blinking alarm light. So, I trended them over the past 300 days. I quickly found that the signals have been non-flat, and in fact going down in pressure, indicative that the in-air pods were leaking air out to the in-vacuum chamber. I focused on the L4Cs, because they appeared to be the worst offender. After identifying that the major features in the 300-day minute trend time series:
-- We begin to see data ~1/4 of the way into the time series, right when Hugh and Richard are cabling up the ISI ETMY, now moved into BSC10 on Feb 25 2014 (see 10360),
-- The hump that starts at ~1/3 of the time axis is the beginning of the chamber closeout, where kyle turns on the roughing pumps on March 28 (see LHO aLOG 11076), and
-- Shark-fin feature 3/4 through the time axis which corresponds to Rai's charge dissipation experiments on Aug 06 (see LHO aLOG LHO aLOG 13274,
I believe that the sensors are indicating a real pressure signal, and not some electronics drift as Brian had worried in G1000561. Interestingly, the *differential* pressure does not show a trend, implying that all six L4C pods are leaking at roughly the same rate.

To quantify the leak rate, I grabbed the average of one hour of minute-trend data on the first of every month over the linear ramp down the of the pressure for all three L4C pods (i.e. from May 01 2014 to Oct 01 2014):

                Pod 1  Pod 2  Pod 3
pressure_kPa = [97.423 98.956 98.86;...   % May
                97.358 98.910 98.771;...  % Jun
                97.288 98.820 98.710;...  % Jul
                97.199 98.734 98.573;...  % Aug
                97.110 98.665 98.526;...  % Sep
                97.026 98.568 98.369];    % Oct
(At this point, I'm just *hoping* the pressure sensors are correctly calibrated, but we know that 1 [atm] = ~750 [torr] = ~ 100 [kPa], so it seems legit.)

Taking the matrix of 6 months by 3 pods, I converted to torr,
torr_per_kPa = 7.5;  % [torr/kPa]
pressure_torr = pressure_kPa * torr_per_kPa; % [torr]
and assuming the volume enclosed in the pod is volume_L4C = 0.9 [Liter], as Brian assumed in G1000561, and taking time = 1 [month] = 2.62974e6 [sec], the leak rate over each month is
leakRate(iMonth,iPod) = (pressure_torr(iMonth,iPod) - pressure_torr(iMonth+1,iPod))*volume_L4C/time;
(manipulating the P1* V - L* T = P2 * V equation on pg 15 of G1000561). I attach the .m file to make the calculation, if the above isn't clear enough to write your own.
It's a rather noisy calculation from month-to-month that could be refined, but it gets the message across -- the leak rate is roughly 0.25e-6 [torr.Liter/sec], a factor of 4 smaller than deemed acceptable. If one puts on your trusty pair of astronomy goggles, you could argue that the leak rate is increasing, but I would refine the quantification of the leaks before I made such claims.

Finally, I checked the GS13s and T240s to make sure they're leaking less, and indeed they are.

I also post a copy of the simulink bit logic that creates the warning bit -- it's gunna take me some time to verify it all -- but the goal will be to change the "ABS REF", "DEV REF", and "DEV REL" such that we don't alarm unnecessarily, as we've done here.


One can check if there are really leaks in the pods by looking at amu20 and amu22 on an RGA mounted on the
chamber with the suspect pods. The pods are filled with neon. The peaks should be in the ratio of the
isotopic abundance of the two neon isotopes.
Quoting T0900192,

"We conclude that any leak is unacceptable from a contamination viewpoint..."

This should be followed up.
I am skeptical.
We have many conflats and feedthrus installed on LIGO and the failure rate is extremely low once the initial leak test is passed.
I think it is more likely that there is an aging effect here with the sensors or possibly some gettering action of air in the pod (we do not know how much air remained in the pod when the neon was filled). The aging could be mechanical fatigue or permeation of gas into the "zero" side of the capactive sensor.
The kp125 sensors are "low cost" capacitive barometric sensors and a typical use would be in an automobile engine intake manifold. Long term drift of the sensor due to aging would not be a factor in this application because the manifold is routinely exposed to one atmosphere prior to startup - allowing for a calibration.
Depending on the air content in the pods a chemical reaction (slow oxidation??) could also be responsible for this drift. The L4C is the smallest unit and would therefore show the largest loss of gas if this were the case.(smaller reservoir)
Quote from the vendor spec sheet:
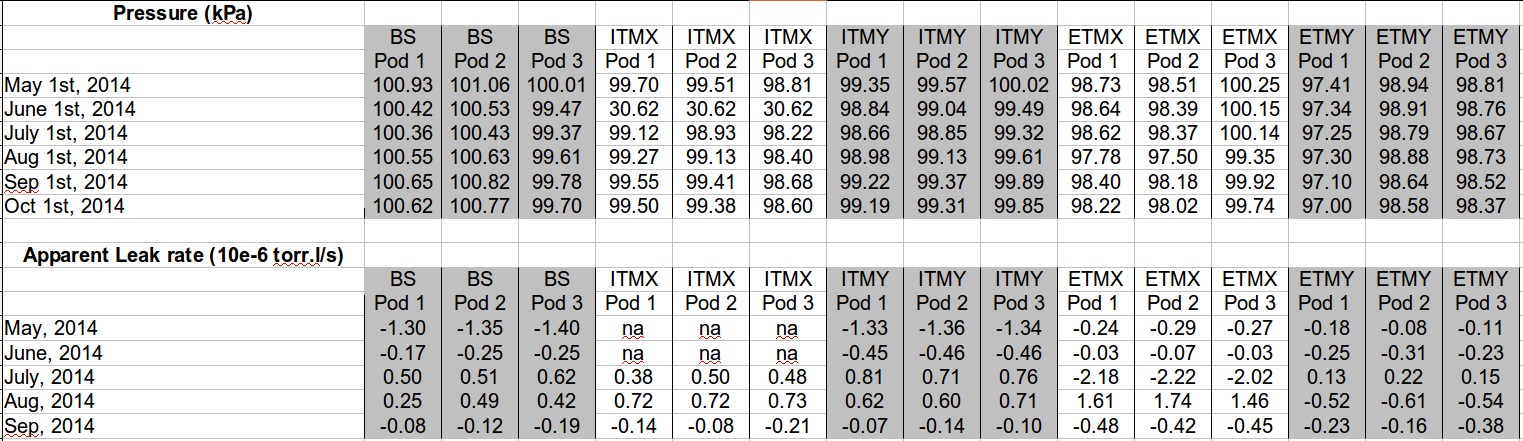
The table attached shows the pressure and "apparent leak rates" of the L4C pods for all BSC-ISI. For the calulations, I used a short period of data from the first data of each month. Results for ETMY are consistent with Jeff's numbers.
Results/Comments:
- Unlike ETMY, other units don't show a consitent trend. The pressure signal seems to go up and down, rather than consitently down.
- The sign and amplitude of the apparent leak rate is always very similar within the three pods of a given chamber.