jeffrey.kissel@LIGO.ORG - posted 23:06, Tuesday 10 February 2015 - last comment - 11:42, Wednesday 11 February 2015(16619)
Treatise on The HEPI Pump Servo
J. Kissel, B. Abbott

Over the past few weeks, I've been building up understanding of the HEPI pump servo -- more than I ever wanted to know.

The conclusions from all this?
(1) The EPICs calculation of the PID loop (documented loosely in the EPICs manual here)
     (a) uses backwards differentiation approximation and velocity formalism to compute the *change* in control output value, which it then adds it to the previous cycle's control output value -- which turns it back into a "position" algorithm -- i.e. one *doesn't* have to differentiate the pole and two zeros of the P, I and D. Other good references I found are here, here, and here.
     (b) expects the "I" and "D" terms in [cycles / min] or [mins / cycle], respectively, i.e. it depends on the sampling rate / clock cycle turn-around time of the PID calculation. If you want to do any sane prediction of the filter shape, you've got to convert these to [rad/s] or [s/rad], again respectively, by multiplying by 60/(2*pi*Ts) [(min/sec).(rad/cycle)] or (2*pi*Ts)/60[(cycle/rad).(sec/min)].
(2) The EPICs turn-around time, or clock cycle, for the discrete PID controller calculation is longer than the requested sampling frequency, which means the sampling rate is determined by the clock-cycle. Further, it's slower in the corner station than the end stations. We should lower the EPICs record's demand of the sampling frequency from 10 [Hz] to 1 [Hz] (and check again if the PID can turn around the calculation fast enough).
(3) The HEPI Pump servo contains a second-order, 16 [Hz], Sallen-Key, anti-aliasing filter before the input to the ADC on all pressure sensor channels (see D0901559, pg 2)
(3) We should lower the PID parameters such that the UGF of the loop is ~ 1 [mHz]. Why?
     (a) The pressure sensors were never meant to be used as AC sensors. LHO aLOG 16500 hints that they shouldn't be used in a loop above a few [mHz].
     (b) The ADC noise of the Athena II, PC 104 computer is an abysmal 1e-2 [V/rtHz]. As they are currently amplified, the pressure sensor's signal gets buried in this ADC noise by ~10 [mHz].
     (c) Adding an EPICs "smoothing" parameter (a.k.a. SMOO) to the EPICs version of the pressure sensor channels adds a single-pole low-pass filter into the control loop. If sufficiently low in frequency, it'll start to creep in on your already-small phase margin. We should use this with caution, or at least be cognizant of its impact.

-------------
Details.

I attach 5 plots per pump station:

Pg 1: On the EPICs turn around time defining the sampling rate
In my perusing of the EPICs manual, I found that the PID channel, e.g. H1:HPI-PUMP_EX_PID, has sub records, one of which is "DT," which one can query with a simple caget:
jeffrey.kissel@opsws8:/$ caget H1:HPI-PUMP_EX_PID.DT
H1:HPI-PUMP_EX_PID.DT          0.312006
This is "the time difference in seconds between processing steps." Consequently, I caget'd this sub record 5000 times. This turned out to be faster than the EPICs calc record would update the number by 3, so I took every third report. Then I histogrammed the results, to find that the clock cycle is 0.55 and 0.28 [sec] (!!) for the corner station and both end stations, respectively. The end stations show some clock jitter, but I took the mode of the 1667 points and used that as the clock cycle. This immediately informs us that the features seen in all ASDs that happen at 1.8 [Hz] and 3.5 [Hz] at the corner and end stations are just a function of the terribly slow sampling rate -- even slower than the EPICs 16 [Hz], and the request calc record rate of 10 [Hz].

Pg 2: On EPICs Implementation Discrete PID Control
It's too difficult in a simple text editor to really do the explanation any justice, but check out all of the references I show above, while you wait for coherent presentation version of this aLOG. One of the many reasons why my initial guess at what the servo was doing (in LHO aLOG 16447) was incorrect was because I wasn't accounting to the time delay of the discretization. As I found out later, it turned out that the discretization was much slower that was defined in the EPICs calc record.

Pg 3: Modifying the measured plant (see LHO aLOG 16601) with the anti-aliasing filter, and an EPICs smoothing filter
On the SMOOOOOOO at EY
Hugh's initial instinct to combat the newly-noisy differential signal was to add some EPICs sub-record defined "smoothing factor" to the supply and return channels which form the differential pressure signal. Again, from the EPICs manual,
"The converted data value is subjected to the following algorithm:
val = newvalue * (1 - smoo) + oldvalue * smoo
SMOO should be a value between 0 and 1, with 0 meaning no smoothing and one meaning ultimate smoothing (in fact the data will never change)."
*sigh* who writes these manuals? Thank god they wrote out the algorithm. This is just the discrete realization of a first order low-pass filter. The pole frequency of which is defined by
f_{pole} = 1/(2*pi*Ts) * ln(1 / (1 / alpha))

Hugh had entered in a SMOO of 0.75, which at a dismal sampling rate of Ts = 0.28 [sec], means the pole frequency is at 0.159 [Hz], which explains *some* of the excess gain peaking that we see at EY.

Pg 4: Loop Design figures of merit given the now-(mostly)-understood plant and controller

Pg 5: Model of closed loop ASD noise
Clearly I'm still missing some phase loss term that increases the gain peaking, but at least I get the suppression correct. I could hunt around for several more days as to why this is, and find some other nasty EPICs trickery. But I'm not gunna.
Non-image files attached to this report

Comments related to this report
To be clear regarding Jeff's statement:
Hugh's initial instinct to combat the newly-noisy differential signal was to add some EPICs sub-record defined
"smoothing factor" to the supply and return channels which form the differential pressure signal
"smoothing factor" to the supply and return channels which form the differential pressure signal
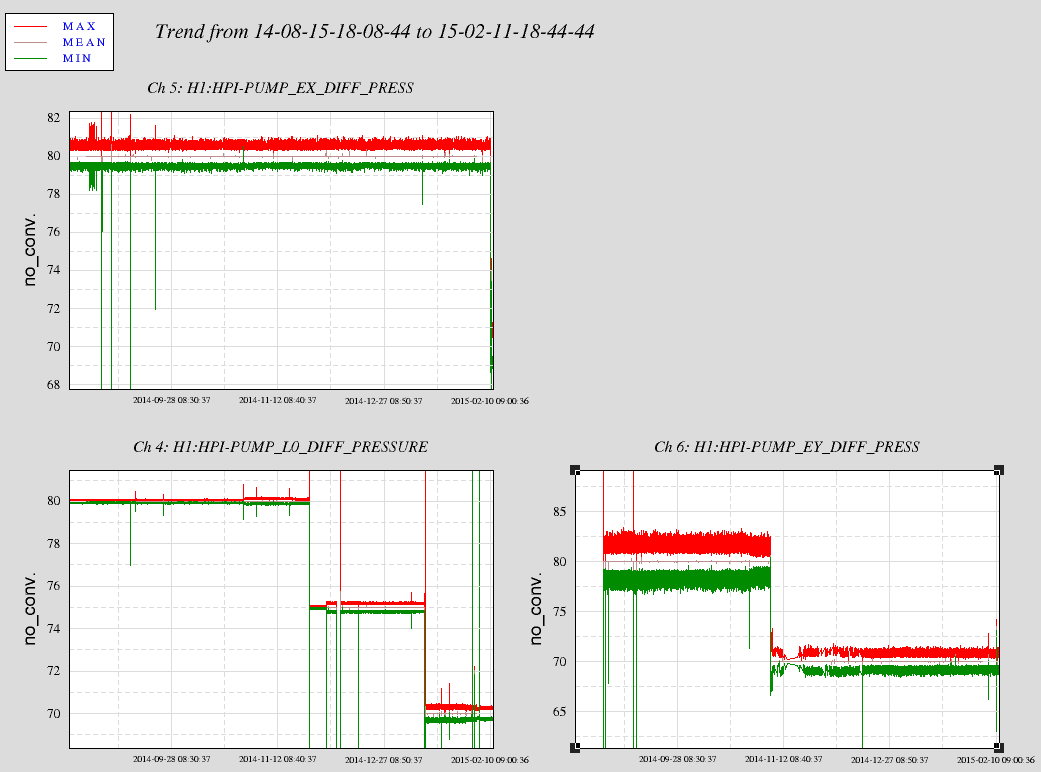
Attached is 180 days of pressure trends. There is no transition to "newly-noisy" at the ends. End X has always been noisy, End Y went quieter when I started smoothing those records 7 November, 14926. Now trends of the corner station tells a different story. You can see a few transitions in the widths of the Max & Mins. As I will continue to say, something on the servo box/board is not grounded/isolated or something well enough or there has been something damaging occur to the them. It was never good at the Ends as I noticed the noisy signals there as compared to the corner, then I screwed up something and the corner station went as bad as the ends.
Images attached to this comment