keith.riles@LIGO.ORG - posted 12:12, Tuesday 02 June 2015 - last comment - 08:44, Thursday 09 July 2015(18764)
Narrow lines in H1 DARM
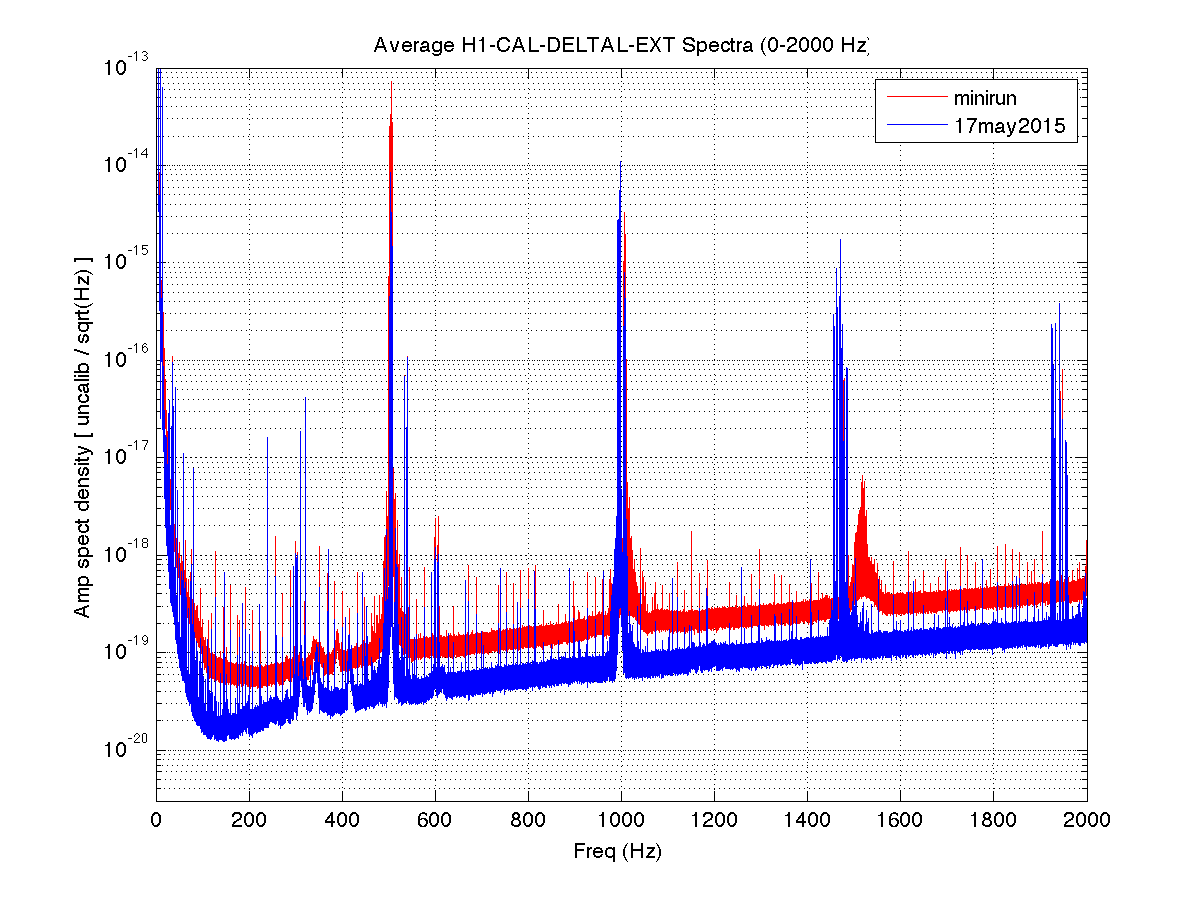
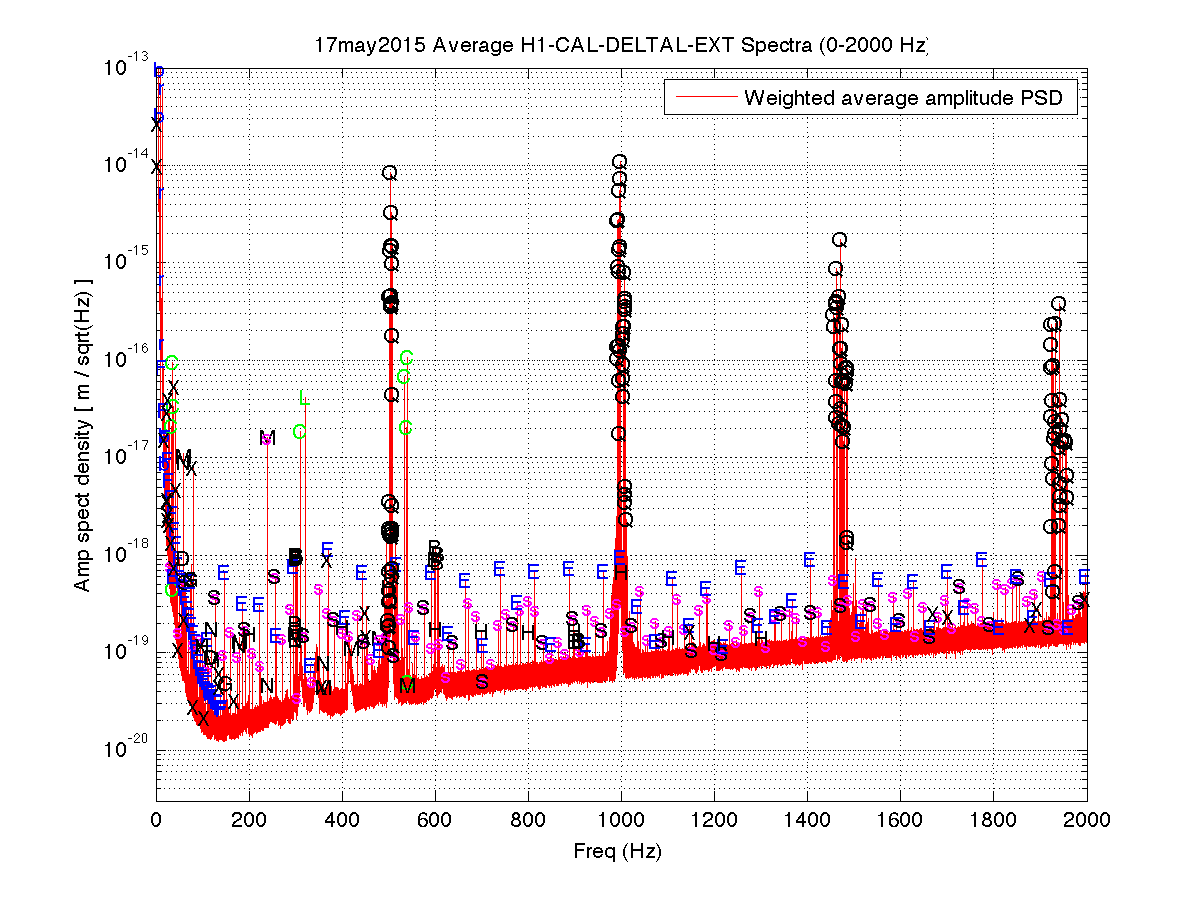
Attached is a pre-ER7 list of narrow lines seen above 5 Hz in recent H1 DARM data, along with spectra containing labels for the lines.

The spectra used for line-hunting are from 18 hours of DC-readout conditions on May 17. Most of the lines were also seen
in the early-May mini-run data, but are more exposed in the more sensitive May 17 data (see figure 1)

Notable combs / lines:
- Exact integers: 16.0000 Hz, 64.0000 Hz (distinctly louder than other 16-Hz lines), 81.0000 Hz, 1150.0000 Hz, 1672.0000 Hz, 1704.0000 Hz, 1880.0000 Hz, 1896.0000 Hz
- Nearly exact-integer combs:
- 3.9994 Hz (offset by ~2 Hz from zero, first visible harmonic at 13.9977 Hz -- these seem to correlate with a near 4-Hz comb starting at 2 Hz in EX magnetometers (and to a lesser degree in EY magnetometers), where the contamination in DARM at 10 Hz and below is presumably too faint to be seen in the rapidly rising DARM noise. A strong comb is apparent in PEM FScans.
- 99.9989 Hz (correlated with magnetometers in EX - see NoEMi and PEM FScans)
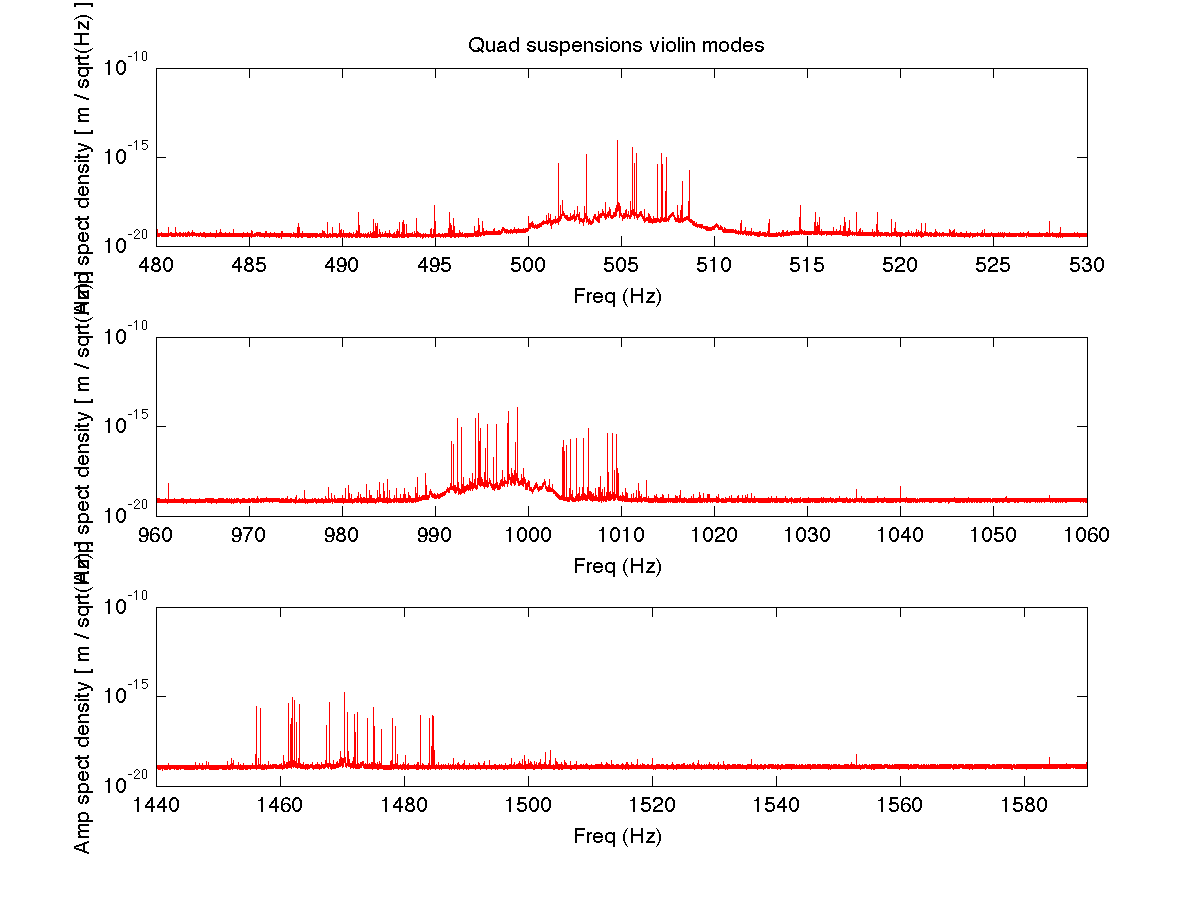
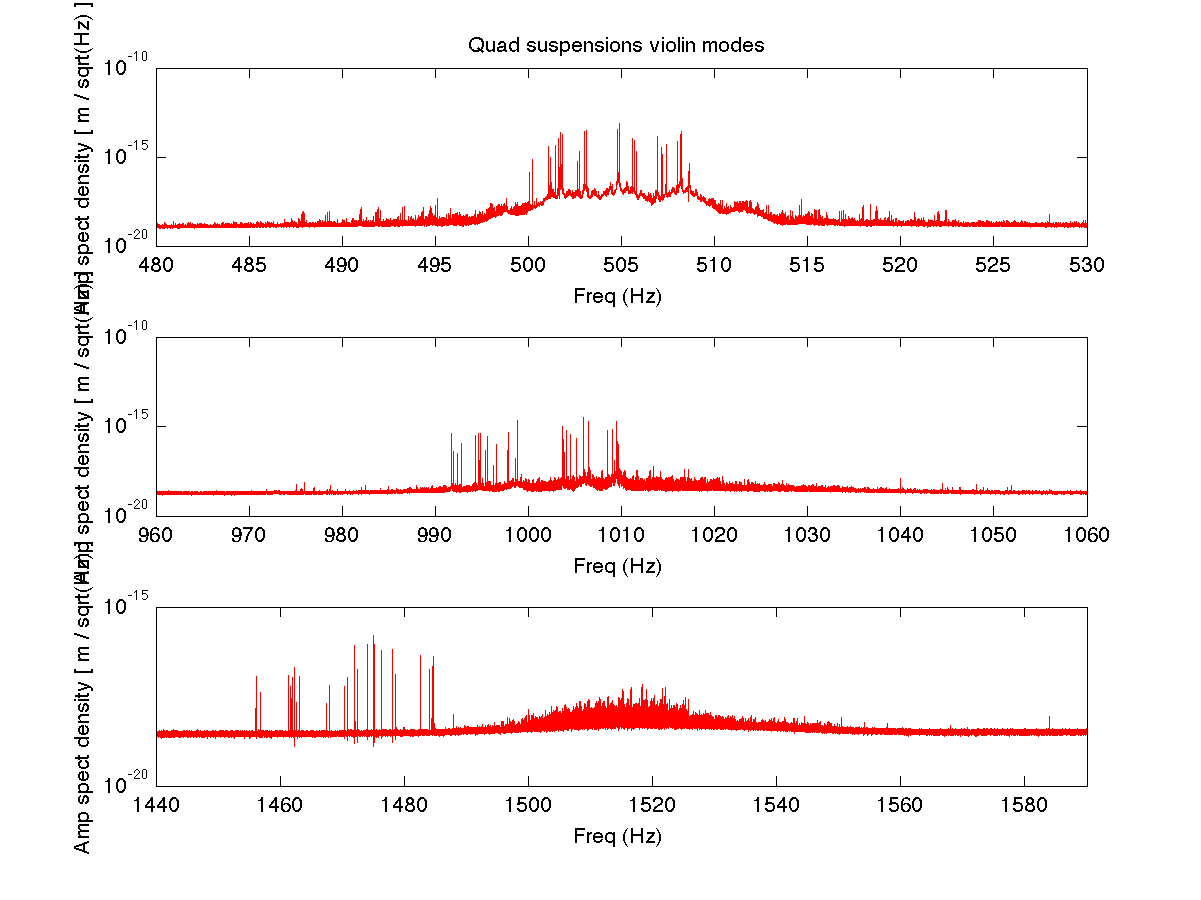
- Quad suspension violin modes with fundamentals near 500 Hz are not quite truly harmonic, but some of their upconversion is (see figure 2)
- Especially pervasive combs: 3.9994 Hz (34 harmonics), 16.0000 Hz (124 harmonics), 60.0 Hz (9 harmonics), 64.0000 Hz (31 harmonics), 36.9733 (54 harmonics), 59.9954 (6 harmonics), 99.9989 (13 harmonics)
- There are tentative identifications here of lines near 300 Hz and their harmonics as due to beam splitter violin modes, but their frequencies shifted by several mHz between the mini-run and the May 17 lock stretches, unlike the quad suspension violin modes which hardly moved at all (attributable to temperature?)
- Designated calibration line frequencies are shown on the spectra even when there is no apparent line (some not yet enabled?)
- Because the binning in the spectra is 0.5 mHz (based on 30-minute FScan Hann-windowed SFTs), but the line widths in the plots are much larger, the spectra shown here look awful (but aren't). Dewhitening applies five poles at 1 Hz and five zeroes at 100 Hz.
- I didn't bother labeling the forest of bounce/roll-mode sidebands on the quad suspensions and their harmonics
- Although the 1150-Hz line seems well centered on the integer value, its energy is spread over several tenths of a Hz, unlike other integer-Hz lines
- Many line frequencies are give to four digits after the decimal point, but their statistical uncertainties are typically no better than a few tenths of a mHz, and based on changes between early and mid May, some lines have systematic drifts of O(mHz).
- With one exception, the quad violin mode fundamental frequencies were determined from the mini-run data, where they were more excited than on May 17. Those frequencies agree (independently) to within 2 mHz (in most cases, to better than 1 mHz) with the frequencies measured for individual test masses here. The one exception was that I had originally marked 504.1492 Hz as a mode in the mini-run, while the earlier study had found a mode instead at 501.254 Hz. Since the earlier measurements are guided by test-stand data, I am deferring to them and tagging 501.2544 Hz here, since I do see a line there in the mini-run data, albeit weaker than other modes.
Images attached to this report
Non-image files attached to this report


Comments related to this report
I meant to attach the excited violin mode spectrum stack from the mini-run, not from the mid-May data,
to illustrate the harmonicity of the upconversion. Here is the right plot.
Images attached to this comment
We used the coherence tool on the full ER7 data to try and find coherence between h(t) and other channels for the 99.9989 Hz line and its harmonics.

There is a coherence between h(t) and ...
H1:PEM-CS_MAG_EBAY_SUSRACK_Z_DQ
at
99.9989*1= 99.9989 Hz with coherence of 0.038
99.9989*2 = 199.9978 Hz with coherence of 0.03
99.9989*3 = 299.9967 Hz with coherence of 0.11
99.9989*4 = 399.9956 Hz with coherence of 0.11
99.9989*5 = 499.9945 Hz with coherence of 0.022
99.9989*10 = 999.989 Hz with coherence of 0.13
Similar results for
H1:PEM-CS_MAG_EBAY_SUSRACK_X_DQ
H1:PEM-CS_MAG_EBAY_SUSRACK_Y_DQ
H1-PEM-CS_MAG_LVEA_OUTPUTOPTICS_X_DQ
H1-PEM-CS_MAG_LVEA_OUTPUTOPTICS_Y_DQ
H1-PEM-CS_MAG_LVEA_OUTPUTOPTICS_Z_DQ
H1:PEM-CS_MAG_LVEA_VERTEX_X_DQ
H1-PEM-EY_MAG_EBAY_SUSRACK_Y_DQ
H1-PEM-EY_MAG_EBAY_SUSRACK_Z_DQ
H1-PEM-EX_MAG_EBAY_SUSRACK_X_DQ
H1-PEM-EX_MAG_EBAY_SUSRACK_Y_DQ
H1-PEM-EX_MAG_EBAY_SUSRACK_Z_DQ

The coherence is present but less strong in
H1:PEM-CS_MAG_LVEA_VERTEX_Z_DQ
99.9989*10 = 999.989 Hz with coherence of 0.06
Not really visible in
H1:PEM-CS_MAG_LVEA_VERTEX_Y_DQ

We don't see this line in
H1-PEM-EY_MAG_EBAY_SUSRACK_X_DQ
H1-PEM-EX_MAG_VEA_FLOOR_Z_DQ
H1-PEM-EX_MAG_VEA_FLOOR_Y_DQ
H1-PEM-EX_MAG_VEA_FLOOR_X_DQ
H1-PEM-EY_MAG_VEA_FLOOR_X_DQ
H1-PEM-EY_MAG_VEA_FLOOR_Y_DQ
H1-PEM-EY_MAG_VEA_FLOOR_Z_DQ

Nelson, Eric Coughlin, Michael Coughlin