J. Kissel
We're exploring the functionality of the new features of the front-end calibration that calculates the coherence and subsequent uncertainty of the transfer function between each CAL line source and DARM. As such, I plot three, one-hour data stretches from different lock stretches in the past 24 hours.
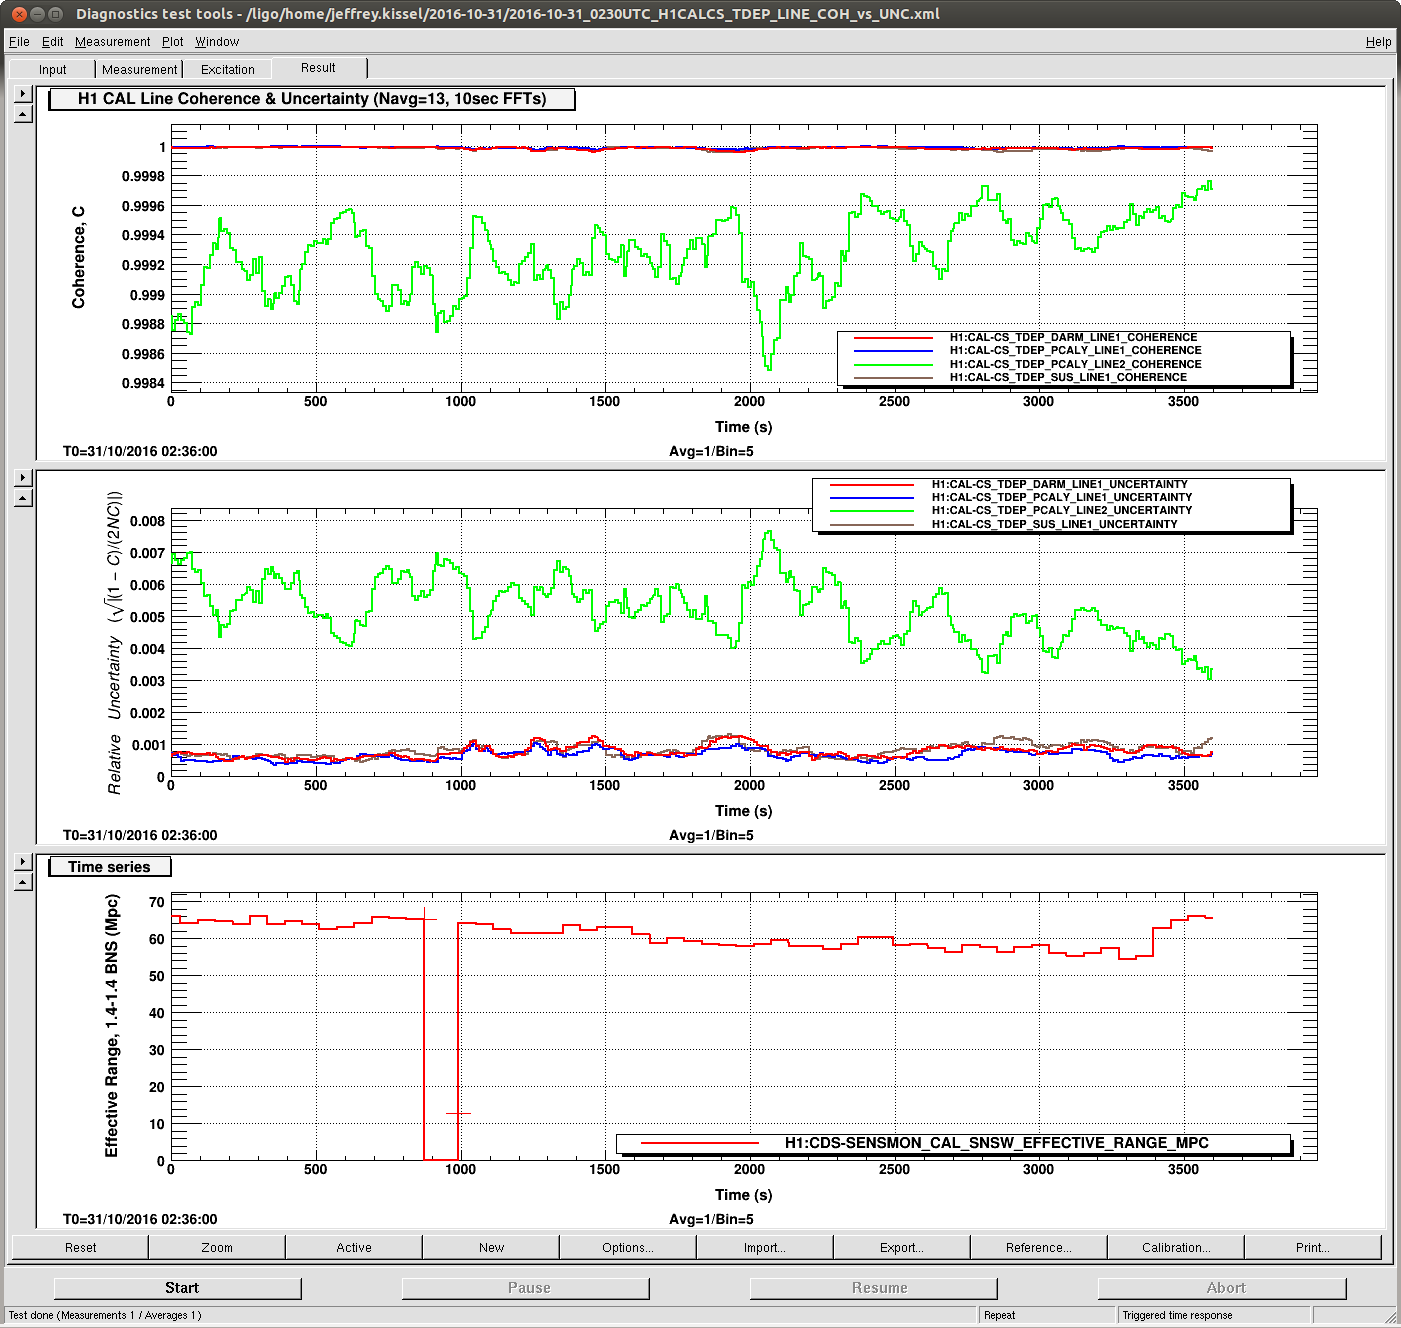
Data Set A: 2016-10-31 02:30 UTC
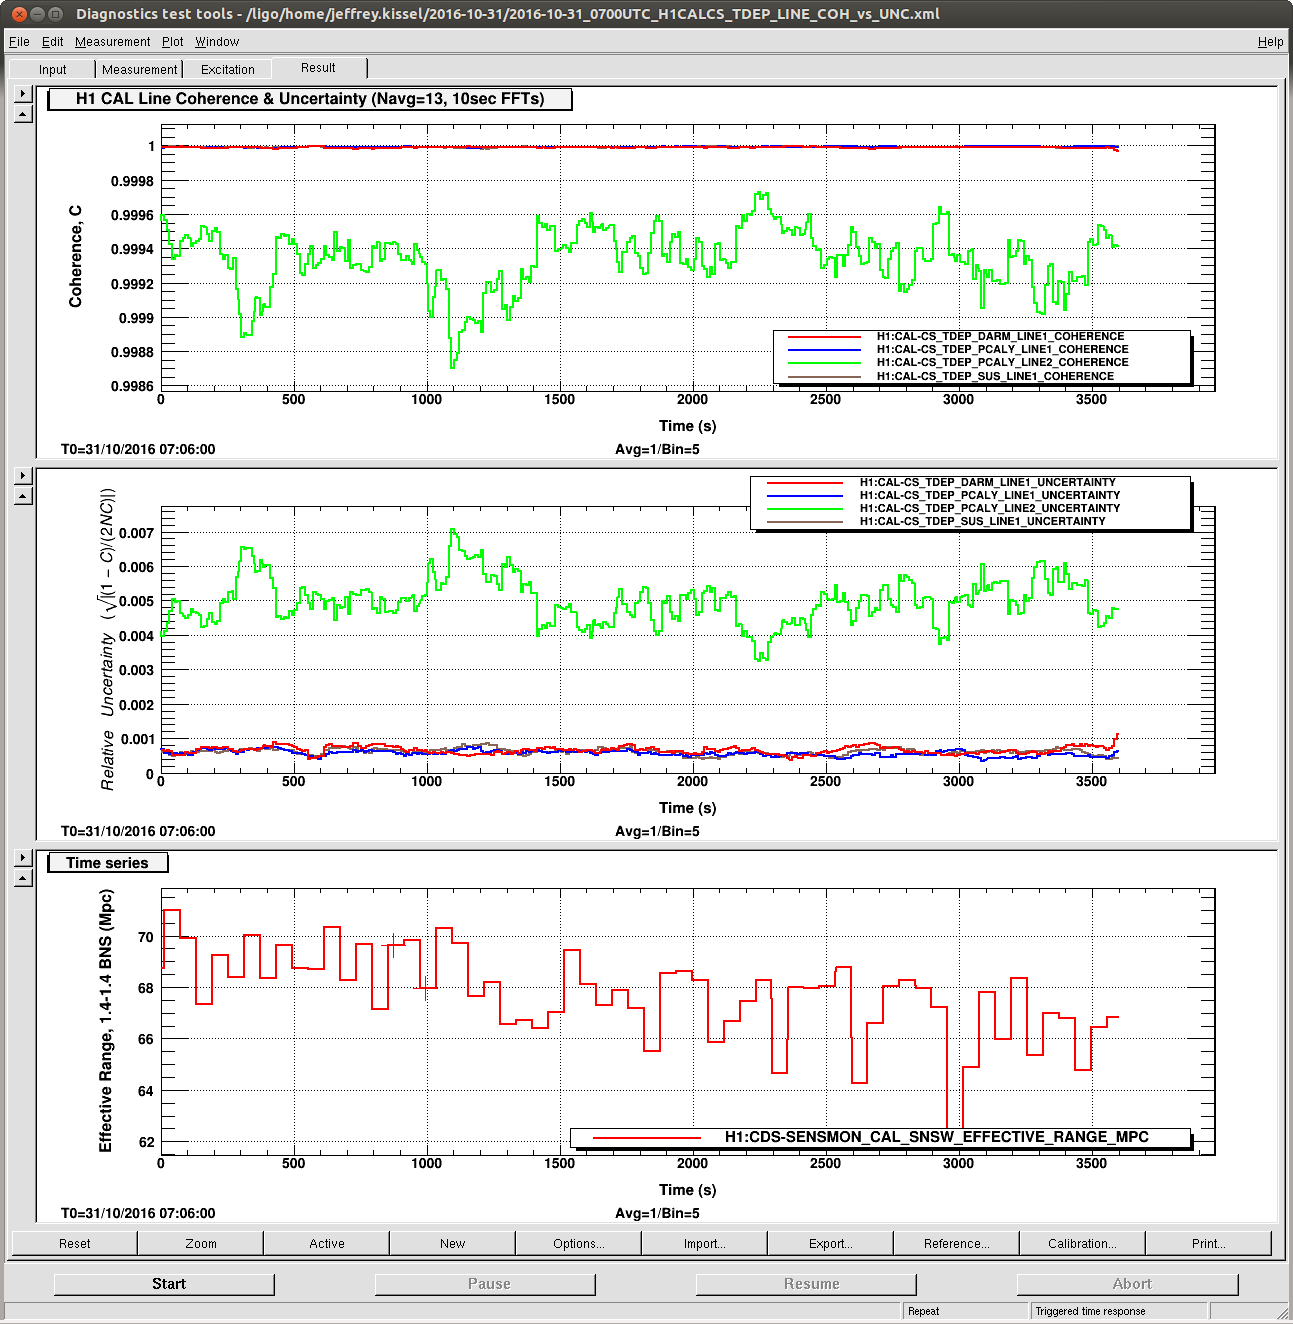
Data Set B: 2016-10-31 07:00 UTC
Data Set C: 2016-10-31 10:00 UTC
Note the translation between channel names and to which line they're analyzing:
H1:CAL-CS_TDEP_..._[COHERENCE/UNCERTAINTY] Frequency Used In Calculating
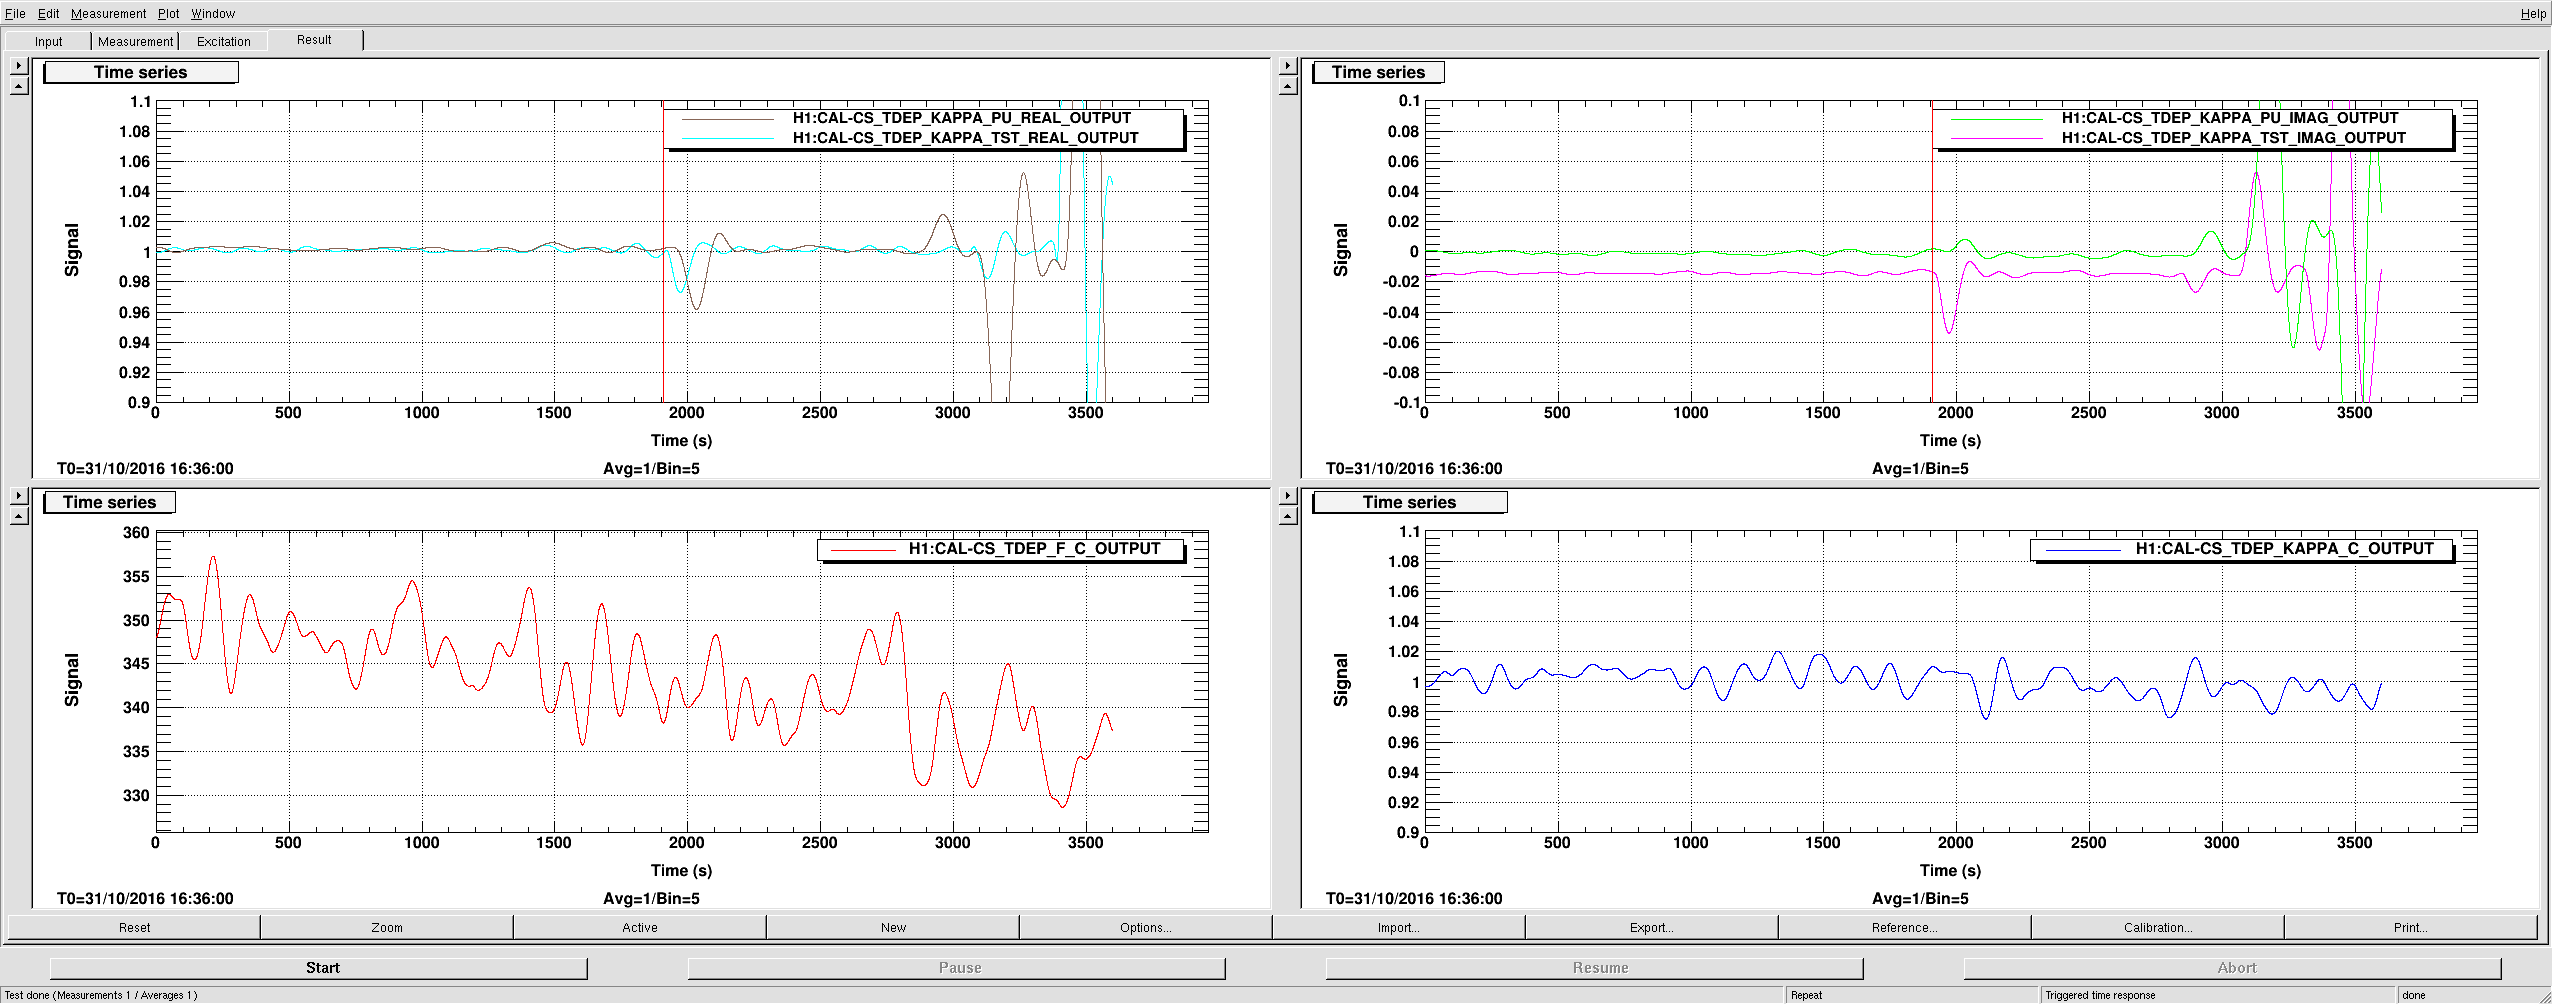
DARM_LINE1 37.3 kappa_TST (ESD Actuation Strength)
PCAL_LINE1 36.7 kappa_TST & kappa_PU (ESD and PUM/UIM Act. Strength)
PCAL_LINE2 331.9 kappa_C & f_C (Optical Gain and Cavity Pole)
SUS_LINE1 35.9 kappa_PU (PUM/UIM Act. Strength)
where you can refer to P1600063 and T1500377
Recall also, that our goal is to have the uncertainty in the time-dependent parameters (which are calculated from combinations of these lines) to around ~0.3-5%, such that these uncertainties remain non-dominate (lines are strong enough), but non-negligible (not excessively strong). An example total response function uncertainty budget in LHO aLOG 26889, to see at what level the time-dependent parameter estimation uncertainty impacts the total uncertainty. That means the uncertainty in each line estimate should be at the 0.1-0.3% level if possible. So, we can use these data sets to tune the amplitude of the CAL lines, so as to optimize uncertainty needs vs. sensitivity pollution.
There are several interesting things. It's best to look at the data sets in order B, then A, then C.
In data set B --
- this is what we should expect if we manage to get a stable, O1-style interferometer in the next week or so for ER10 and O2.
- With the current amplitudes, the uncertainty on the ~30 Hz lines hovers around 0.1% -- so we can probably reduce the amplitude of these lines by a factor of a few if the sensitivity stays this high.
- The 331 Hz line amplitude should probably be increased by a factor of a few.
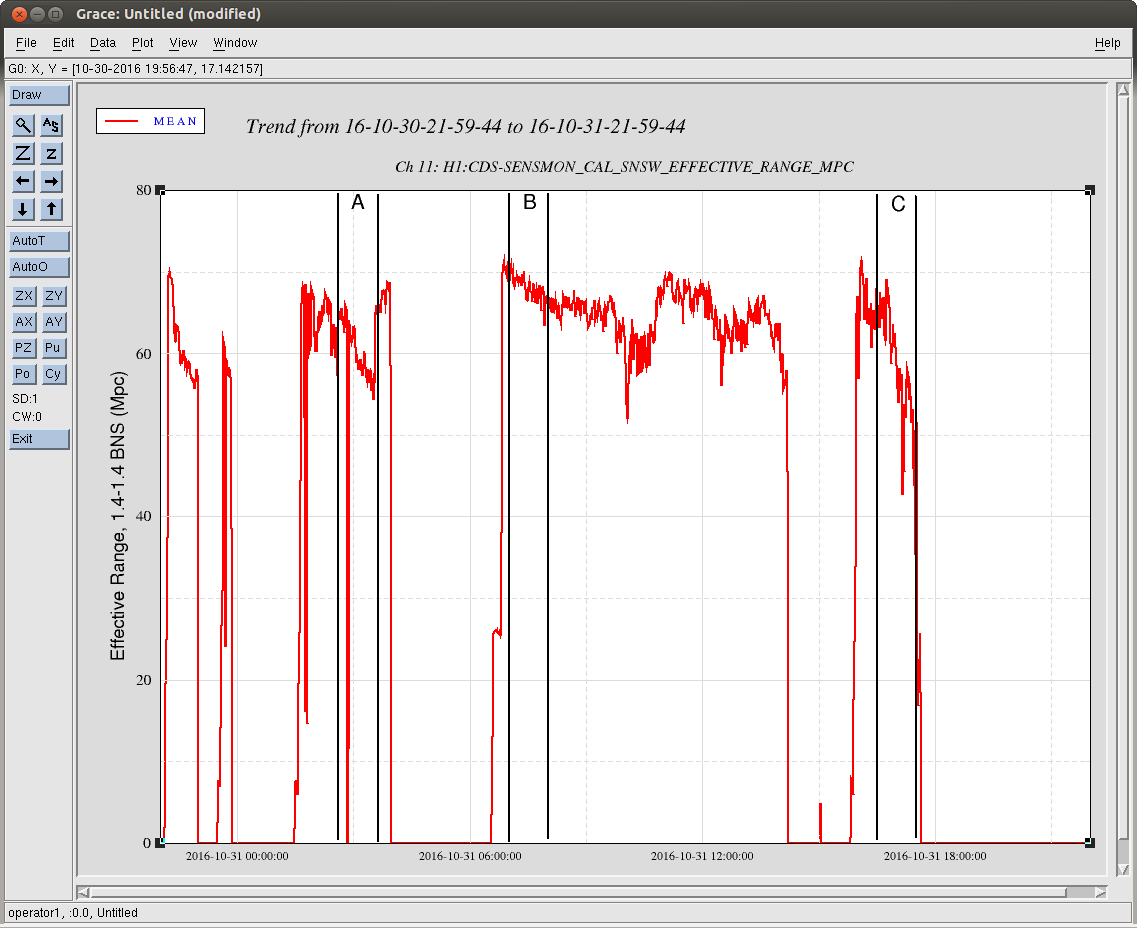
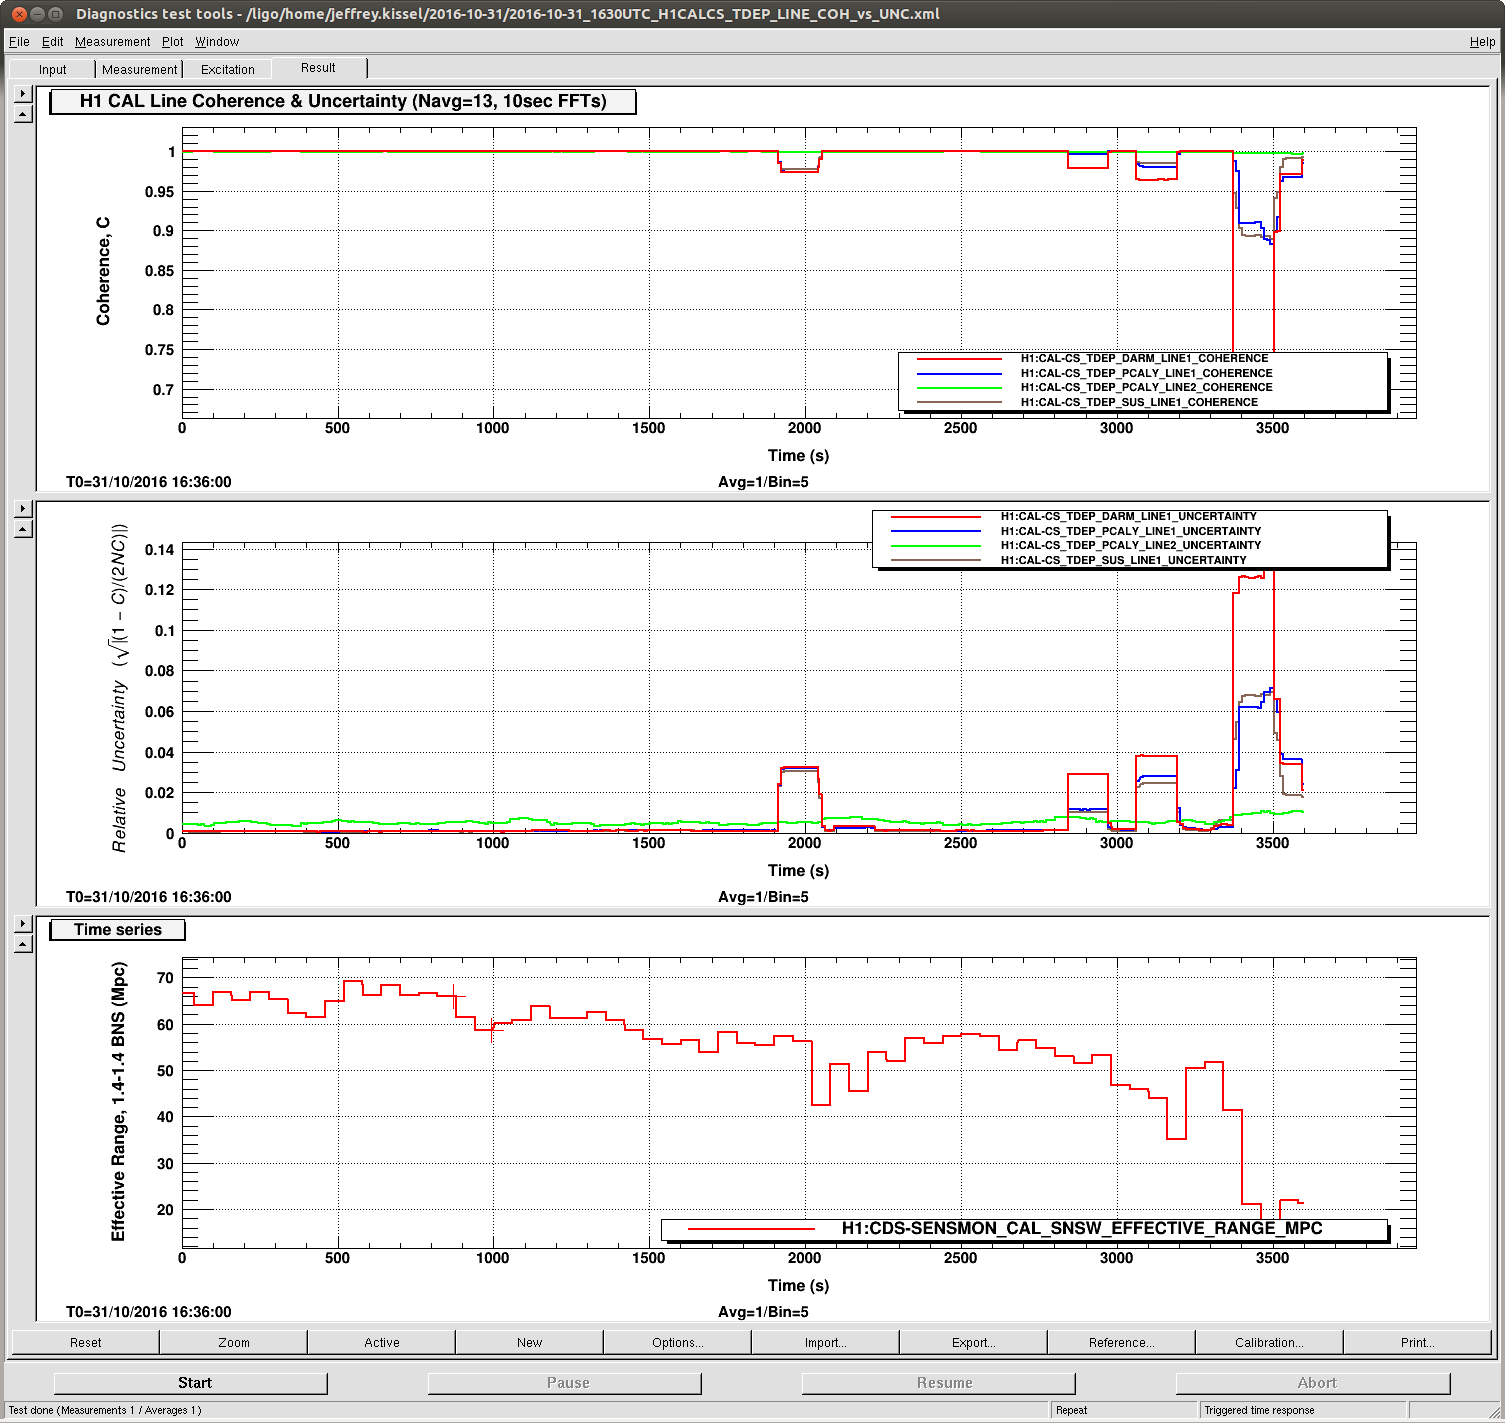
In data set C -- (this is during the ghoulish lock stretch)
- One can see when the data goes bad, it goes bad in weird, discrete chunks. The width of these chunks is 130 sec (almost exactly), which I suspect is a digital artifact of the 13 averages and 10 sec FFTs. The sensitivity was popping, whistling, and saturating SUS left and right during this stretch, at a much quicker timescale than 100s of seconds.
In data set B --
- This is an OK sensivity stretch. The good thing is that the coherence/uncertainty appears to be independent of any fast glitching or overall sensitivity, as long as we stick in the 60-75 Mpc range.
- Interestingly, there's either a data dropout, or terrible time period during this stretch (as indicated by the BNS range going to 0) -- but it's only ~120 sec. If it's a data drop out -- good, the calculation is robust against whatever happens in DMT land. If it's a period of glitchy interferometer, it's very peculiar that it doesn't affect the uncertainty calculation, unlike with data set C.
Based on these data sets, I think it'll be safe to set the uncertainty threshold at 1%, and if the uncertainty exceeds that threshold, the associated parameter value gets dumped from the calculation of the average that is applied to h(t).
So, in summary -- looks like the calculations are working, and their calculated value roughly makes sense when the IFO is calm. There're a few suspicious things that we need to iron out when the IFO isn't feeling so well, but I think we're very much ready to use these coherence calculations as a viable veto for time-dependent parameter calculations.
Jeff K, Darkhan T,
We investigated further the 130s drop in coherence in the data set C (see LHO alog 31040 above).
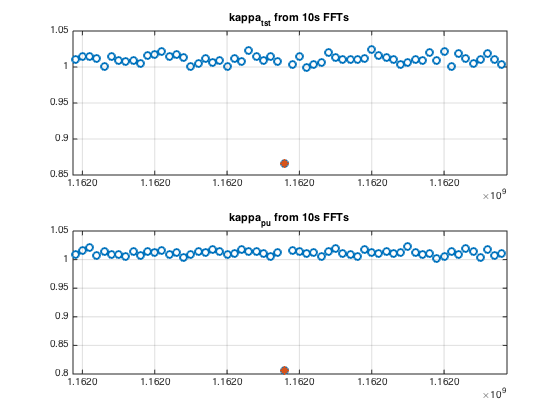
This drop was possibly caused by a bad data point(s) ("glitch") at the beginning of this drop (when first glitchy data point entered the 130s averaging buffer). A quick look at kappas calculated in PcalMon from 10s FFTs during 600s around time of the glitch indicates that outliers in κTST and κPU values are found only in one of the 10s intervals. This interval is GPS [1161968880, 1161968890) (see attachment 1).
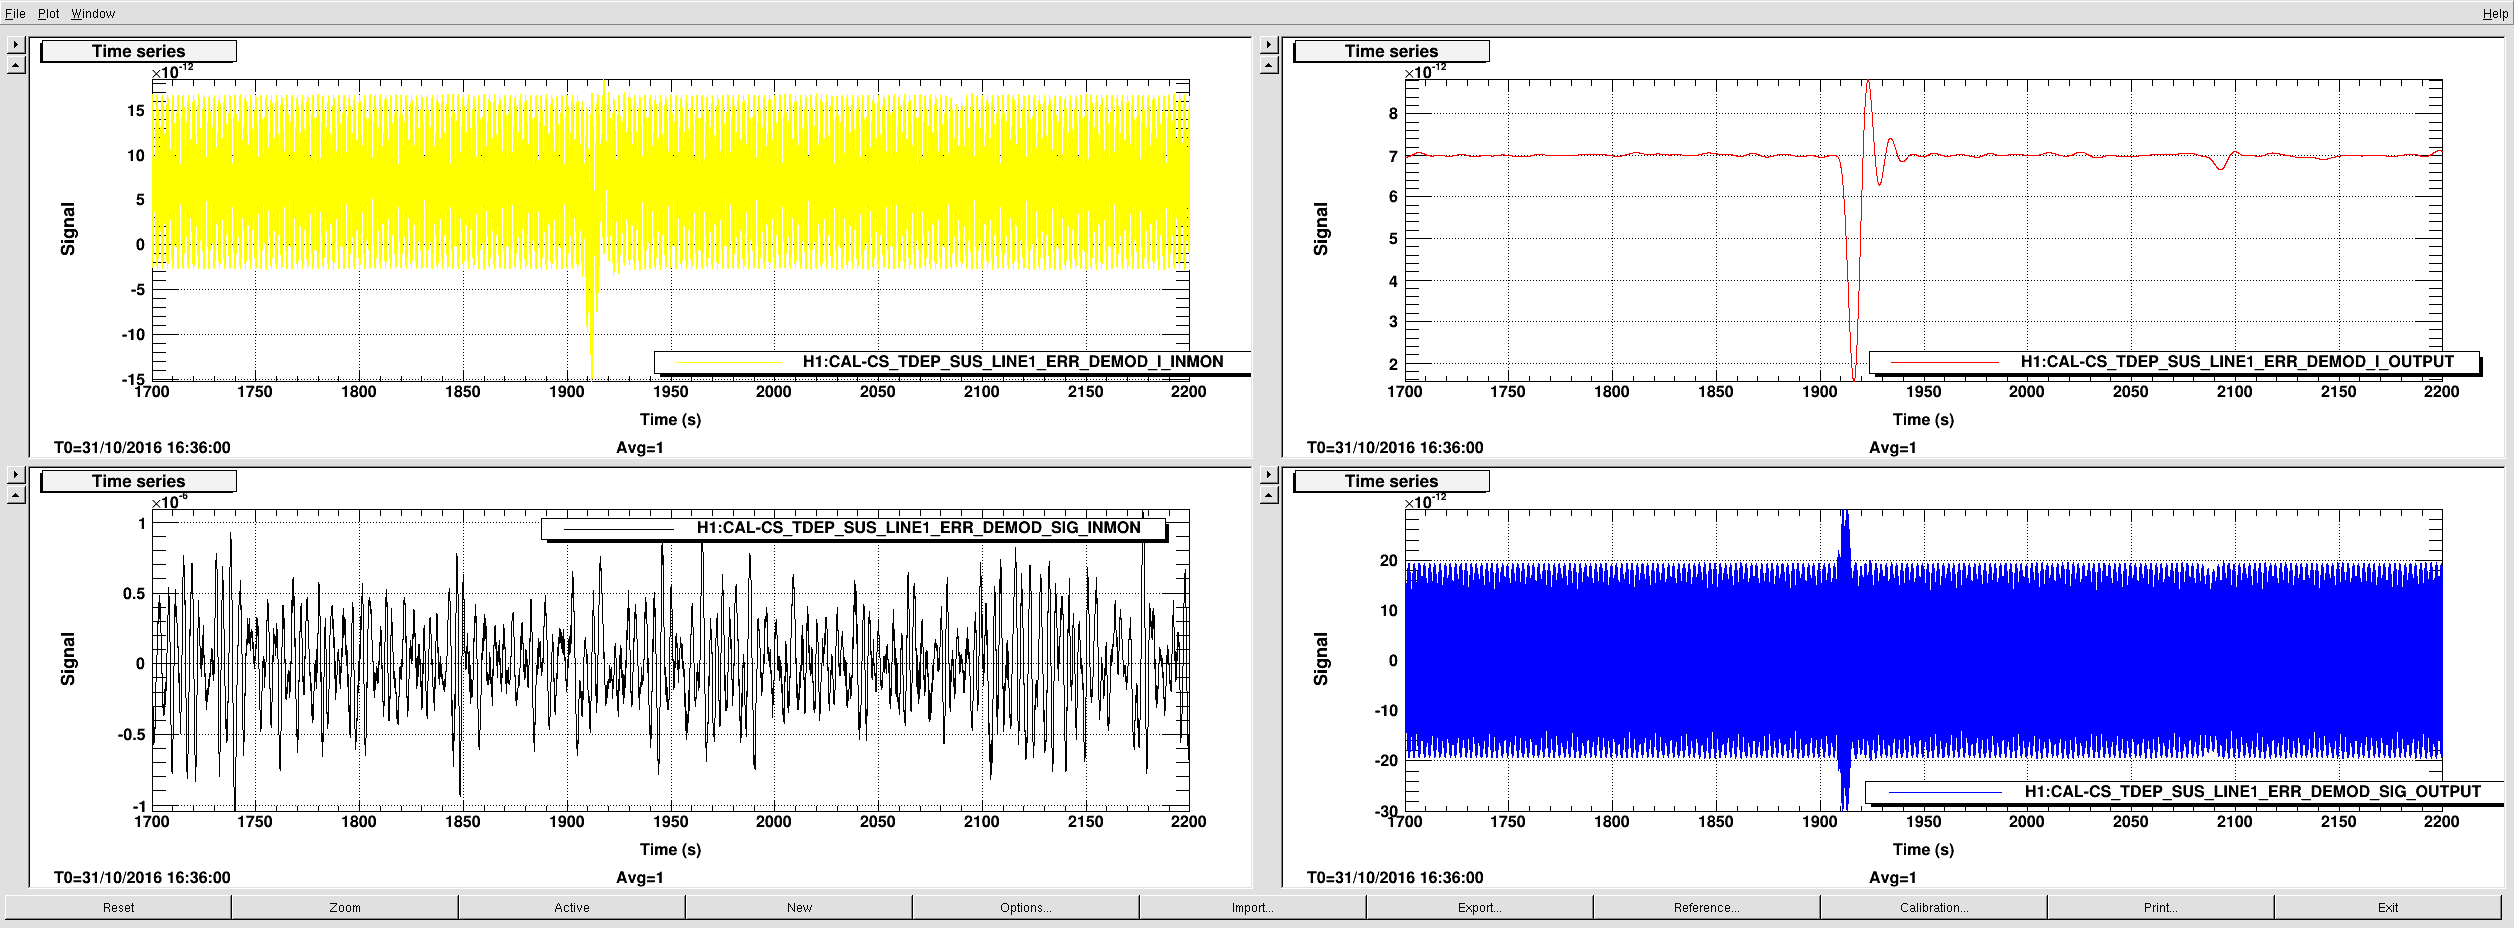
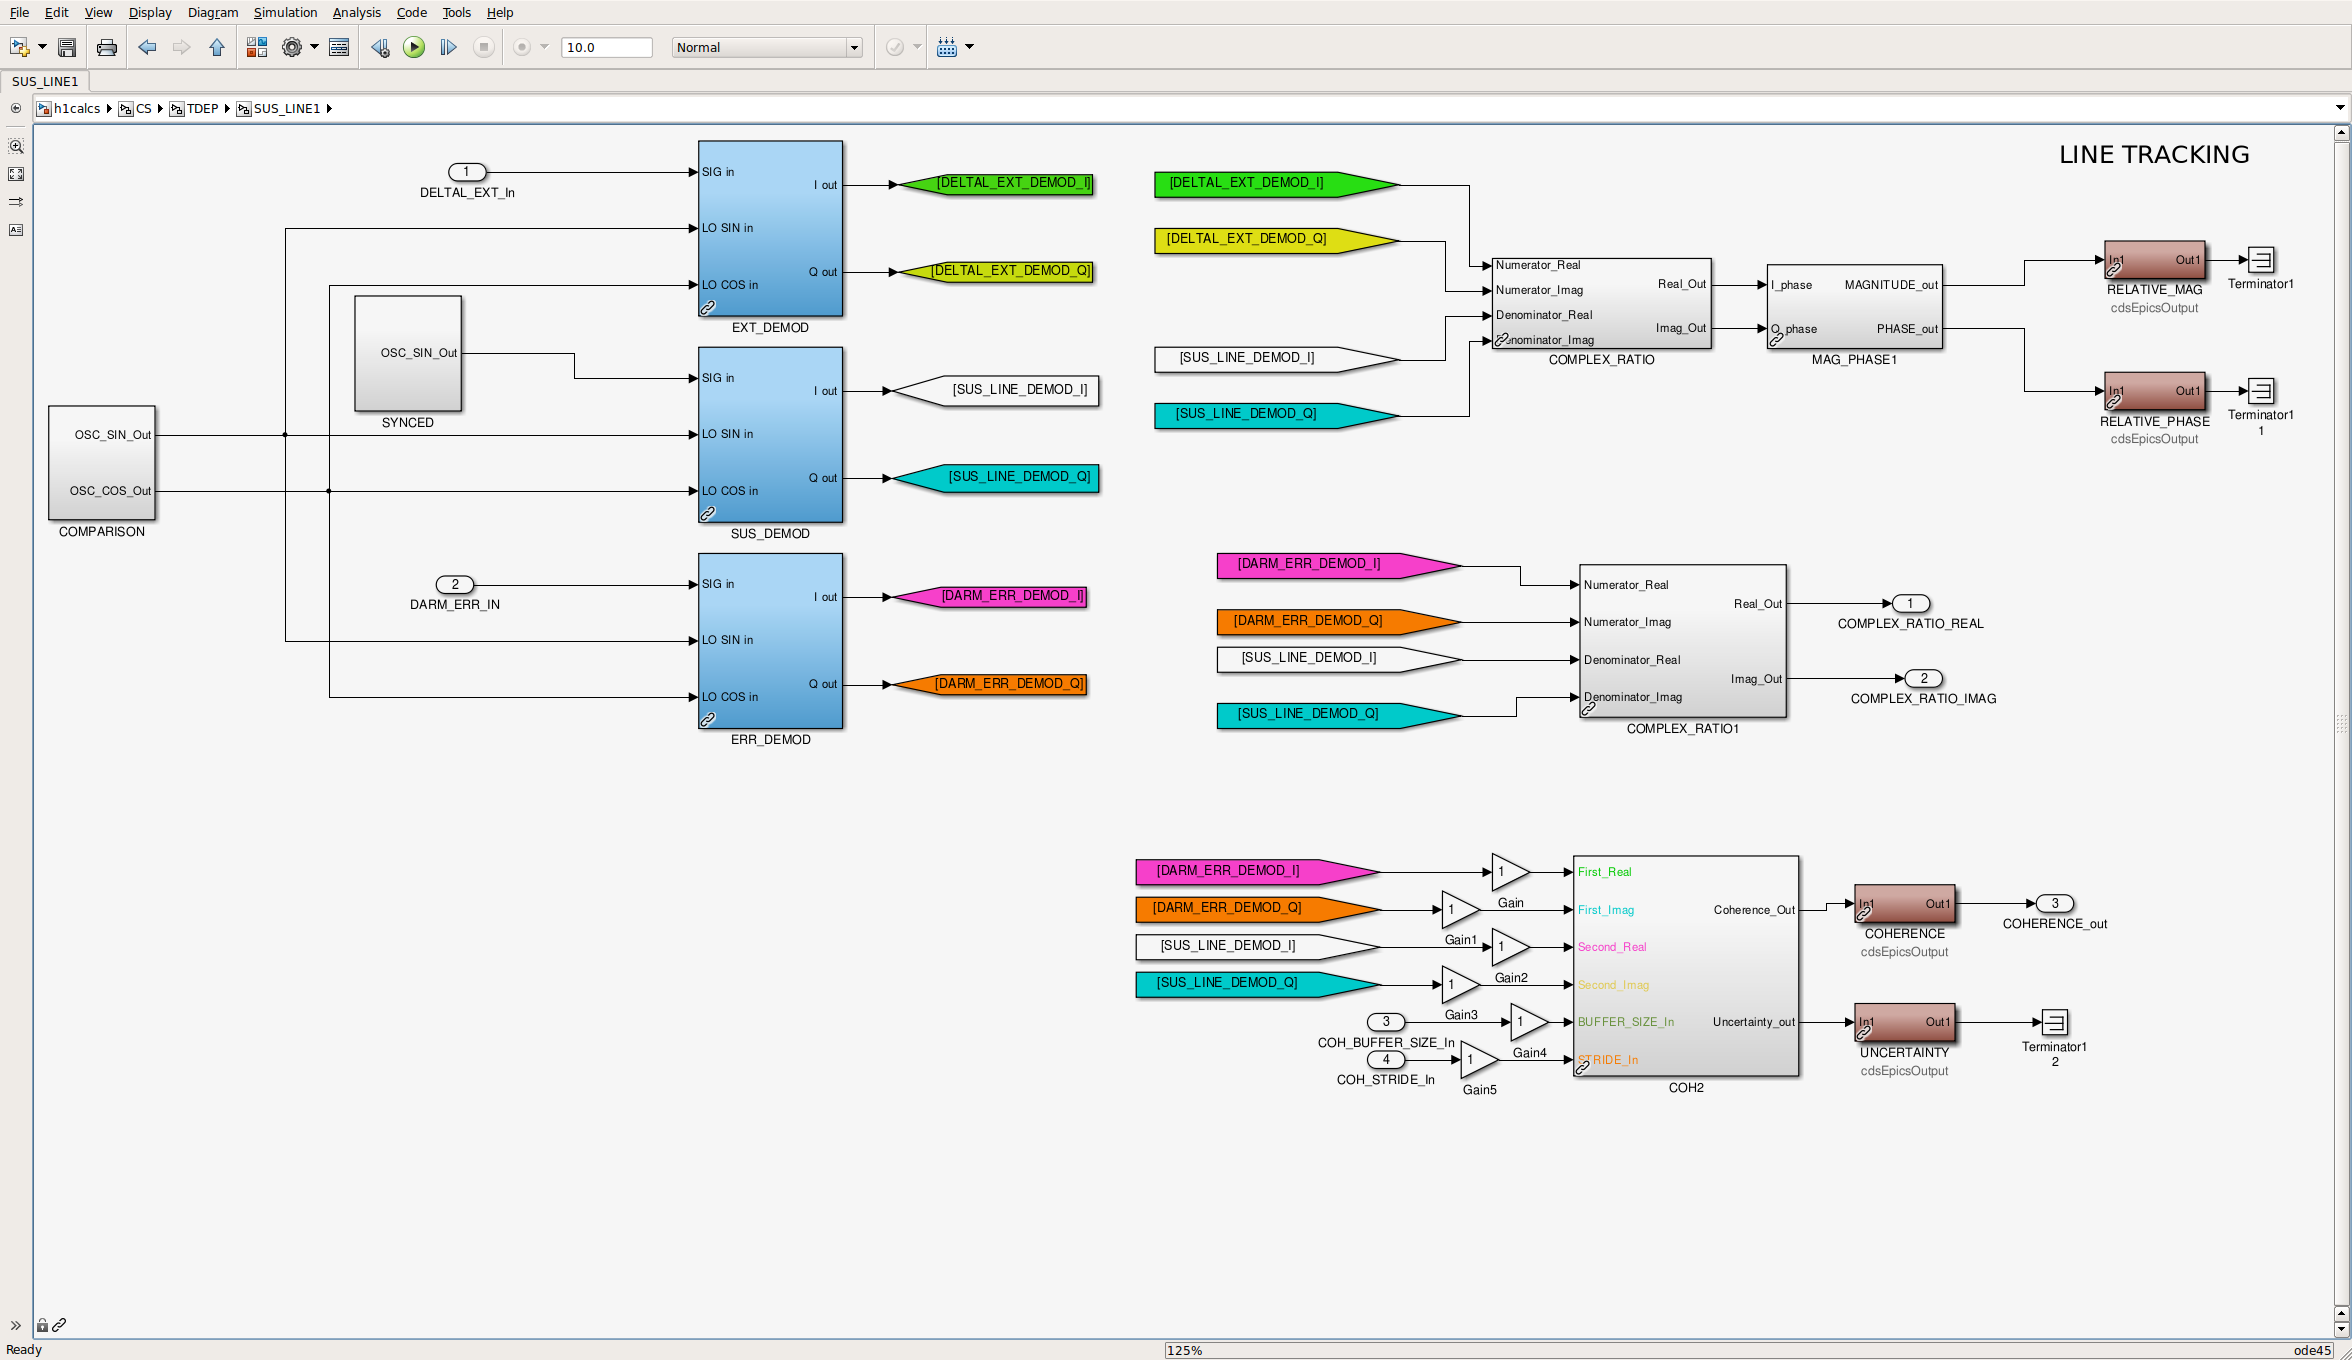
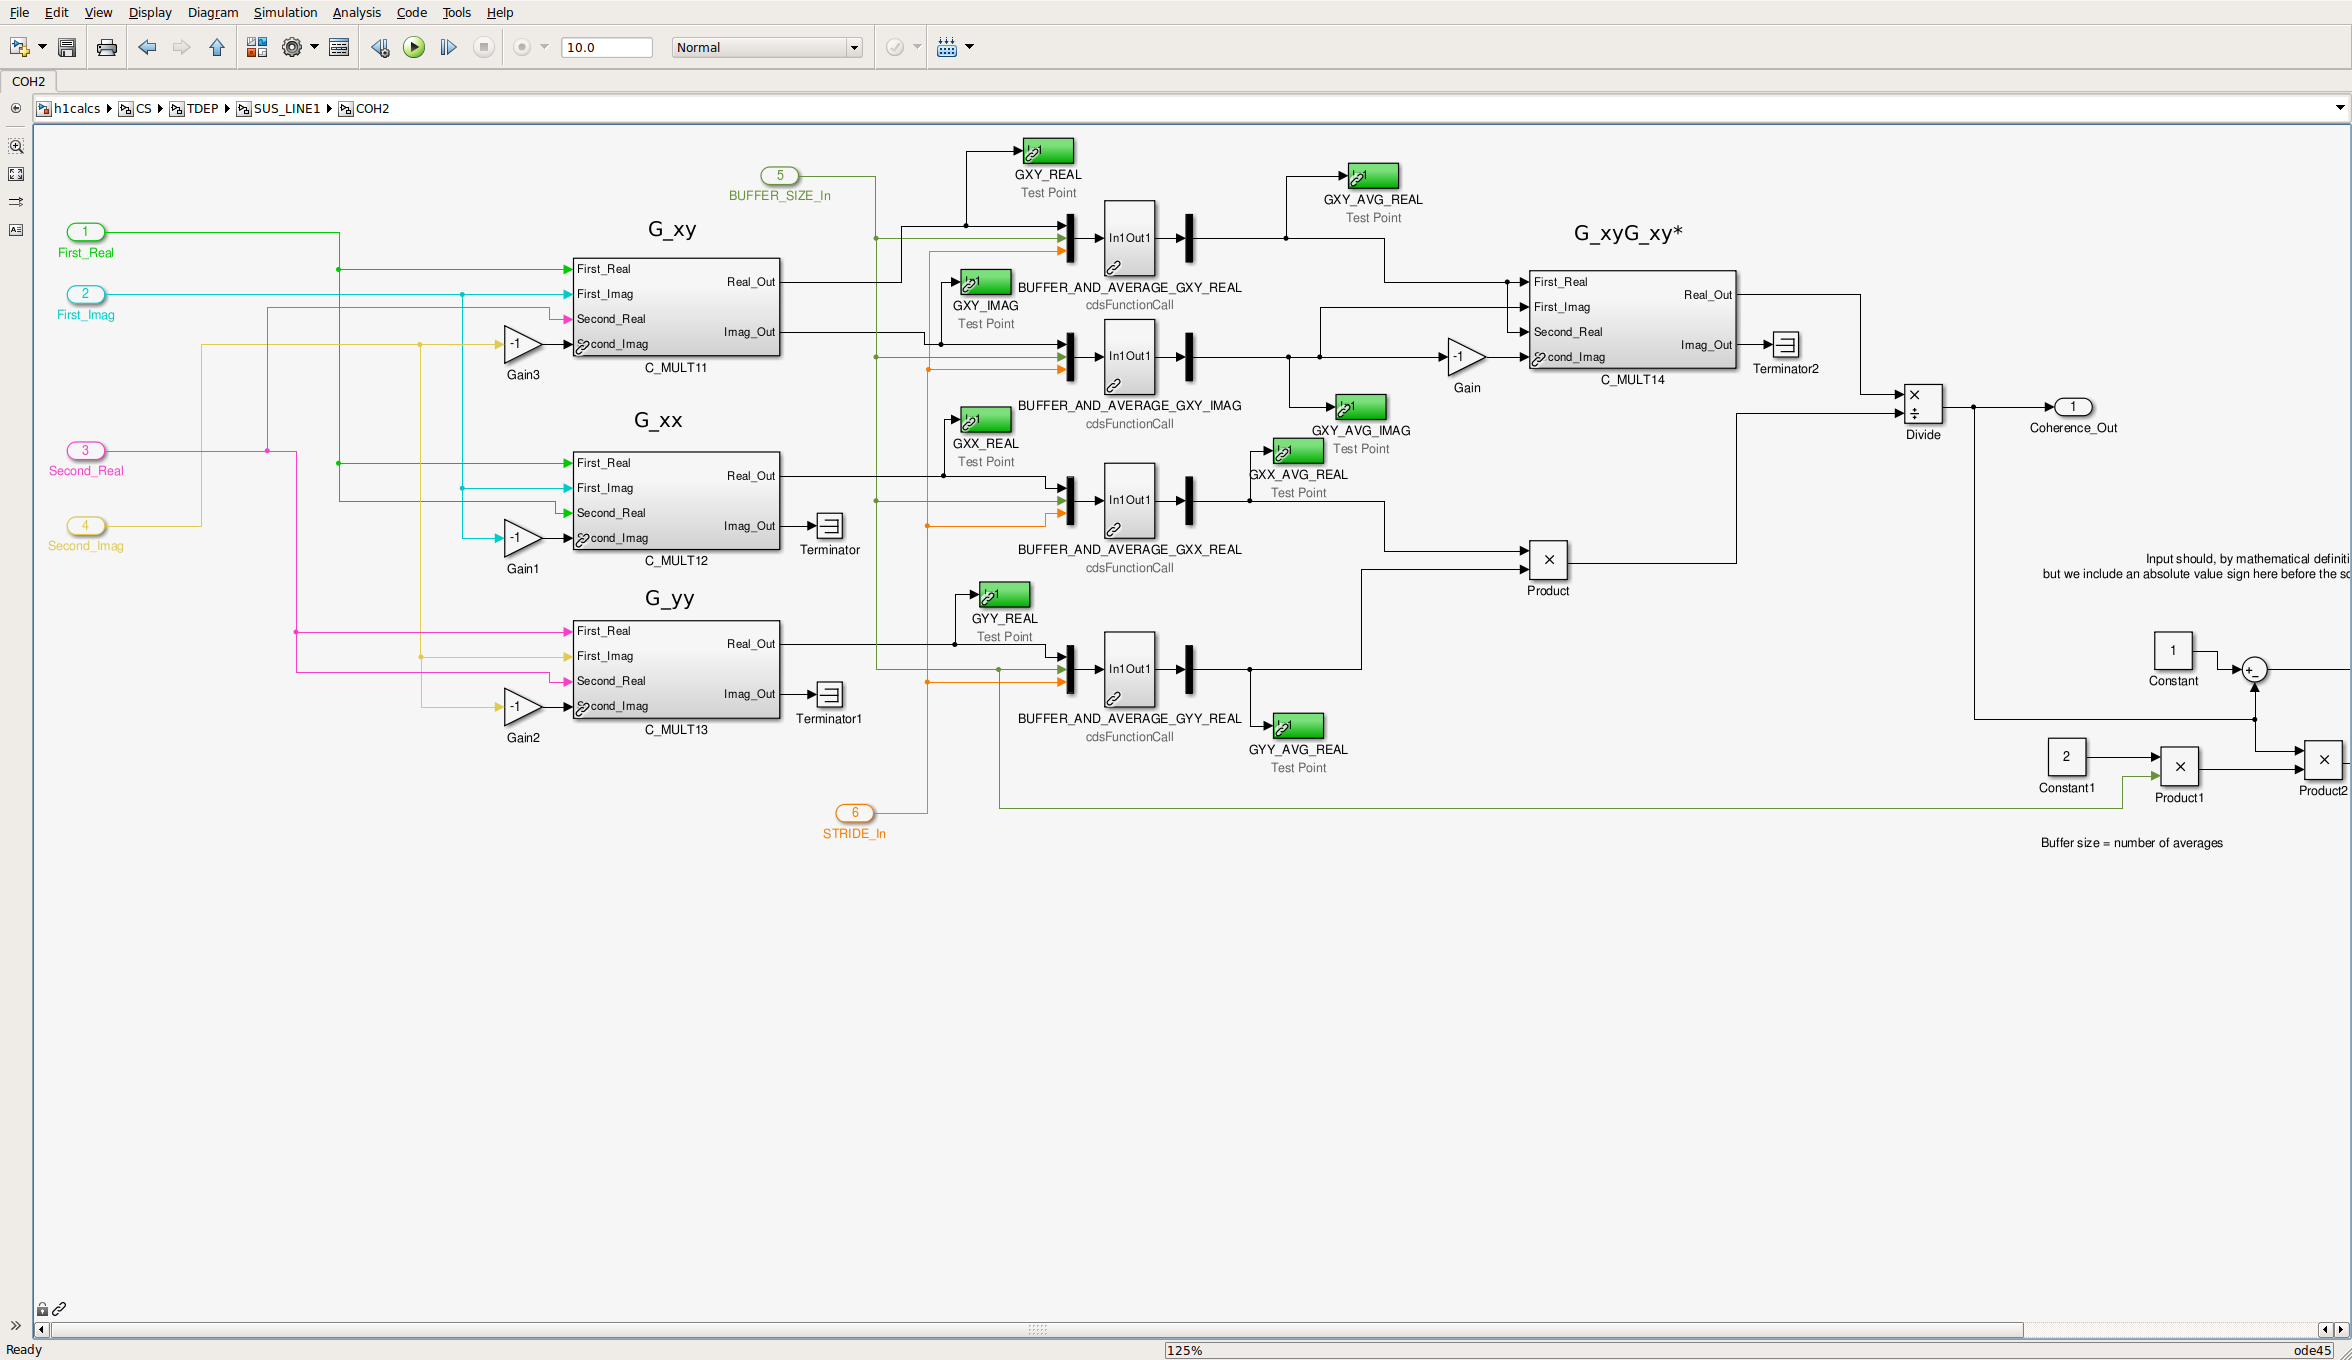
A look at slow channels indicate that the glitch produced impulse responses lasting just under 10s before 0.1Hz low-pass filter and roughly 30s after the filter, DARM_ERR demodulated at 35.9 Hz (see upper panes in attachment 2, ). Start of the glitch is at ~1910s (GPS 1161968887). In the coherence calculation block of the CAL-CS model (attachments 3 and 4), it can be seen that the glitch lasts 20-30s in EPICS records preceeding the 130s averaging blocks (BUFFER_AND_AVERAGE), but results in reduction of the calculated coherence value for 130s (see attachment 5).
If we use coherence values from the CAL-CS front-end model as a threshold for "bad kappas", this kind of glithces will result in unnecessarily marking 130s of kappas as "bad". GDS median kappas should not be sensitive to this kind of short glitches, however CAL-CS front-end κTST were affected for ~250s (front-end kappas are low passed with a 1/128 Hz IIR filter) (see attachment 5).
A potential (not yet tested) solution would be to replace BUFFER_AND_AVERAGE (running aveage) script with a running median. And a similar script can be used for averaging of the front-end kappas, which would also reduce discrepancies between GDS and front-end kappas.