patrick.thomas@LIGO.ORG - posted 17:17, Friday 19 May 2017 - last comment - 17:46, Friday 19 May 2017(36294)
Unrealistic data for some vacuum channels
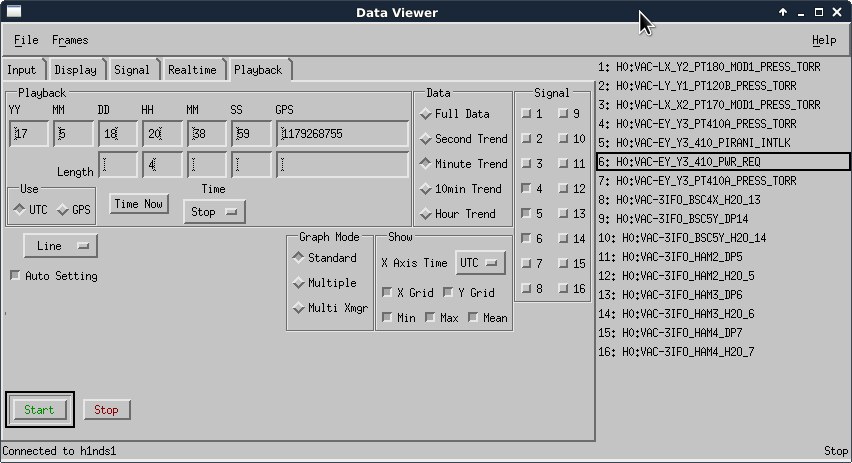
Gerardo, Jonathan, Patrick

We used dataviewer to plot the raw, second and minute trends for the following channels from May 18 2017 16:38:59 UTC - May 18 2017 20:38:59 (attached):

H0:VAC-EY_Y3_PT410A_PRESS_TORR
H0:VAC-EY_Y3_410_PIRANI_INTLK
H0:VAC-EY_Y3_410_PWR_REQ

H0:VAC-EY_Y3_410_PIRANI_INTLK should only be either 0 or 1. In the second trends it takes a value of ~ 2.2.
In the seconds trends H0:VAC-EY_Y3_PT410A_PRESS_TORR jumps from 0 to 1, which is not realistic for a pressure reading.
Images attached to this report
Non-image files attached to this report

Comments related to this report
Using h1nds1 port 8088.
More second plots of anomaly, window is 14 hours long, event is about 8.5 hours, unrealistic data noted at CS, EY and EX, not noted (but only small sample of channels checked) at Mids.
Other subsystems affected, but only sampled a few channels from FMCS and ASC.
Non-image files attached to this comment