jeffrey.kissel@LIGO.ORG - posted 13:01, Wednesday 07 March 2018 (40878)
EY / BSC10 Electric Field Measurements -- Take 3: Driven Fields Clearly Visible Above Sensor Noise
J. Kissel, G. Mansell
Georgia and I gathered one last data set with the prototype electric field sensor at BSC10 / EY, with the goal of measuring a few driven fields: the ISI coil drivers and the SUS ETMY's ESD Shield. With a reasonable drive (sine waves @300 Hz, with ~40% of the DAC range for the ISIs, as-low-as 5 Vpp on the ESD shields) we can resolve both clearly above the noise floor.
Attached are the results, in 2018-03-06_H1SUSETMY_BSC10_EFM_Results.pdf
We conclude (at the respective frequencies), the field generated per unit drive is
Field Coupling Units Notes
ISI ST1 Coils 0.8723 (V.m^{-1}).A^-1 (Driven in V, 3 Vertical Actuators,
answer = mean(field ./ (3*current drive on V1)))
3.7284e-10 (V.m^{-1}).(DAC ct)_Z^{-1} (answer = mean(field ./ (3*dac count drive on V1)))
ESD Shield 0.0024451 (V.m^{-1}).V (answer = mean(field ./ voltage drive on shield))
%%%%%%%%%%%
Details
%%%%%%%%%%%
Measurement Setup Notes
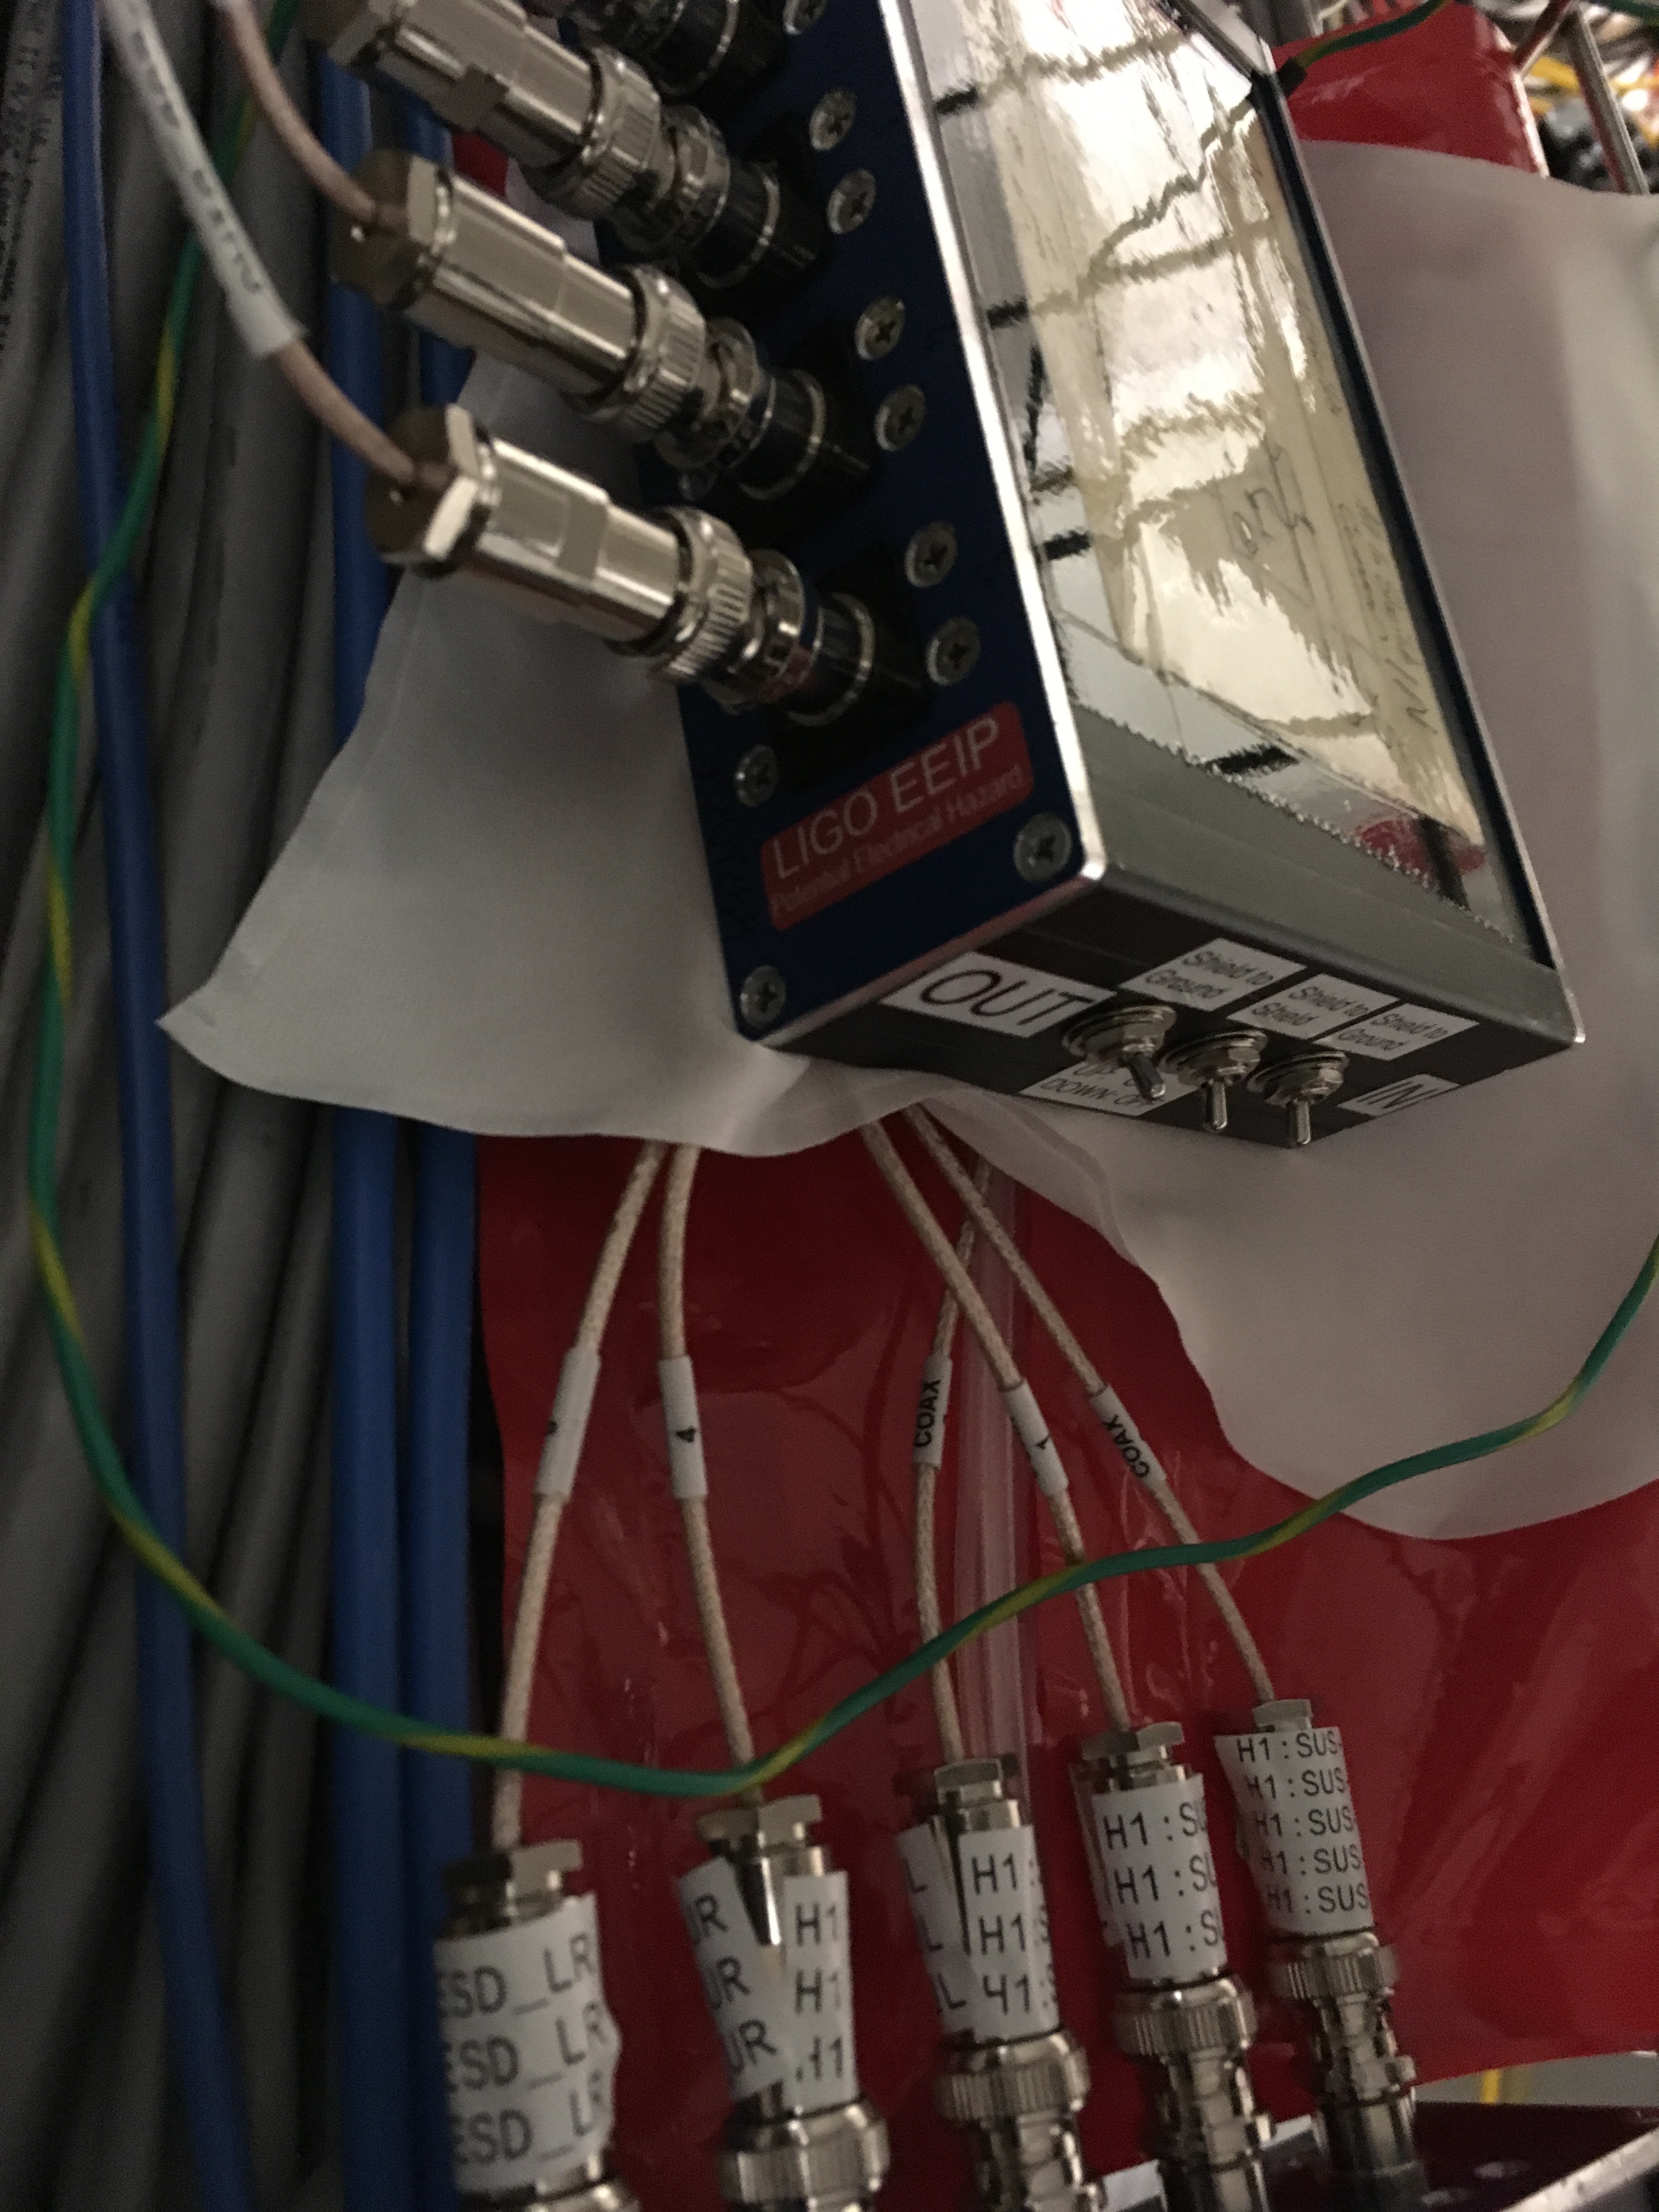
The ESD Cabling vs. The SHV Passthrough Box in which one can configure how the shields are connected, a.k.a "Shield Box"
Associated Pictures: 2018-03-06_H1SUSETMY_ESD_CablesAtFeedThru_AsFound_Pics.pdf
- We went up to the mezzanine work platform above BSC10 in order to connect / replace the current limiting resistor (CLR) box with the Shield Box, and we were surprised to find the chamber-feedthru-to-CLR-box-side of the ESD cables disconnected from the CLR box. This was both convenient and inconvenient for us: the cables we needed to connect to the Shield Box were already disconnected, but that meant we had to assume the cable ordering from the rack-side of the CLR box was correct and the box was a passthrough (I was 90% confident of this, but I note that this box is not in the wiring diagram -- D1400177). The order we found connected:
Rack-side CLR Rack-side
Box Label Cable Label
1 LR
2 UR
3 UL
4 LL
5 Bias
- Before connecting the chamber-feedthru-to-CLR-box-side of the ESD cables to the Shield Box, we tested whether the CLR-box side of the shields were grounded w.r.t. the chamber (a.k.a. "floating"). The were not grounded; they were floating. We did not check whether the chamber-feedthru side of the cables were grounded. We should have, but we're reasonably confident that the CDS team confirms this regularly.
Driving the Shield:
Associated Pictures: 2018-03-06_H1SUSETMY_BSC10_ShieldDrive_Setup_Pics.pdf
- After connecting the chamber-feedthru-to-CLR-box-side of the ESD cables to the Shield Box (in the above described order), we had a frustrating amount of trouble trying to keep the Shield box (electrically) floating, i.e. preventing it from grounding, and making sure what voltage we applied to the Shield Box's shield "excitation" wire + gator clip actually went to the shields of the chamber-feedthru-to-CLR-box-side of the ESD cables. The "ShieldDrive_Setup_Pics" picks show that we needed the already-there clean wipe bag, and several used clean wipes in order to get the Shield Box chassis and all shields floating the desired affect, that driven voltage showed up on the shield and only the shield of the chamber-feedthru-to-CLR-box-side of the ESD cables.
- We used an analog SR DS340 wave function generator to drive the shield, with the "func out" output set to High-Z. The output was connected to the gator-clip of the Shield Box's excitation cable with a BNC to clip-lead adapter that had its clip leads cut off. We were sure to wrap the gator-clip + (red) signal bare wire in a used cleanroom wipe to ensure shielding from ground. The (black) shield wire was floating in air.
- In order to test that the drive was making it to the chamber-feedthru-to-CLR-box-side of the ESD cable shield and the system was otherwise floating, we requested a 1 V_{pk} offset from the SR DS340, and measured the potential difference between ground and the CLR-box side (now the Shield Box side) of the chamber-feedthru-to-CLR-box-side of the ESD cables.
- We then BNC T'd in an oscilliscope to confirm the output levels of our various sine-wave drives (removing the 1V offset).
The Field Meter:
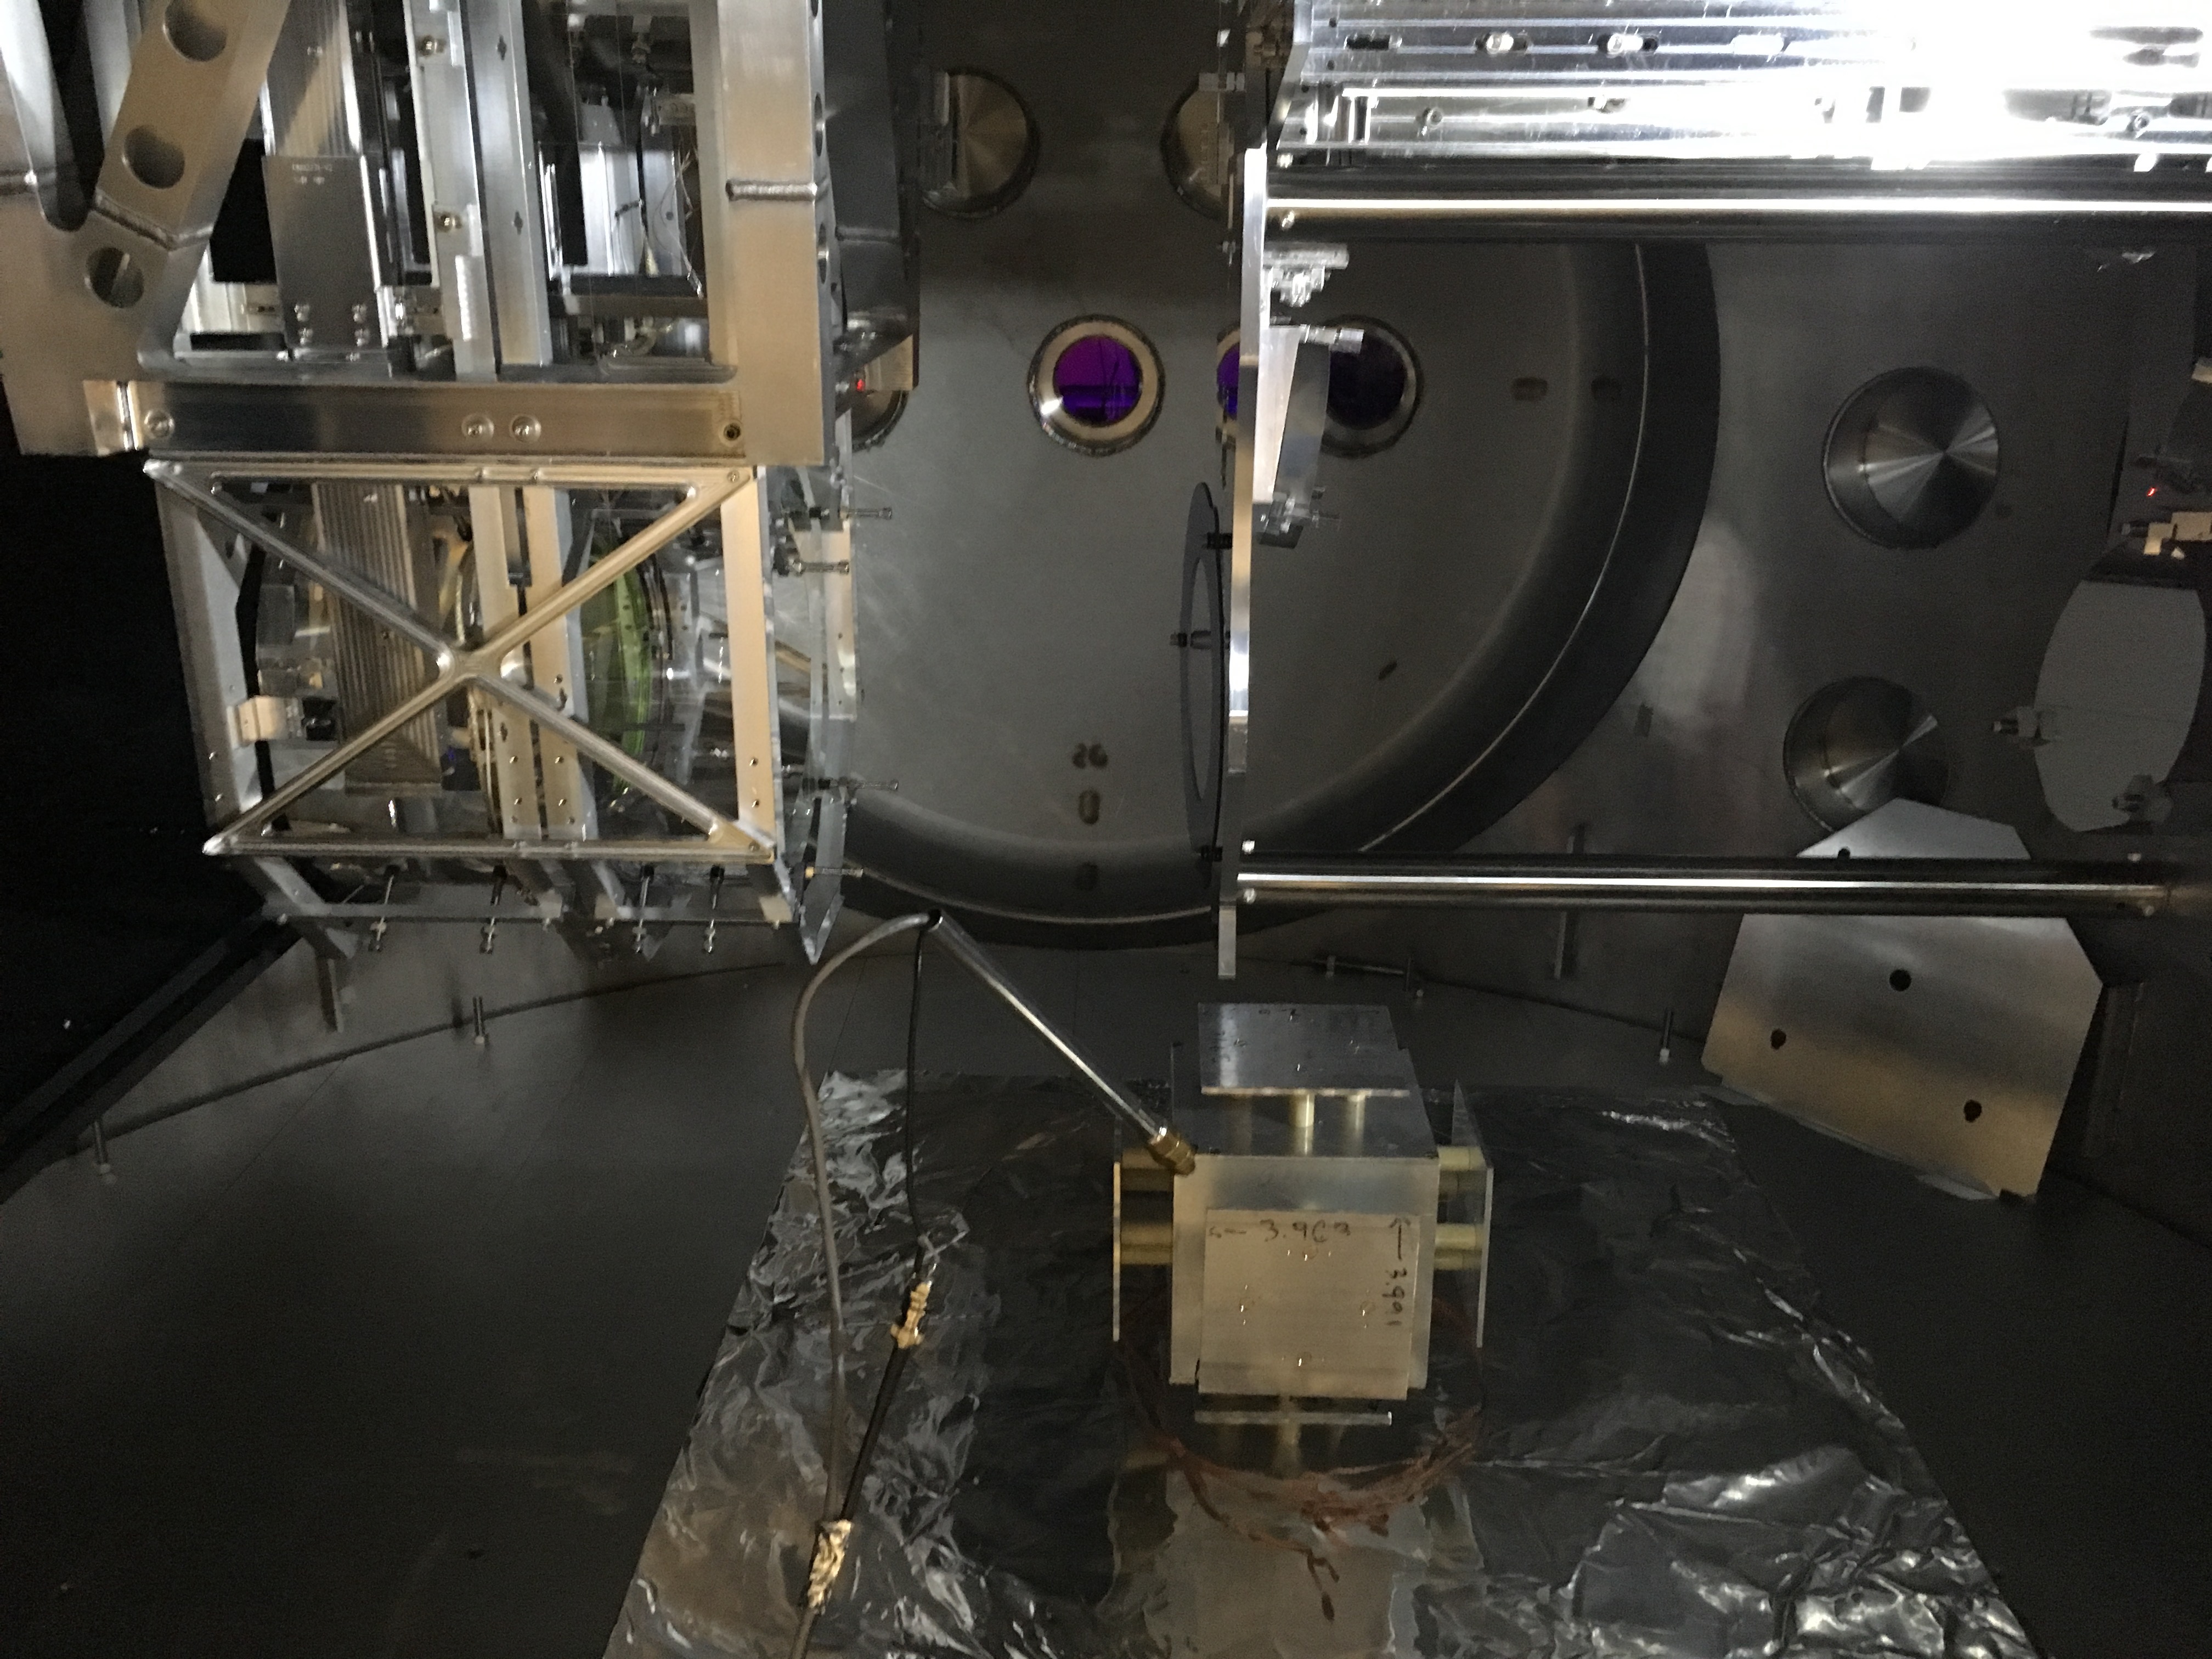
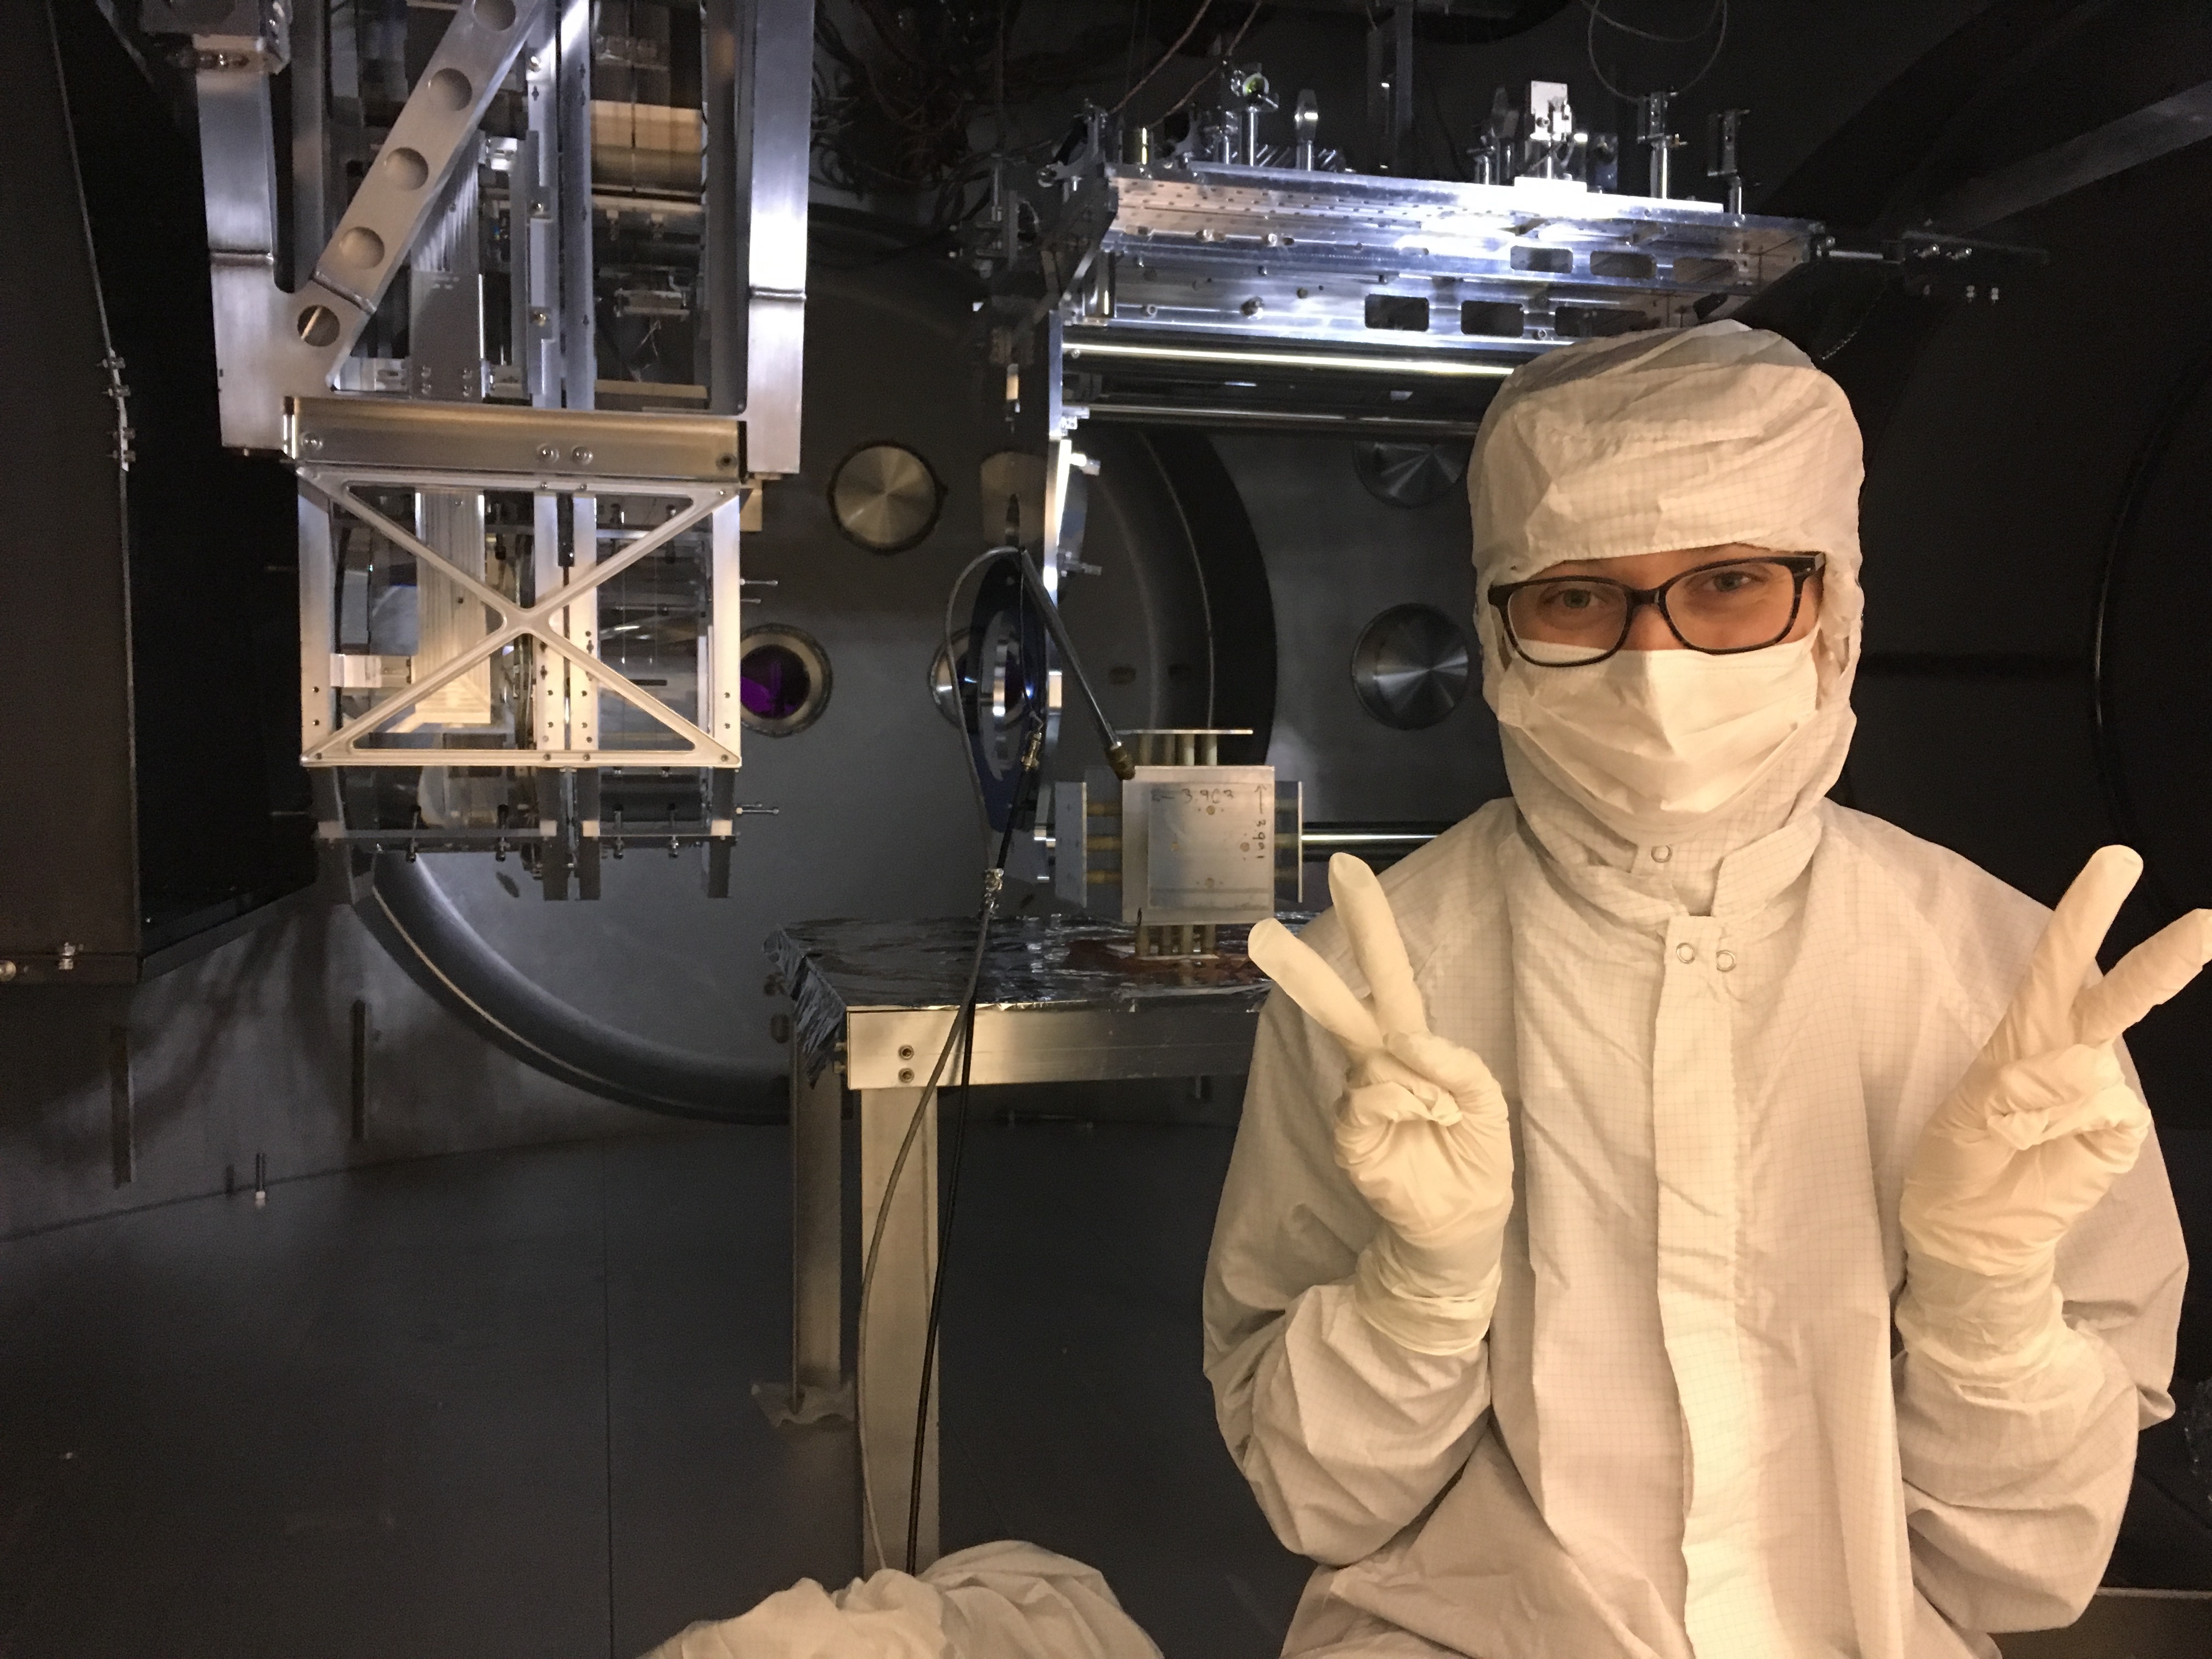
Associated Pictures: 2018-03-06_H1SUSETMY_BSC10_InChamber_Electrometer_Pics.pdf
- We re-installed the prototype field meter in the middle of the chamber on the bench that was in chamber. It was set up to measure the field in the longitudinal direction.
- We guess that the field meter is about 0.75 meters away from the EY test mass, in the +X, +Y global coordinate direction.
- Of acoustical note from the last time, this bench was sitting on used clean wipes, where as the previous measurements' bench had not.
- At the request of others, we took a full-span measurement of the ambient chamber field (with the door covered in foil to rudimentarily complete the chamber faraday cage) with the return of the battery box floating (i.e. with the white banana clip hooked into the battery box, no grounding clip) and grounded (i.e. with the banana clip hooked into the battery box, and also electrically connected to ground). We saw no difference in these results (see pg 4 of the EFM_Results.pdf attachment) so we measured the remaining driven results with the return floating.
- We used this reference ASD to find a nice quiet / sensitive region to drive. We chose the ~300 Hz region because it was above all of (what we think to be) acoustic noise, but still low enough frequency to be relevant to the most sensitive region of the IFO's DARM sensitivity.
ST1 ISI Z Drive:
- Both stages of the BSC ISI are mechanically locked to Stage 0, and HEPI is locked, so no physical motion of the platform is caused by driving the ST1 actuators at ~300 Hz.
- We had to reset many layers of watchdogs, including the hardware watchdog in the EE HighBay in order to allow for ISI drive to occur.
- Once able, drove the ISI in Z with a 367.3 Hz size wave (via awggui, with a 360-370 Hz 4th other cheby1 bandpass to be sure we were only driving at 367.3 Hz) in the H1:ISI-ETMY_ST1_ISO_Z_EXC field.
- We drove at 200 ct_pk and 400 ct_pk at the ISO_Z_EXC point, which I later confirmed with dataviewer and DTT that that corresponds to identical drive to the V1, V2, and V3 actuators, at the level of 12700 and 25300 ct_pk, which is 8111 and 16223 ct_{rms} (as measured via ASD by a fres = 0.125 Hz BW spectrum, with the default Hann window; NENBW = 1.5, ENBW = NENBW*fres = 0.1875).
- The two amplitudes were to check for / confirm linearity.
ESD Shield Drive:
- With feedthru-to-CL-box ESD cables, the Shield Box, and waveform generator described as above, we drove three sign waves at 383.5, 321.9, and 269.1, to look for frequency dependence, and the first of which at three amplitudes to look for linearity.
Analysis Details
- I calibrated the DAC output of the ISI into current across the coils by dividing by the following calibration (in matlab in post-processing) derived from D1001575,
coildriver.c = zpk(-2*pi*136,-2*pi*[32 300],1);
isiinterface.c = zpk(-2*pi*15.9, -2*pi*0.4, 0.4/15.9);
actuator.g = 20/2^16 * 1.0 * 0.156; % A / DAC ct
calibration.isi.c = actuator.g * coildriver.c * isiinterface.c;
- That results in a calculated current of 3.4 and 6.9 uA_{rms} at 367.3 Hz on each coil.
- To convert this to the total current through the three vertical coils, I just multiply by 3 to get 10.4 and 20.8 uA_{rms}.
- Because the ASD I used is not bin-centered, I scaled this up a bit by the ratio of the data-viewer measured peak amplitude (converted to rms amplitude) and the peak amplitude measured in the MASTER_OUT ASD (again converted to rms amplitude). These factors were a small 10% correction to arrive at the numbers you seen in the legend of plot 2 in EFM_Results.pdf.
- To arrive at the concluding answer above, I took the mean of the to rms amplitude ratios (noting that the SR785 uses a Blackman-Harris window as default, NENBW = 2.0044, fres = 0.25, ENBW = NENBW*fres = 0.5111)
Results Discussion
- It appears the field scales linearly with both ISI and ESD shield excitation. Good! That's why I report the average in the concluding results.
- With three data points, it's tough to say, but the lowest of the three frequencies we drove of the ESD shield showing a larger amplitude makes be suspicious that the shield coupling is frequency dependent.
What's Next
- We intend to bring the field meter down to EX next and do a plethora of further exploratory measurements.
- Take a more detailed frequency response of the field resulting from the ESD shield driving.
- Try driving the signal and bias of the ESD
- Try different DOF excitations on the ISI ST1
- Try driving ISI ST2 actuators. (probably won't see anything, cause they're smaller than the ST1 actuators.)
- Try driving OSEM coils. (probably won't see anything).
- We also intend to project these results to DARM, essentially calibrating LLO's measurements of the shield driving to DARM (LLO aLOG 28675) into electric field units.
Images attached to this report
Non-image files attached to this report
