jeffrey.kissel@LIGO.ORG - posted 12:47, Tuesday 17 April 2018 (41488)
H1 SUS ETMY: Highest Vertical and Roll Modes after BRD Install -- Good enough? Unique Roll Mode Results...
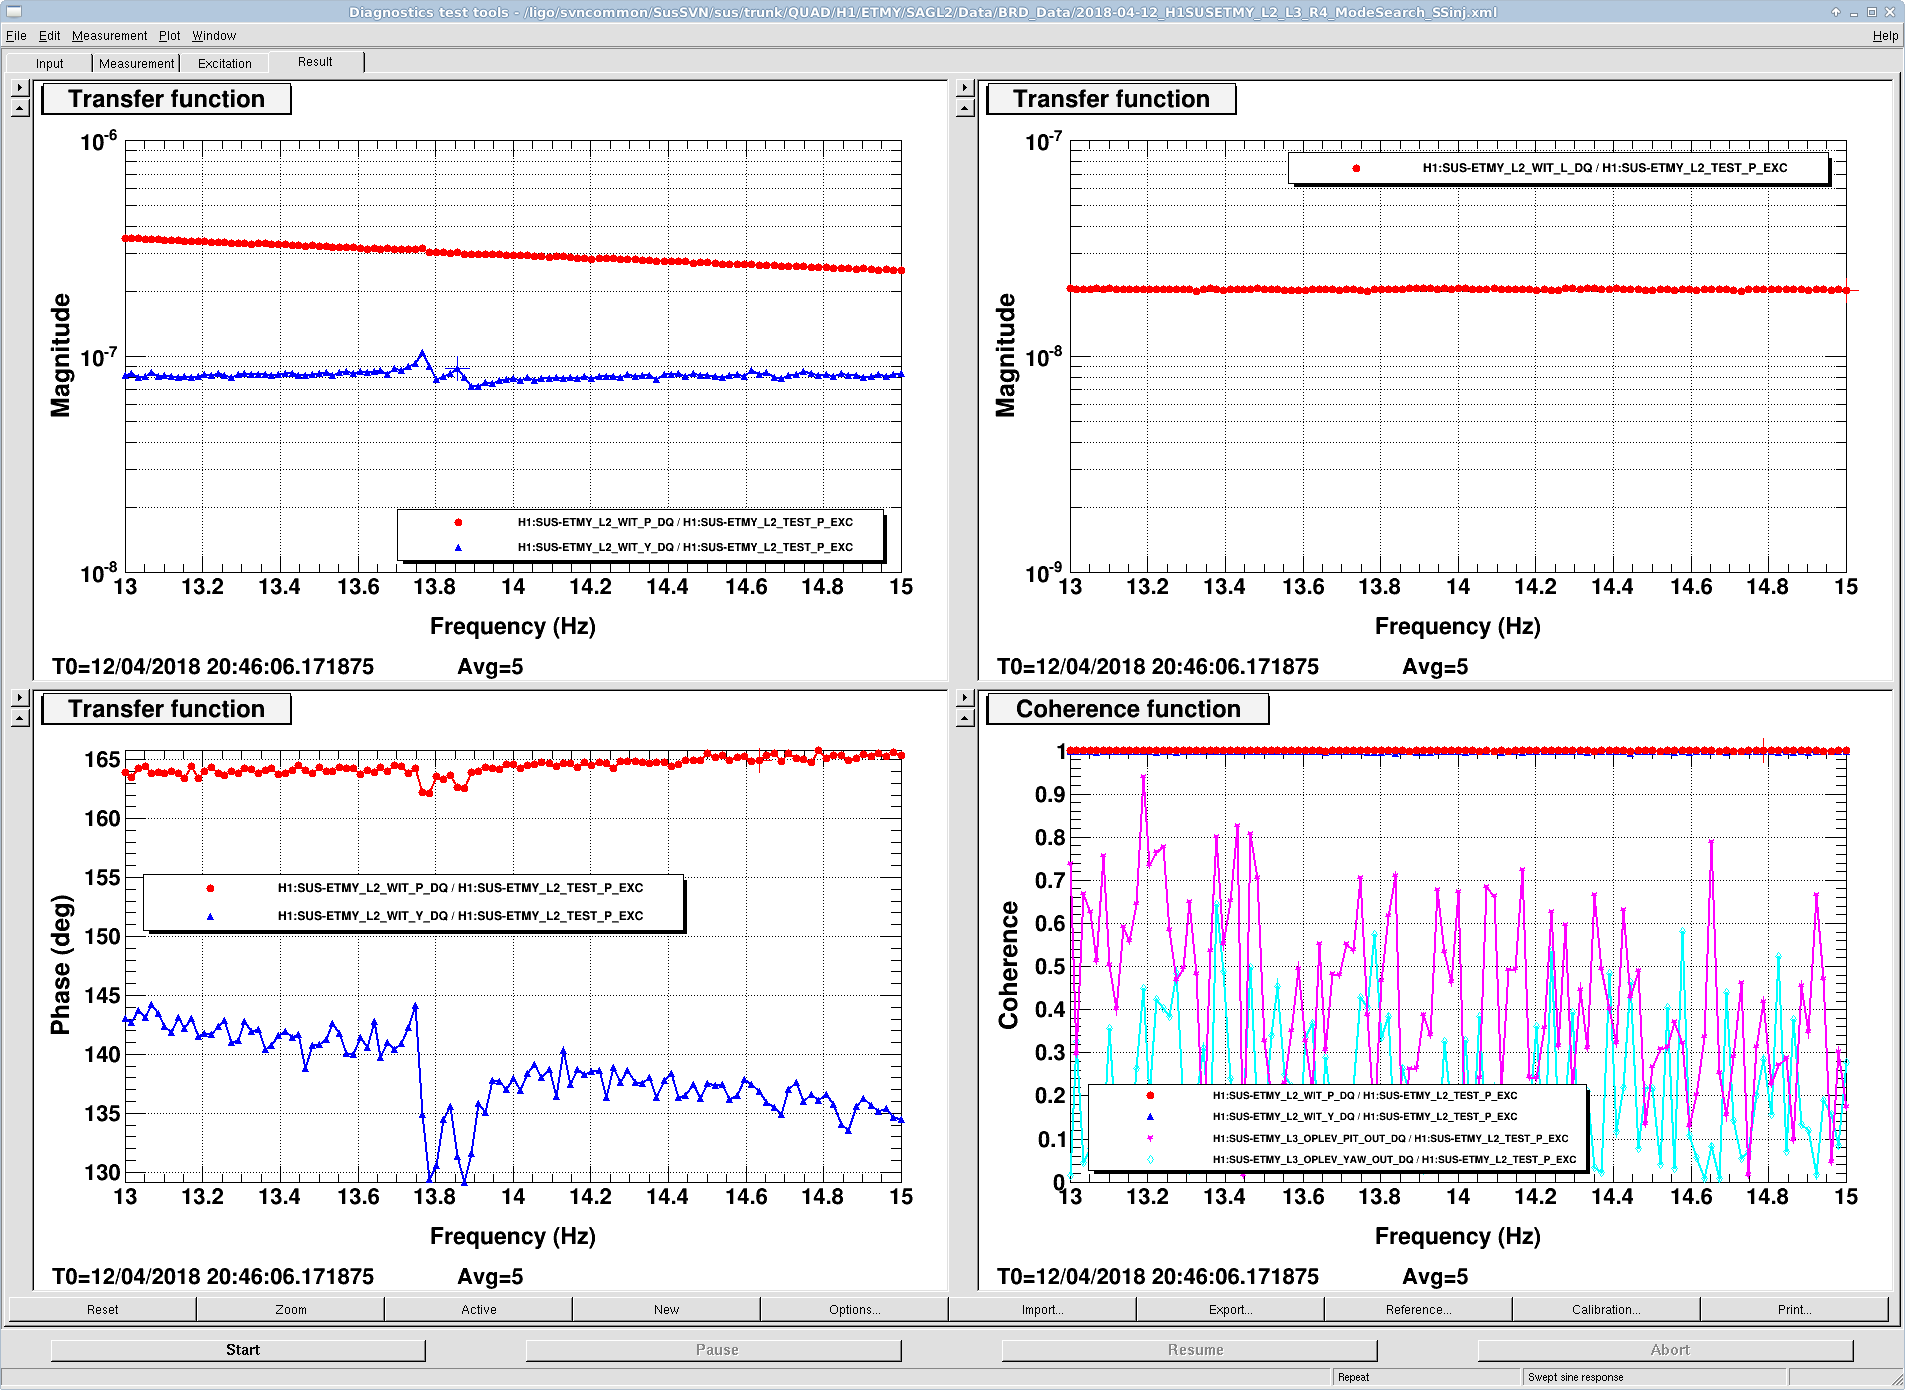
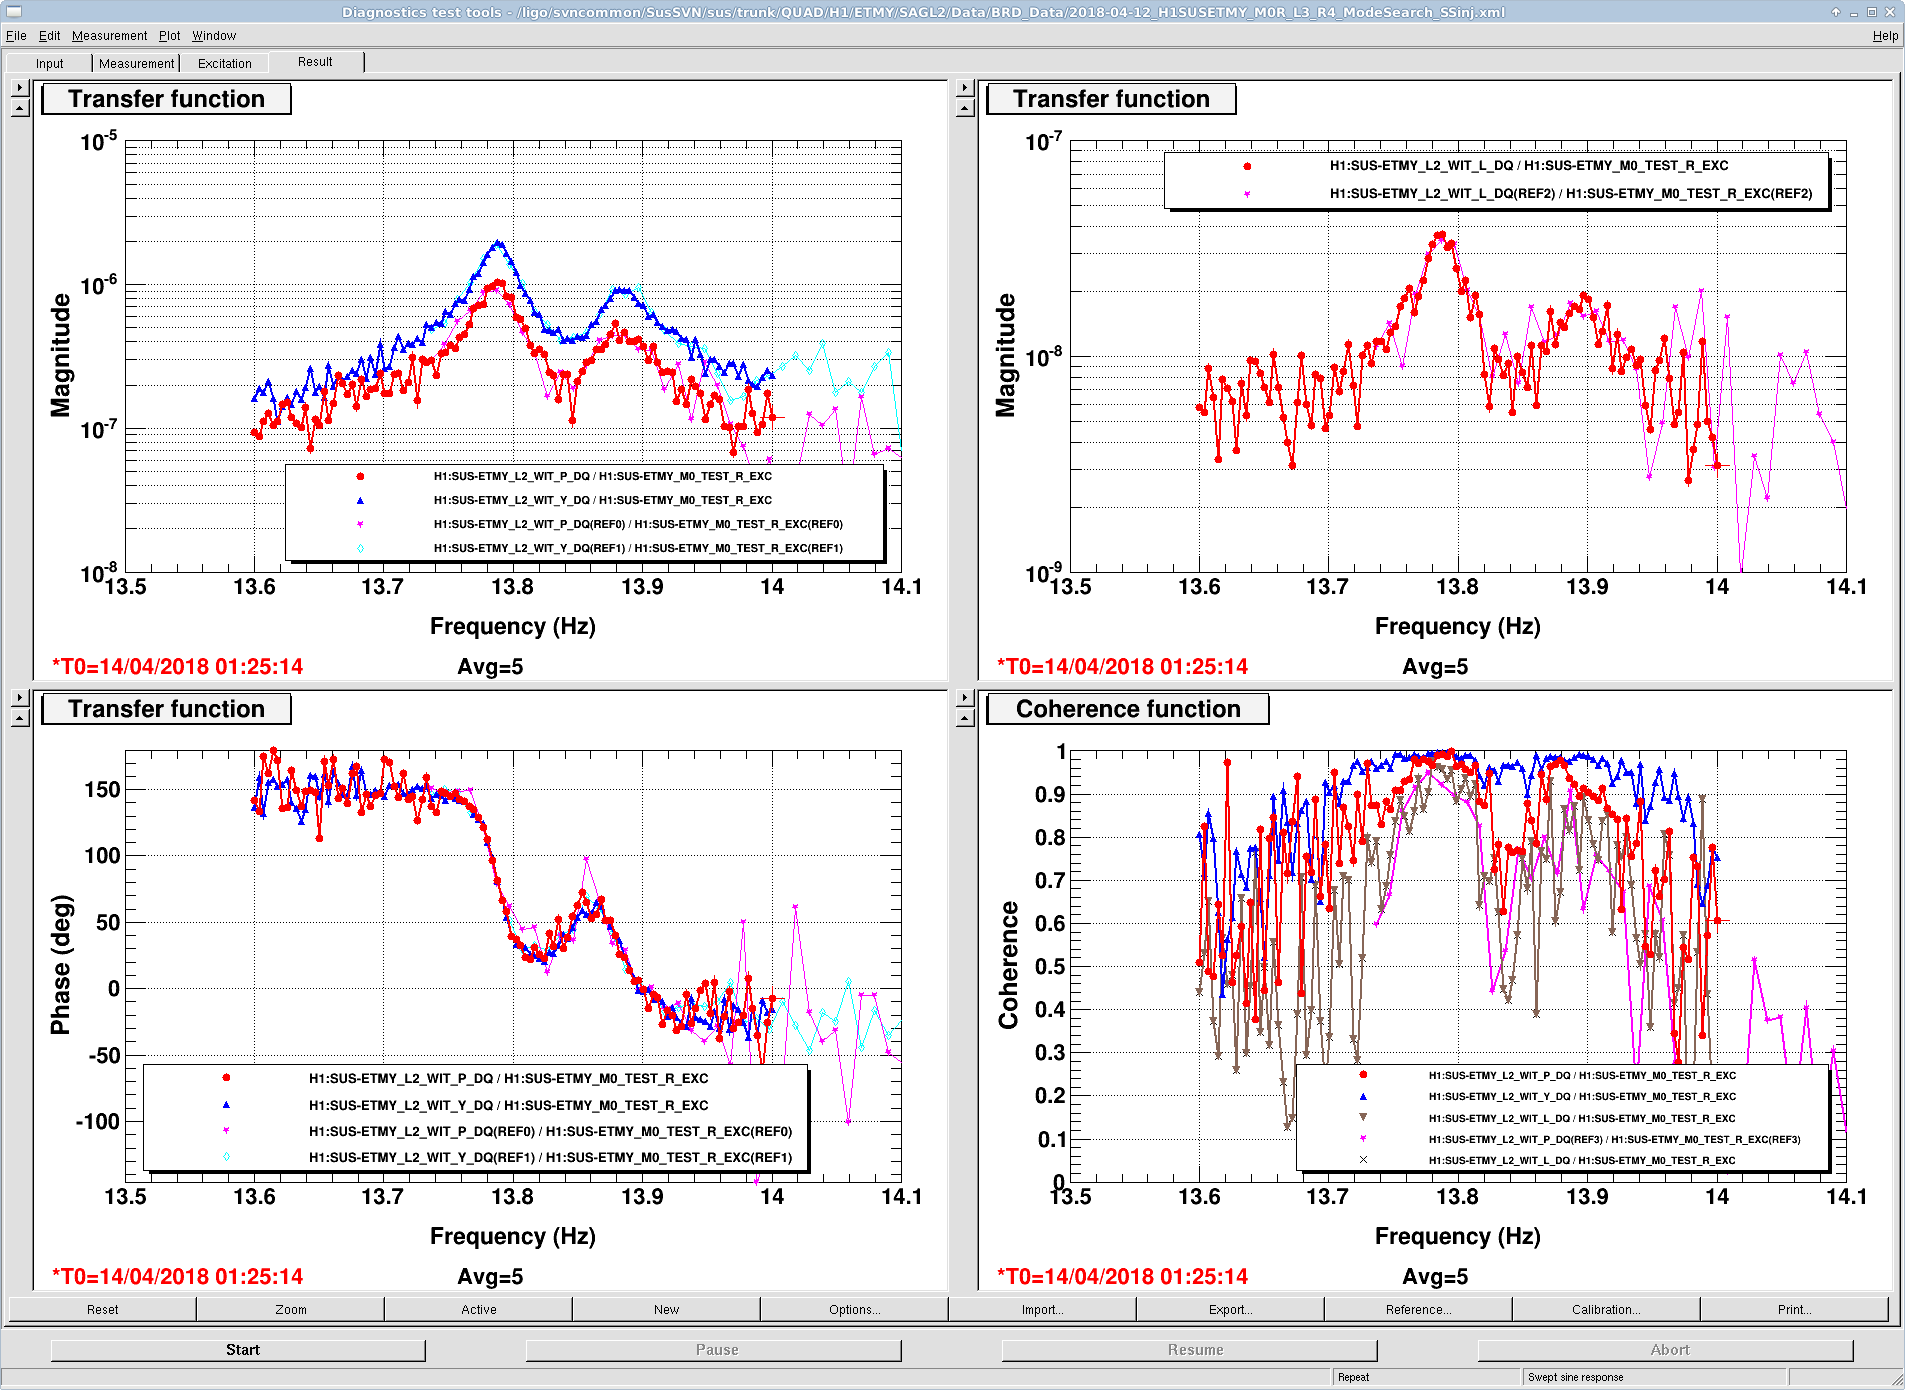
J. Kissel

Using (at first) ring-down fitting techniques described in LHO aLOG 40098 and LLO aLOG 28503, I have attempted to characterize and assess the performance of H1 SUS ETMY's recently installed "Bounce" and Roll mode Dampers (BRDs, D1500228) which aim to reduce the Q of the highest vertical and roll modes (V4 and R4).

While I was able to easily identify a single V4 mode and characterize its Q to be rather high, the roll mode was very evasive, and I believe has split into two, very low Q modes.

Remember, the goal for these BRDs was to reduce the Q of the V4 and R4 modes from ~10^6 to "one to several thousand" (see pg 6 of G1600371, and thermal noise impact discussion in T1500271).
Unclear if either BRD results are within spec: the V4 mode has a Q of 7300 (arguably higher than "several thousand"), and the R4 mode, split into two modes, have Qs of 600 and 440 (arguably lower than "one thousand," and probably undesirable to be overdamped enough to split the mode in two).

H1 SUS ETMY's BRD manual tuning results can be found in LHO aLOG 40541.

Further Details below.

%%% V4 "Bounce" Mode Characterization %%%

I was able to clearly identify and characterize the V4 mode:

                                ETMY

    V4 Frequency / Hz           9.726  (0.001)

    V4 Q / dimensionless        7302  (8)

(The uncertainties quoted for the Q are the 68% C.I., 1-sigma [sqrt of the] weighted sample variance resulting from 3 measurement trials on each mode; the value reported is the weighted mean of the three trails. See more details below. The uncertainty on the frequency is simply the requested binwidth of the ASD used after finding the mode frequency.)

Attachments Key for V4 / "Bounce" Mode:
    - 2018-04-12_H1SUSETMY_L3_V_BBEXC_awgsettings.png AWGGUI settings for broadband V4 search before I knew the frequency
    - 2018-04-12_H1SUSETMY_L3_V_SineInj_awgsettings.png AWGGUI setings once the frequency was found, and during ring-down measurements
    - H1SUSETMY_L2_Q_bounce_ASD.pdf Collection of post-processed ASDs of L2_WIT_L_DQ channel used for each ring-down trial
    - H1SUSETMY_L2_Q_bounce_Time_Series.pdf Collection of RMS time-series of L2_WIT_L_DQ channel and fit results for each ring-down trial
    - 2018-04-12_H1SUSETMY_V4R4_Characterization_PostBRDInstall.pdf (PG 1) Trial results plotted against weighted mean and variance.

%%% R4 "Roll" Mode Characterization %%%

I was *not* able find the highest roll mode frequency using the standard search method -- iterating through driving the top mass (M0) in Roll with small ~0.2 Hz band passes over a 13.5 and 14.2 Hz range. I tried searching by driving in vertical at the top mass as well, still was not able to ring anything up. I was finally able to see something ring up by driving the penultimate mass (L2) in pitch, but I was not convinced I wasn't just seeing my broadband excitation in my witness sensors (L2 OSEMs in L, P, or Y, and L3 optical levers in P or Y), because the sensor signals would die off very quickly (and it was tough to tell how quickly, because I need at least a 0.005 Hz BW running ASD to see what I'm doing).

So, finally, I took an excessively long swept sign measurement through the band, driving at L2 in P. These revealed *two* features, with quite low Q, clearly visible in optical lever Y, and barely visible in optical lever P.

Once identifying these two modes at 13.766 Hz and 13.856 Hz in the L2 P drive to L2 Y OSEM response, I then used the lower of the two frequencies to conduct the standard set of trials, hoping to identify the Q that way. I used that lower mode -- 13.766 Hz -- because while both modes were visible in optical lever Y, the lower frequency feature was *more* visible in the optical lever P transfer function so I had greater confidence it was the roll mode. The results are attached, and give a Q of ~200, but again, I couldn't find a set of FFT and RMS parameters that showed a clear ring down that had no "noise bounces." These results claim a Q of ~200.

Finally, as a last ditch effort to be really confident that these 13.766 Hz and 13.856 Hz modes were real, I went from an excessively to ridiculously long TF from M0 R to each of the lower stage sensors (again, L2 L, P, and Y OSEMs, L3 P and Y optical levers), taking it over night. This transfer function also showed these same features, so I'm now confident that the roll mode has been split into two low Q modes:

                                ETMY
                                Mode R4.1           Mode R4.2
    R4 Pole Frequencies / Hz    13.788 (0.001)      13.883 (0.001)
    R4 Zero Frequency / Hz                 13.851 (0.001)

    R4 Pole Qs / dimensionless  600  (10)           440 (10)
    R4 Zero Frequency / Hz                 240 (10)

where I've determined these frequencies and Qs from using foton to create a crude, by-hand/by-eye fit and the uncertainties are estimated from me changing the frequency and Qs by the quoted values and seeing that the fit is not good enough. The fit is
     zpk([2.5;2.5],[],1,"n")*                                    (two out-of-measurement-band zeros, to start that phase and slope off right)
     zpk([],[0.01149+i*13.788;0.01149-i*13.788],1,"n")*          (a complex pair of poles at 13.788 Hz with a Q of 600)
     zpk([0.0288562+i*13.851;0.0288562-i*13.851],[],1,"n")*      (a complex pair of zeros at 13.851 Hz with a Q of 240)
     zpk([],[0.0157761+i*13.883;0.0157761-i*13.883],1,"n")*      (a complex pair of poles at 13.883 Hz with a Q of 440)
     gain(1.5e-10)                                               (arbitrary gain to match the magnitude scale of the data)


Attachments Key for R4 / "Roll" Mode:
    - 2018-04-12_H1SUSETMY_L2P_L3_R_SineInj_awgsettings.png AWGGUI settings during the unconvincing ring-down trials
    - H1SUSETMY_L2_Q_roll_ASD.pdf ASD of L2_WIT_L_DQ (OSEMs) during unconvincing ring-down trials
    - H1SUSETMY_L2_Q_roll_Time_Series.pdf RMS time series of L2_WIT_L_DQ (OSEMs) during unconvincing ring-down trials
    - 2018-04-12_H1SUSETMY_L2_L3_R4_ModeSearch_SSinj.png  Excessively long swept sine measurement showing L2 Pitch drive to L2 P & Y OSEM response
    - 2018-04-12_H1SUSETMY_M0R_L3_R4_ModeSearch_SSinj.png Ridiculously long swept sine measurement showing M0 Roll drive to L2 P & Y OSEM response
    - 2018-04-12_H1SUSETMY_M0R_L2Y_FotonFit.png Foton Fit of ridiculously long M0 R to L2 Y swept sine measurement
Images attached to this report


Non-image files attached to this report
