I was looking at the time when all ISIs were damping after yesterday's earthquake near Iceland.
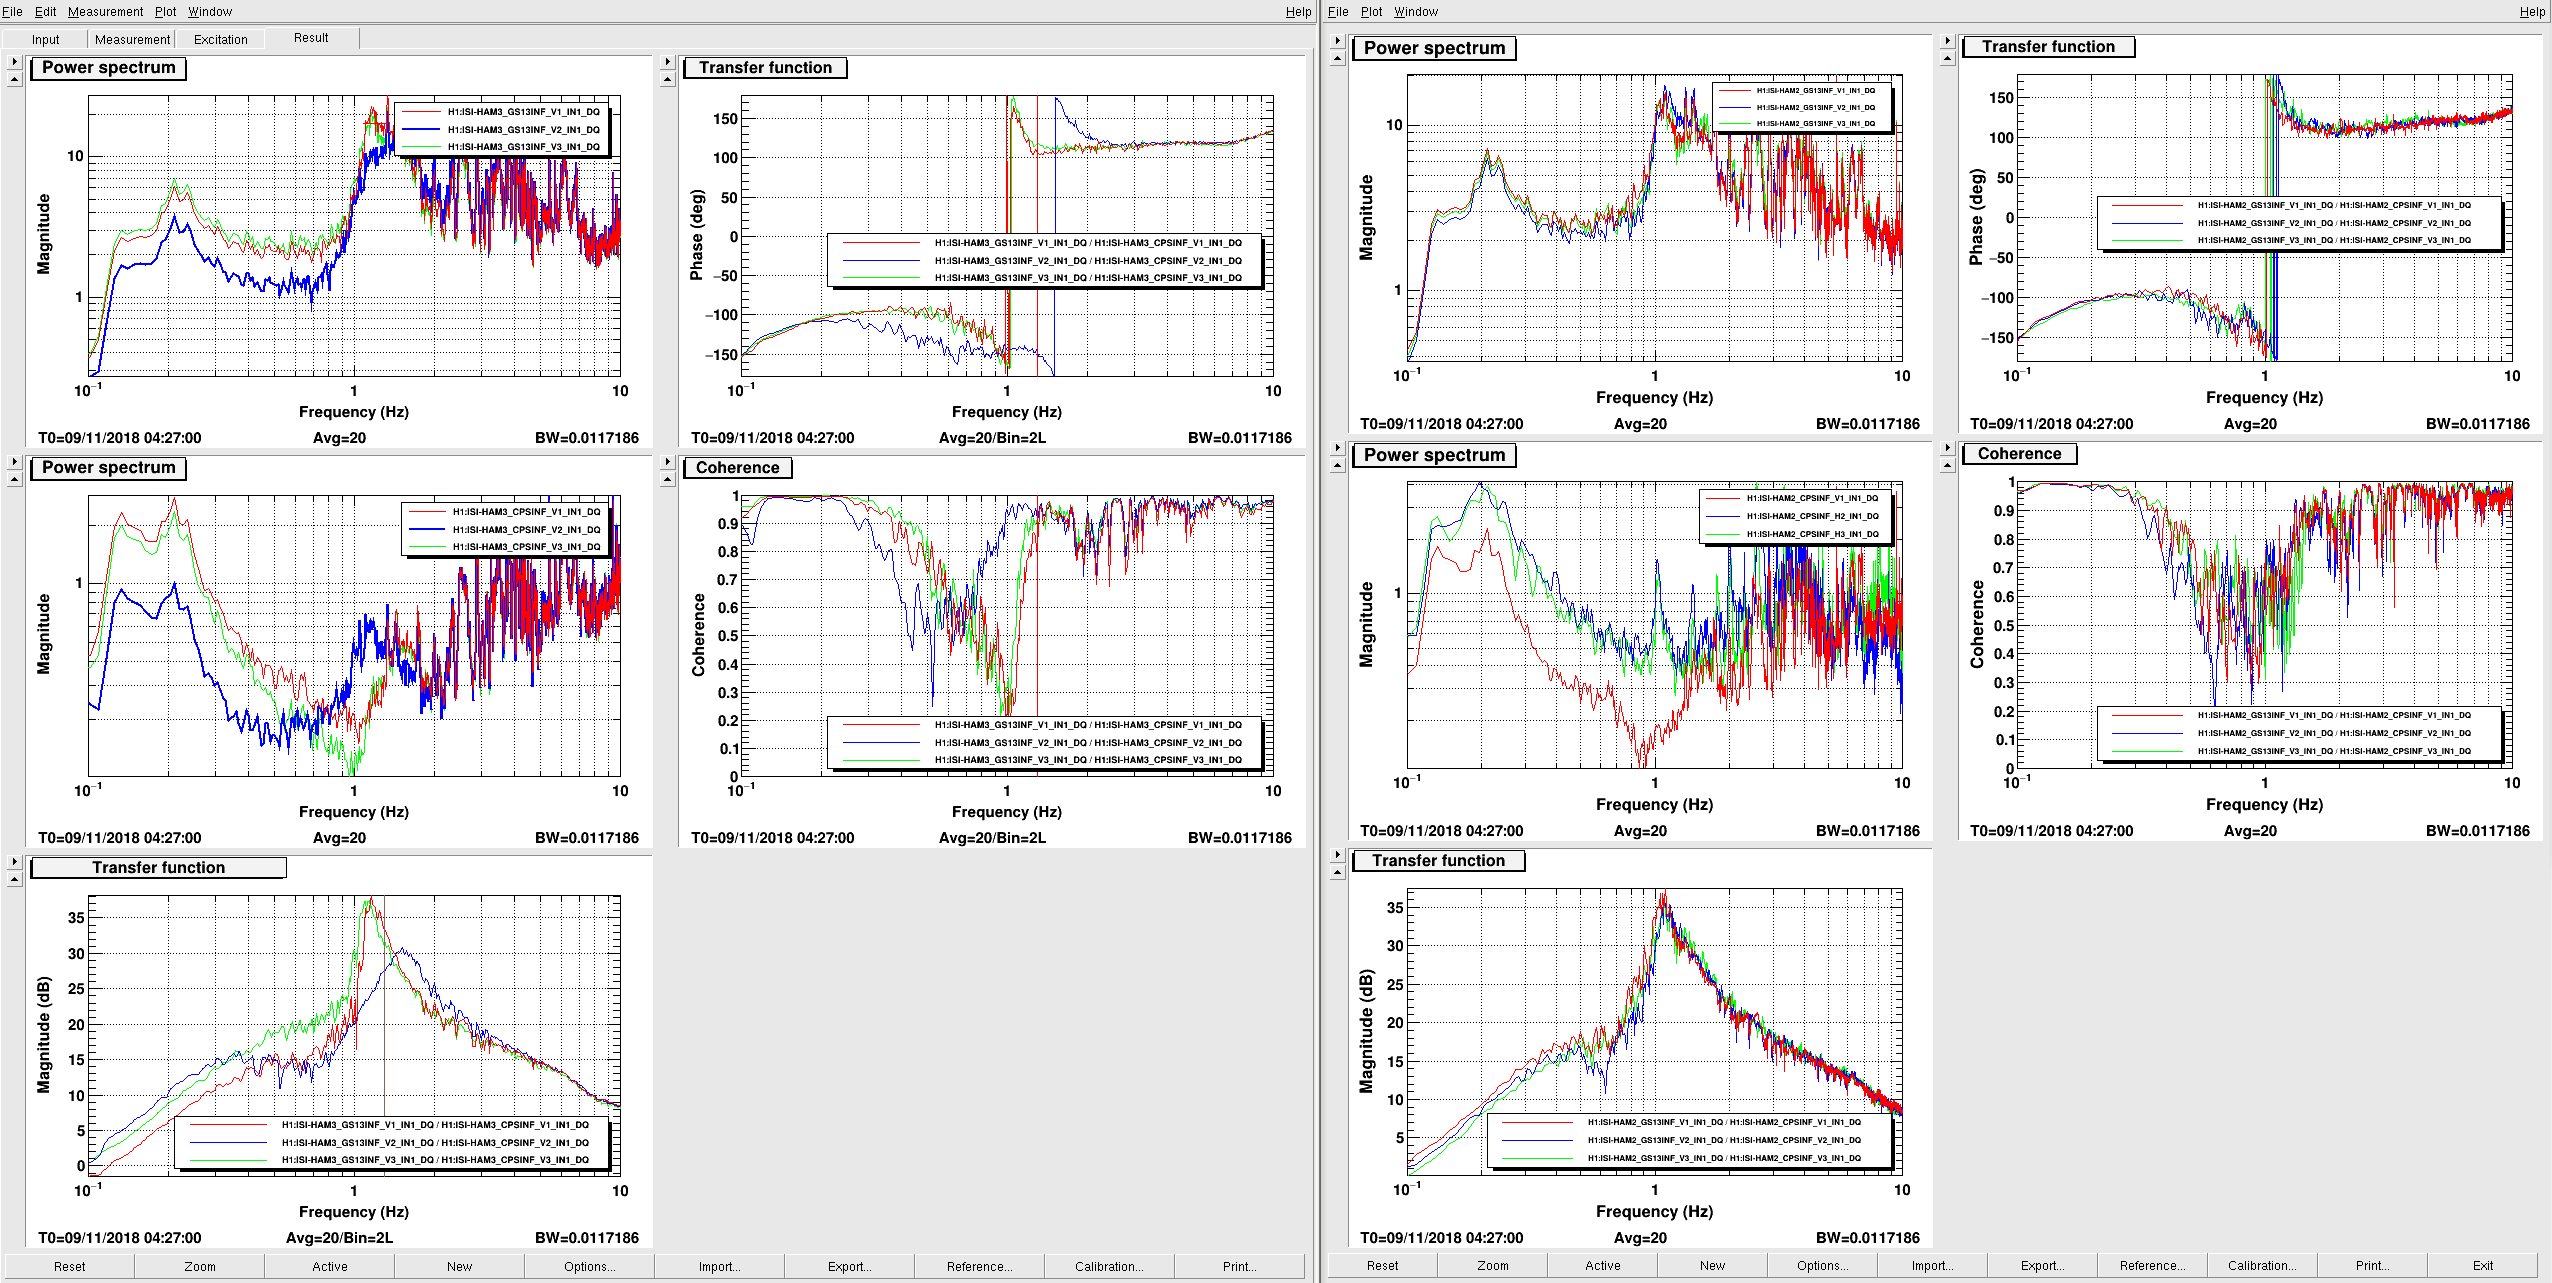
I looked at the CPS to GS13 sensor to sensor response (e.g. CPS V1 to GS13 V1 etc.) to find out that HAM3 V2 CPS to GS13 transfer function looked completely different from everything else, and that this could be amplitude dependent.
In the first attachment, left is HAM3 and right is HAM2. HAM3 V1, V3, HAM2 V1, V2 and V3 are all look similar, but the Q of HAM3 V2 TF is much lower even if you only look at frequencies with reasonable coherence.
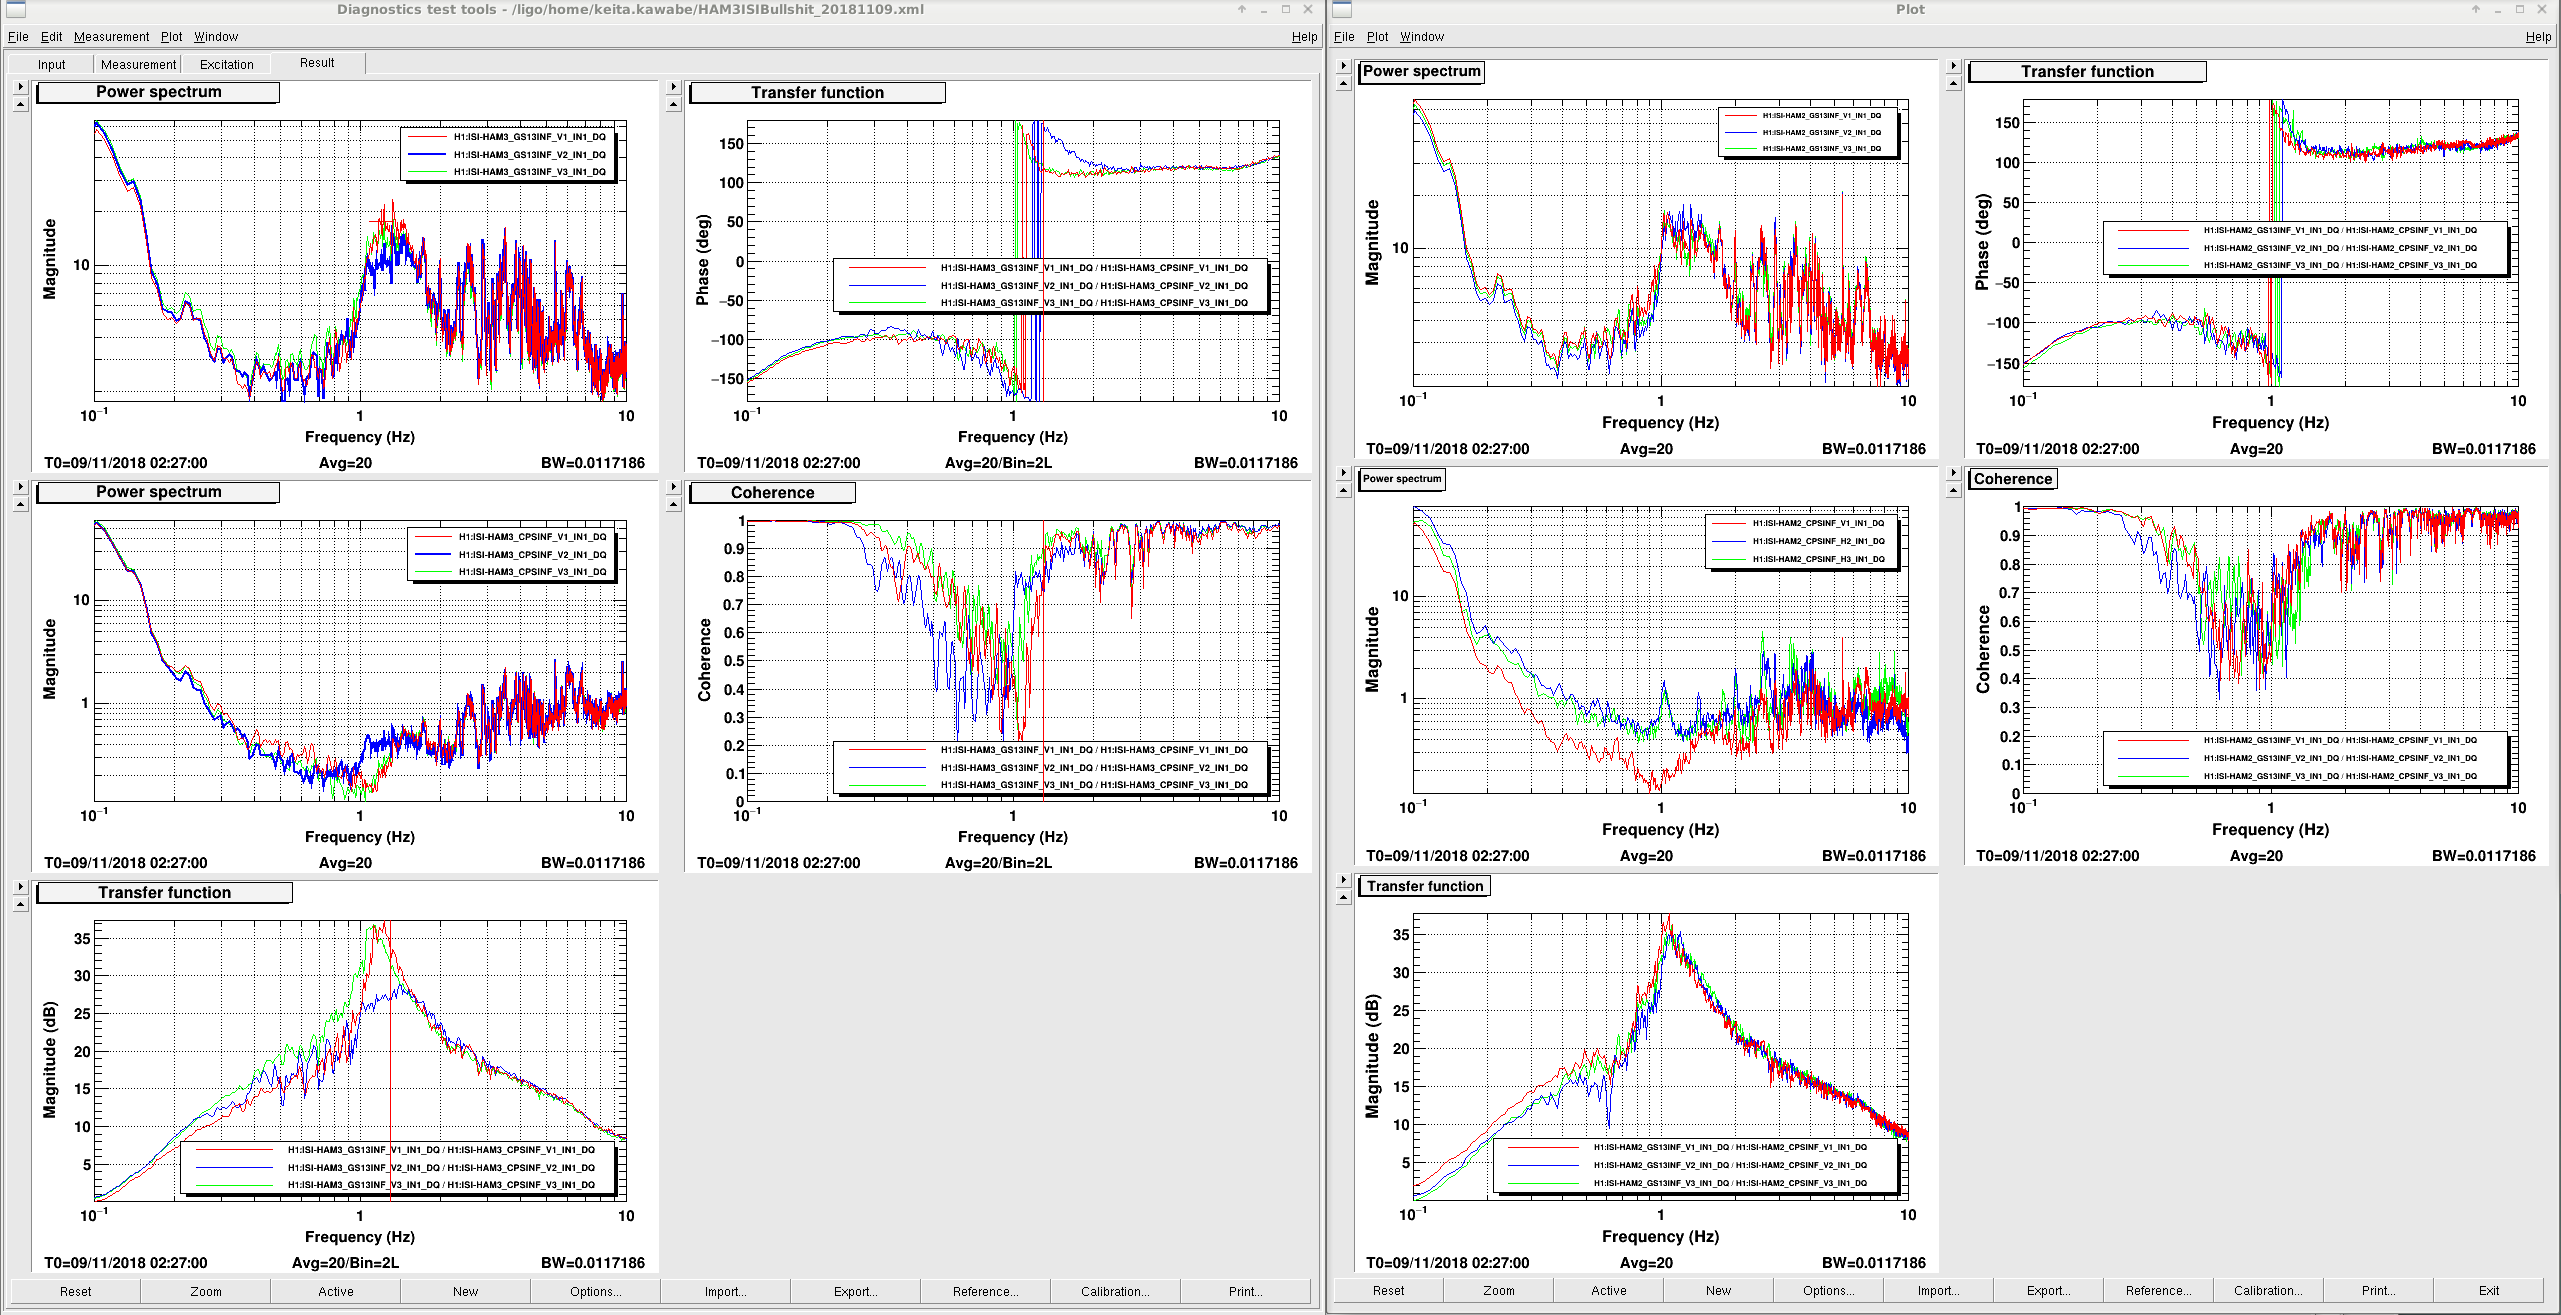
The second attachement is Jim's injection TF (alog 45134) with rearranged panels etc. to see the same quantity as my plots. Only HAM3 sensors are plotted. Interestingly, all TFs are similar but they are all totally different from my first plot in amplitude.
For example, just look at both plots at 1.3Hz or so (vertical markers in my plot) where the coherence was decent. Jim's GS13 amplitude is ~500 times as large as mine, but CPS is only 50 times as large. As a result Jim's HAM3 V1, V2, V3 TF are about 20dB larger than my HAM3 V1, V3, HAM2 V1, V2 and V3.
It seems as if the GS13 response might be dependent on the excitation level, and that the small amplitude response of HAM3 V2 is very different from others.
The last attachment is the same as the first one, except that the first one was 2 hours after the EQ, this is right after.
It would be useful to repeat Jim's measurement with smaller excitation at some point.

Peter asked if it were possible to run the HAM3 ISI without the V2 GS-13. It is possible, but it's a bad choice. V2 is key to distinguishing between the vertical motion and the RY motion - the dominant contributor to SUSpoint motion from 0.7 - 10 Hz (see HAM2 motion) . I put some stuff in the attachment. for factors of 10, do check w/ Jim about the state of the analog gain. I think 'fishy' is a good word choice here. also note that the V2 CPS is 'fishy' as well.
I still think it would be useful to do a driven TF of the local motion with the isolation controls off, and compare to the measurements from the build-time. See pg 37 of the phase 1 testing report, E1000314.
