J. Kissel (with help from L. Sun, E. Goetz, L. McCuller, E. Bonillla, R. Kumar)

I've been processing the actuation function data from 2019-03-01 (see LHO aLOG 47206), and have some updates. Not were I want it, but since the heat is on I'll give a status update.

Recall from LHO aLOG 46806,
Steps to success:
    (i) Find out why ETMX L1 and L2 doesn't work, and fix it, such that we can go forward with full ETMX DARM actuation.
        DONE (see fixes to UIM and PUM crossovers in LHO aLOGs  47164 and 46861)
    (ii) Measure the PUM and UIM coil drivers, and update the compensation.
        DONE (see LHO aLOG 47167)
    (iii) Truly identify ETMX all 8 violin mode fundamentals and their harmonics to update the PUM dynamical model (needs IFO time), finish fitting the UIM transfer function data to update the UIM dynamical model (needs Kissel time)
    (iv) Remeasure all stages of ETMX with the full IFO
        DONE (see LHO aLOG 47206)
    (v) Update the front-end calibration (including reference model parameters at calibration line frequencies such that time-dependent correction factors are accurate), and
    (vi) confirm success with the full IFO (needs IFO time).

So, I'm currently working on (iii) [with the help of Edgard, Rahul, Borja (#TeamSUS) along with Lee and Lilli #TheFittingCrew] and this aLOG is reporting the progress on fitting the results from the 2019-03-01 measurements, i.e. (iv) [working with Evan #TeamPyDARM].

Check out the attached .pdfs from each stage below, which are the output of the following script,
    /ligo/svncommon/CalSVN/aligocalibration/trunk/Runs/O3/H1/Scripts/FullIFOActuationTFs/process_actuationmeas_20190301.py
after creating a new pyDARM model parameter file,
    ^/trunk/Runs/O3/H1/params/modelparams_H1_20190301.py

TST: MCMC Results
    Force per count of longitudinal DAC request (just down stream of DRIVEALIGN bank):
    Gain = 4.734e-12 (N/ct)
    Force per actuator signal (current or voltage):
    Gain = 4.433e-11 (N/V**2)

    Actuator gain, H_c (N/ct)              | 4.734e-12 (+2.09e-15,-2.102e-15) or (+0.04415%,-0.0444%)
    Residual time delay, tau_A (usec)      | 10.79 (+0.7573,-0.76) or (+7.02%,-7.045%)


Comments: Except for the sign flaw in the "intermediate results" plot, I'm very happy with the state of the systematic error, I believe the MCMC fit, and I think we're ready push to front-end.

PUM: MCMC Results
    Force per count of longitudinal DAC request (just down stream of DRIVEALIGN bank):
    Gain = 6.223e-10 (N/ct)
    Force per actuator signal (current or voltage):
    Gain = 0.03038 (N/A)

    Actuator gain, H_c (N/ct)              | 6.223e-10 (+3.339e-13,-3.33e-13) or (+0.05367%,-0.05352%)
    Residual time delay, tau_A (usec)      | 4.096 (+1.568,-1.571) or (+38.28%,-38.34%)


Comments: There's still something very fishy going on below 20Hz. I don't understand it, and this is under investigation by Evan and I.

UIM: MCMC Results
    Force per count of longitudinal DAC request (just down stream of DRIVEALIGN bank):
    Gain = 7.498e-08 (N/ct)
    Force per actuator signal (current or voltage):
    Gain = 1.597 (N/A)

    Actuator gain, H_c (N/ct)                   | 7.498e-08 (+2.842e-11,-2.869e-11) or (+0.03791%,-0.03826%)
    Residual time delay, tau_A (usec)      | 57.81 (+1.218,-1.215) or (+2.107%,-2.101%)

Comments: the low frequency data (below 10Hz) is pretty un-informative, and this is where the UIM matters -- BUT I'm not sure we've ever got any better. I'm dividing out the high frequency dynamics of the OSEM bracketry and UIM to PUM violin modes based on old H1 ETMY data for now CSWG aLOG 11212, and that has significantly flattened out the systematic error, so we can now use all the data from 10 to 100 Hz for the fit of the actuation coefficient instead of what we did in O2 which was only use 3-5 points between 10 and 20 Hz. I'm working with Lee to get an updated fit on data that I took on 2019-01-25.

Finally, I show one of the plots from the latest output of
    https://svn.ligo.caltech.edu/svn/aligocalibration/trunk/Common/pyDARM/darm_loop_critique.py
which, unlike the scripts from above is a function, which I called using the following command line,
    python3.6 darm_loop_critique.py --run=O3 --IFO=H1 --DARMmodelfile=modelparams_H1_20190301 --modelFunction=modelPars --outputfile=2019-03-01_critique

This shows the relative contribution of each stage. to the overall actuator to give you a feel for what matters where (now that things have been updated to reflect Sheila's latest work with the PUM crossover).

Comments:
    - Only the phase is shown, so take the plot with a grain of salt.
    - In the calibration band (a bit larger than the detection band, between 5 and 5000 Hz), excitingly, the UIM is now *very* unimportant to get perfect. However, I'm interested to see how this plot shapes up once we've fixed the dynamical model (which is currently all this plot has to go on)
    - It is far more important to get both the PUM and the TST stage right.
    - We'll need to resolve this reported frequency-dependent systematic error in the PUM, since it's right in the phase/magnitude mixing region ("the crossover" implies the hand-off between stages only happens precisely at a single frequency. No bueno.)

So -- I continue my work on the PUM as priority.

We also need to retake a sensing function sweep suite, so I can compare the results against and open loop gain model.

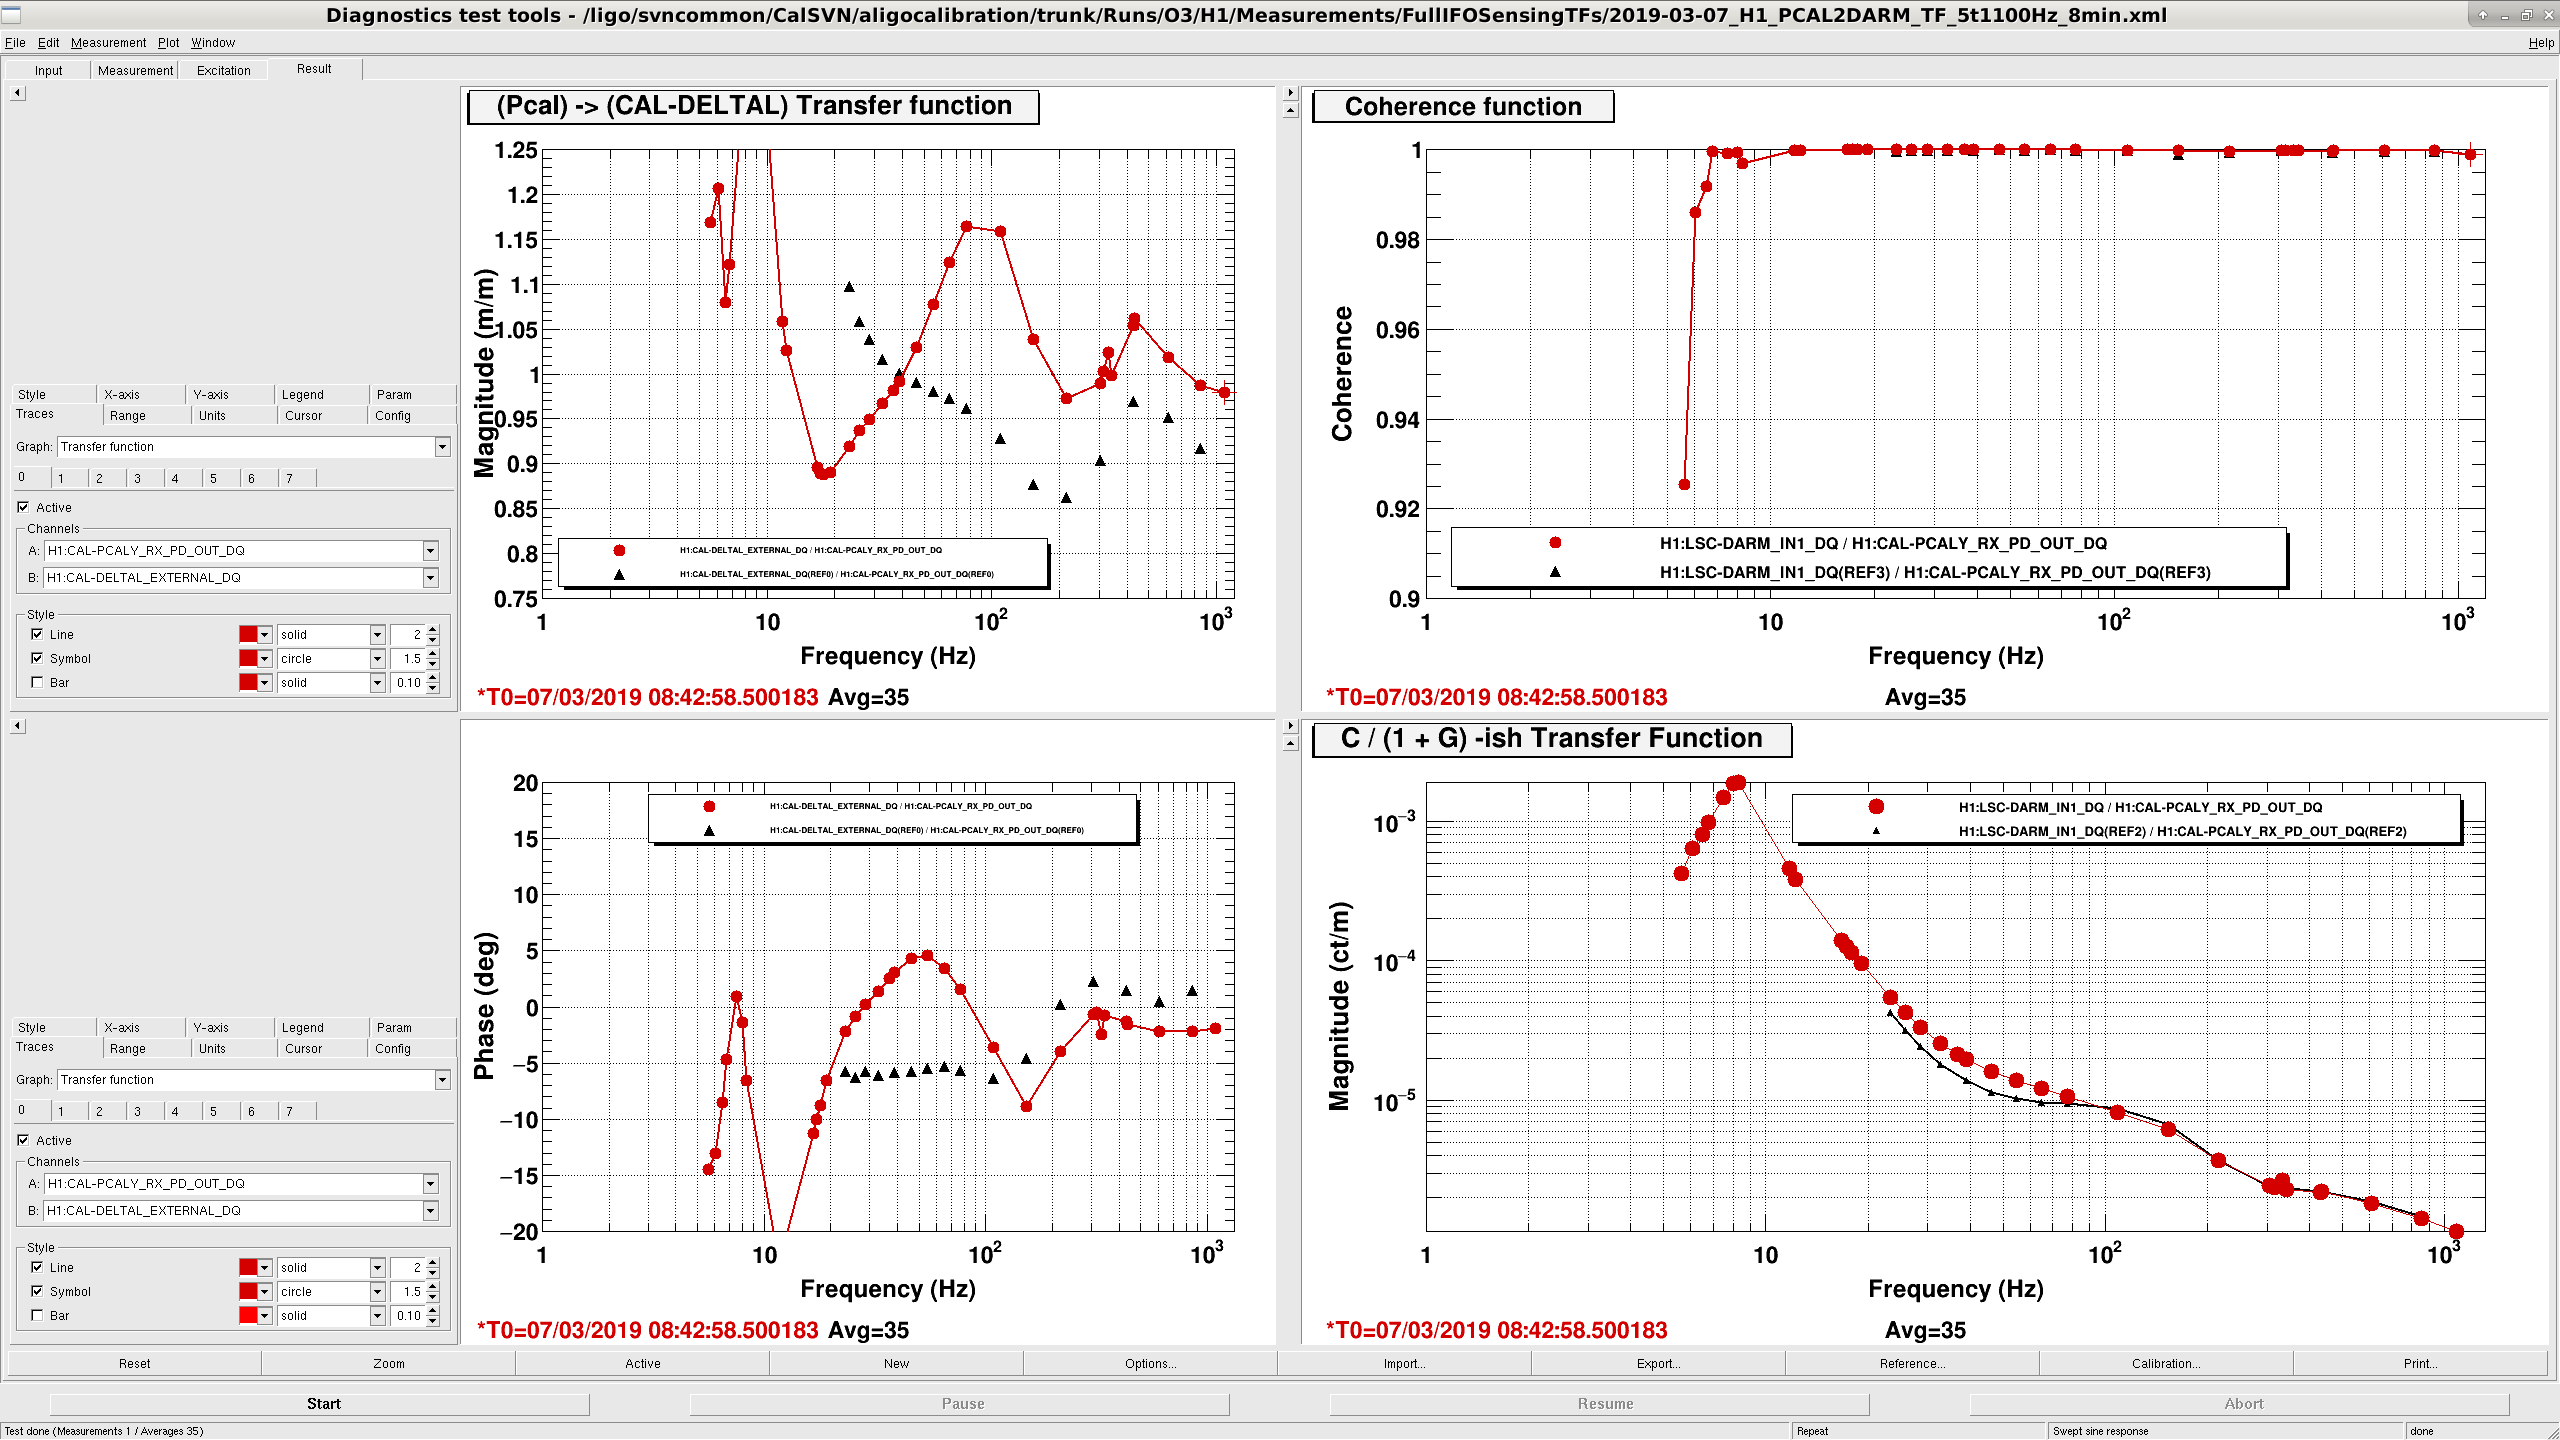
I took a PCAL to DARM measurement, and a DARM OLG, they are in /ligo/svncommon/CalSVN/aligocalibration/trunk/Runs/O3/H1/Measurements/FullIFOSensingTFs/2019-03-07*.xml
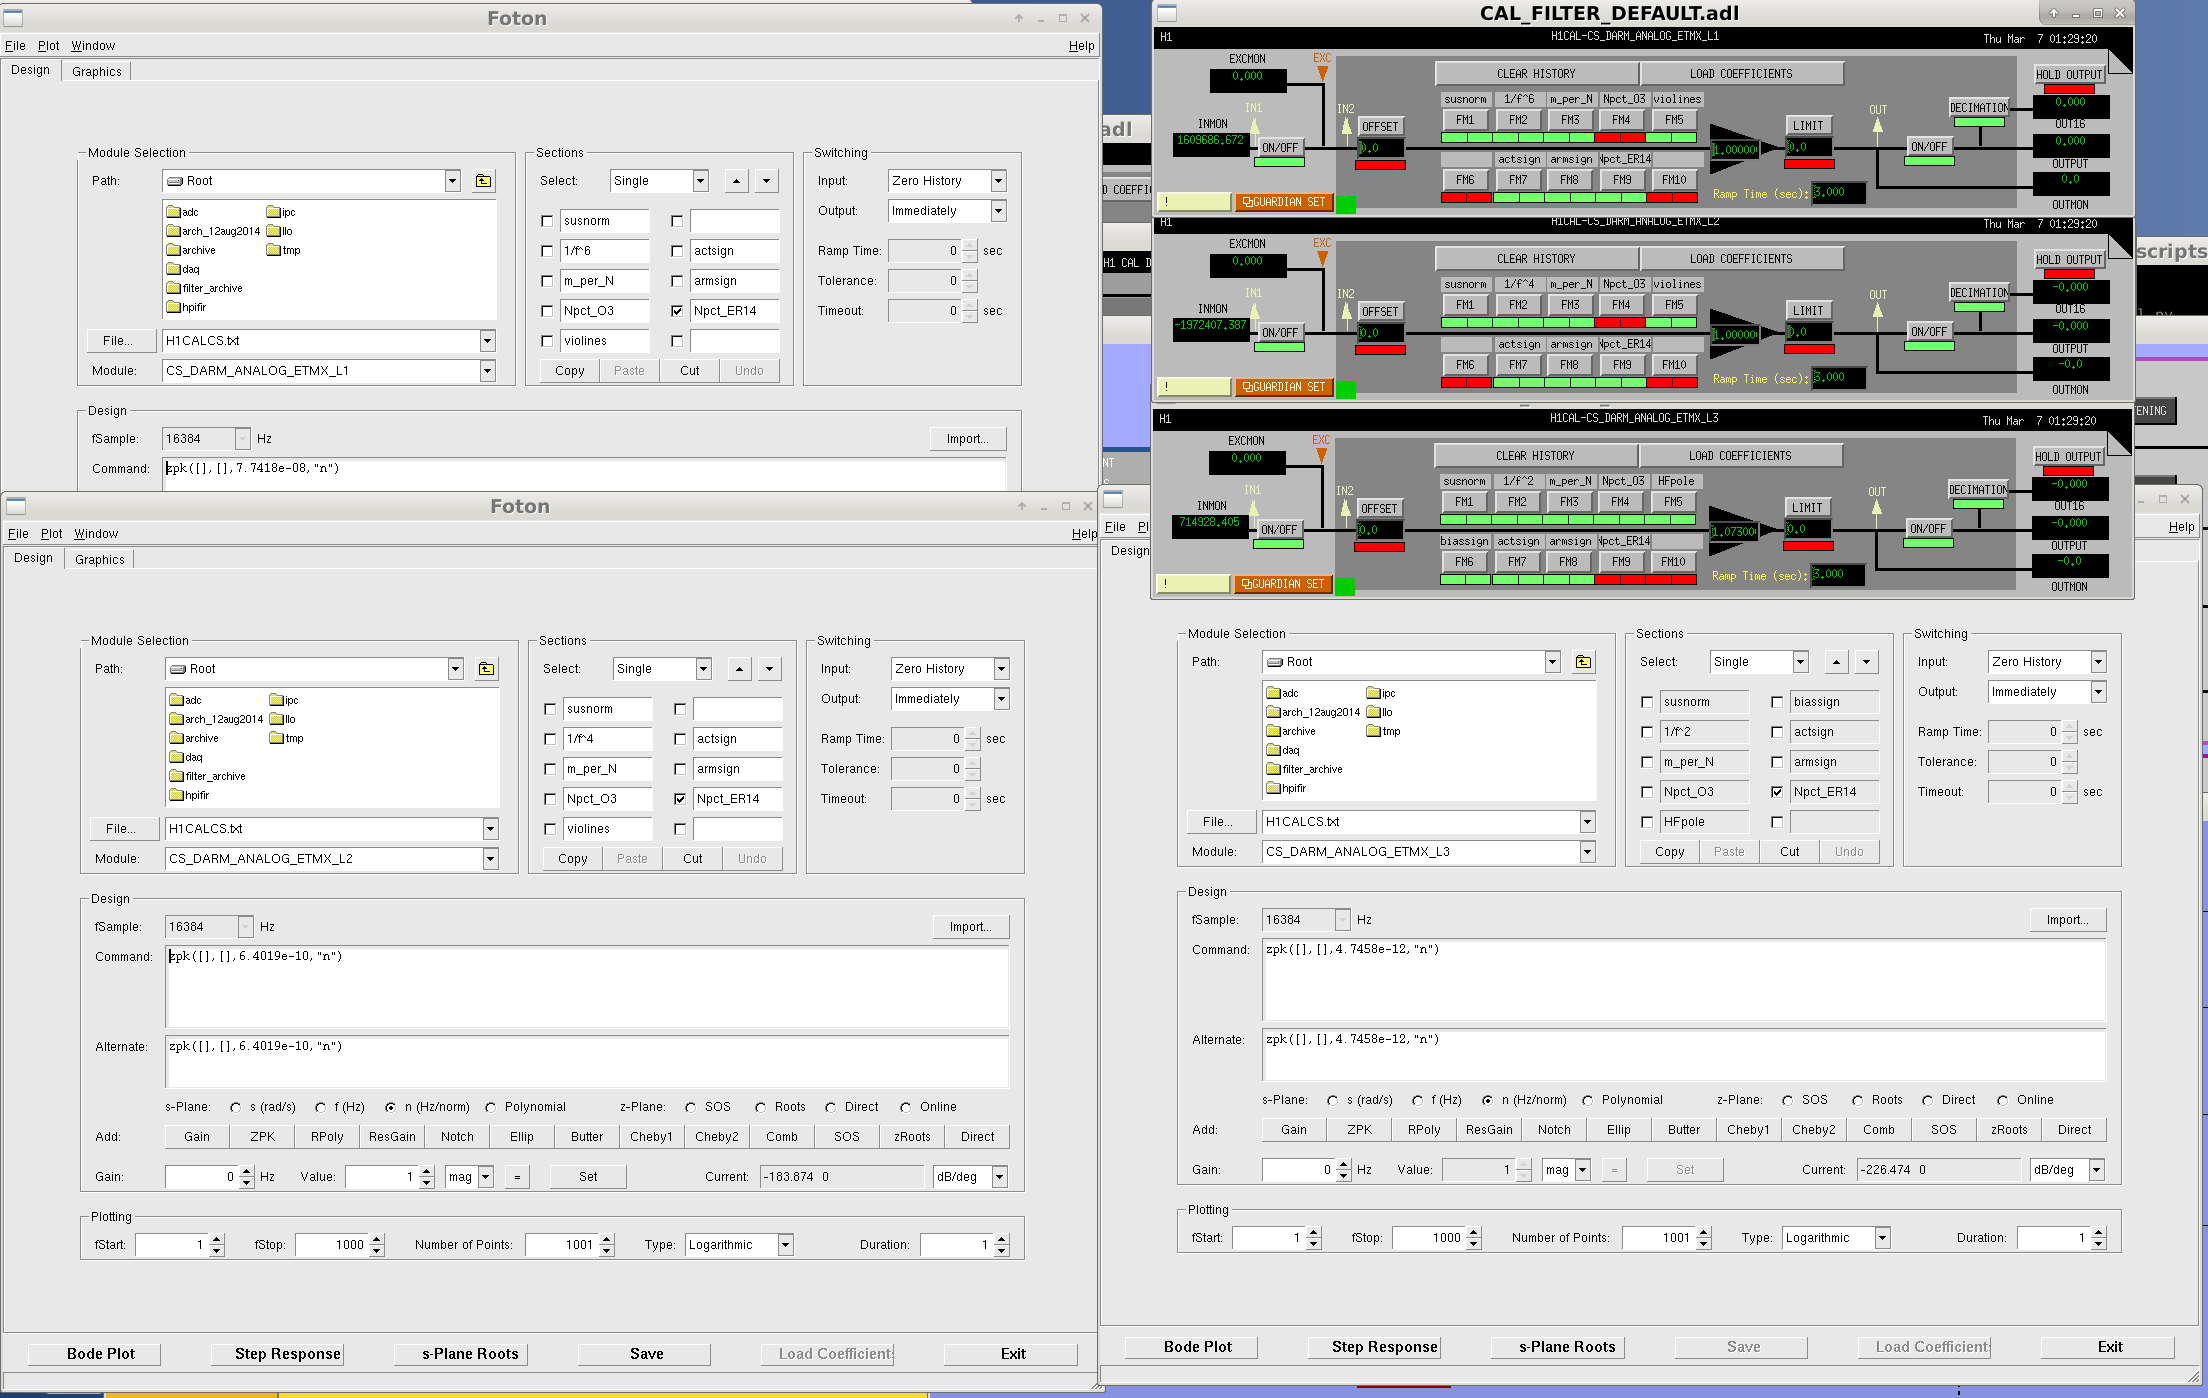
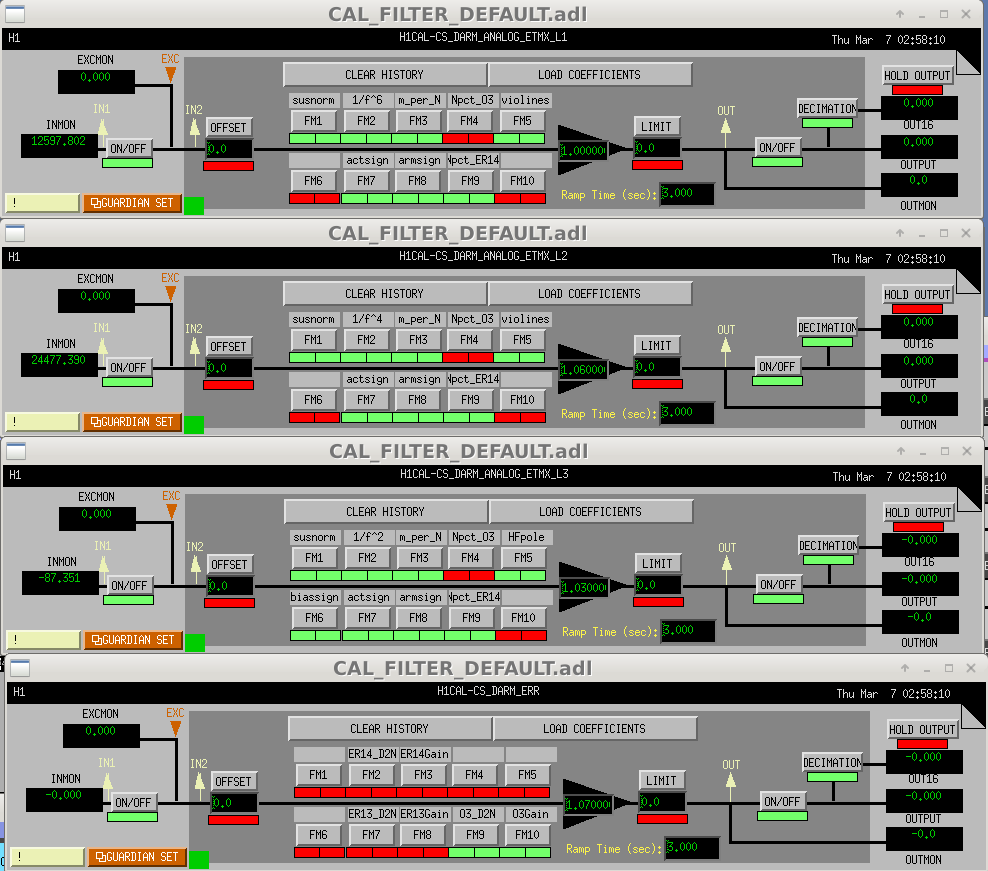
The PCAL to DARM was pretty bad, so I updated the Npct_ER14 front-end calibration filters according to the numbers above. I also switched off Npct_O3 and switched on Npct_ER14 for ETMX L3, and adjusted L3's FM calib actuator gain from 1.073 to 1.0. Will retake PCAL to DARM if I get a chance tonight.
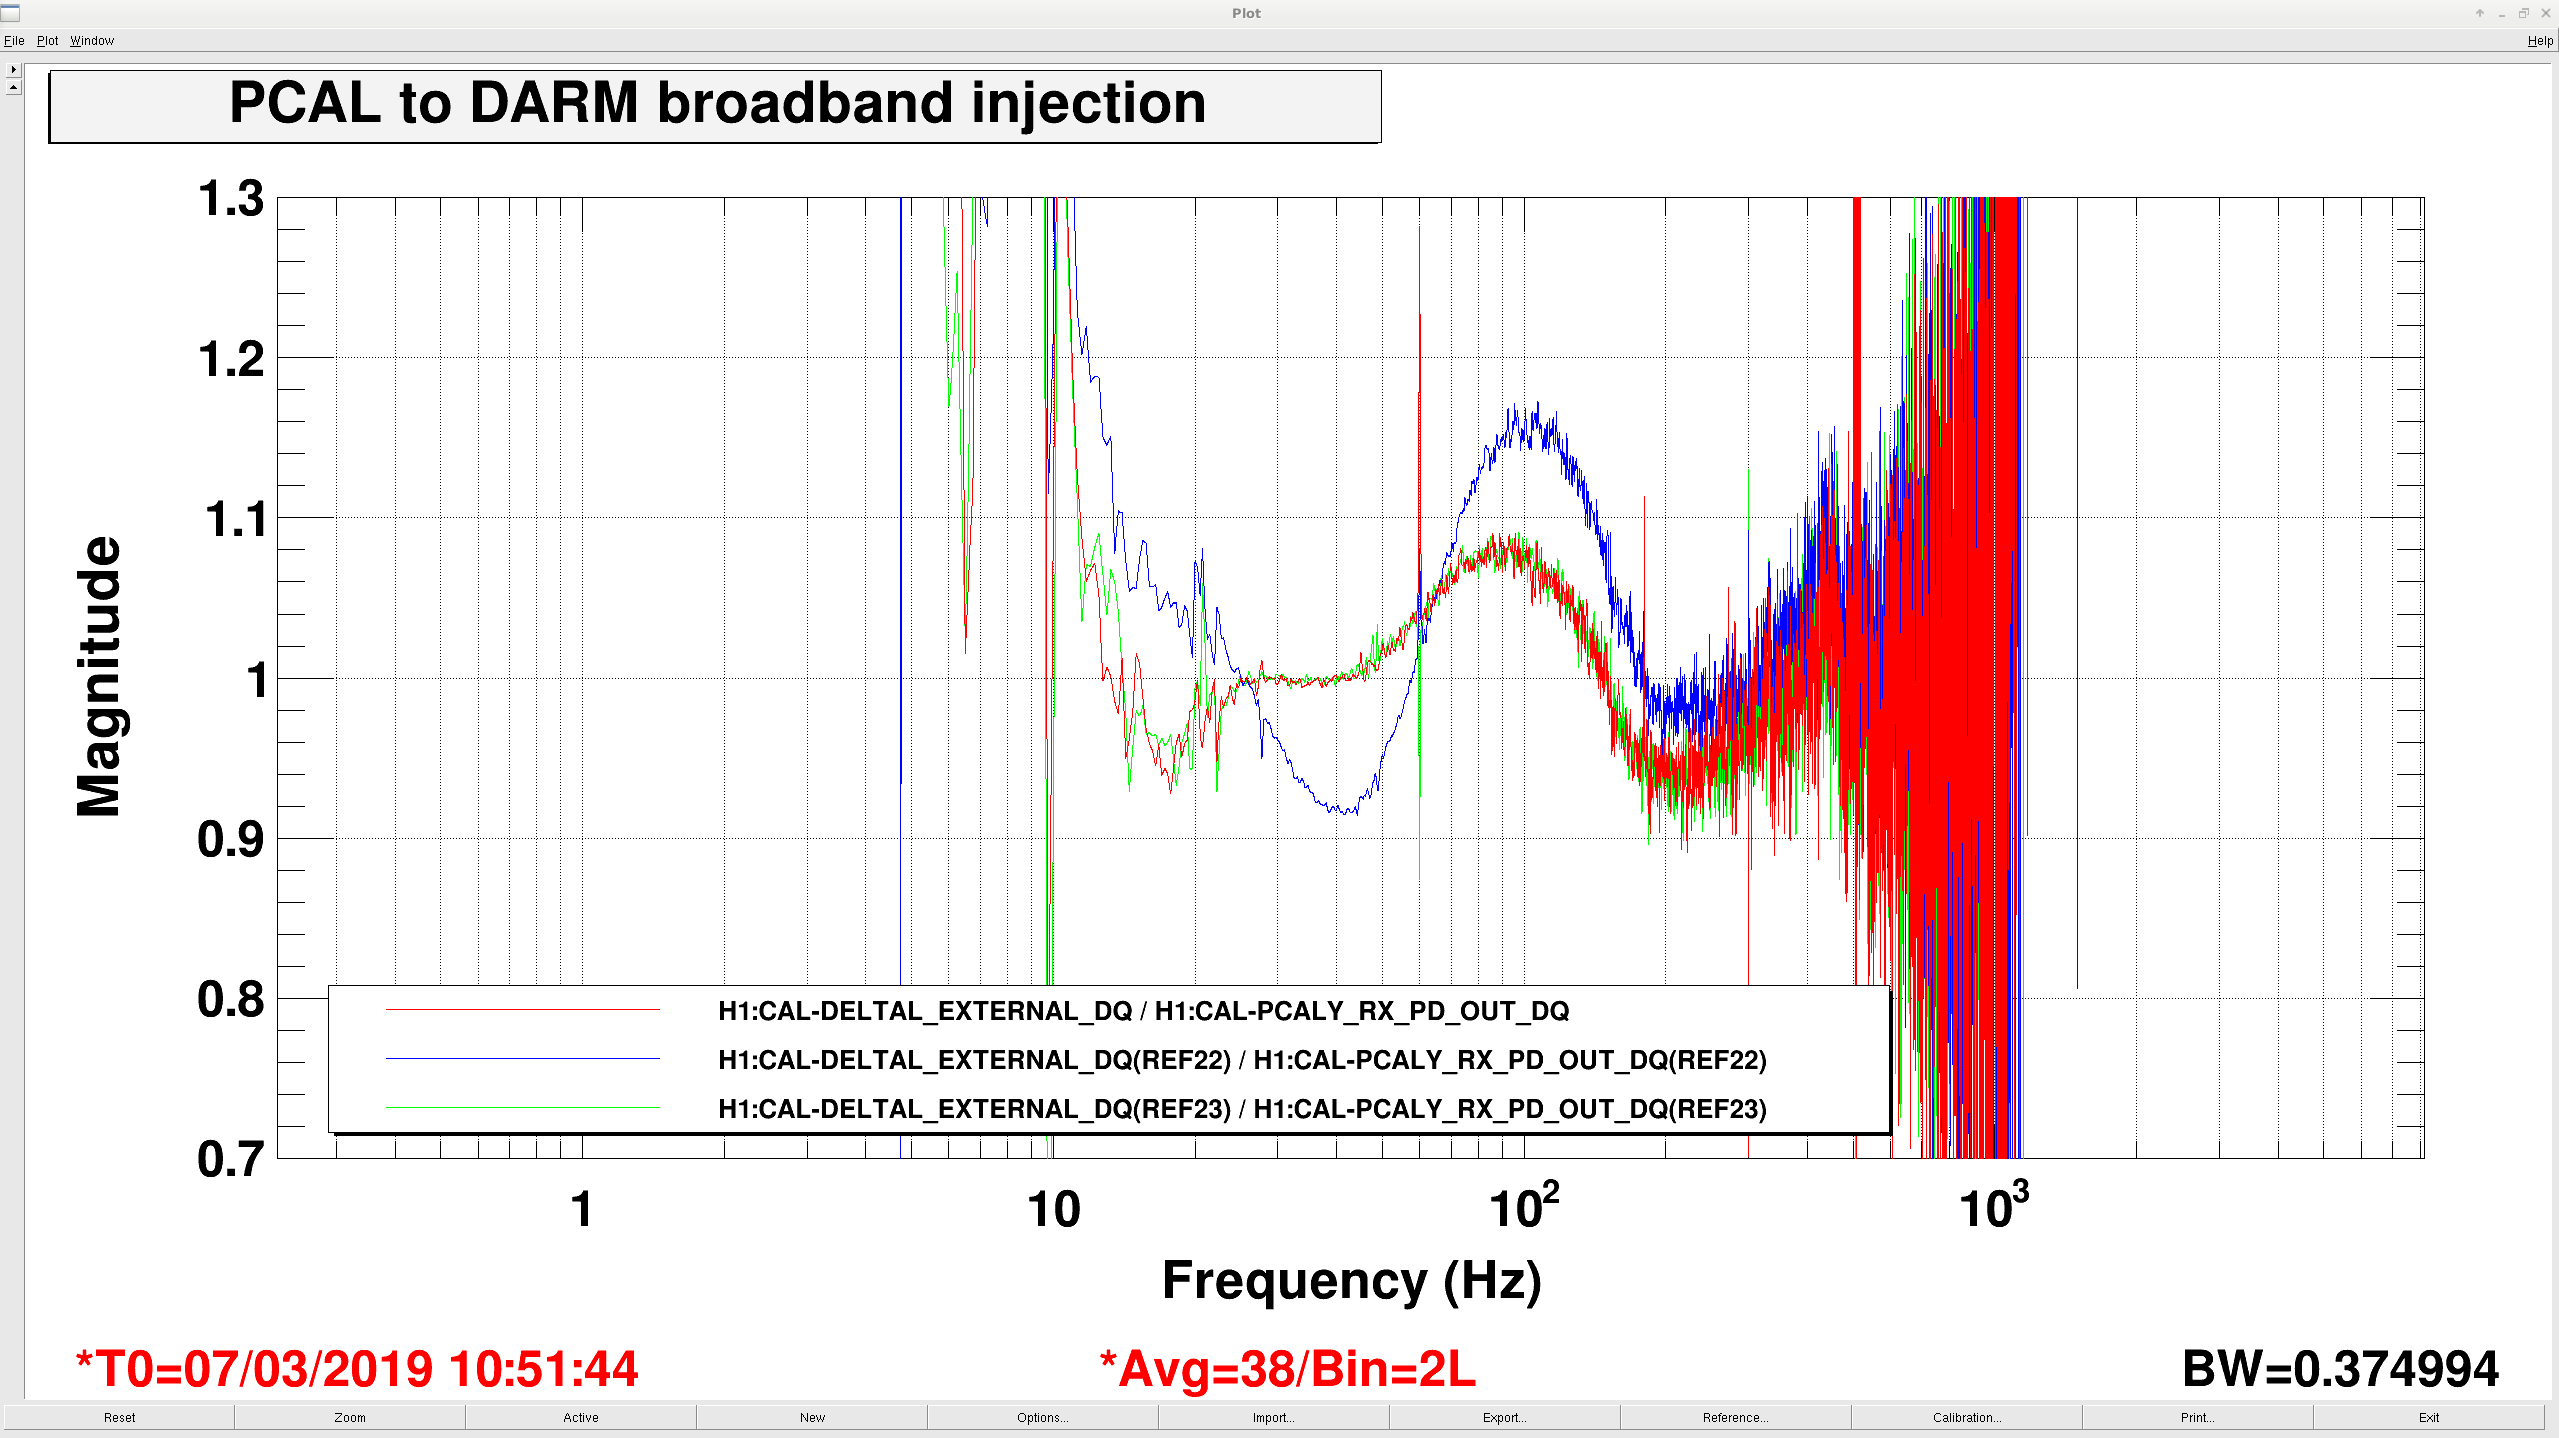
I ran another PCAL to DARM broadband injection while adjusting the gains.  I believe there is some phase mismatch which makes a perfect front end calibration not possible at the moment: no matter how I adjust the gains, there is always a hump around 100 Hz, right around the crossover between the L3 and error signal authority.
I did the best I could, we are good to 10% everywhere now.  Range went from ~87 to ~95 Mpc.
Comparing the third plot above (called actuator authority) to the attachments to 47164, it seems like there must be a sign error in one of the stages which is creating the notch just below 2 Hz in the total. It would be easier to debug these sign flips if we also could see the phase.
@Sheila -- You're correct -- the model file used to generate the plot you mention (via darm_loop_critiue) had a reference to the wrong H1SUSETMX filter file (it wasn't as simple as a sign flip, but a previous filter file [before the PUM design was fixed] called with the same filter *banks* meant a report of a cross-over instability).

I've corrected this since (apologies for not posting until now), but the new version is attached below, including the phase.
Keita, Craig, Sheila
Thanks Jeff for the updated plot. We are using the model used (and compared to cross over measurements) in 47164 to try to reproduce your plot.
We've tried to reproduce the plot you have above, but the only way we can do this is by removing the cascading of filters. To say the same thing a different way, when you say LOCK IN to displacement, I think that you mean L3 lock in to displacement, which for L1 would mean L3 LOCK L * L2 LOCK L *L1 LOCK L * L1 drivealing *L1 electronics * L1 mechanical stuff. The only way we can recreate your plot is to leave out L1 LOCK and L2 Lock from the L1 actuator. However, if we leave these out the toal line in your plot is misleading/wrong.
In the first attachment (not cascading filters) is our reproduction of Jeff's plot above, where we have removed the L3 lock and L2 lock filters from L1. The second one includes the cascaded filters, which is more correct if you want to add these up to make a total.
I've processed the measurements taken from 1) Drivealign bank and 2) Test bank (measurement data in aligocalibration/trunk/Runs/O3/H1/Measurements/FullIFOActuationTFs; March 26)
The resulting plots are attached. The fitting through the test bank is better. This is a quick comment. The details need to be further investigated and discussed.
The residual comparison plot is made following the steps below:
1) Create two separate reference models for drivealign and test scenarios, based on the Mar 16 model, by writing back the MCMC PUM MAP values.
2) Compute the error residuals for two scenarios separately.
3) Plot Response_drivealign_with_error/Response_drivealign_ref, and Response_test_with_error/Response_test_ref.