cheryl.vorvick@LIGO.ORG - posted 08:19, Friday 14 June 2019 (49912)
changes between this lock and last
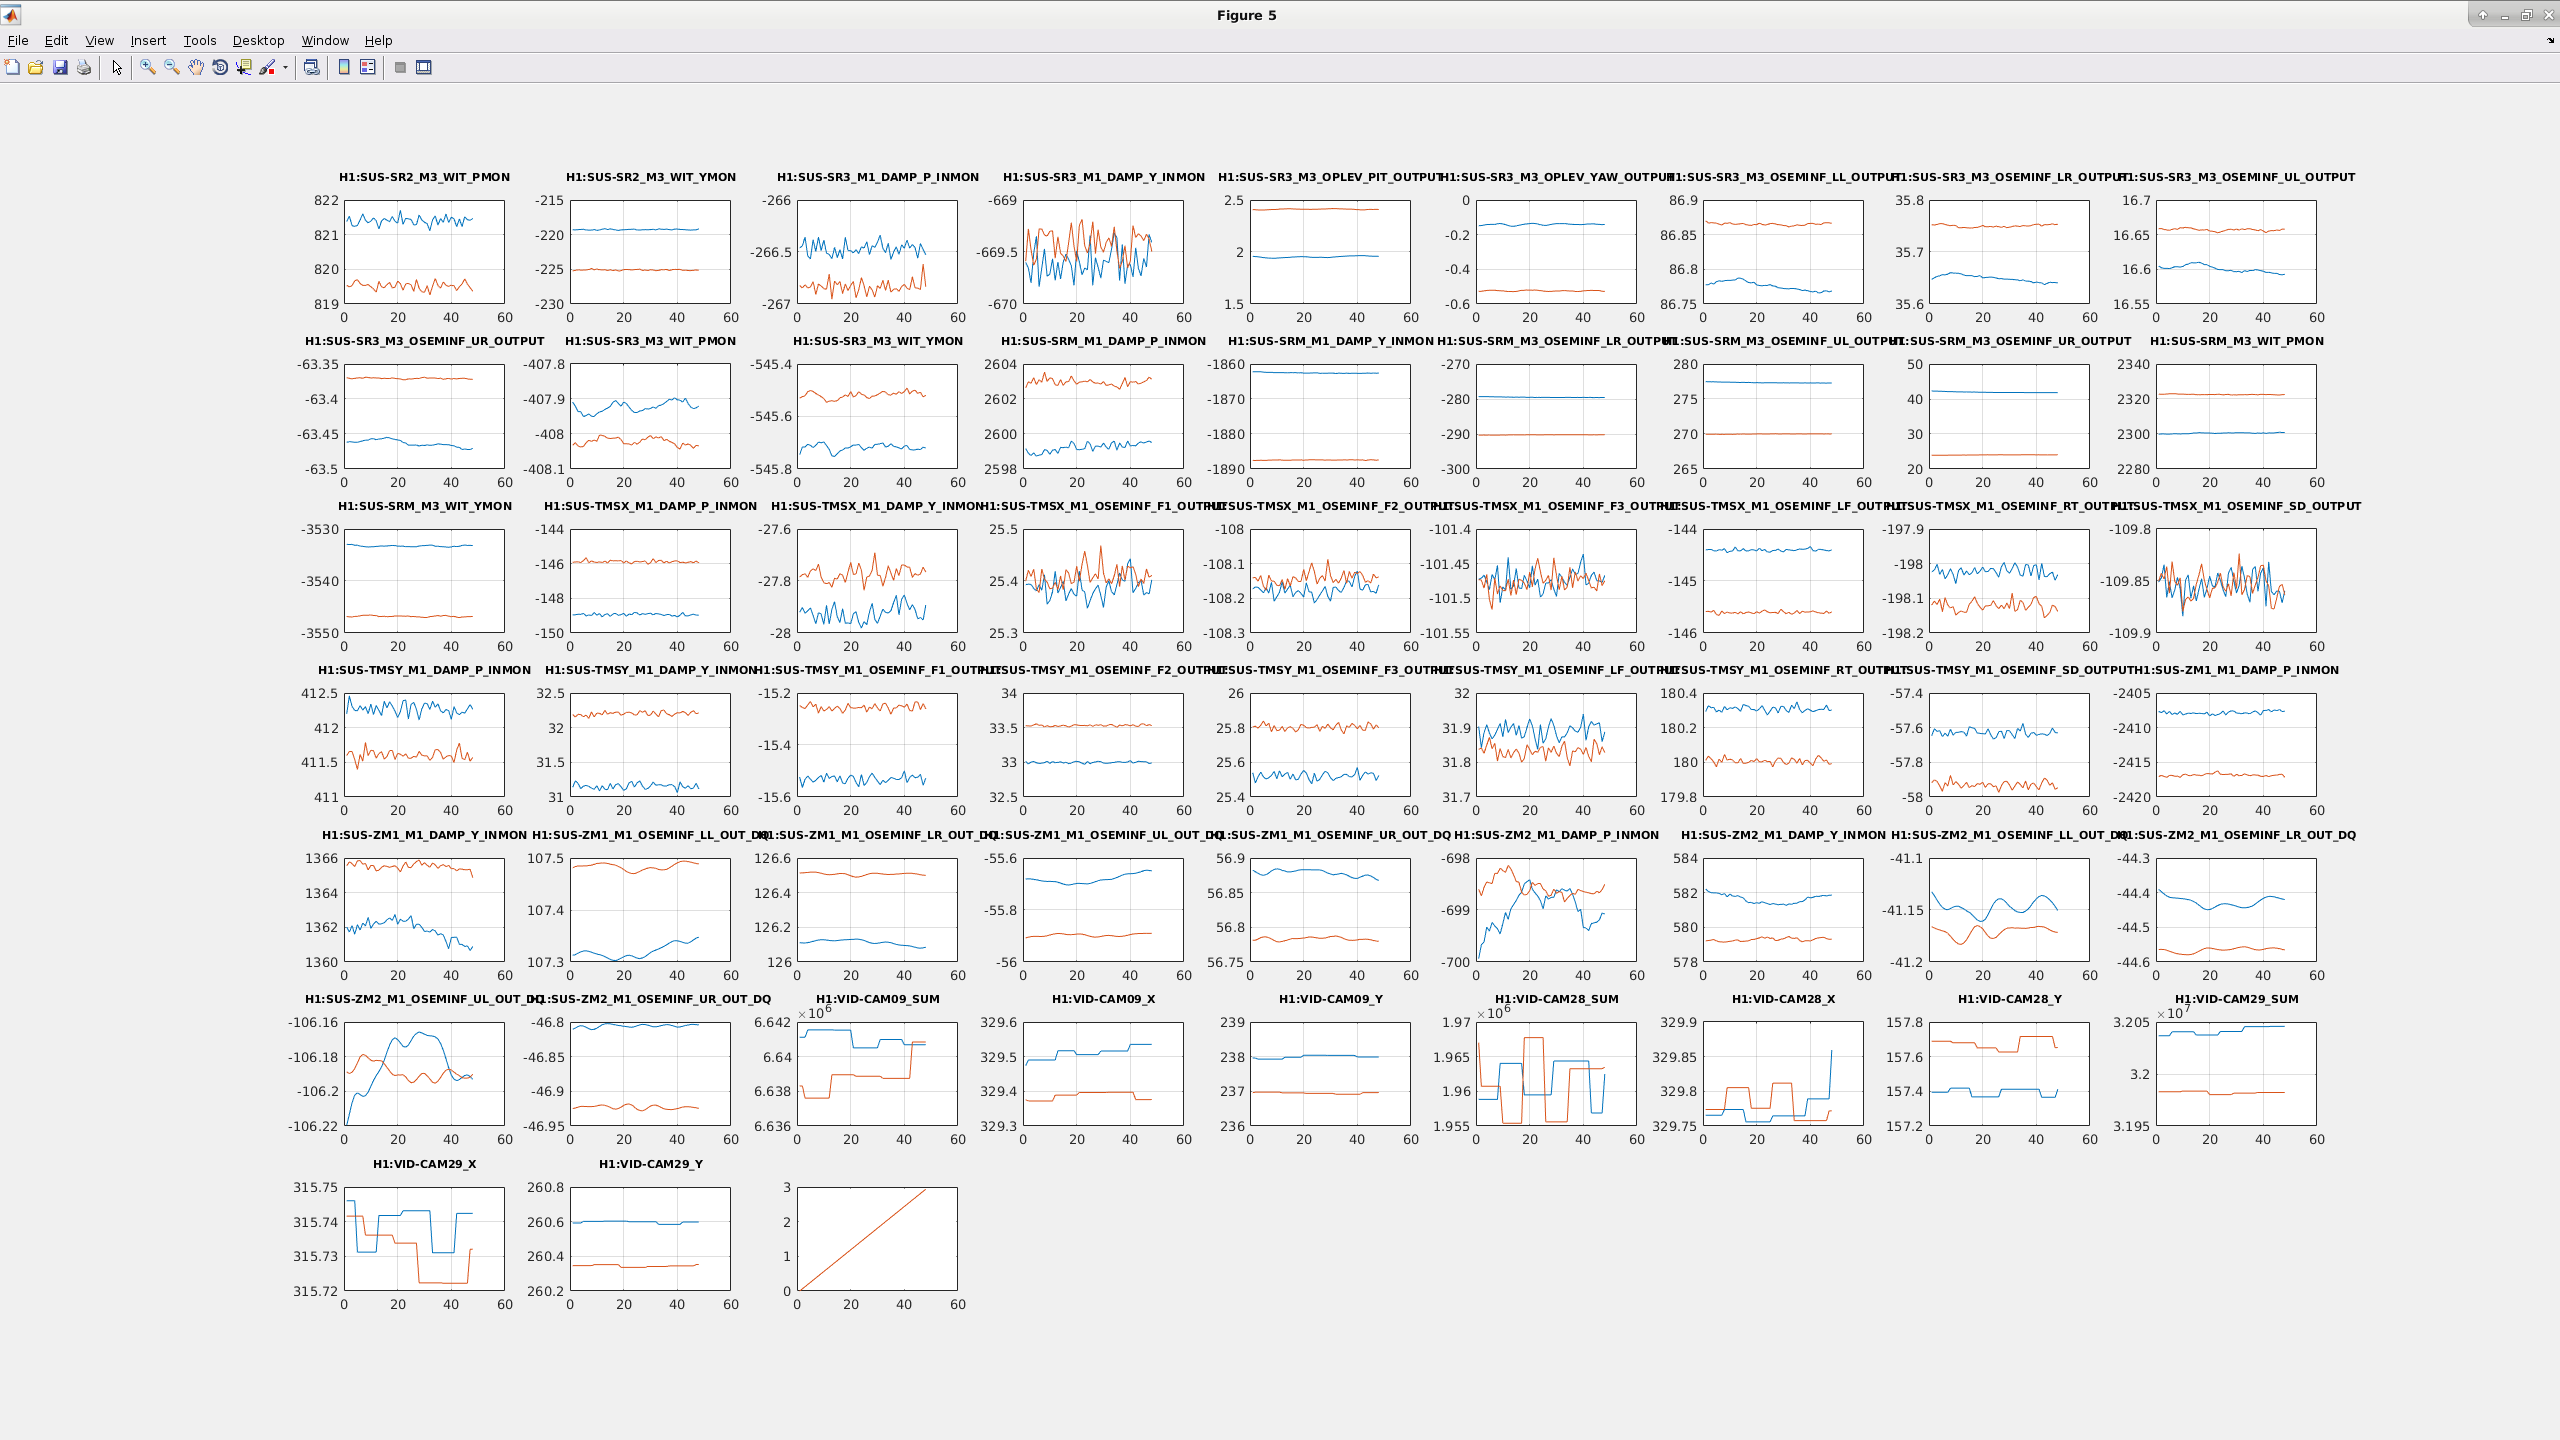
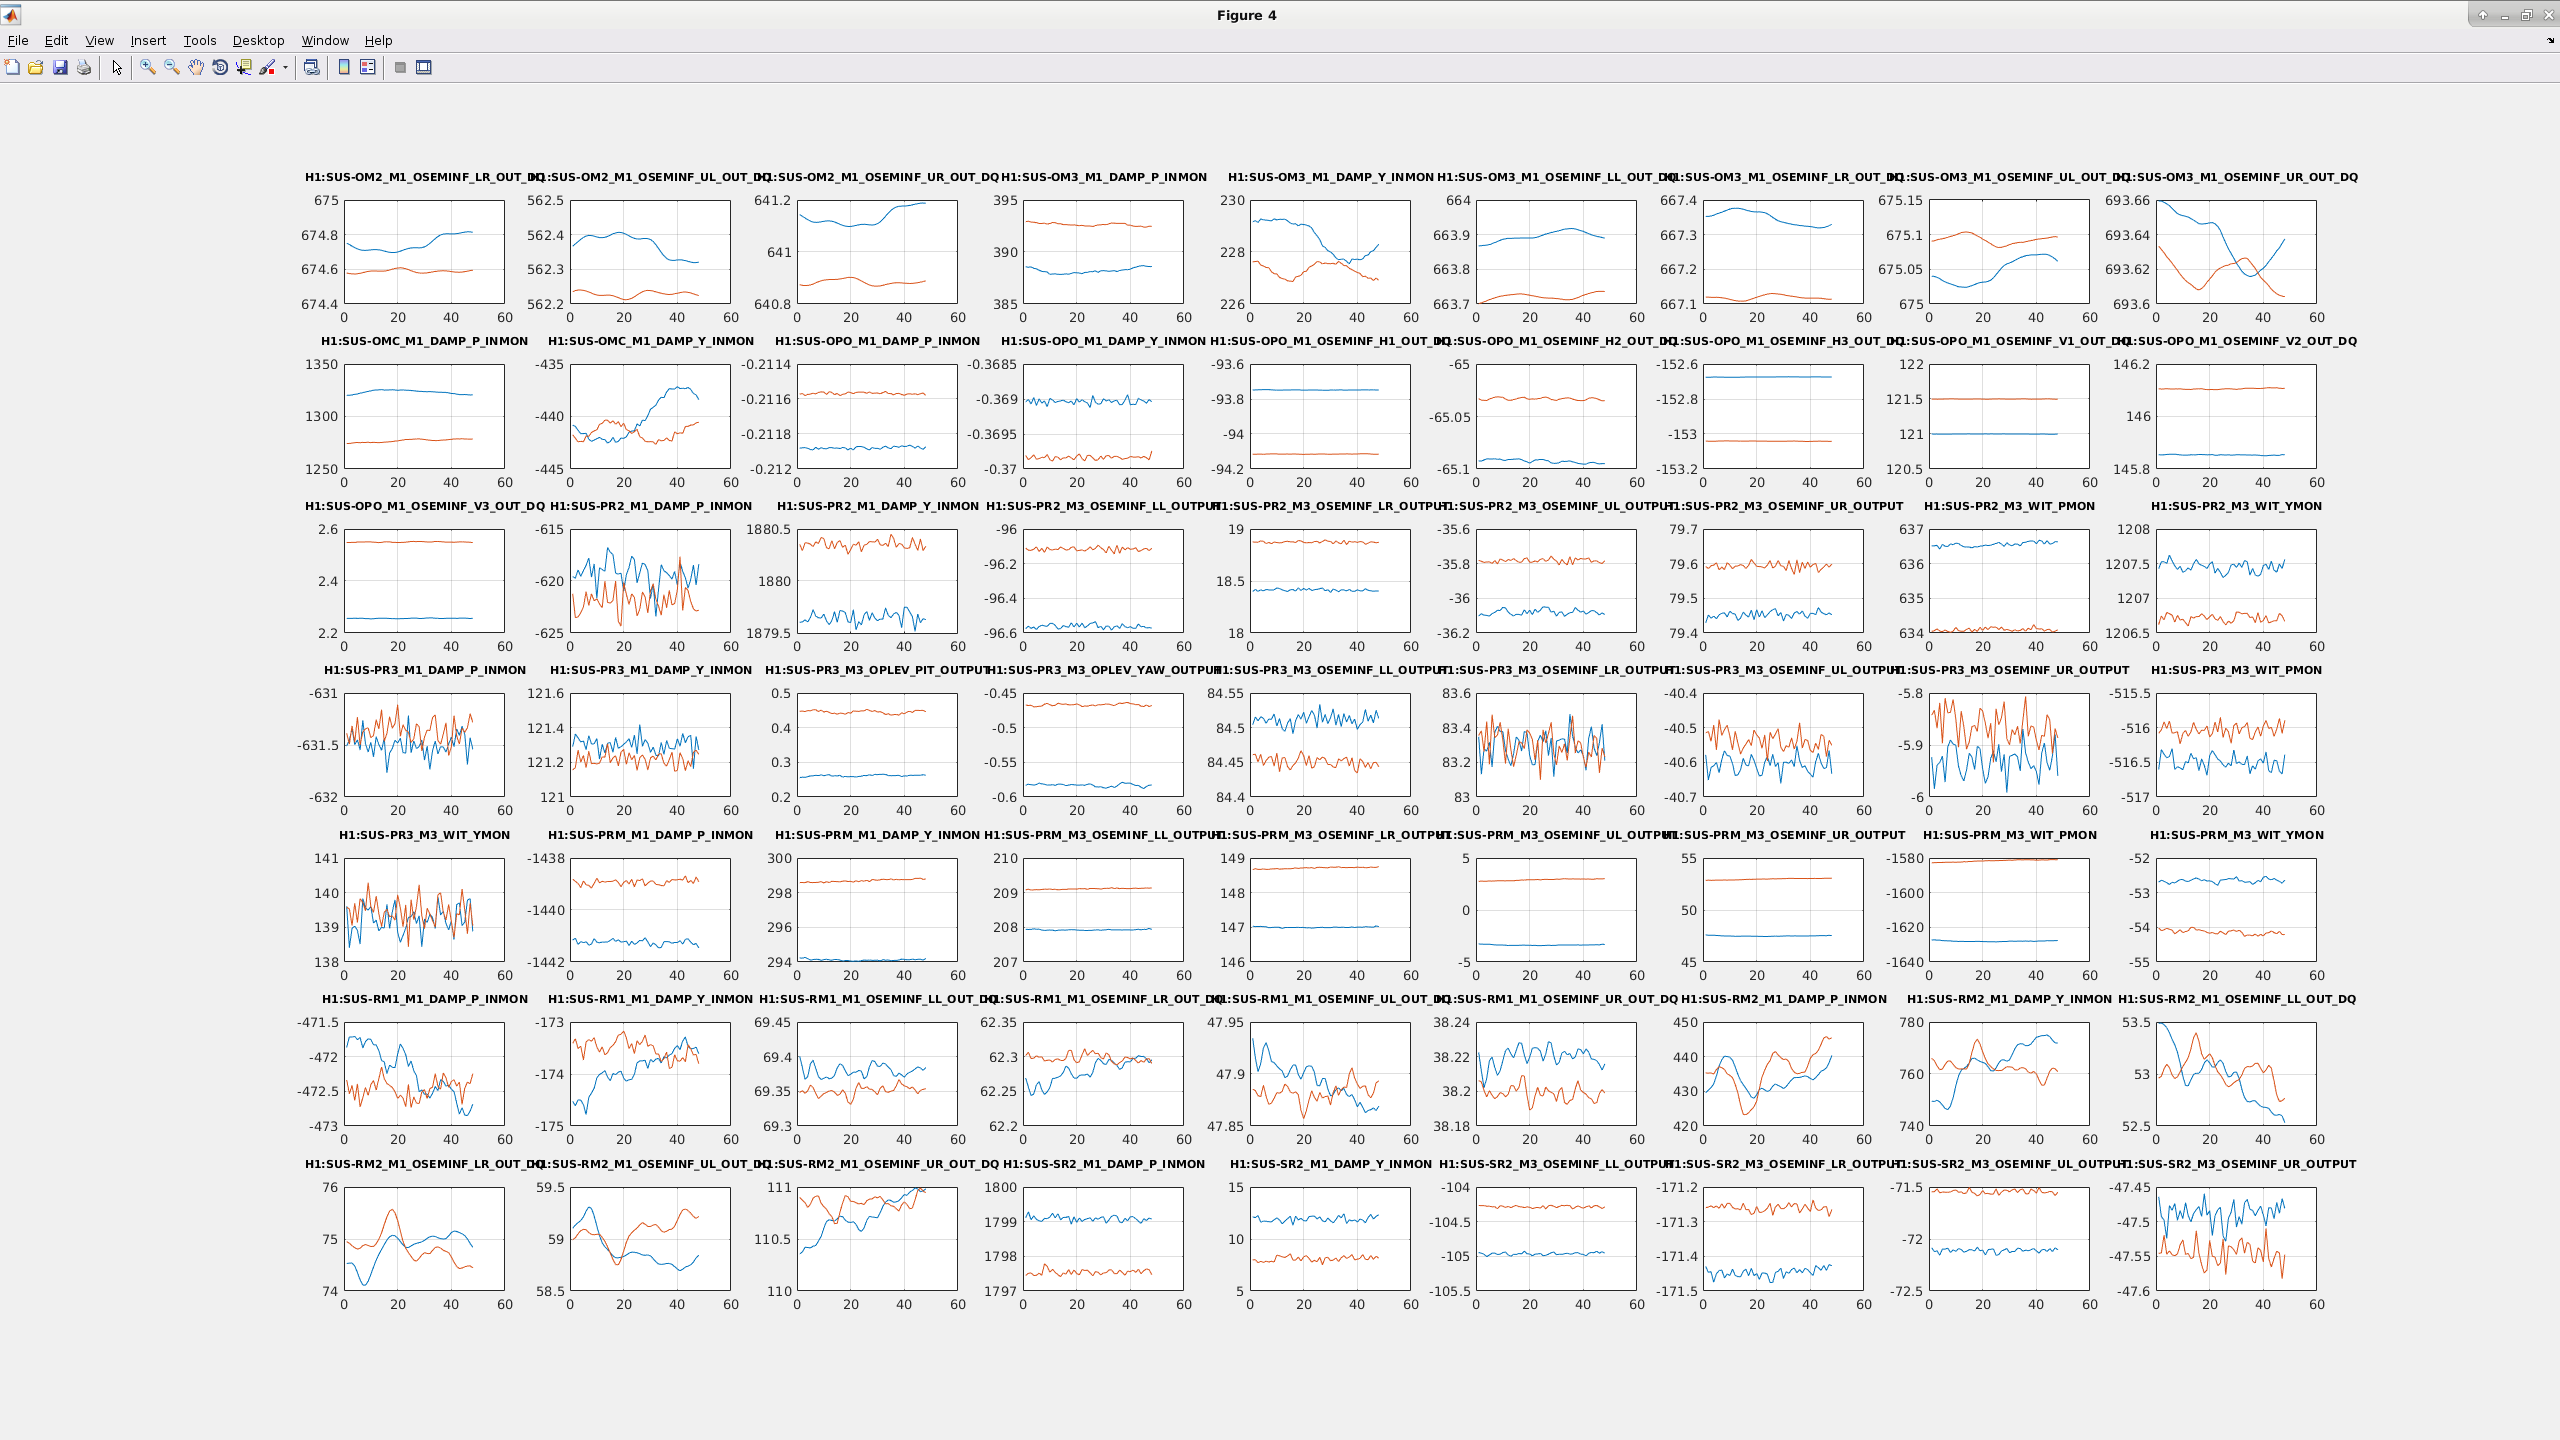
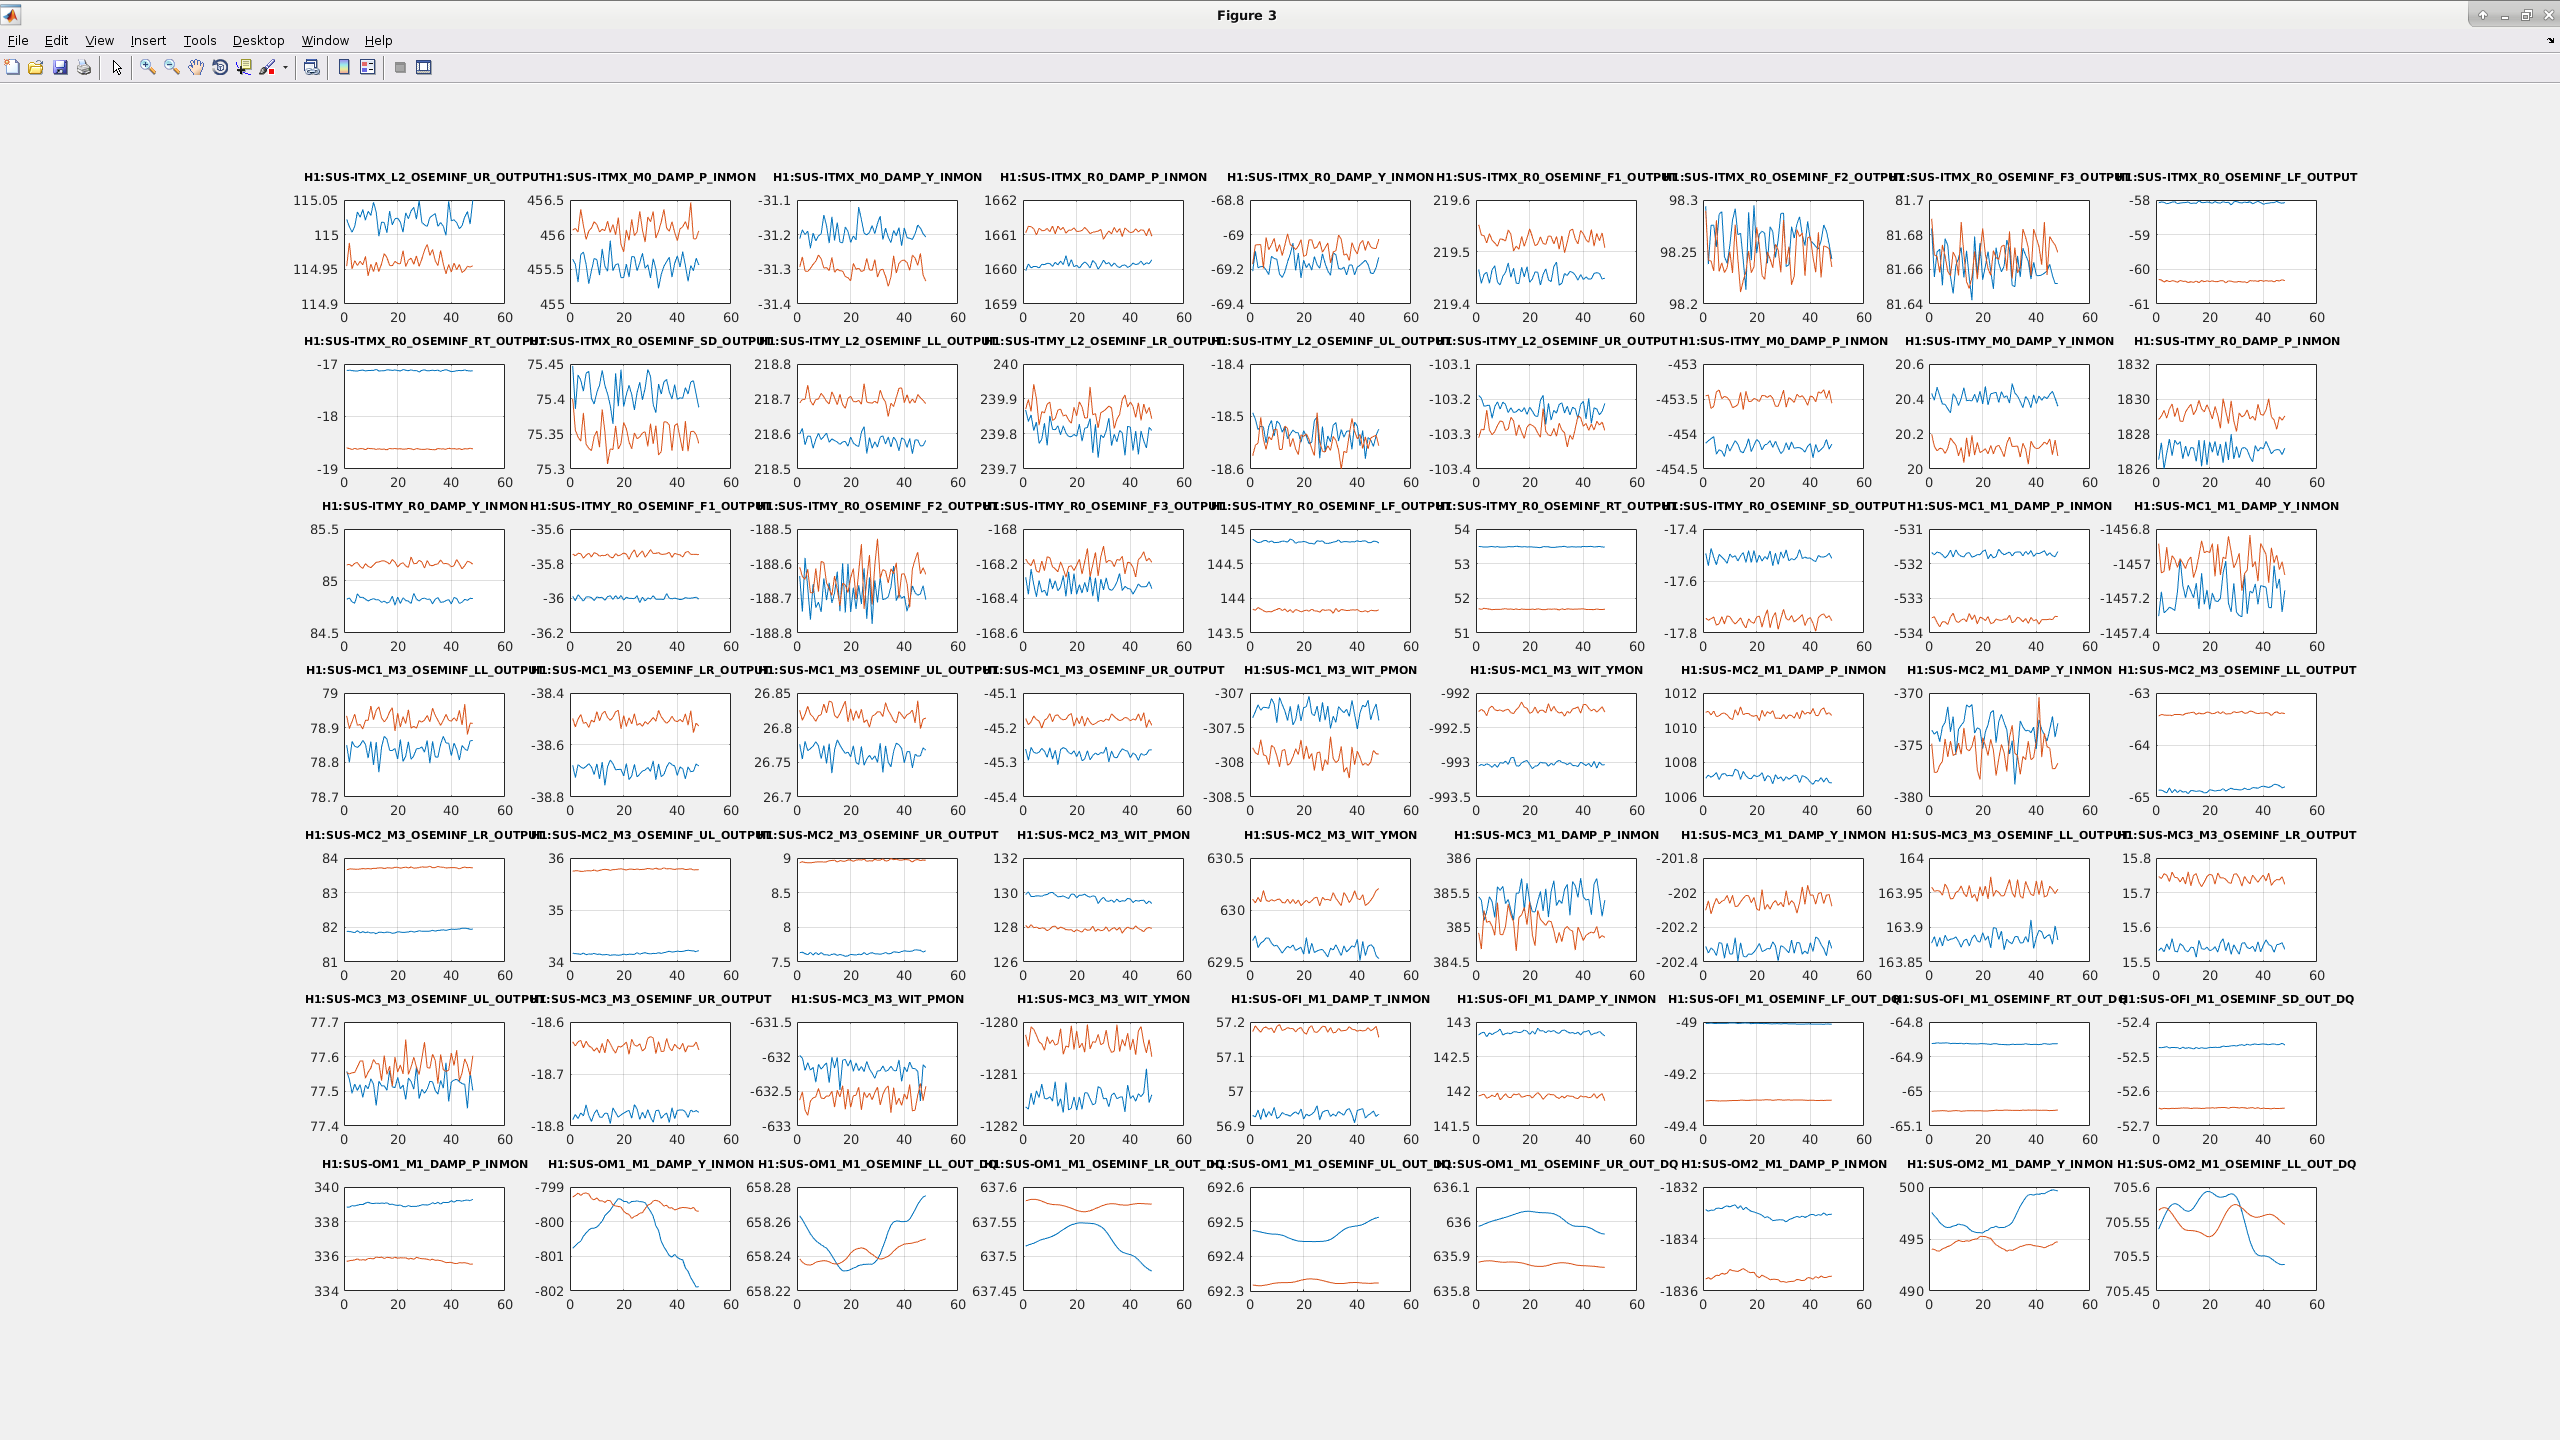
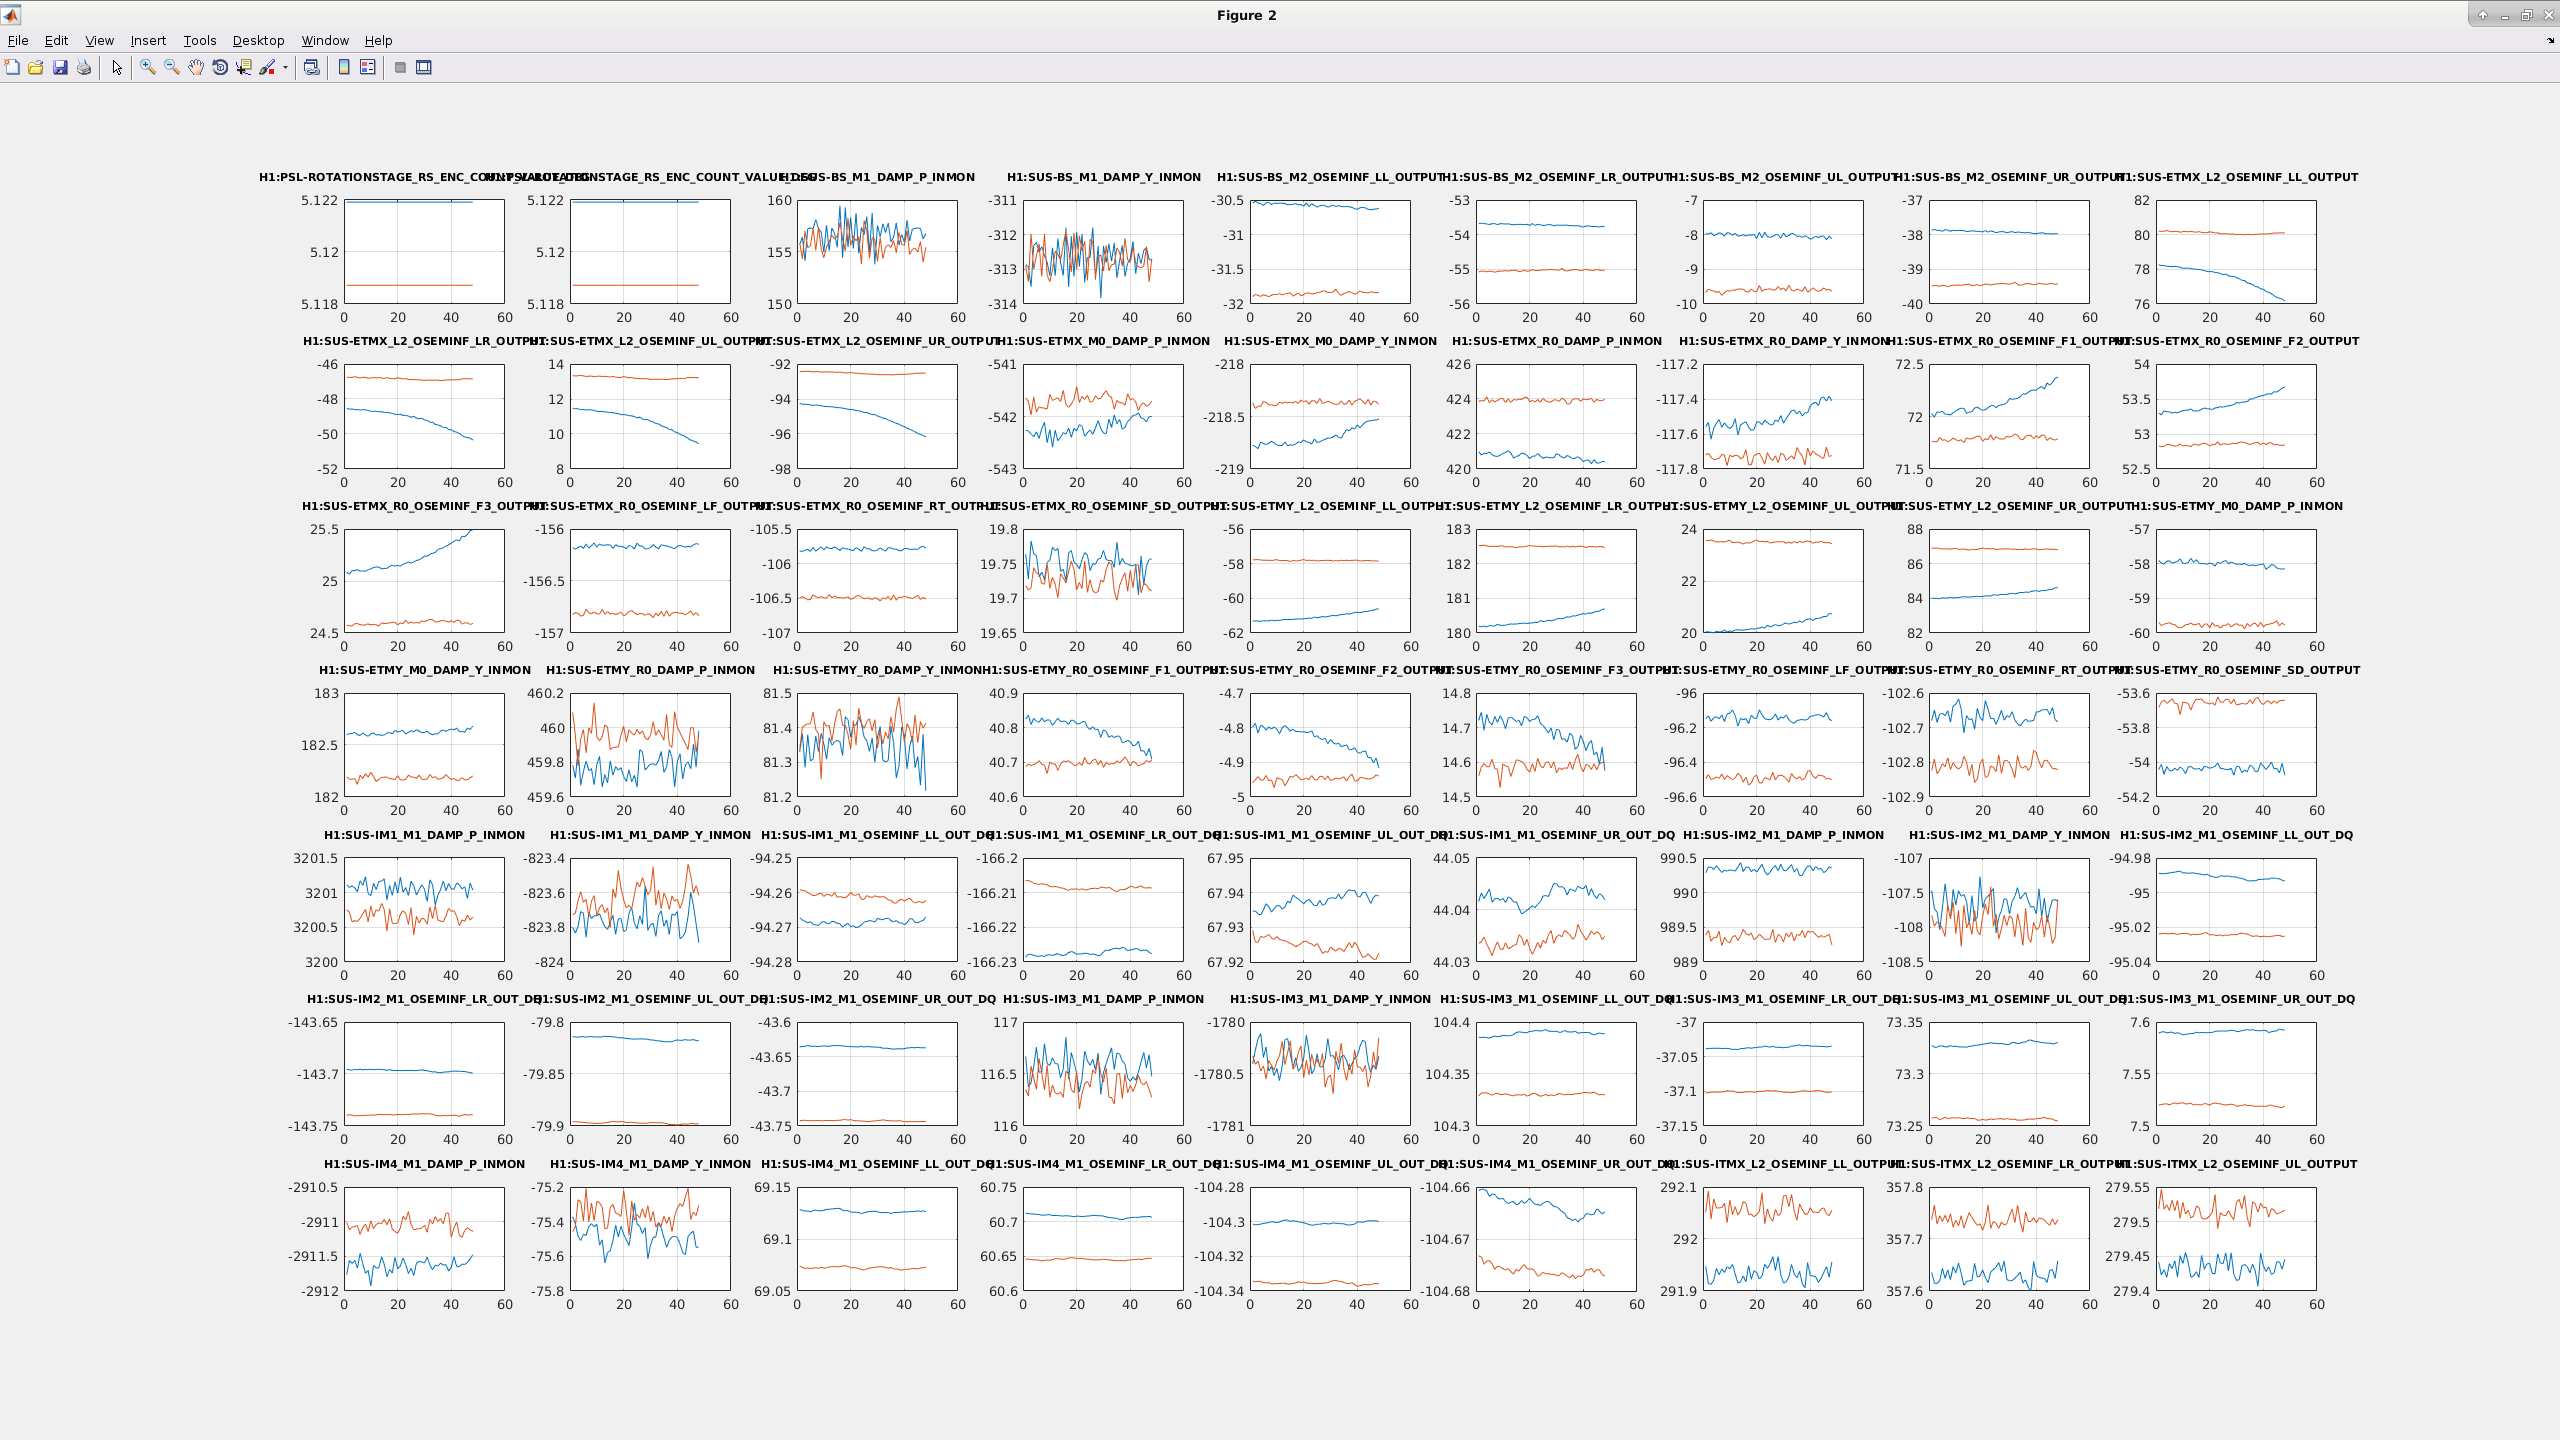
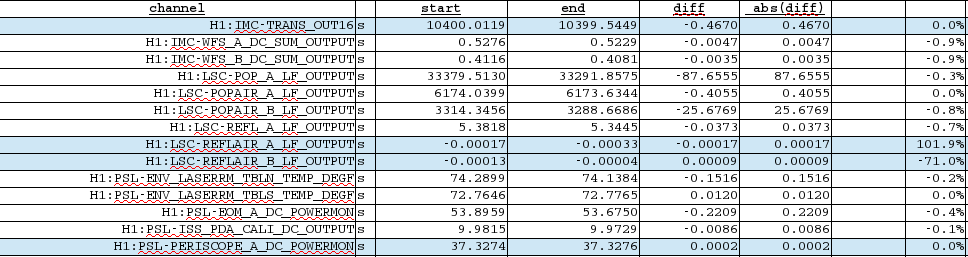
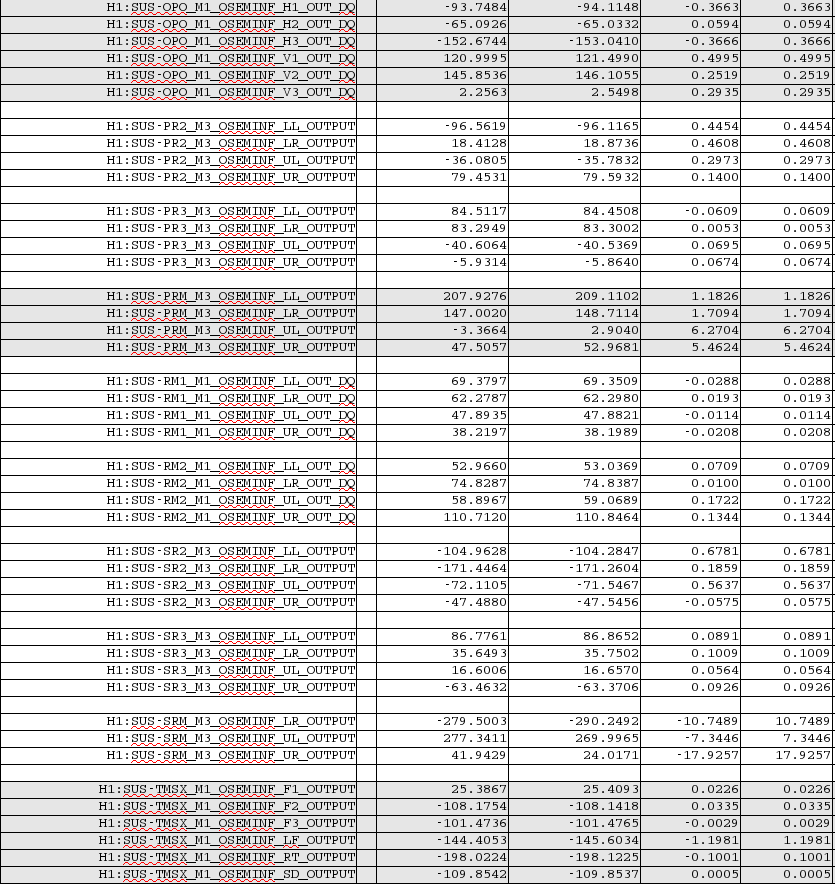
I ran my matlab code to look at two times, one during this lock, and one from the previous lock, to identify changes. Attached are results, in list form, from the excel file and in plots where the blue trace is from the previous lock and the red trace is from the current lock.
- excel file
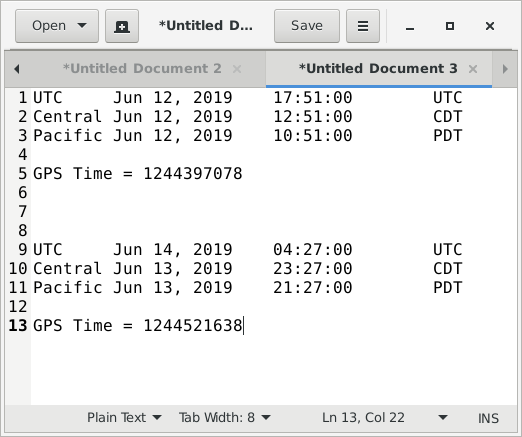
- test file snapshot of times used
- 5 plots of excel file channels, from Matlab
- snapshots of pitch, yaw, and sum changes, and osem changes that stood out
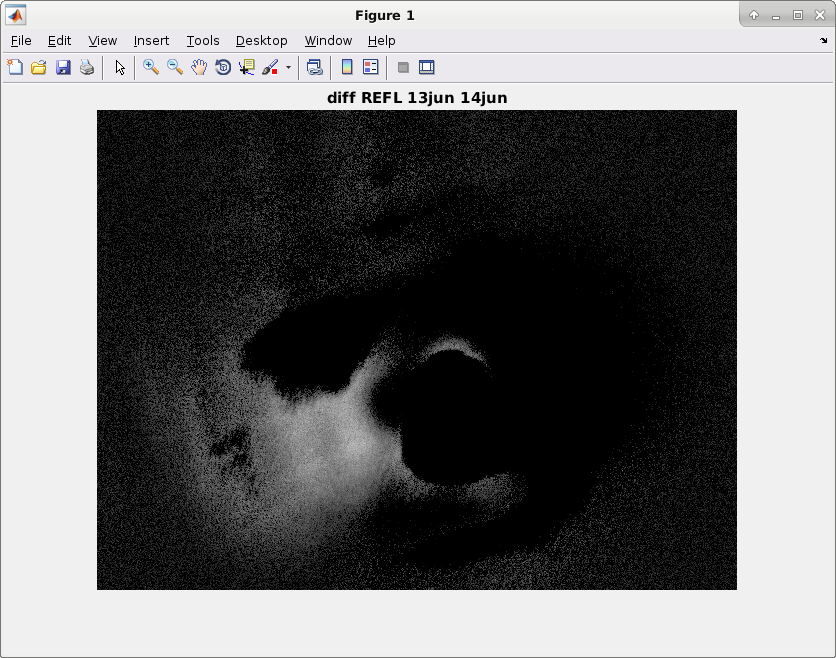
- an IMC REFL image from 6/13 00:41UTC and 6/14 00:41UTC subtracted to show the change
- the largest Pitch and Yaw changes are also in tables below:
| channel | start | end | diff | abs(diff) | |
| H1:SUS-OMC_M1_DAMP_P_INMON | p | 1323.2684 | 1276.9399 | -46.3284 | 46.3284 |
| H1:SUS-PRM_M3_WIT_PMON | p | -1627.9656 | -1581.6614 | 46.3043 | 46.3043 |
| H1:SUS-SRM_M3_WIT_PMON | p | 2300.4584 | 2322.5835 | 22.1252 | 22.1252 |
| H1:SUS-ZM1_M1_DAMP_P_INMON | p | -2407.8339 | -2416.8431 | -9.0092 | 9.0092 |
| channel | start | end | diff | abs(diff) | |
| H1:SUS-SRM_M1_DAMP_Y_INMON | y | -1862.5385 | -1887.4435 | -24.9049 | 24.9049 |
| H1:SUS-SRM_M3_WIT_YMON | y | -3533.2723 | -3546.7958 | -13.5235 | 13.5235 |
| H1:SUS-SR2_M3_WIT_YMON | y | -219.2685 | -225.0900 | -5.8215 | 5.8215 |
Images attached to this report




Non-image files attached to this report
