Sudarshan K, Ethan P, Rick S
During commissioning time, we excited PCALX and PCALY at 395.1 Hz. This was done in relation to alogs 53244 and 53195. In order to achieve a higher SNR of the cancelling line, we decreased the frequency from 1153.1 Hz to 395.1 Hz. We were limited in decreasing the frequency further by Jenne's MICH, SRCL, etc noise injections. We also increased the amplitude of the excitations from 3619 to 18095 cts in PCALY and 5007 to 25035 cts in PCALX (factor of 5 increase).
We take 15 averages of a 100 s FFT with Hanning windowing and 50% overlap from 1257809856s. Note some issues were encountered in finding a suitable segment for the FFT due to Jenne's injections (some noise reached ~400 Hz).
See attached for the amplitude spectral densities. The table contains the measured amplitudes. We see a line within DARM corresponding to a difference in the amplitude of the two PCAL excitations.
| H1:CAL-PCALX_RX_PD_OUT_DQ | 4.47e-17 |
| H1:CAL-PCALY_RX_PD_OUT_DQ | 4.46541e-17 |
| H1:CAL-DELTAL_EXTERNAL_DQ | 1.31147e-19 |
The amplitudes of the excitations driven by the PCALs differ by 0.11% similiar to alog 53244.
However, now we notice a line present in DARM with an ampllitude of 1.31147e-19 m/Hz^1/2. This indicates an error of 0.31% between the endstations. Further work is required on determining whether the 0.11% from the measured discrepancy is in addition to or subtracted from the error observed in DARM.

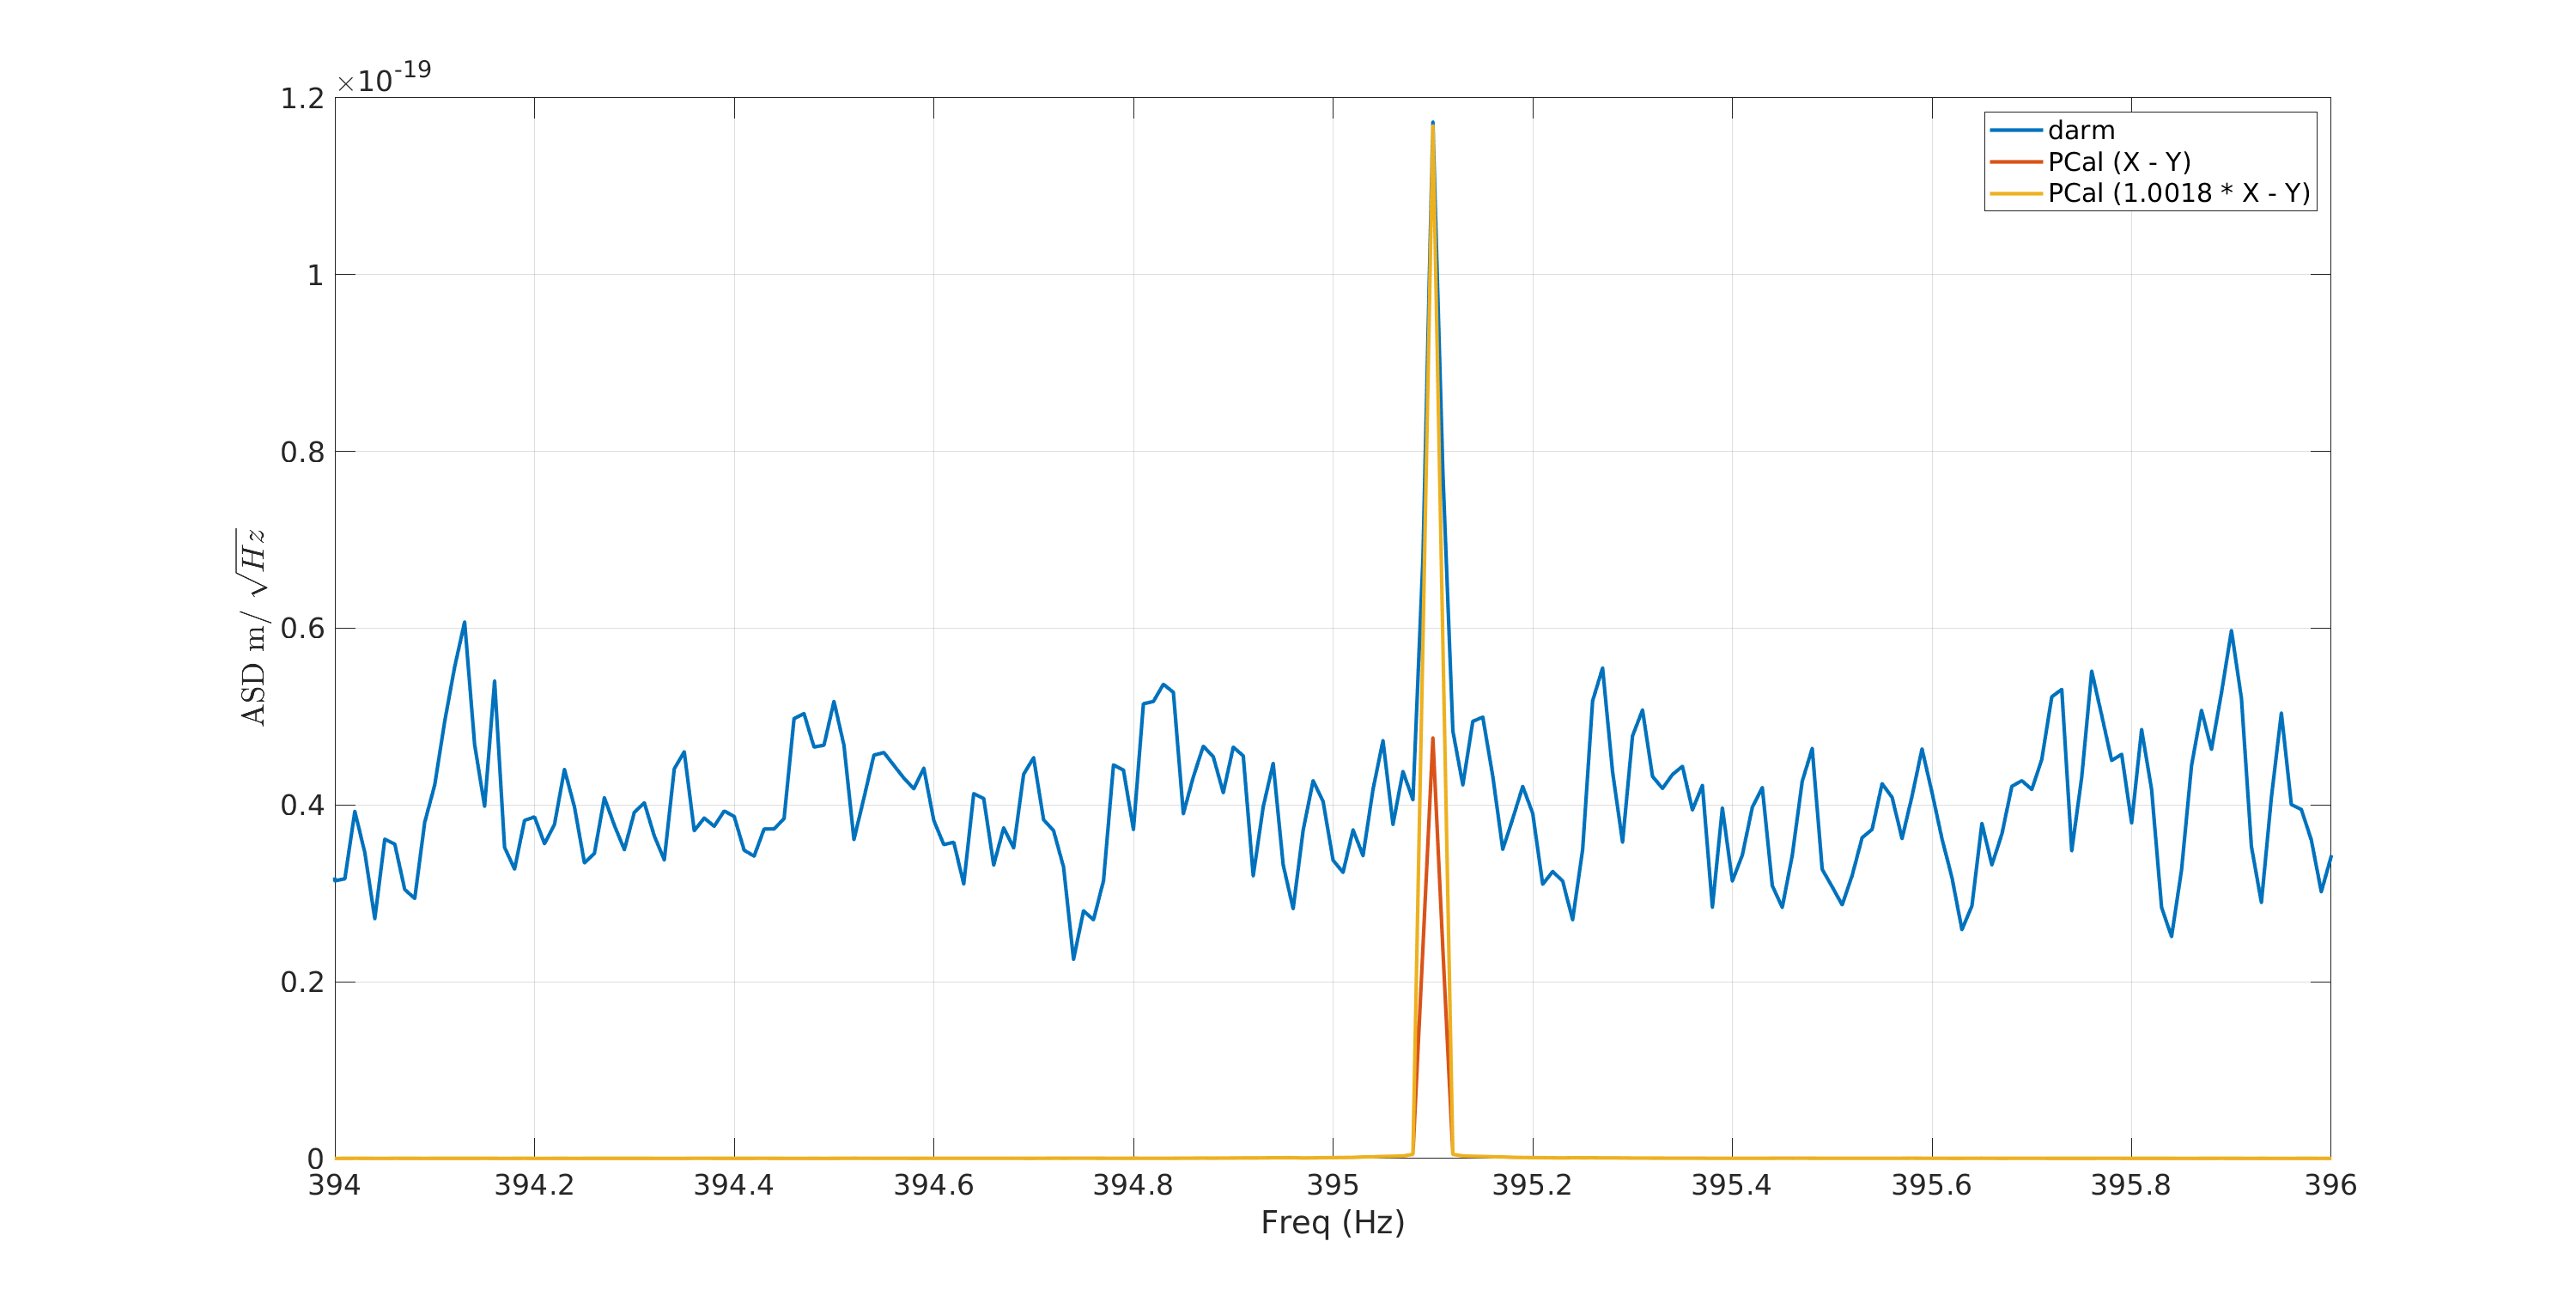
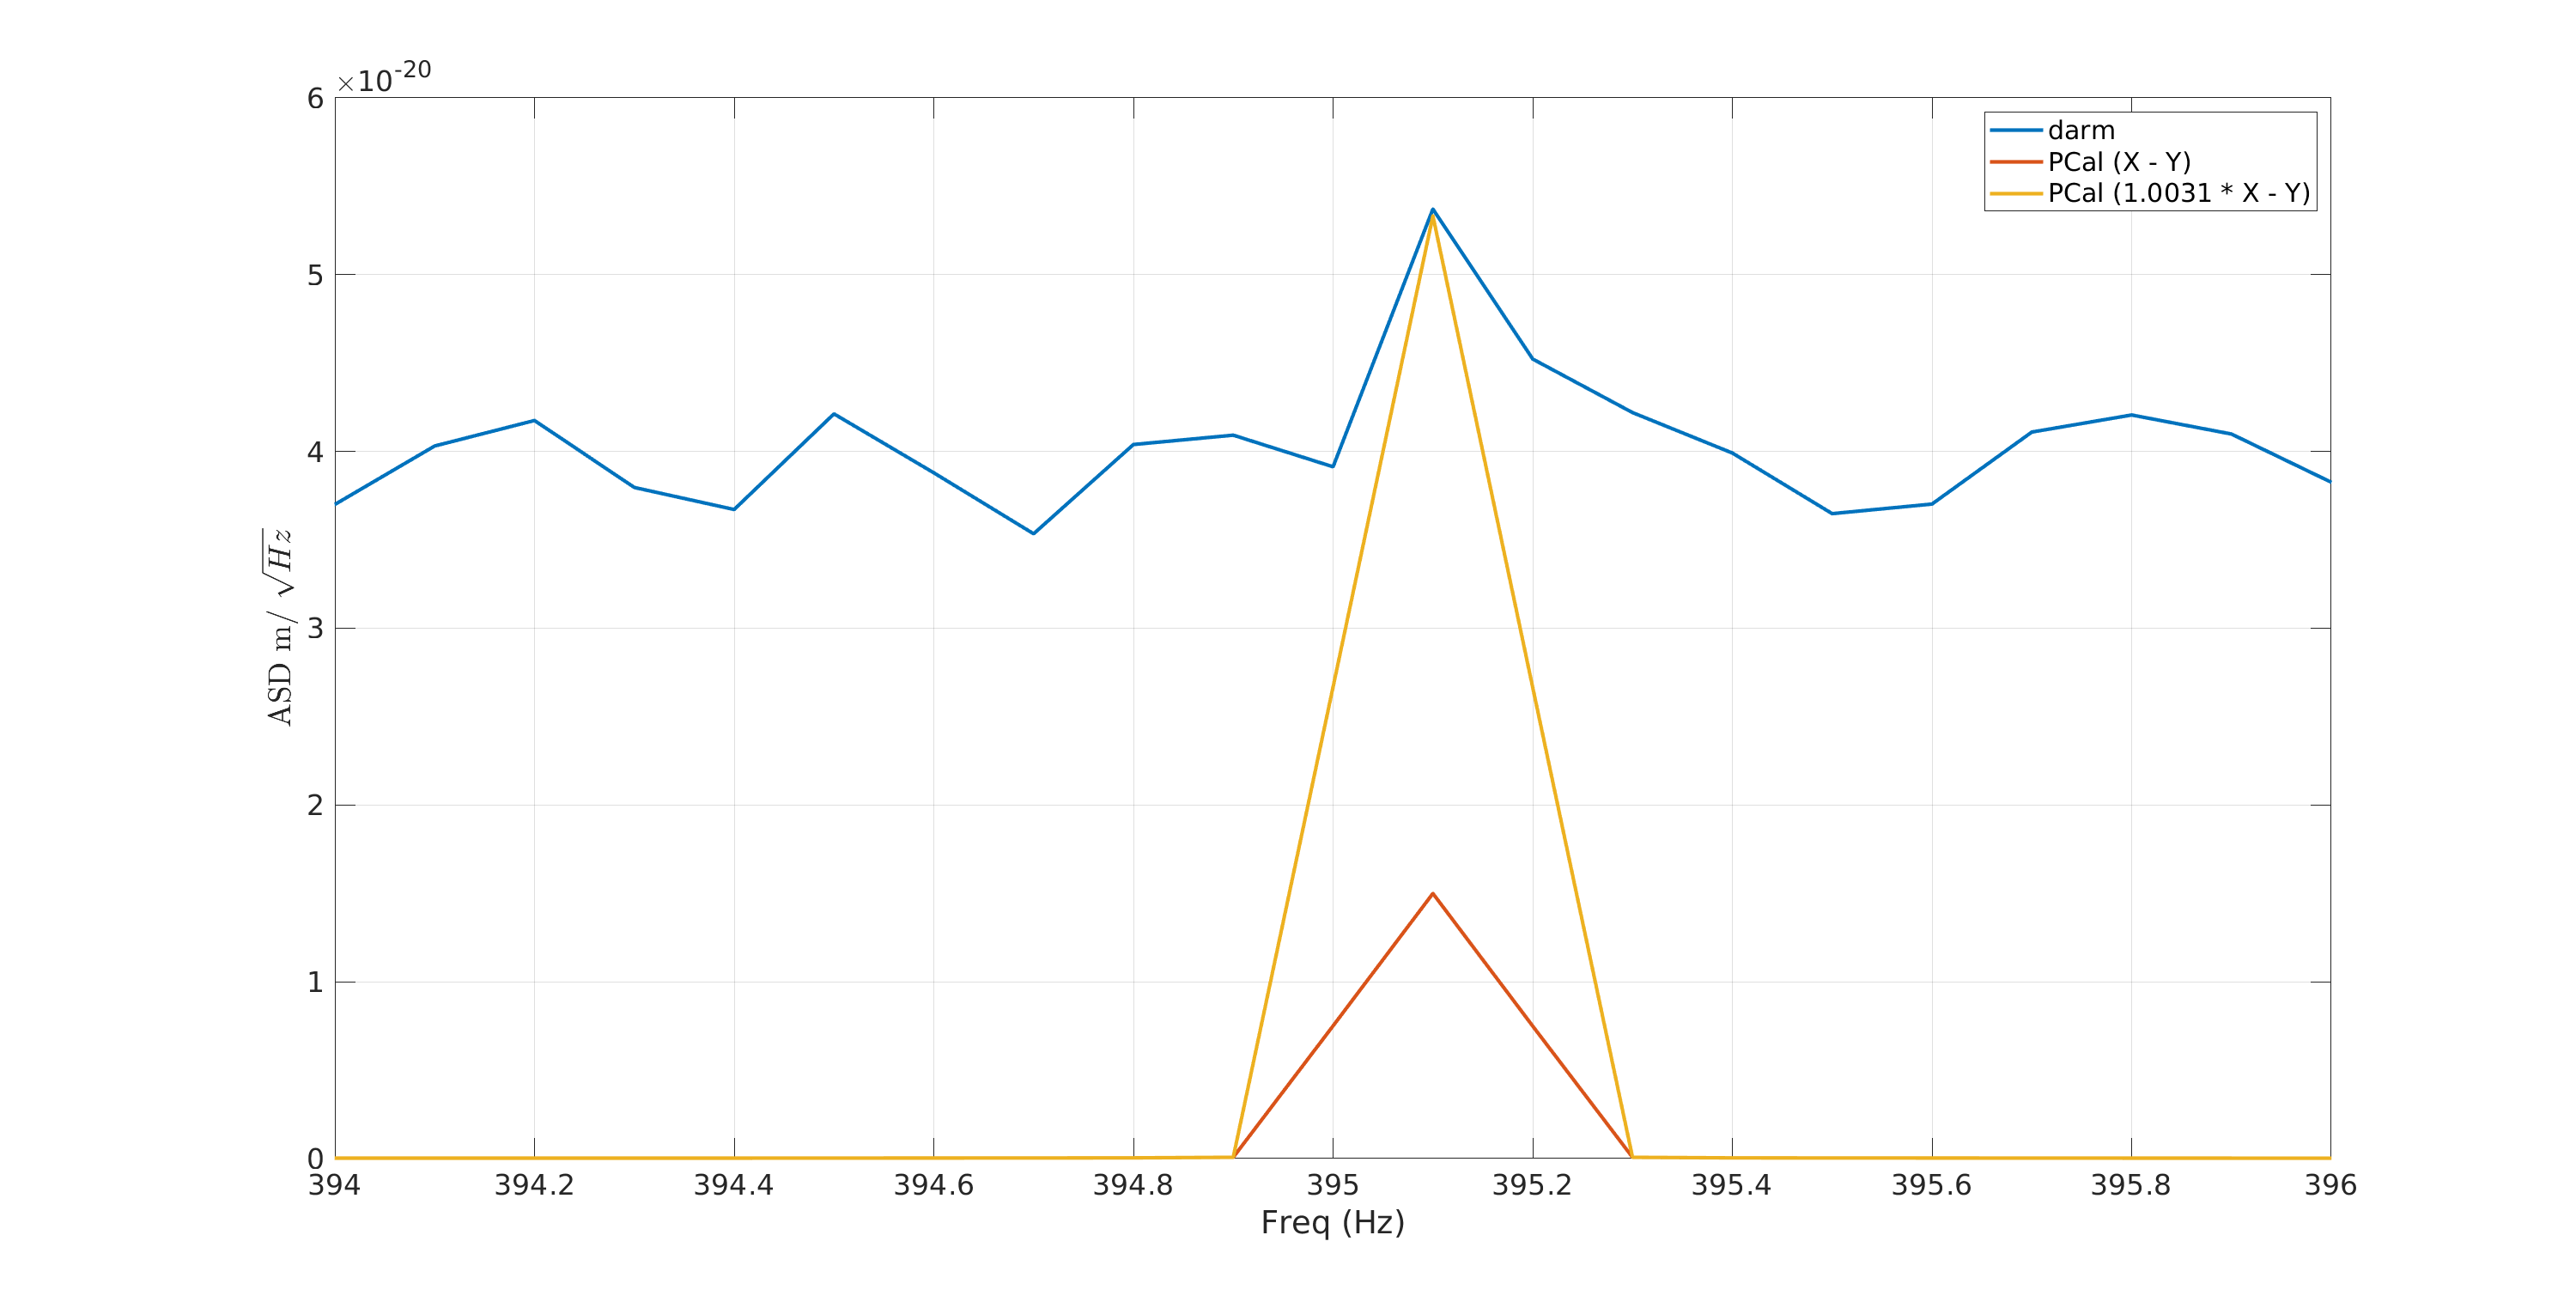
Attached is a plot showing DARM, X - Y (PCAL) for this time period, zoomed in around 395.1 Hz. In the plot, PCal (X - Y) corresponds to power spectrum of diference of two PCal RX PD signals. We have also plotted the difffence with X-end signal scaled by 1.0031. We see that with the scaling of X-end signal by 1.0031, the X - Y signal agrees with what we see in DARM. The coherence between X - Y and DARM is not that great at this drive frequency, so the associated uncertainty on 0.31% could be large (coherence based estimate provide an uncertainty of 6%). Assuming the line we see in DARM is true to a good accuracy then this suggests either
(i) the absolute power calibation of X-end PD differs from Y-end PD by 0.31% ,
(ii) the force-to-length response of X and Y-end mirrors are off by 0.31% or
(iii) the combination of absolute power calibration and force-to-length response is off by 0.31%.
We note here that since DARM is pegged against Y-end PCal, the difference has to come from the deviatoin of X-end with respect to Y-end. The code used to make this plot is also attached here with.

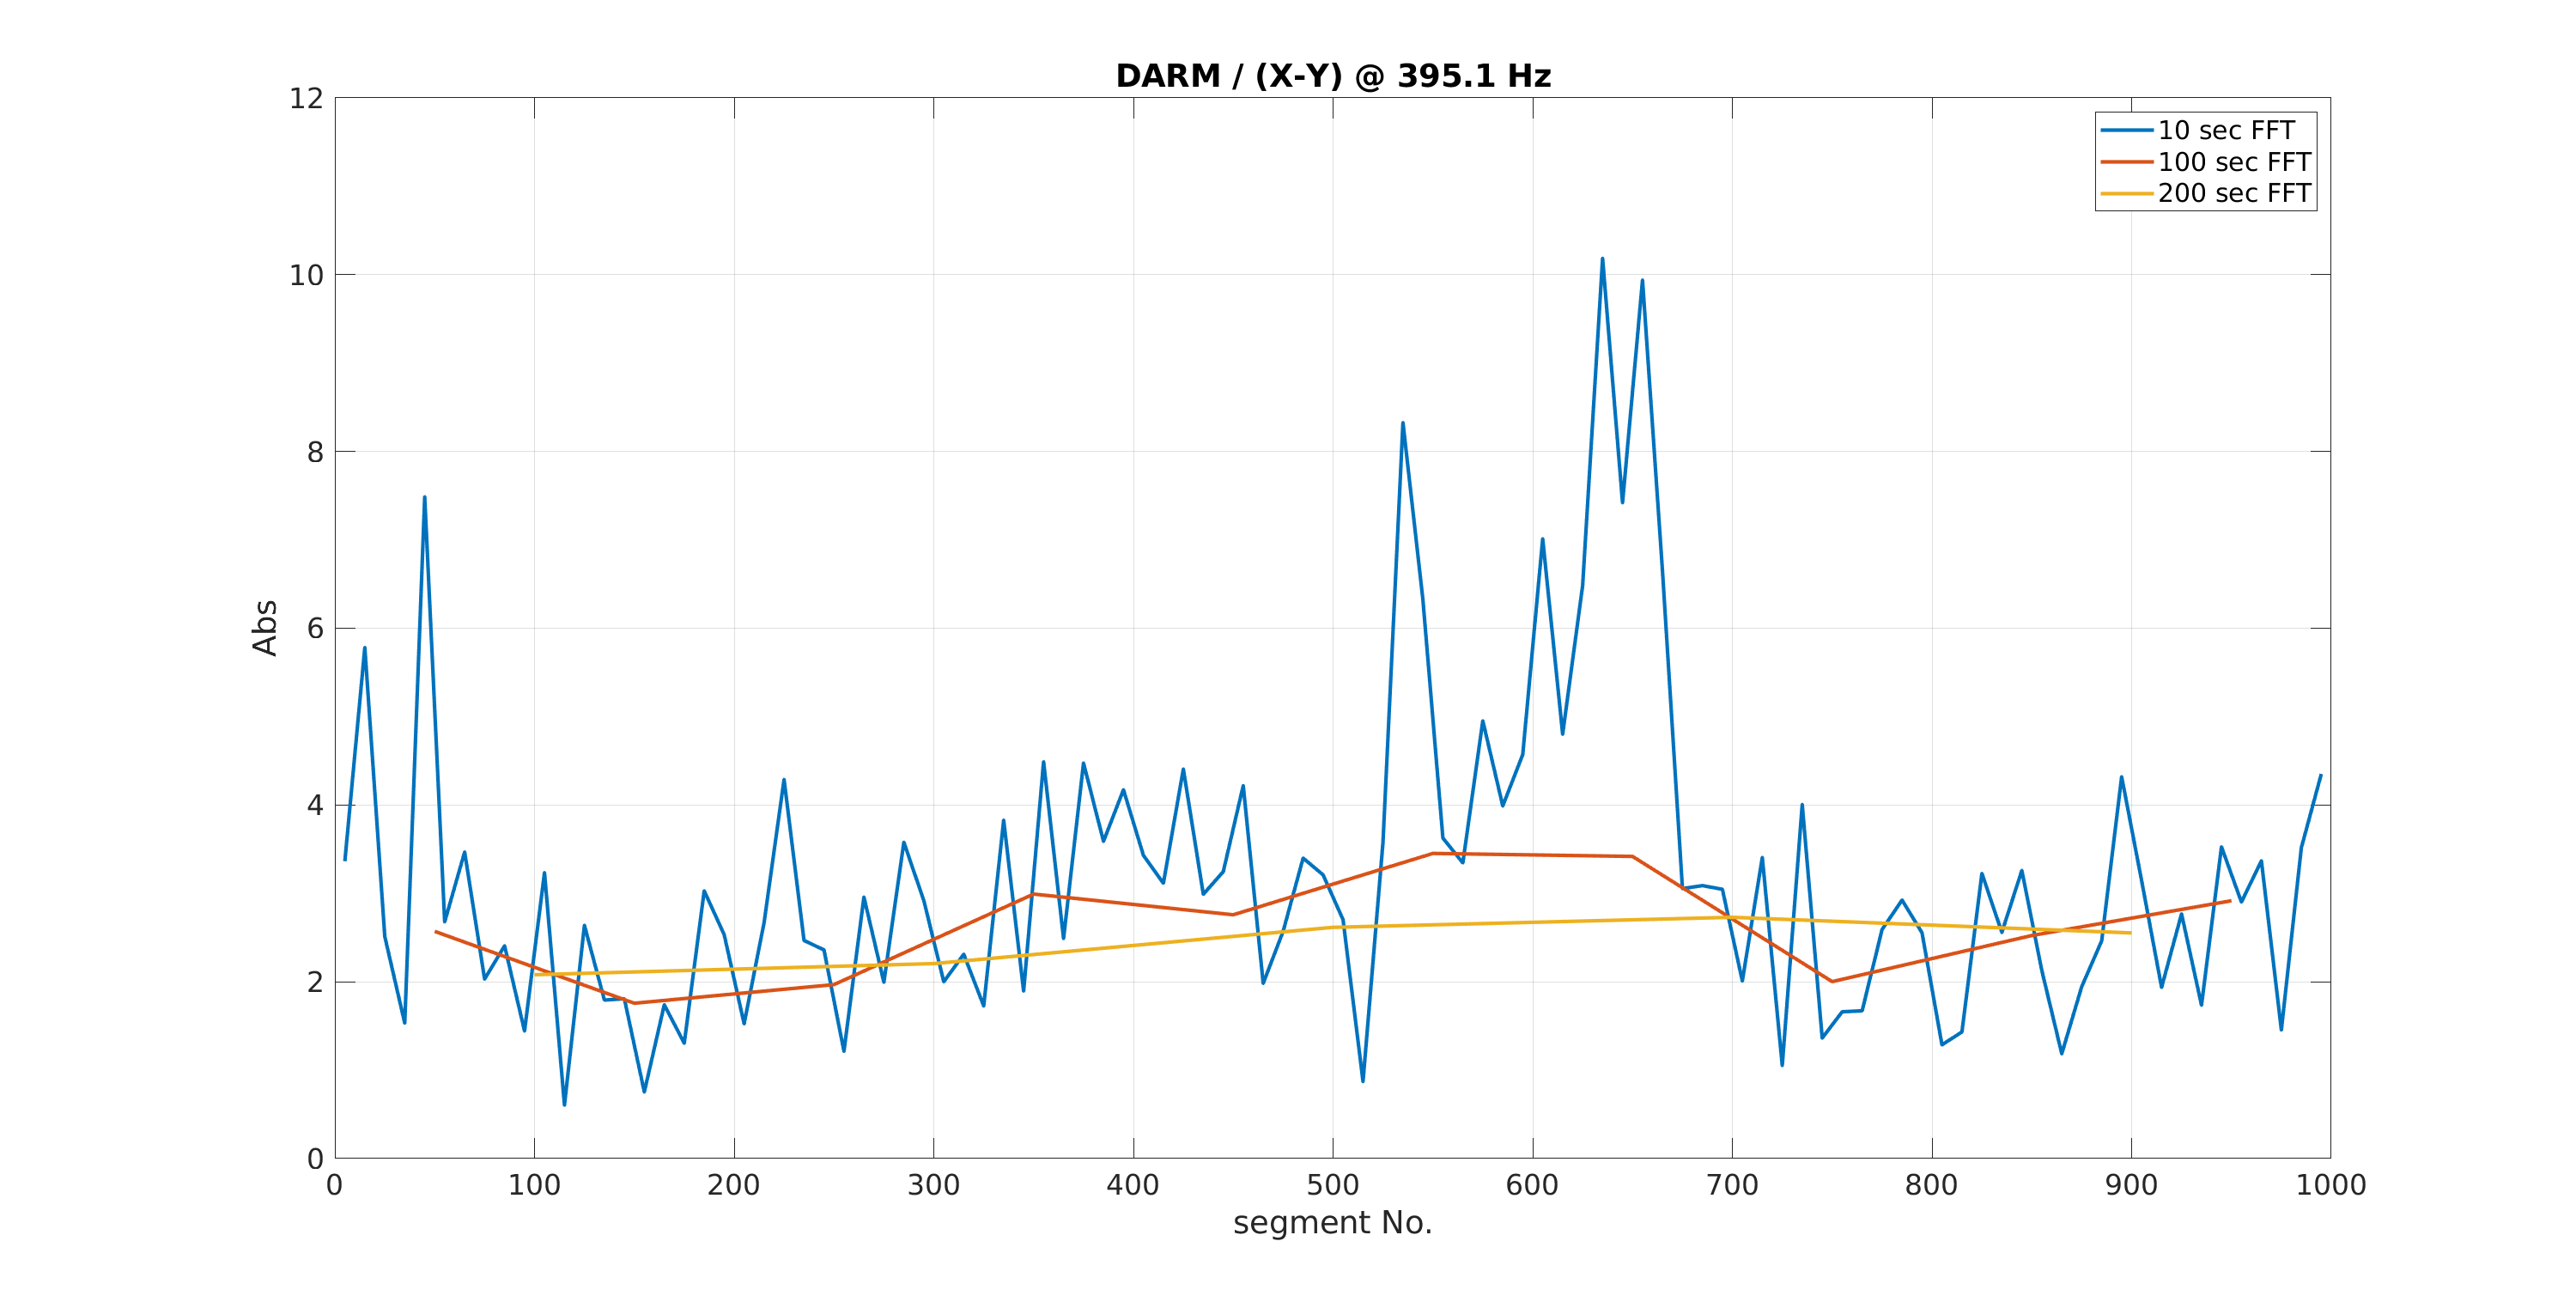
Here I have attached similar plot with better resoluton (100 sec FFT as opposed to 10 sec FFT as done in the previous comment). With this we get a difference of 0.18% between the end station Pcals and this number seems to be more robust when I increase the FFT duration (to get better SNR). I have also added a plot showing the values of DARM / (X - Y) at 395.1 Hz for various segments in the 1000 sec stretch used here. Looking at this trend for various segment durations we find that for 10 sec segment used in the previous commnet the data is not randomly distributed but has some features and hence the mean value would not agree with mean values we get from other segment durations (for truly random noise we expect means of different segment durations to agree with each other).