dripta.bhattacharjee@LIGO.ORG - posted 21:05, Monday 21 February 2022 (61812)
TSA/WSS Pcal responsivity ratio measurements from 31st Jan - 8th February, 2022
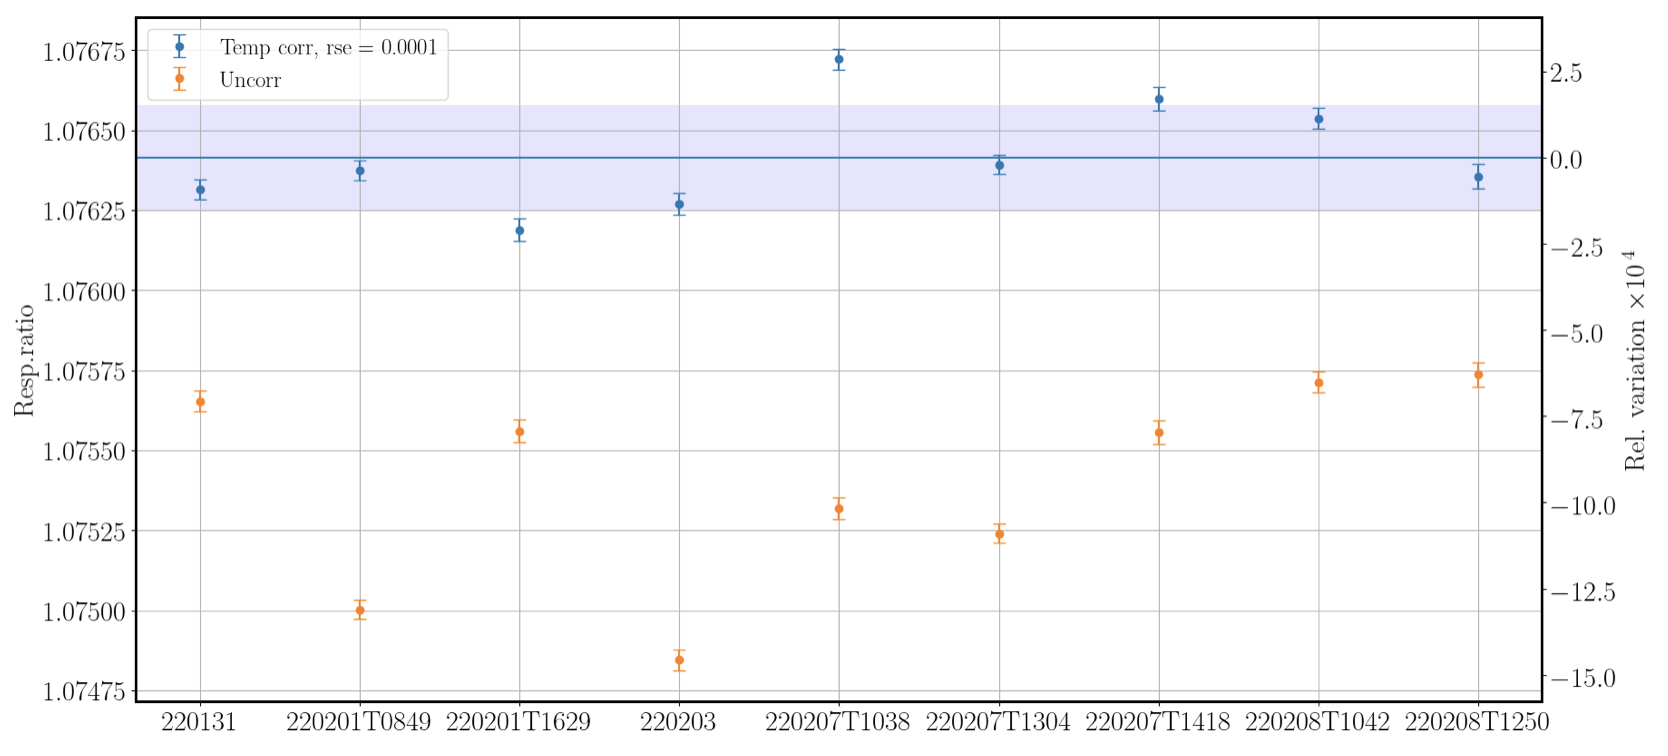
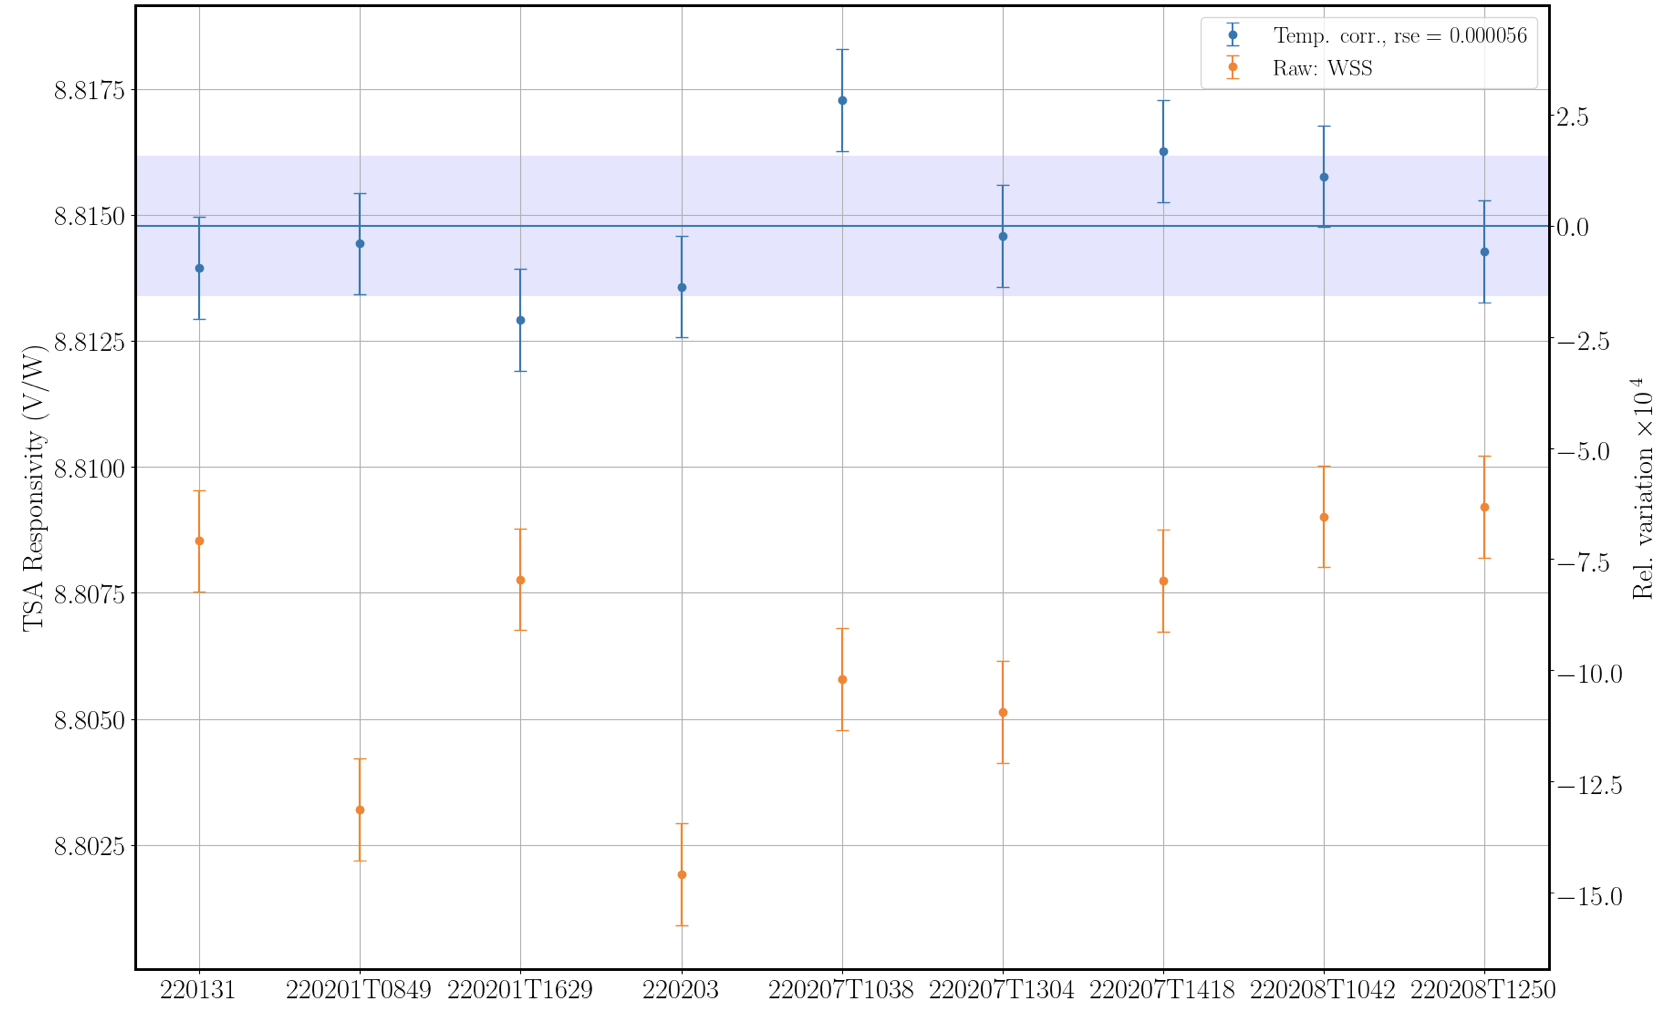
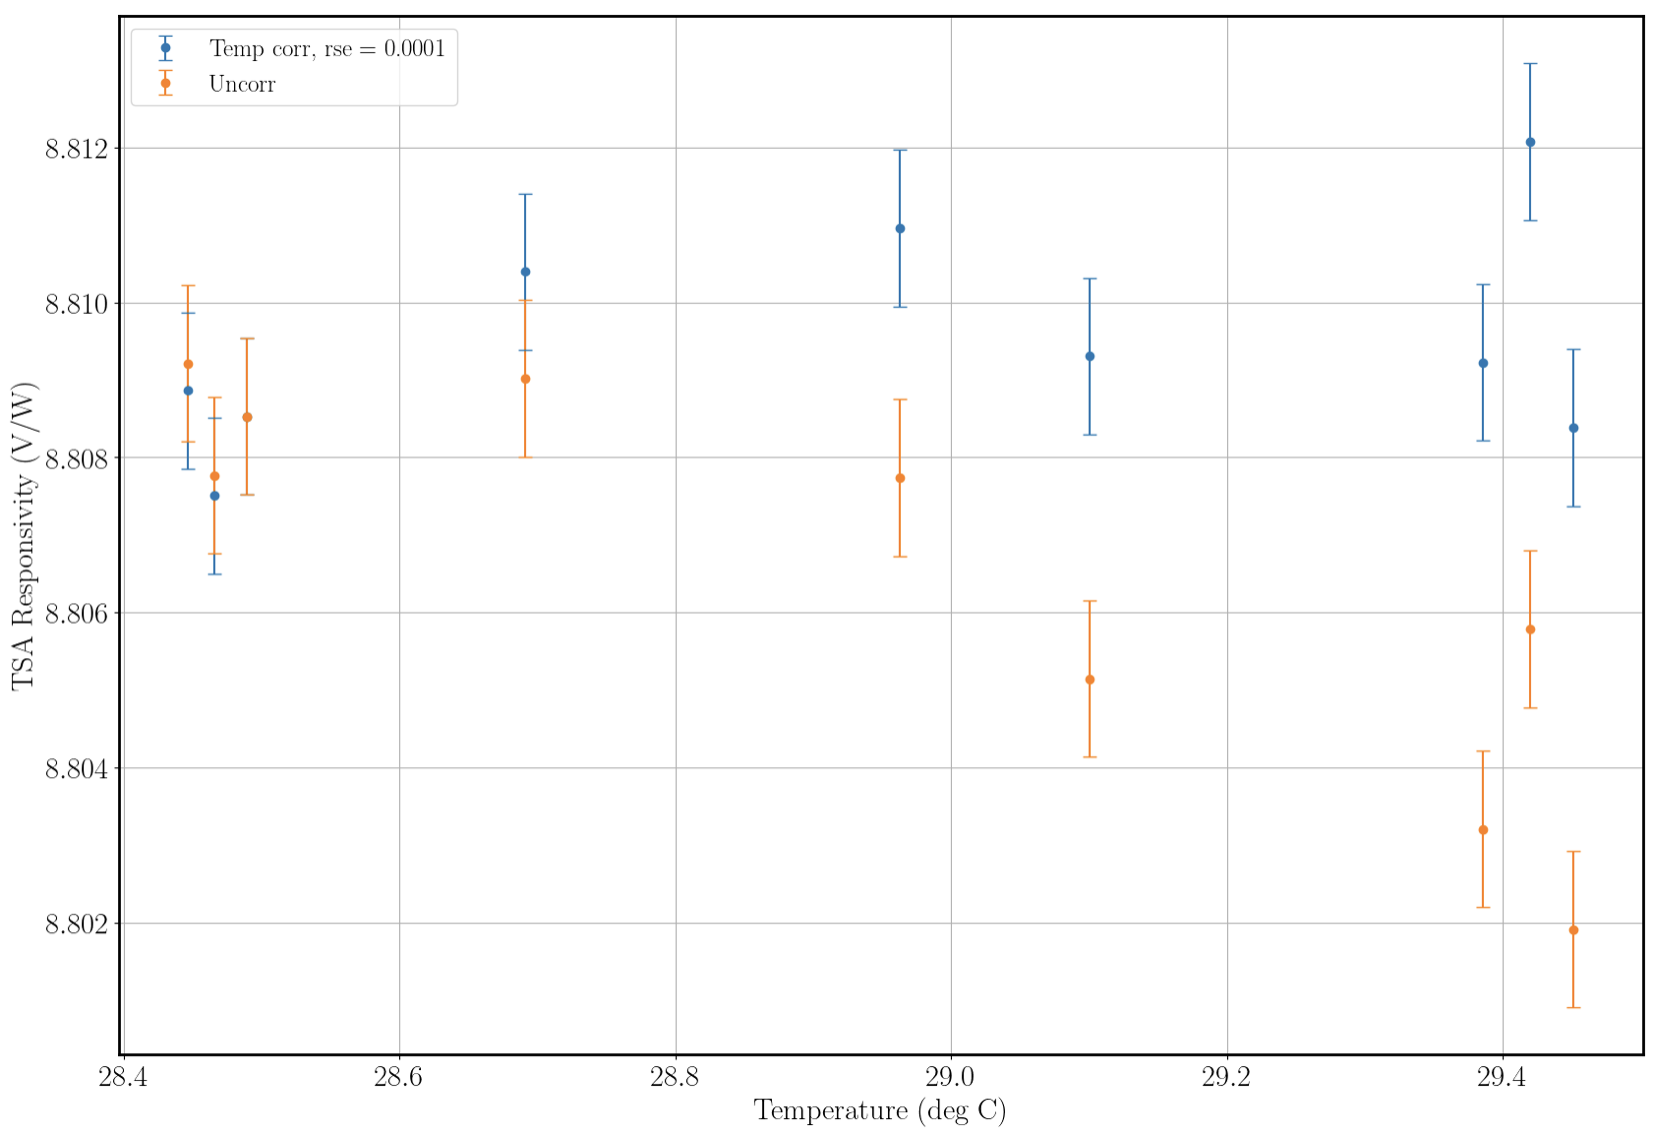
Rick and Dripta (Sudarshan remotely)

We measured the TSA/WSS responsivity ratio over a couple of weeks. We tracked the Pcal lab temperature and the temperature reported by AD590 to implement corrections due to temperature dependence of the power standards to the raw responsivity ratios.

The data can be found in https://svn.ligo.caltech.edu/svn/aligocalibration/trunk/Projects/PhotonCalibrator/measurements/LabData/TSA_WSS

A composite TSA/WSS analysis reports for all the measurements is attached (TSA_WSS.pdf).

The first two measurements (on 22-09-2021 and  18-10-2021) have been ignored in the trends plot (1st attachment) because those were taken at a time when the power sensors might have been insulated. The measurement on 22-09-2021 also shows a trend. So we decided to ignore those two measurements.

In the trends plot the orange data points are the raw responsivity ratio measurements and the blue data points are the temperature corrected data. The responsivity ratio has been corrected for the temperature dependence of the power standards according to the following equation:

resp_ratios_corr = resp_ratios*(1 + TSA_kappa*(T_f - d1_tempv2))/(1+WSS_kappa*(T_f - d2_tempv2)).

For each measurement, resp_ratios are read from the csv files generated when the lab data is analysed and is a vector of 100 data points, d1_tempv2 = d1_temp - 7.7 (temperature offset of the recorded by the TSA AD590 from the lab temperature) and d2_tempv2 = d2_temp - 6.2 (temperature offset of the recorded by the WSS AD590 from the lab temperature). d1_temp and d2_temp are read from the csv files. The mean of resp_ratios_corr gives the temperature corrected responsivity ratio for one measurement. TSA_kappa = 0.000185 (from alog 60294) and WSS_kappa = 0.00096 (from bilateral comparison paper that can be found in: https://iopscience.iop.org/article/10.1088/1681-7575/ac1e03 )

To calculate TSA responsivity, we use WSS responsivity of 8.189 V/W.
WSS responsivity value as given by the consensus responsivity (CR) in the bilateral comparison paper.

TSA responsivity = (TSA/WSS responsivity ratio) * (WSS responsivity)

The TSA responsivity trends can be found in the 2nd attachment. Again orange data points are the raw responsivity ratio measurements and the blue data points are the temperature corrected data.

Finally TSA responsivity as a function of the temperature. As the temperature increases the amount by which the responsivity is corrected also increases, which is expected. The responsivity of the power standard, in this case TSA, depends on temperature according to the equation:

resp_corr = resp_0*(1 + TSA_kappa*(T_f - T_0)); where resp_0 is the TSA responsivity measured at temperature T_0.

Note the last four data points in the trends plots were taken when the laser beam was being moved around by a couple of millimetres. It seems that moving the beam around doesn't affect the responsivity ratios.
Images attached to this report
Non-image files attached to this report
