In brief, looking at the bicoherence of DARM with itself, there is evidence that broadband noise in the 10 to 50 Hz region is non-stationary and modulated at about 2.6 Hz, and at 13.2 Hz.
The analysis is performed by computing the bicoherence of DARM with itself. In the case of a quadratic process generating noise in DARM, frequencies can be mixed, meaning that the signals at frequencies f_1 and f_2 can be mixed to generate a signal at f_1 + f_2 and f_1 - f_2. The bicoherence is a way to look for phase coherence between pairs of frequencies f_1, f_2 and the product frequency f_1+f_2 (or f_1 - f_2 or the other combinations).
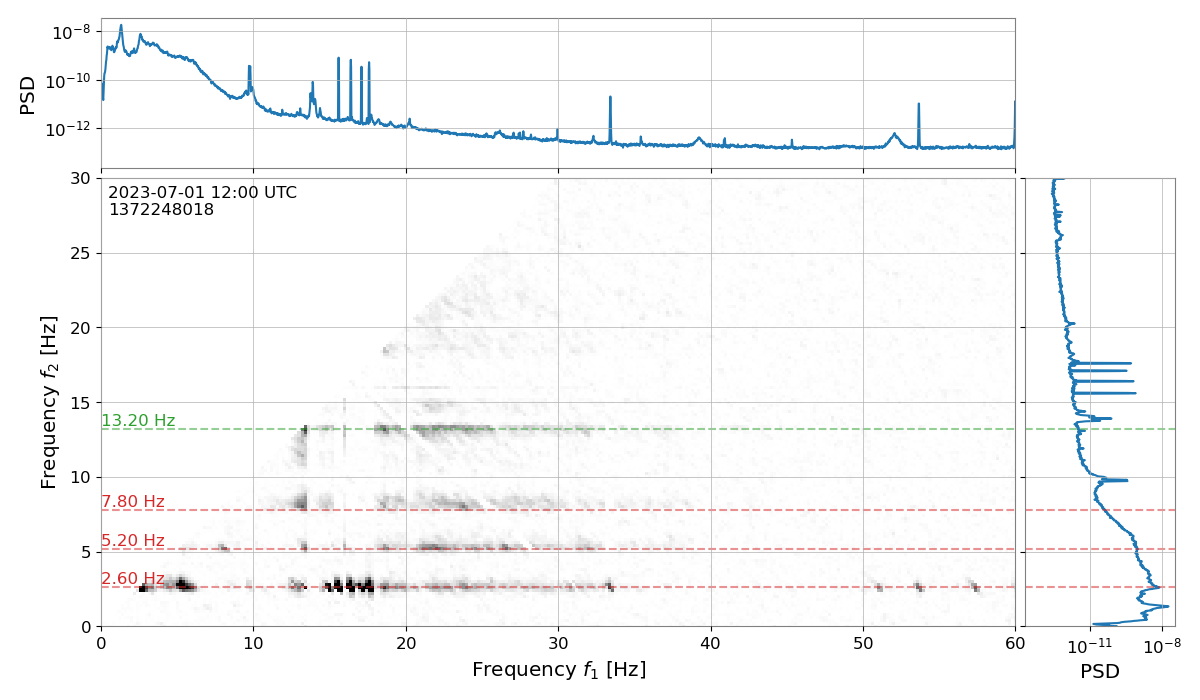
The usual linear coherence is a function of only one frequency. The bicoherence is instead a function of two frequencies f_1 and f_2. If the bicoherence of DARM with itself at (f_1, f_2) is high, this is an indication that some quadratic process is mixing the frequencies and generating noise at f_1+f_2.
The attached plot shows the bicoherence of DARM with itself, using one hour of data. Several different times have been used, with consistent results. The bicoherence plot shows three interesting features:
- a broadband feature with "high" bicoherence that shows correlation of boardband noise between 10 and 40 Hz with a 2.6 Hz peak visible in DARM (and the first two or three harmonics). This indicates that the DARM noise in the 10-40 Hz region is modulated at 2.6 Hz. More below on what could be the origing of this 2.6 Hz peak visible in DARM (and in many many other channels)
- another broadband feature, again in the low frequency region (20-50 Hz) that has elevated bicoherence with a 13.2 Hz frequency. It's not clear what is the origin of this 13.2 Hz modulation, or whether this is related to the bumps at multiples of 13 Hz reported elsewhere (those are at 13.1 Hz which is probably different from what we see here).
- calibration lines show also bicoherence with the 2.6 Hz peak, and this is enough to explain the bumps just above the calibration lines, that appear to be spaced from the lines by 2.6 Hz
The attached plot shows the bicoherence in the (f_1+f_2, f_2) plane. Therefore the x axis shows the "target" frequency where the quadratic noise ends up in DARM, and the y axis shows the modulation origin. The full bicoherence plot is typically plotted in the (f_1, f_2) plane and spans positive and negative frequencies. I show here only part of the plane, since the rest contains the same information. The bicoherence plot on the full plane has a lot of symmetries.
I'm convinced this is a real evidence of quadratic noise coupling, since the bicoherence pattern is repeatible for several different times in the past few days. I also did some numerical experiments to confirm that the results is not likely to be due to an artifact, but it is very likely to be due to modulated noise. More details in the attached PDF file.
What is the origin of the 2.6 Hz peak in DARM?
I don't have conclusive evidence yet, but a 2.6 Hz peak coherent with DARM is visible in many signals. A full list is attached, in alphabetical order. The peak is visible
- in all DARM related signals as expected
- in many angular signals: CHARD, CSOFT, INP1, MICH, PRC1, PRC2, SRC2, many of the DC centering loops
- ETMX M0 and R0 signals. Looking at M0_L and R0_L, the 2.6 Hz peak has a ratio of almost exactly -1. I'm not sure about the sign of the top stage OSEMs, this might mean that ETMX M0 and R0 are moving in opposite directions at 2.6 Hz
What's next?
I suggest we perform some noise injections at 2.6 Hz in the ASC loops and in the ETMX M0 vs R0 controls. If we can add a 2.6 Hz line that is just a bit larger than the current level in any of those signals, we might be able to see the DARM noise in the 10-50 Hz region increase. That could help us find the origin of the 2.6 Hz motion and possibly fix it.
More investigations are needed to find the origin of the 13.2 Hz modulation.