david.barker@LIGO.ORG - posted 10:10, Sunday 28 December 2025 (88662)
Sun CP1 Fill
Sun Dec 28 10:07:58 2025 INFO: Fill completed in 7min 55secs
Images attached to this report
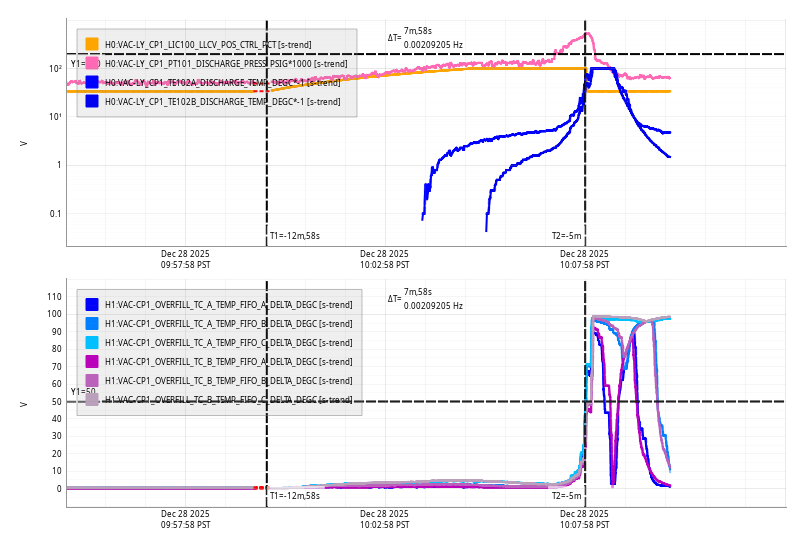
Sun Dec 28 10:07:58 2025 INFO: Fill completed in 7min 55secs
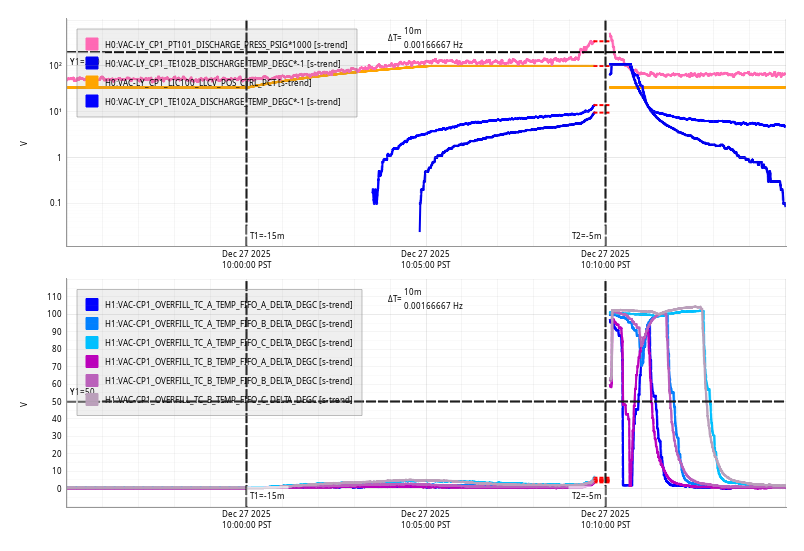
Sat Dec 27 10:10:00 2025 INFO: Fill completed in 9min 56secs
Utilizing the buddy system, (R. McCarthy) I walked the site today and found no immediate issues. The first half of x2 is a barely passable but am working with VAC to determine the next delivery location. To that end, all CP access points are largely unobstructed. The wind fence shows no additional damage at EY, and EX is still intact. FAC systems are operating normally. Large heat load spaces felt cool, no doors were found ajar and the water system is behaving normally (presently full @ ~66.5"). VEA's were all business as usual.

During the visit I noted a magmeter flow value of 1010675 which should serve as a useful metric in determining any leak/bleeding of the potable system. While at the water room, domestic supply pressure appeared to be holding well. A follow up on the morning of 1/5 will be performed to understand usage over the break while little to no demand is applied.

T. Guidry
TITLE: 12/26 Day Shift: 1530-0030 UTC (0730-1630 PST), all times posted in UTC
STATE of H1: Planned Engineering
OUTGOING OPERATOR: None
CURRENT ENVIRONMENT:
SEI_ENV state: MAINTENANCE
Wind: 25mph Gusts, 16mph 3min avg
Primary useism: 0.05 μm/s
Secondary useism: 0.90 μm/s
QUICK SUMMARY:
Cameras:
Everything looks fine currently.
Lights were left on in the Woodshop & OSB 163, ifsomeone is heading to site.
SEI: Looks as I'd expect it to look. HAM7 is red because it's had people in and out of it since before the break. I imagine leaving that watchdog tripped is fine.
SUS: Seems to be looking reasonable as well considering the OPO and Jack work that was being done before break.
PSL Status:
Laser Status:
NPRO output power is 1.84W
AMP1 output power is 70.51W
AMP2 output power is 139.4W
NPRO watchdog is GREEN
AMP1 watchdog is GREEN
AMP2 watchdog is GREEN
PDWD watchdog is GREEN
PMC:
It has been locked 16 days, 17 hr 48 minutes
Reflected power = 25.41W
Transmitted power = 106.2W
PowerSum = 131.6W
FSS:
It has been locked for 2 days 23 hr and 15 min
TPD[V] = 0.5254V
ISS:
The diffracted power is around 3.7%
Last saturation event was 2 days 22 hours and 25 minutes ago
Possible Issues:
PMC reflected power is high
VEA Temps:


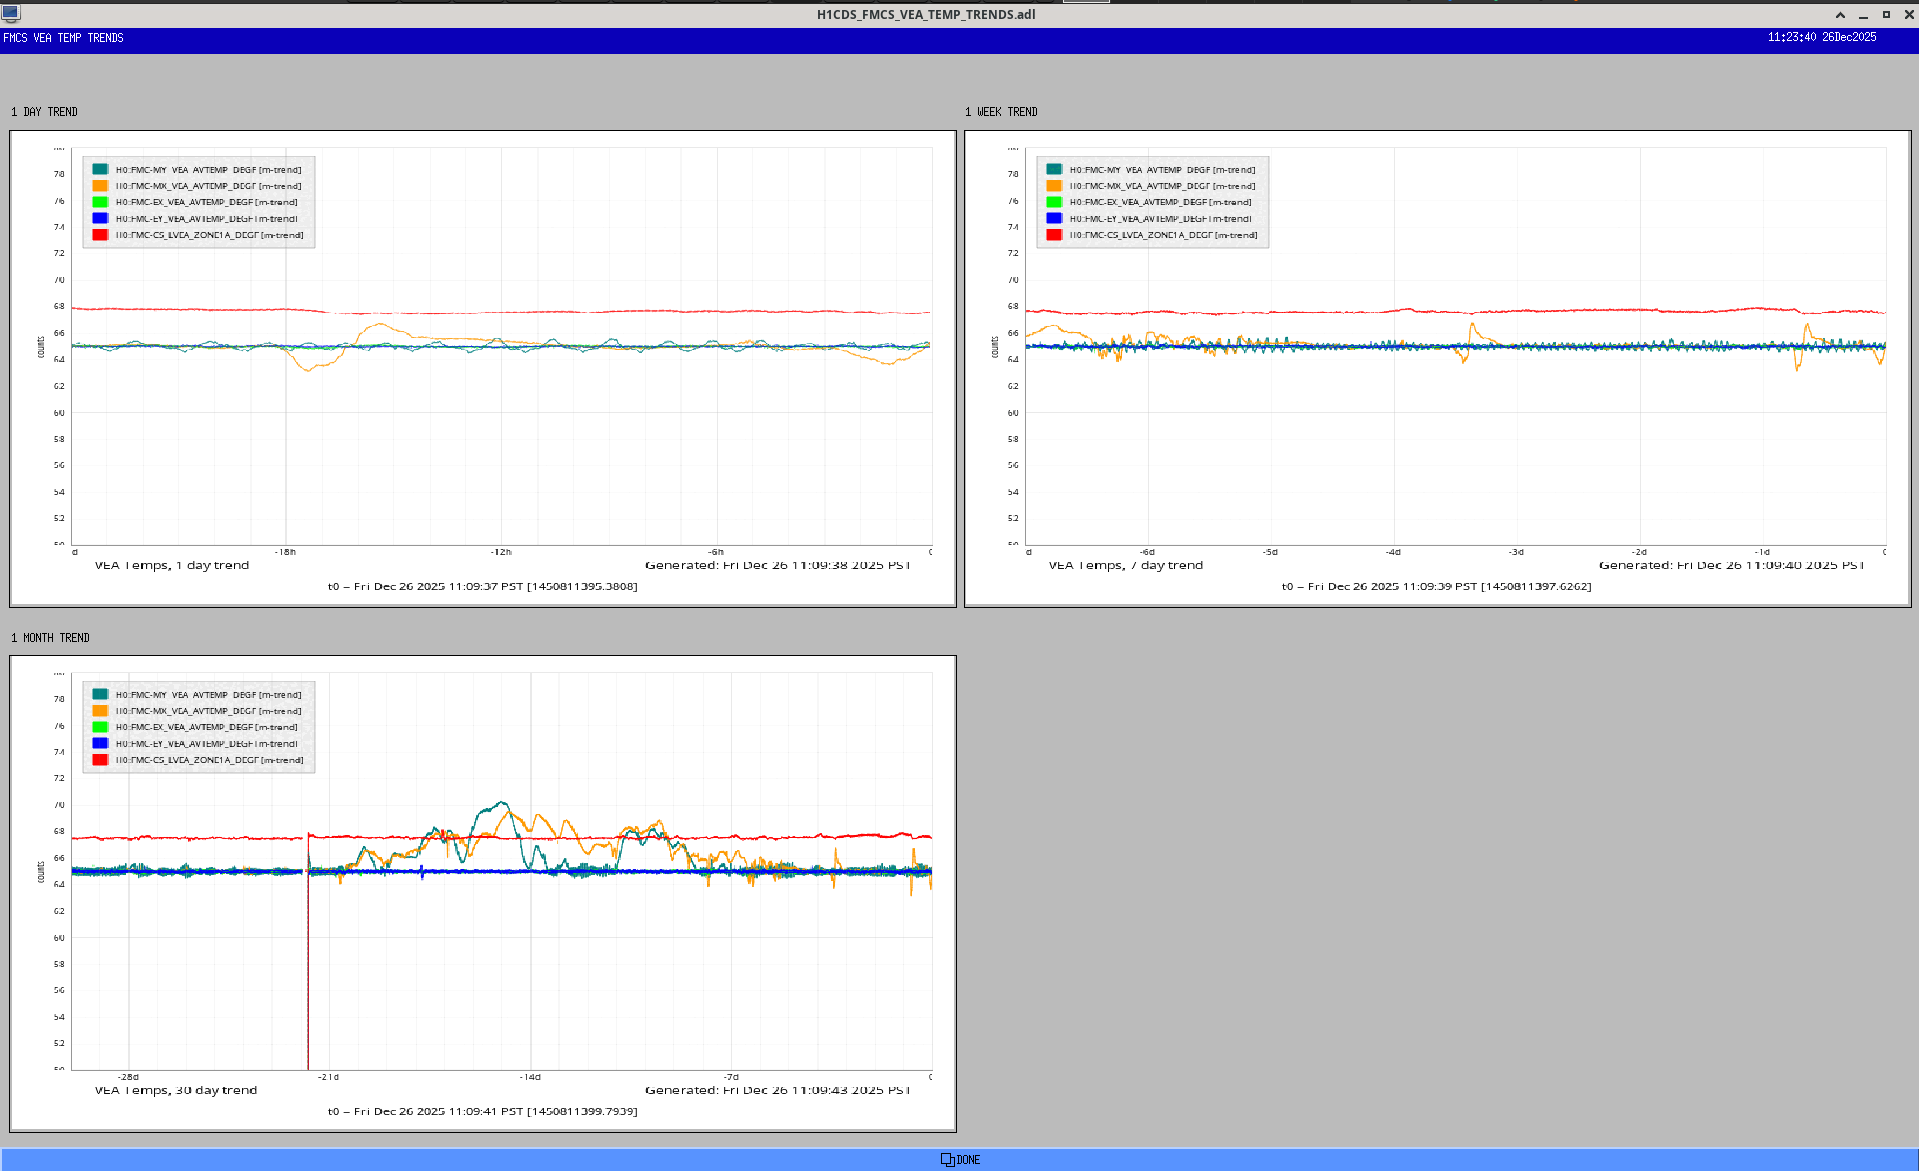
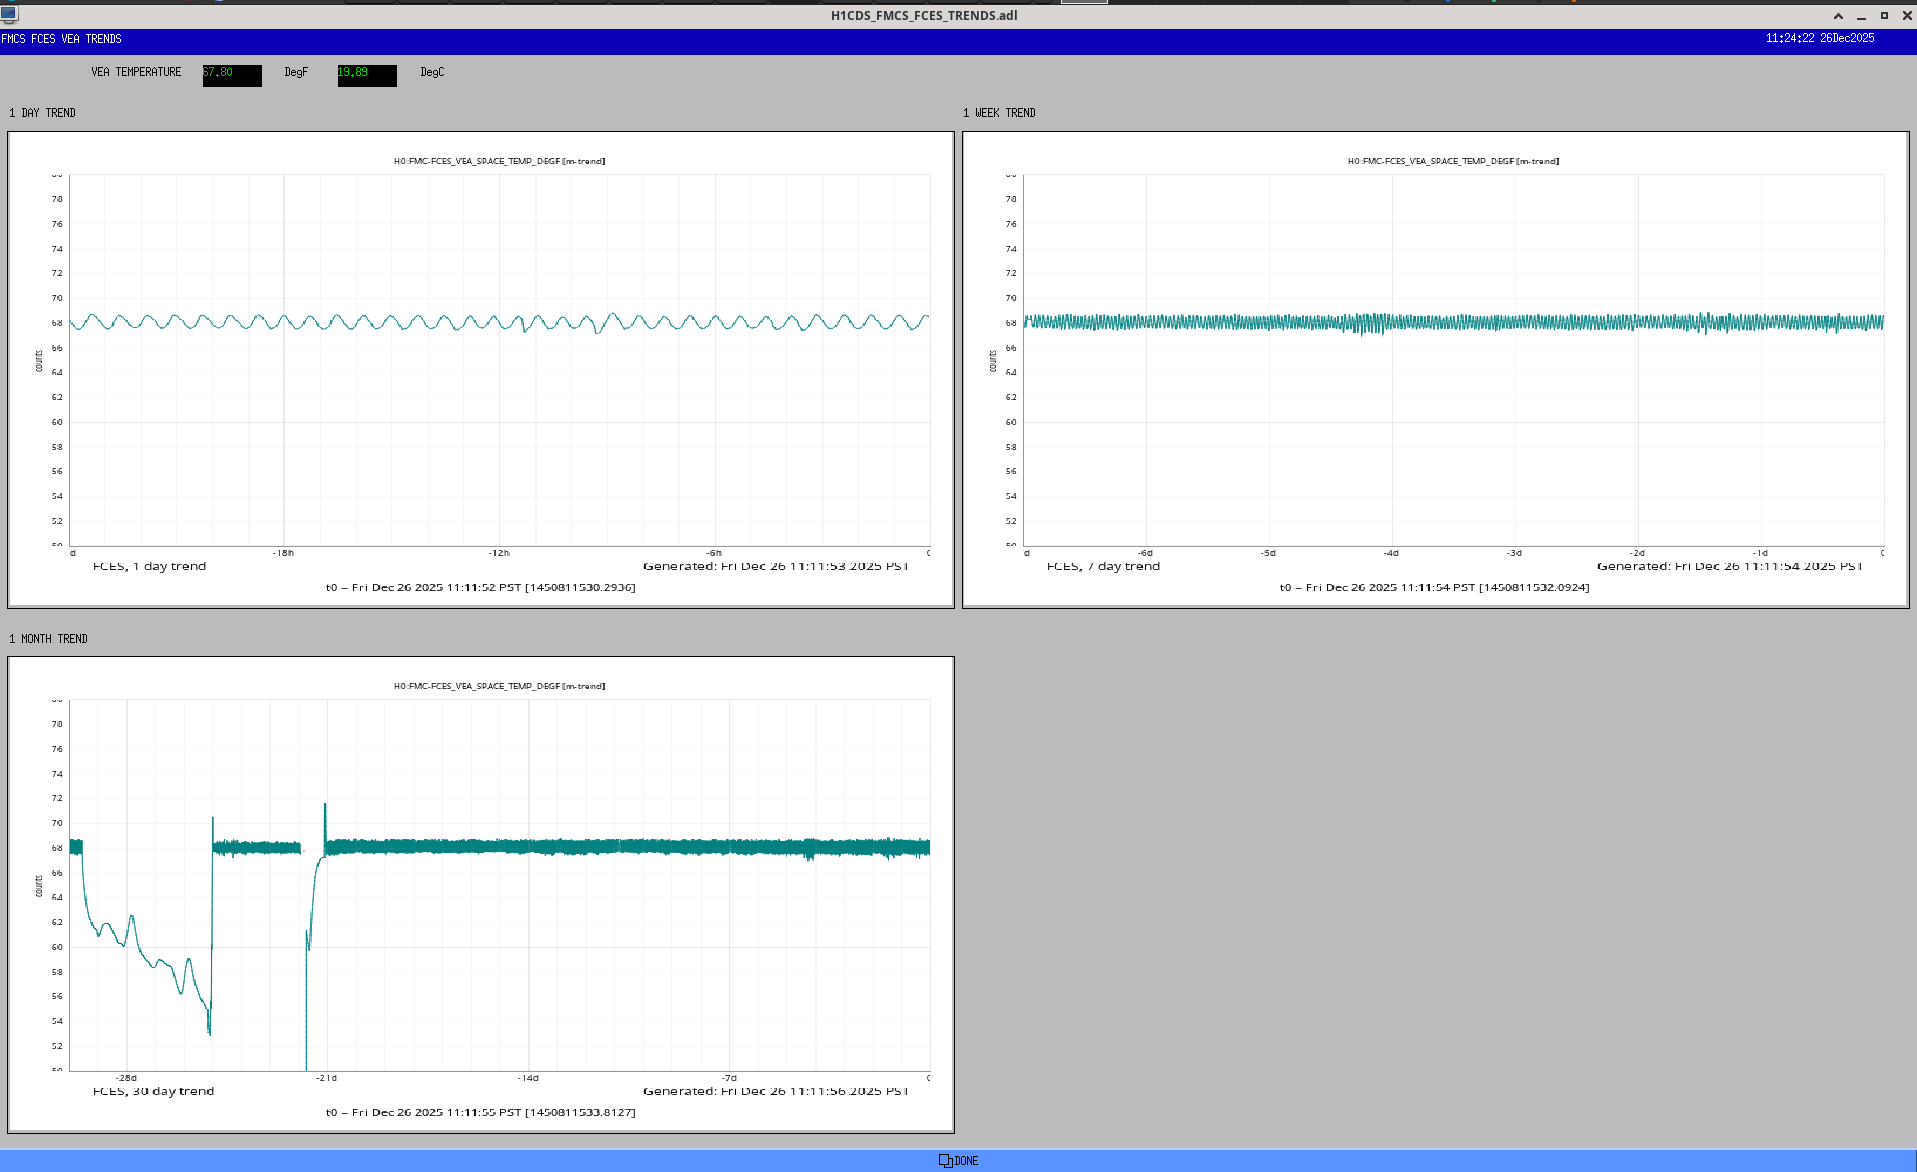
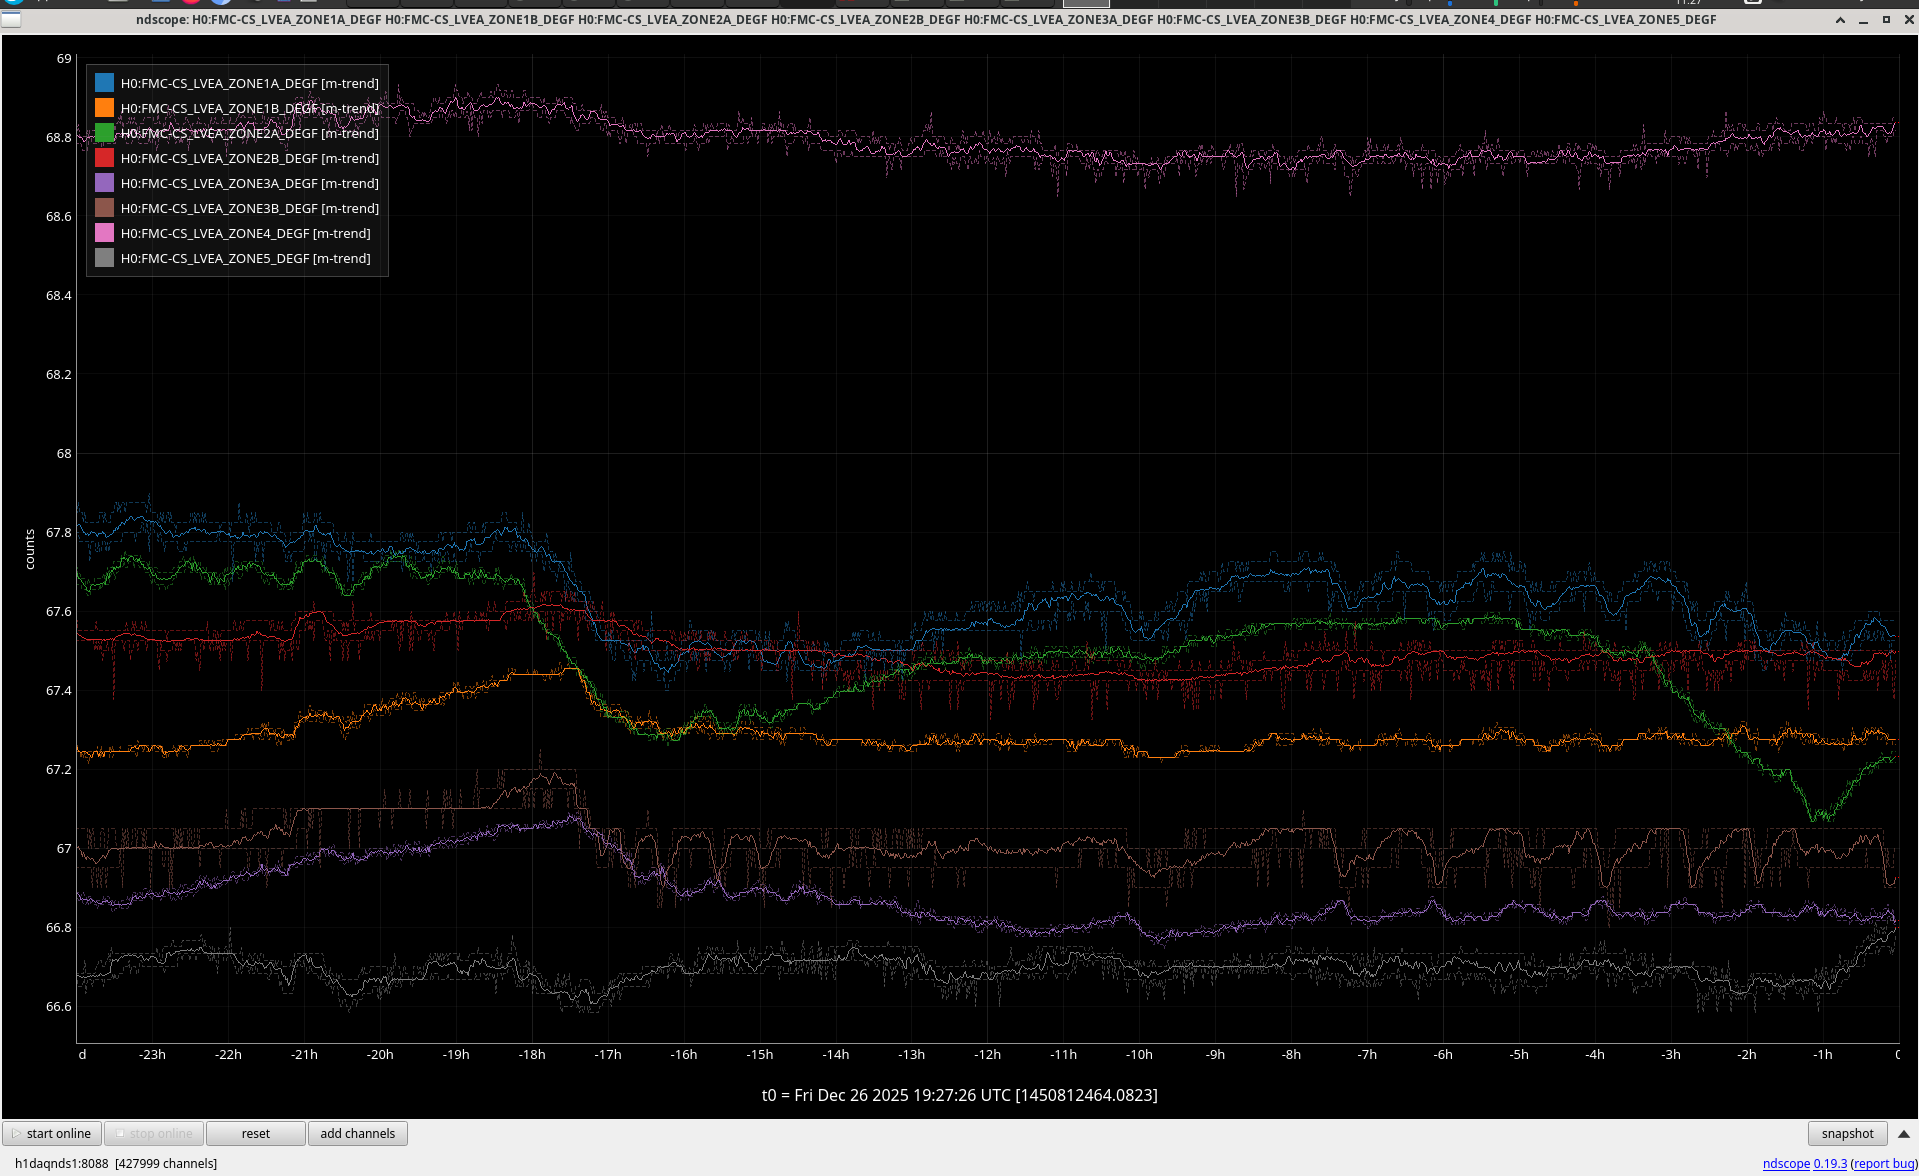
Everything looks as I'd expect it to look, no issues to be seen.
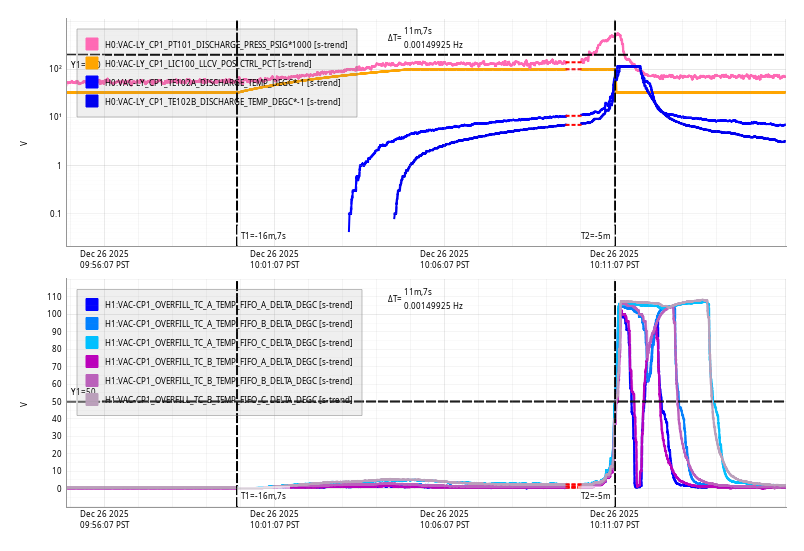
Fri Dec 26 10:11:07 2025 INFO: Fill completed in 11min 3secs
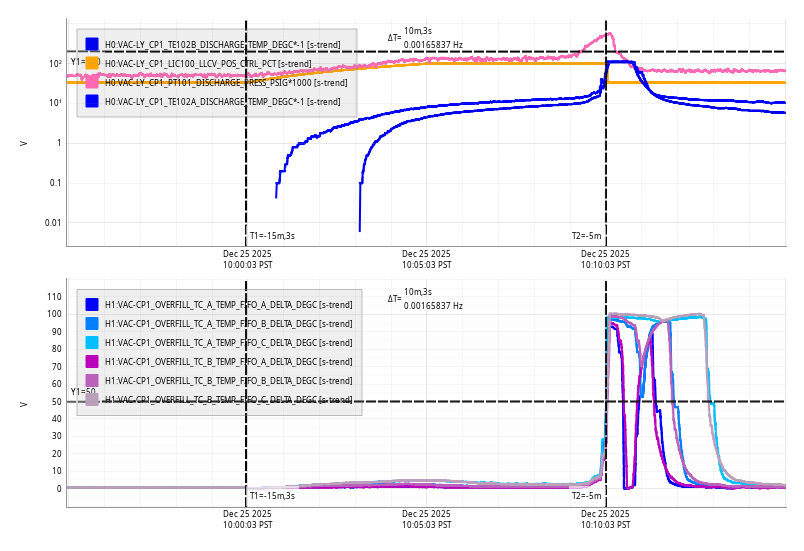
Thu Dec 25 10:10:03 2025 INFO: Fill completed in 10min 0secs
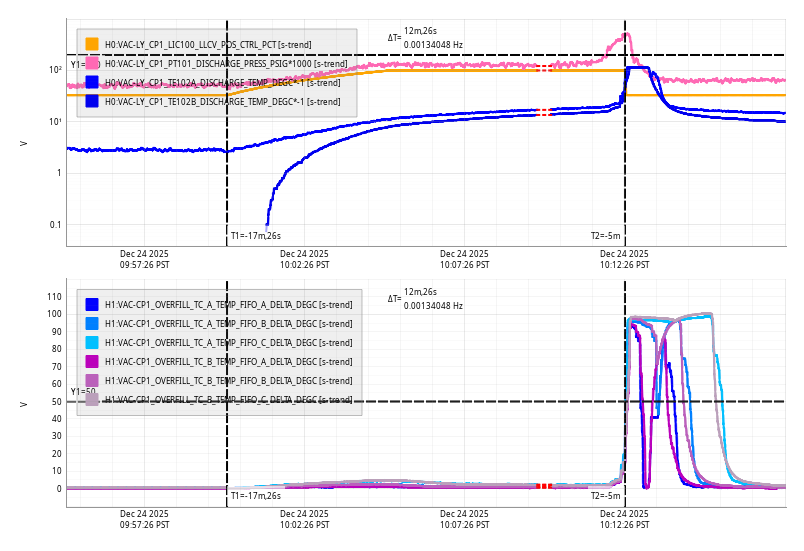
Wed Dec 24 10:12:26 2025 INFO: Fill completed in 12min 22secs
TITLE: 12/23 Day Shift: 1530-0030 UTC (0730-1630 PST), all times posted in UTC
STATE of H1: Planned Engineering
INCOMING OPERATOR: None
SHIFT SUMMARY: A fittingly quiet day today. HAM7 alignment work wrapped up this morning, so I transitioned the LVEA to Upgrade Phase Laser SAFE for the break. The stair move from EY has been postponed to the new year due to high tumbleweed interference. Control room workstations (with the exception of operator and VAC stations) and wall FOMs (with the exception of CDS, VAC, and temperature monitors) have all been shut down.
LOG:
| Start Time | System | Name | Location | Lazer_Haz | Task | Time End |
|---|---|---|---|---|---|---|
| 15:57 | SAF | LASER SAFE | LVEA | NO | LVEA is Upgrade Phase Laser SAFE | Ongoing |
| 16:17 | FAC | Kim, Nellie | LVEA | - | Technical cleaning | 16:53 |
| 17:19 | SQZ | Sheila, Kar Meng | LVEA | YES | HAM7 beam alignment | 19:57 |
| 18:37 | SAF | Travis | EX | N | Updating laser signs | 19:00 |
| 19:57 | SAF | RyanS | LVEA | YES | Transition to Laser SAFE | 20:13 |
| 21:07 | VAC | Travis | LVEA | N | VAC walkthrough | 21:44 |
| 22:07 | TCS | RyanS | MER | N | Checking TCS chillers | 22:20 |
EDC had lost connection to 156 nuc cds_load_mon channels after the shutdown. I am running a temporary IOC to serve these channels and "green up" the EDC.
nuc_dummy_ioc.py is being ran as david.barker in a tmux session called nuc_dummy_ioc on opslogin0.
The PSL PMC and RefCav have been slightly misaligned since the power outage, so today I took a bit of time to touch these up before the holiday break.
With the ISS off, I was able to only improve the PMC a bit, bringing PMC TRANS from 105.7W to 106.3W and PMC REFL from 25.5W to 25.2W. I then re-engaged the ISS and slightly adjusted the RefSignal to bring the diffracted power back to around 4%. Moving onto the RefCav, here I got somewhat better improvements, bringing the TPD signal up from 519mV to 530mV.
FAMIS 27619, last checked in alog88411
The script reports high frequency noise is elevated for ETMY_ST2_CPSINF_V2
Due to ongoing vent work (HAMs 1 and 7 are vented, HEPI for HAMs 1-4 are locked), trends may look slightly different than nominal.
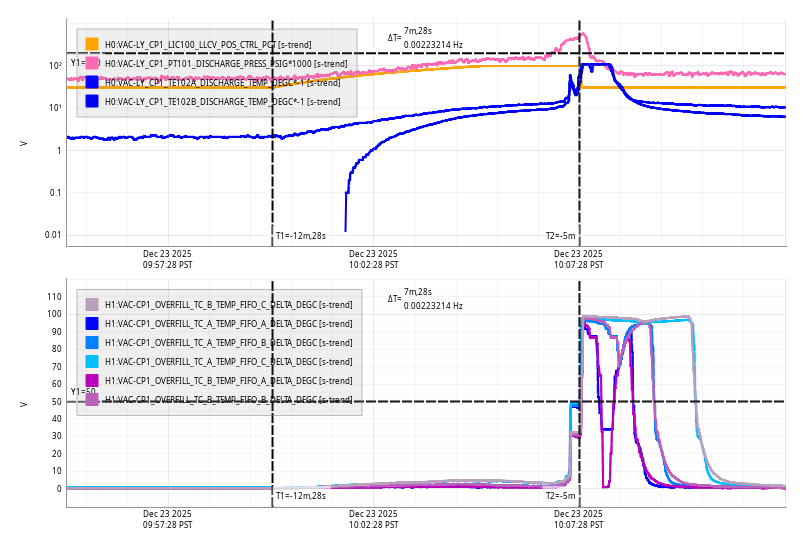
Tue Dec 23 10:07:28 2025 INFO: Fill completed in 7min 24secs
TITLE: 12/23 Day Shift: 1530-0030 UTC (0730-1630 PST), all times posted in UTC
STATE of H1: Planned Engineering
OUTGOING OPERATOR: None
CURRENT ENVIRONMENT:
SEI_ENV state: MAINTENANCE
Wind: 6mph Gusts, 4mph 3min avg
Primary useism: 0.01 μm/s
Secondary useism: 0.21 μm/s
QUICK SUMMARY: For the last shift of 2025, there's not too much slated for today; see below.
Mainly a note for myself as I kept getting the syntax wrong.
To generate a nice button that opens your control input/output matrix, use this script form Ryan, Jeff & co.
python3 /opt/rtcds/userapps/release/cds/common/scripts/generate_KisselButton2024.py --bw 10 --bh 10 --dl "OUTMTRX_Y" --sn "IMC_WFS_OUTMATRIX_Y" 5 5 "H1:IMC-OUTMATRIX_Y" > IMCJAC_OUTMATRIX_Y.adl
Here bw is button width, bh is button height, dl is the label for the button (OUTMTRX_Y), "IMC_WFS_OUTMATRIX_Y" is the name of the file opened by the button, "H1:IMC-OUTMATRIX_Y" is the channel name prefix of your matrix in the simulink model, and IMCJAC_OUTMATRIX_Y.adl is the file I saved my button in.
I set up medm screens for JAC ASC and LSC located at /opt/rtcds/userapps/release/ioo/common/medm.
The structure is sitemap > IOO > JAC Overview for the main screen.
The WFS control is at sitemap > IOO > JAC Overview > JAC ASC.
The length control filters are in sitemap > IOO > JAC Overview > L_SERVO.
I have also included links to the DC QPD alignment screens for JAC-WFS_A and B, and the JAC-REFL_A PD used for length sensing.
The screen also contains links to the screens for the JAC-TRANS_A PD, in-air picomotors, JM1 tip-tilt, PSL periscope PZT, JAC Heater and JAC PZT.
These latter readouts are all from ethercat.
We still need some kind of readout for the in-air trigger PD and a guardian script for control.
In the meantime I am working on changes to the IMC WFS medm screens for when we have JAC installed as we will need to use the new JM3 tip-tilt for feedback instead of the PSL periscope PZT.
This trial screen is saved as /opt/rtcds/userapps/release/ioo/common/medm/IMC_WFS_MASTER_JAC.adl.

Jennie W, Dave B,
Jeff and I put in a bypass in the h1ascimc model (see alog #88465) so we could put in the simulink infrastructure to switch between using the PSL periscope PZT as part of the IMC control or as part of the JAC control.
At the moment the switch 'H1:ASC-IMCJAC_PZTOUTSW' is set to ON which should let the IMC servo use the PZT.
However the logic I put in will not switch the feedback to take inputs from the JAC servo if I turn the switch off.
This is because Choice 2 and 3 in the picture are set to pass their first input if the switch output is '>= 0', so whichever state it is in the IMC PZT output will be sent to the DAC.
I have changed these choices to >0 so that the top input (IMC PZT output signal) will be sent to the DAC if the switch is 1 and the bottom input (JAC PZT output signal) will be sent to the periscope otherwise.
I committed the changed /opt/rtcds/userapps/release/asc/h1/models/h1ascimc.mdl to the svn.

I also added two cdsepicsOutput blocks (ASC-PSL_PZT_P and ASC-PSL_PZT_Y) before the DAC outputs going to the PZT to check what the model is sending to the PZT which will help us double check the switch between IMC and JAC signals works correctly.
See screenshot attached. I rebuilt h1ascimc.mdl and committed it to the svn at userapps/asc/h1/models.

Last week Phil gave me the old POP X IN-AIR WFS PD as our JAC WFS A PD had a wobbly pin on the Q3 LO output.
Masayuki had tried connecting to this with both cables we had.
When I tried plugging in the Q3/Q2 cable on the POP X WFS I realised that one of these cables itself will not seat on this connector properly. I tried with the other cable and this one connects to the Q3/Q2 output on POP X ok.
I will get together with Phil in the new year and investigate more.
Jennie W, TJ, Ryan C
Went into HAM1 and covered up everything that wasn't already covered (a single screw on the left-hand HEPI pier and some iris parts on the table).
Ryan C put extra clips on the C3 cover.
HAM1 should be all cosy for the holiday.
