TITLE: 10/19 Day Shift: 1430-2330 UTC (0730-1630 PST), all times posted in UTC
STATE of H1: Wind
INCOMING OPERATOR: Ryan S
SHIFT SUMMARY:
IFO is LOCKING at ACQUIRE_DRMI_1F
Bad day for the IFO due to the environment.
To start, the wind has not gone under 30Mph for the entire day, and has been over 35mph for the majority. It looks to be dying down now and will continue to do so this evening. Midshift report (alog 87565)
The microseism was sitting just at the 90th percentile point until 3 hrs ago when it started increasing.
We did get to NLN once but due to the known 1Hz CSOFT_P ringup (which previously was managed by increasing gain) but 4 minutes later, we had a Lockloss. (Lockloss alog 87571) This is an ongoing issue where it appears that long lock acquisitions experience the 1Hz ringup more violently than short acquisitions. Due to the microseism and wind, this has been the case for many of the recent locks. Ryan S has an alog about this correlation with a hunch that it is related to IFO thermalization (alog 87557)
In the next lock, since this is bound to happen again, we can either sit at MAX_POWER or increase the gain further (from 25 to 30) and see if either works. The former would test out the hypothesis in Ryan S's alog and the latter would just up the fix from before.
14:30 UTC - shift start
14:54 UTC - TRANSITION_FROM_ETMX Lockloss
16:42 UTC - Initial Alignment - Fully Auto
17:12 UTC - IFO in IDLE due to WIND
18:36 - Lock Acquisition Attempt
19:35 - Succesful Lock Start
20:24 - NLN Reached (under 1 hr, fully auto)
20:28 - Lockloss due to 1Hz Ringup
22:07 UTC - IFO in IDLE due to MICROSEISM
22:54 UTC - Lock Acquisition Attempt
23:30 UTC - in DRMI, end of shift
LOG:
None
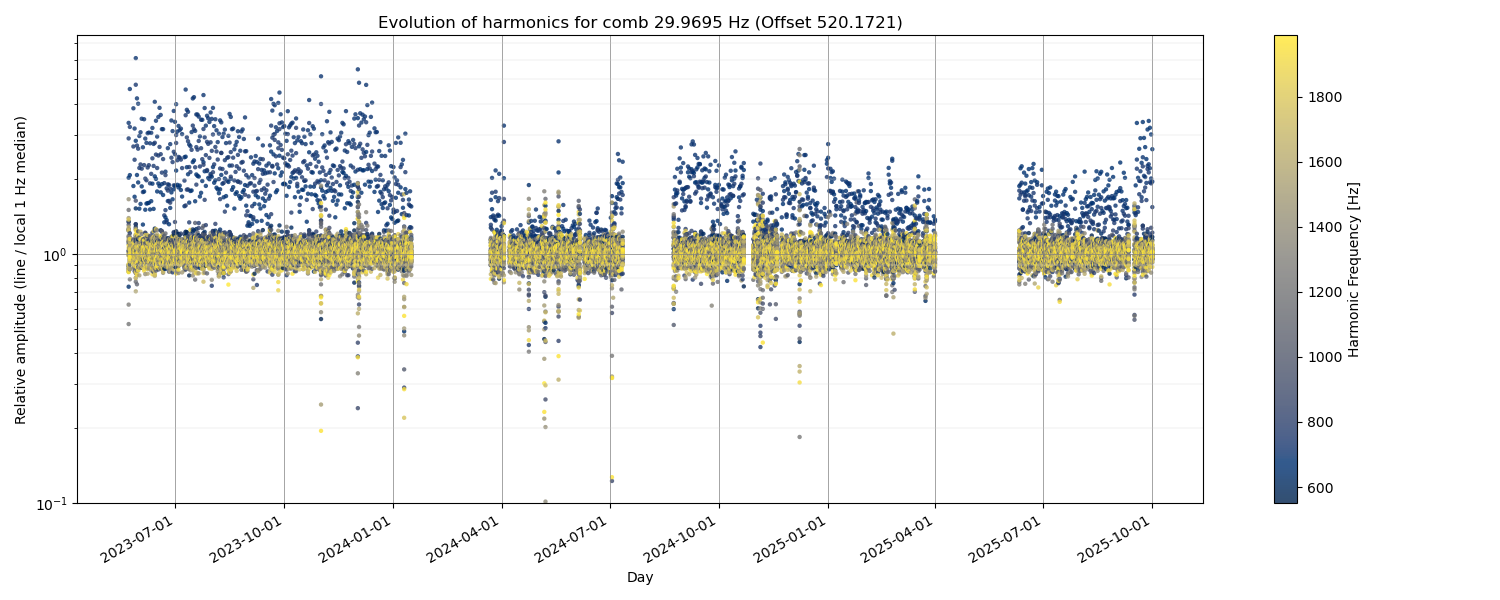
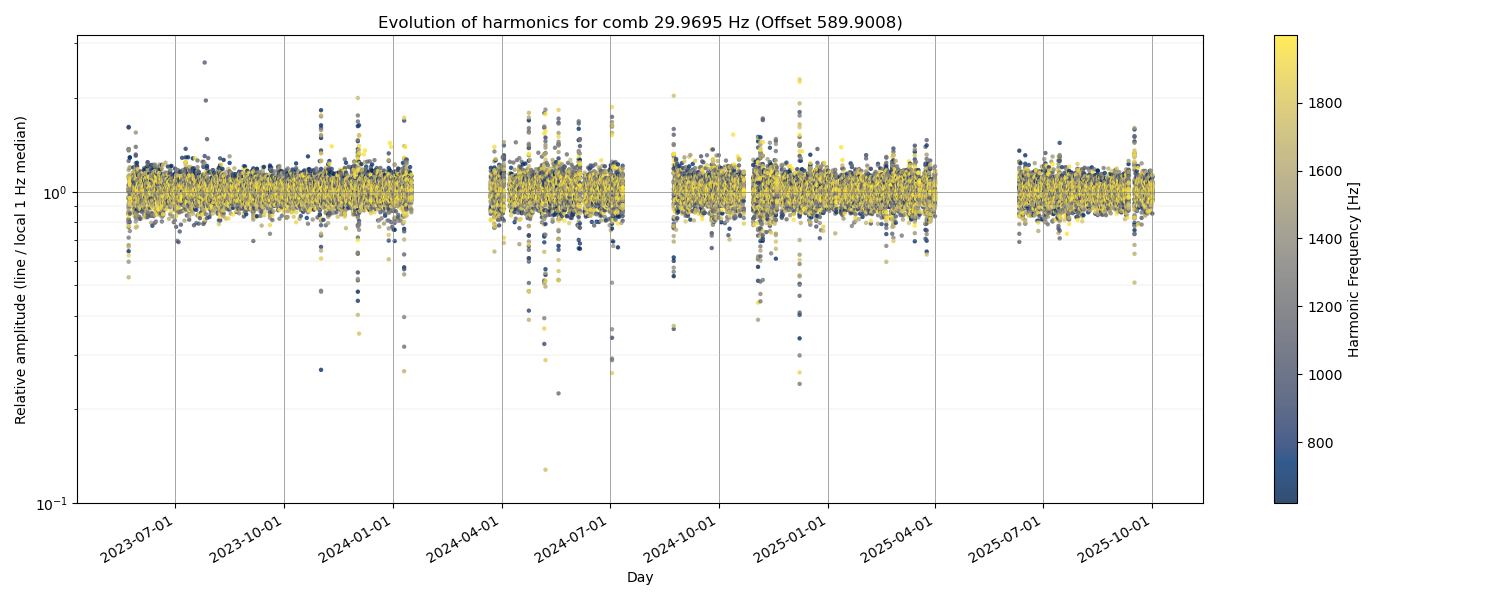
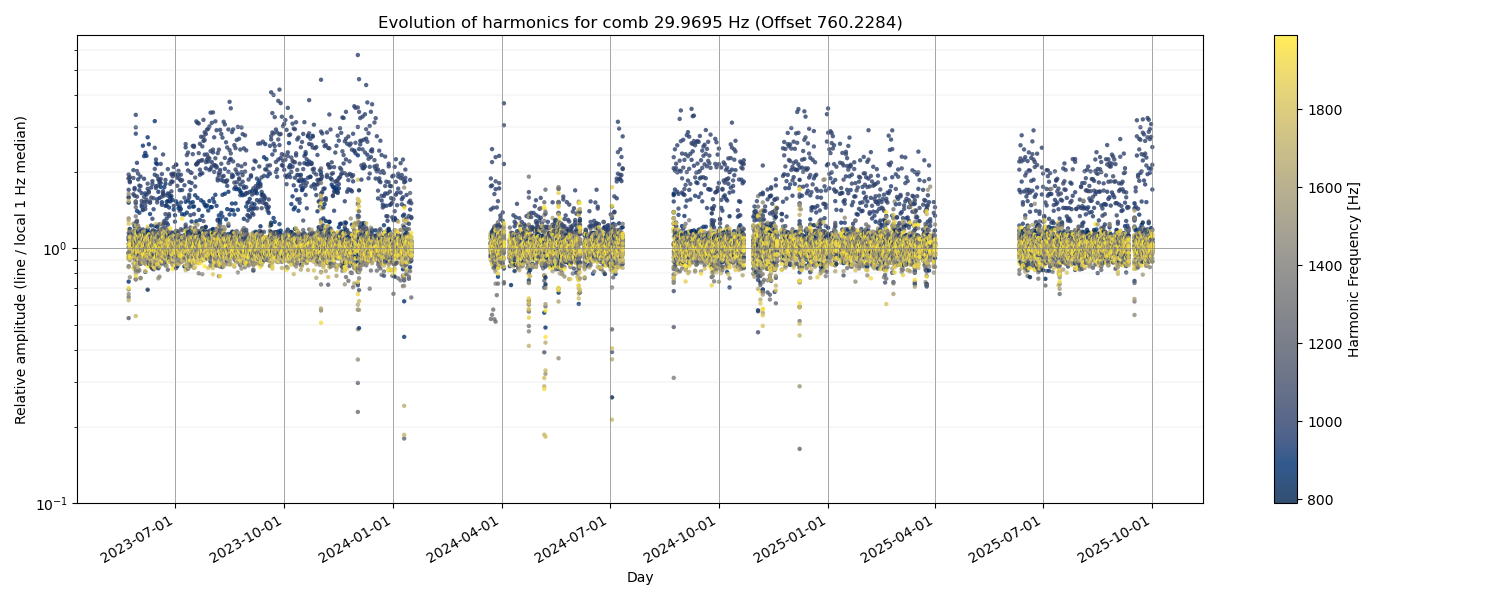
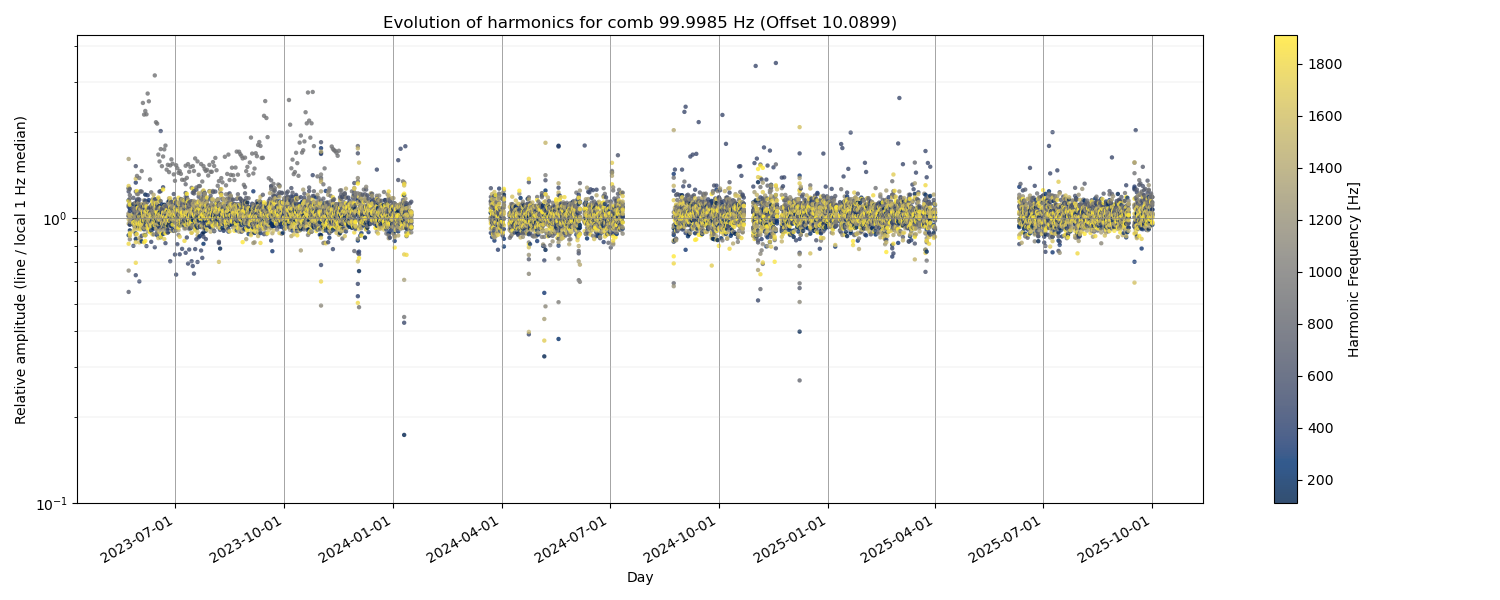
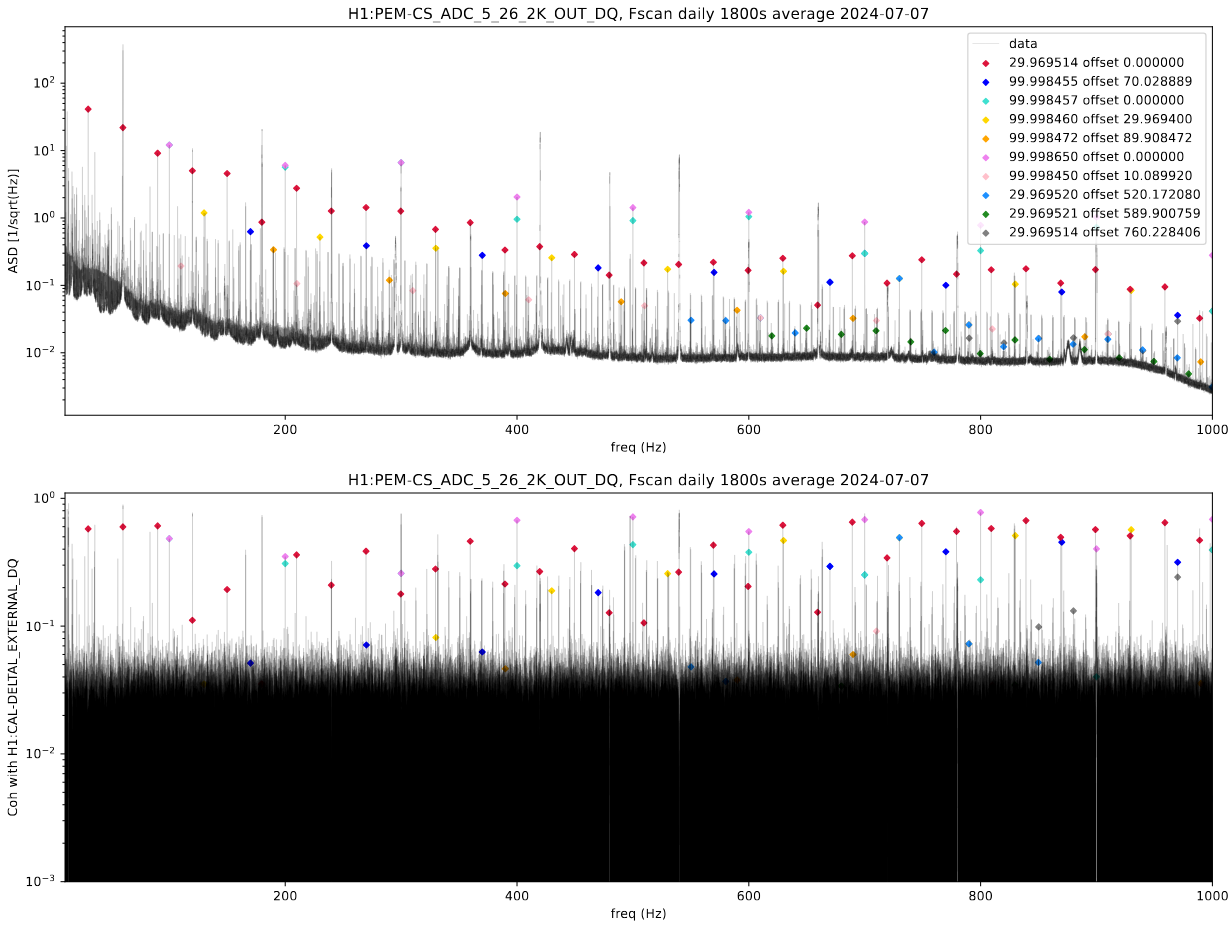
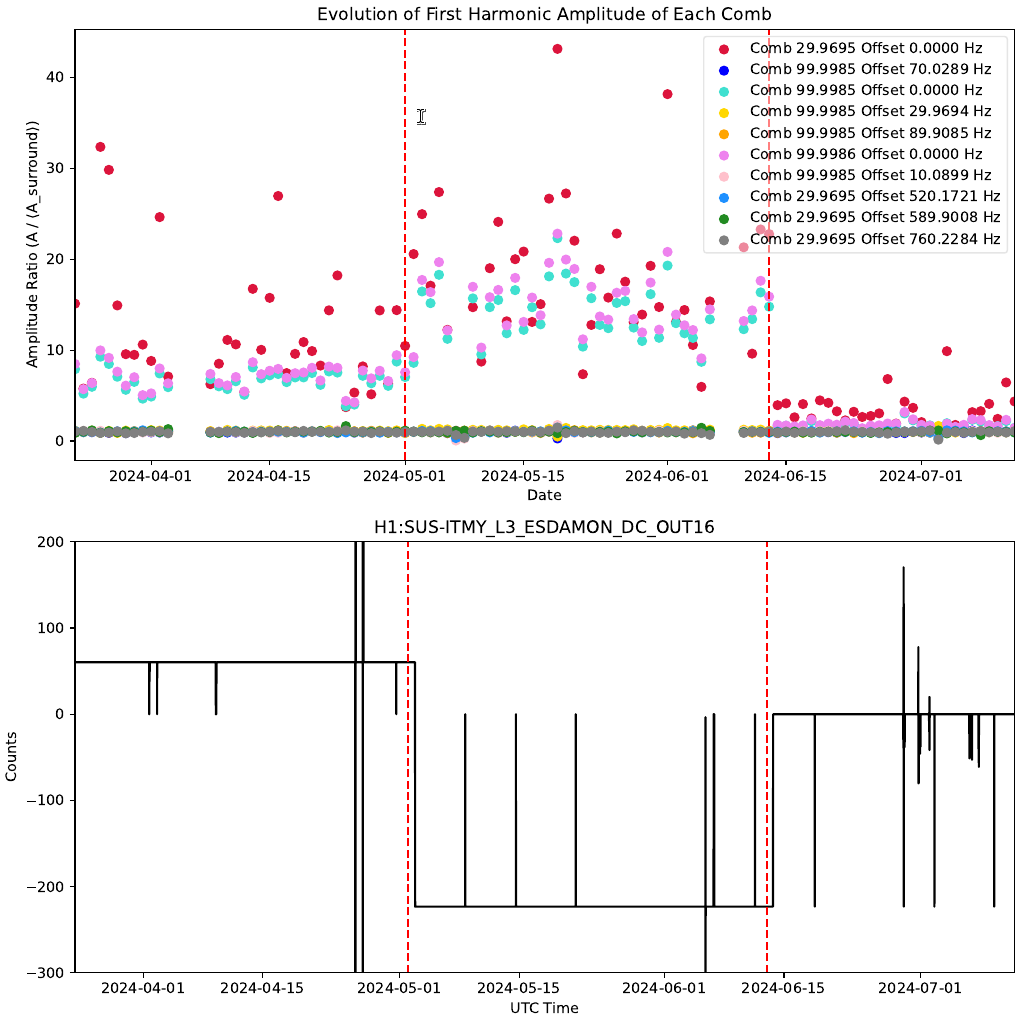
 We list here the channels that do show most of these Combs. These same channels do show changes in coherence between July 1st and July 7th 2024, but do not show changes in the amplitude of the combs.
- H1_IMC-F_OUT_DQ
- H1_LSC-MCL_IN1_DQ
- H1_LSC-MICH_IN1_DQ
- H1_LSC-SRCL_IN1_DQ
- H1_PEM-CS_MAG_EBAY_LSCRACK_X_DQ
- H1_PEM-CS_MAG_EBAY_LSCRACK_Y_DQ
- H1_PEM-CS_MAG_EBAY_LSCRACK_Z_DQ
- H1_PEM-CS_MAG_LVEA_INPUTOPTICS_X_DQ
- H1_PEM-CS_MAG_LVEA_INPUTOPTICS_Y_DQ
- H1_PEM-CS_MAG_LVEA_INPUTOPTICS_Z_DQ
In most channels, the comb amplitude tends to get quite low after ~1500 Hz. The following sets of channels show differences between X, Y and Z:
- H1_PEM-CS_MAG_EBAY_SUSRACK_X_DQ (Higher amplitudes and towards higher frequencies)
- H1_PEM-CS_MAG_EBAY_SUSRACK_Y_DQ (Lower comb amplitudes)
- H1_PEM-CS_MAG_EBAY_SUSRACK_Y_DQ (Lower comb amplitudes)
Regarding CS_MAG_LVEA_OUTPUTOPTICS, these combs can be seen best in X, weaker in Y and almost non-existent in Z. (In CS_MAG_LVEA_INPUTOPTICS they look roughly the same height)
- H1_PEM-CS_MAG_LVEA_OUTPUTOPTICS_X_DQ (Strongest)
- H1_PEM-CS_MAG_LVEA_OUTPUTOPTICS_Y_DQ (Weaker lines)
- H1_PEM-CS_MAG_LVEA_OUTPUTOPTICS_Z_DQ (Almost no lines)
Same behavior at:
- H1_PEM-CS_MAG_LVEA_VERTEX_X_DQ (Strongest lines)
- H1_PEM-CS_MAG_LVEA_VERTEX_Y_DQ (Weaker lines)
- H1_PEM-CS_MAG_LVEA_VERTEX_Z_DQ (Almost no lines)
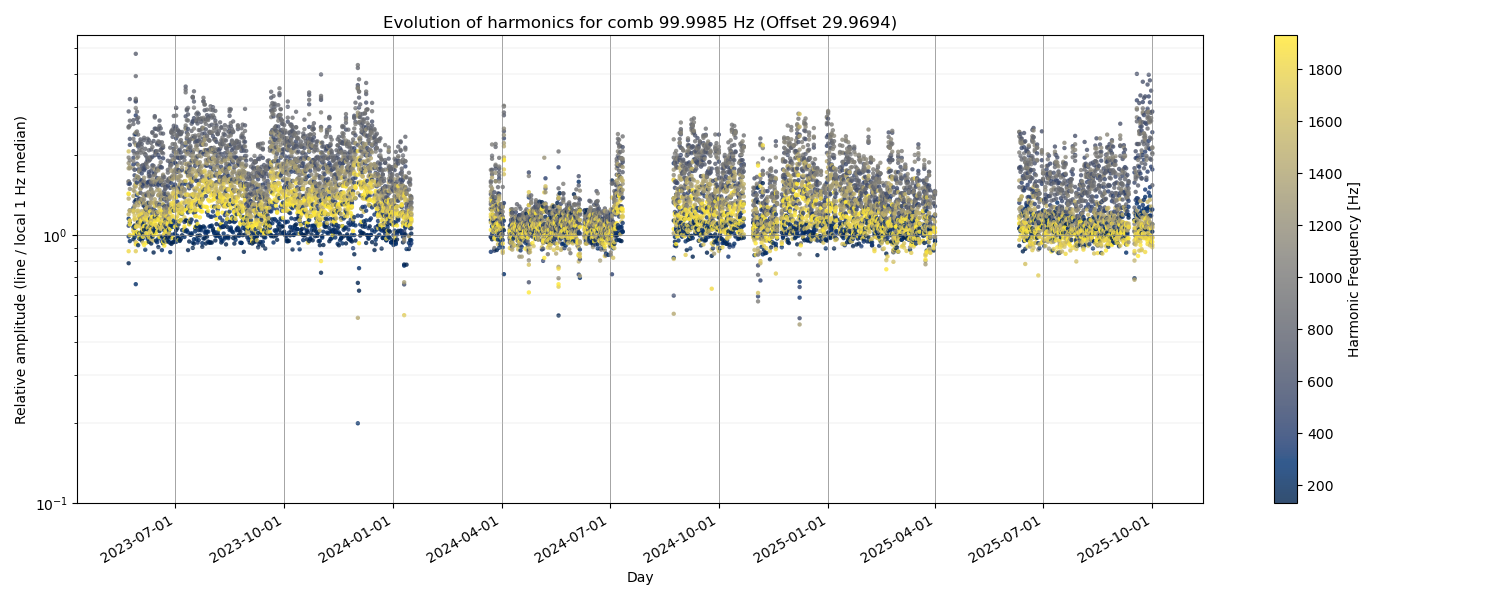
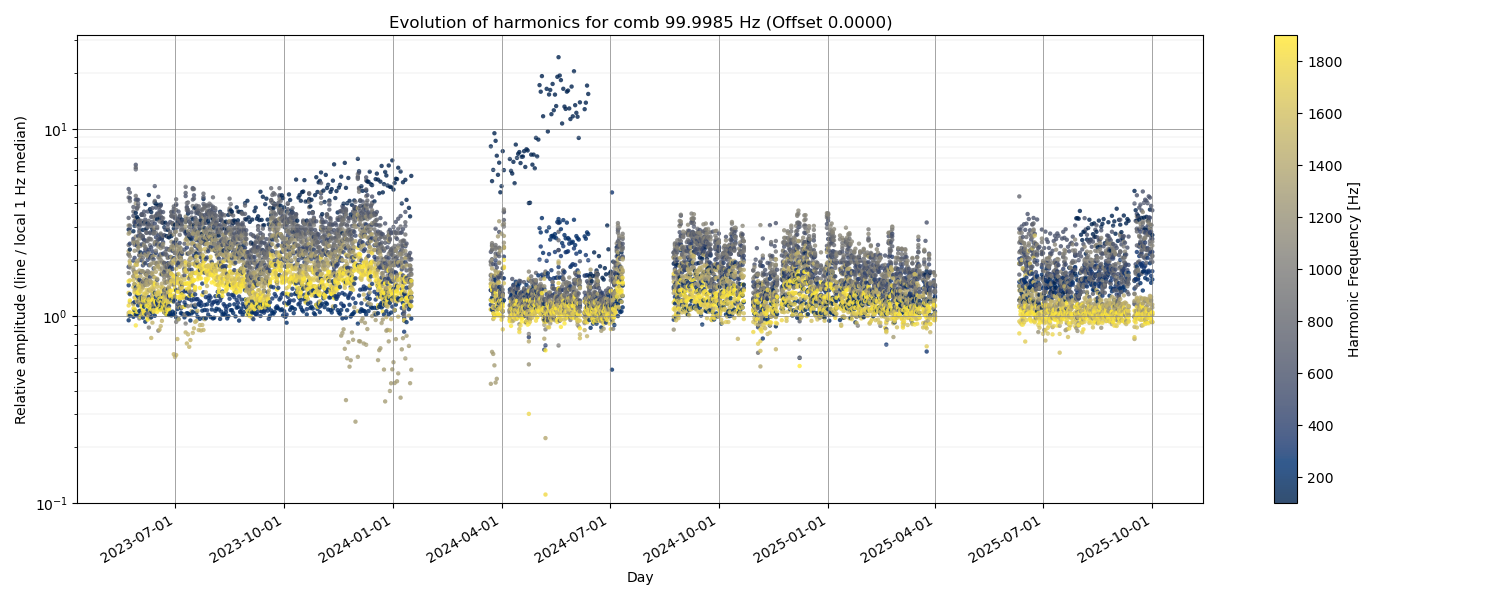
We can see that these combs mostly appear in the corner station. The combs do not appear in neither EX nor EY channels. However, comb 99.99865 Hz offset 0.000 appears in many EX, EY channels and does become more coherent after July 7th. However, it is very close to 100 Hz so it may be influenced by other round-number combs (?)
We list here the channels that do show most of these Combs. These same channels do show changes in coherence between July 1st and July 7th 2024, but do not show changes in the amplitude of the combs.
- H1_IMC-F_OUT_DQ
- H1_LSC-MCL_IN1_DQ
- H1_LSC-MICH_IN1_DQ
- H1_LSC-SRCL_IN1_DQ
- H1_PEM-CS_MAG_EBAY_LSCRACK_X_DQ
- H1_PEM-CS_MAG_EBAY_LSCRACK_Y_DQ
- H1_PEM-CS_MAG_EBAY_LSCRACK_Z_DQ
- H1_PEM-CS_MAG_LVEA_INPUTOPTICS_X_DQ
- H1_PEM-CS_MAG_LVEA_INPUTOPTICS_Y_DQ
- H1_PEM-CS_MAG_LVEA_INPUTOPTICS_Z_DQ
In most channels, the comb amplitude tends to get quite low after ~1500 Hz. The following sets of channels show differences between X, Y and Z:
- H1_PEM-CS_MAG_EBAY_SUSRACK_X_DQ (Higher amplitudes and towards higher frequencies)
- H1_PEM-CS_MAG_EBAY_SUSRACK_Y_DQ (Lower comb amplitudes)
- H1_PEM-CS_MAG_EBAY_SUSRACK_Y_DQ (Lower comb amplitudes)
Regarding CS_MAG_LVEA_OUTPUTOPTICS, these combs can be seen best in X, weaker in Y and almost non-existent in Z. (In CS_MAG_LVEA_INPUTOPTICS they look roughly the same height)
- H1_PEM-CS_MAG_LVEA_OUTPUTOPTICS_X_DQ (Strongest)
- H1_PEM-CS_MAG_LVEA_OUTPUTOPTICS_Y_DQ (Weaker lines)
- H1_PEM-CS_MAG_LVEA_OUTPUTOPTICS_Z_DQ (Almost no lines)
Same behavior at:
- H1_PEM-CS_MAG_LVEA_VERTEX_X_DQ (Strongest lines)
- H1_PEM-CS_MAG_LVEA_VERTEX_Y_DQ (Weaker lines)
- H1_PEM-CS_MAG_LVEA_VERTEX_Z_DQ (Almost no lines)
We can see that these combs mostly appear in the corner station. The combs do not appear in neither EX nor EY channels. However, comb 99.99865 Hz offset 0.000 appears in many EX, EY channels and does become more coherent after July 7th. However, it is very close to 100 Hz so it may be influenced by other round-number combs (?)


INP P gain accepted in SDF. CSOFT doesn't look to be monitored.