{Bubba, Scott L., Roger}
Scott and Roger loaded the four 84" HAM doors on flat bed semi truck today at mid-Y. The crates were covered with a tarp and on their way to MN.
Gerardo M. Tyler G. Chris S. With purge air at a dew point of -47?c~, the team decoupled HAM 8 from the mode cleaner tube. Using drawbars/turnbuckles, the bellows on the mode cleaner tube was compressed just enough to allow for both 60" shipping covers to be craned in place and installed with their respective hardware. C3 covers were then placed outside the hard cover on both the chamber and mode cleaner sides (not unlike the current config of the HAM7/8 joint). After a successful decoupling from the remained of the VE, we broke all footing bolts loose to prepare for future efforts to exercise the chamber from the grout below.
Tyler G., Kyle R.
We had to enlarge the slots in the anchor brackets as well as those of the turbo fixation base to compensated for unfavorable tolarance stack ups. One of four turbo fixation base adjusters galled and will need to be replaced. It was removed, leaving the fixation supported by three adjusters.
Not sure what happened.
Following today's leak checking exercise, we left the turbo station powered ON to allow time for rotors to spin down to avoid crashing the magnetically levitated bearing. At some point today I will enter the VEA to de-power the unit at which point the bearing will drop.
Powered OFF at 22:19:30 UTC.
{Kyle, Tyler, Chandra}
Found an air leak at EX RGA today at the tail end of maintenance. Ran out of time to pin point which joint. The RGA manifold is still covered in foil from last bakeout. We measured 2.8x10^-9 Torr-L/s at LD backing main turbo pump. Below are two aLOGs from 2016 referencing installation and commissioning.
Next opportunity we will isolate RGA from main volume and leak check manifold. Those mini conflats on cal gases may have started to leak after baking. I can't find a leak check record post-bake.
aLOG 31080
aLOG 29729
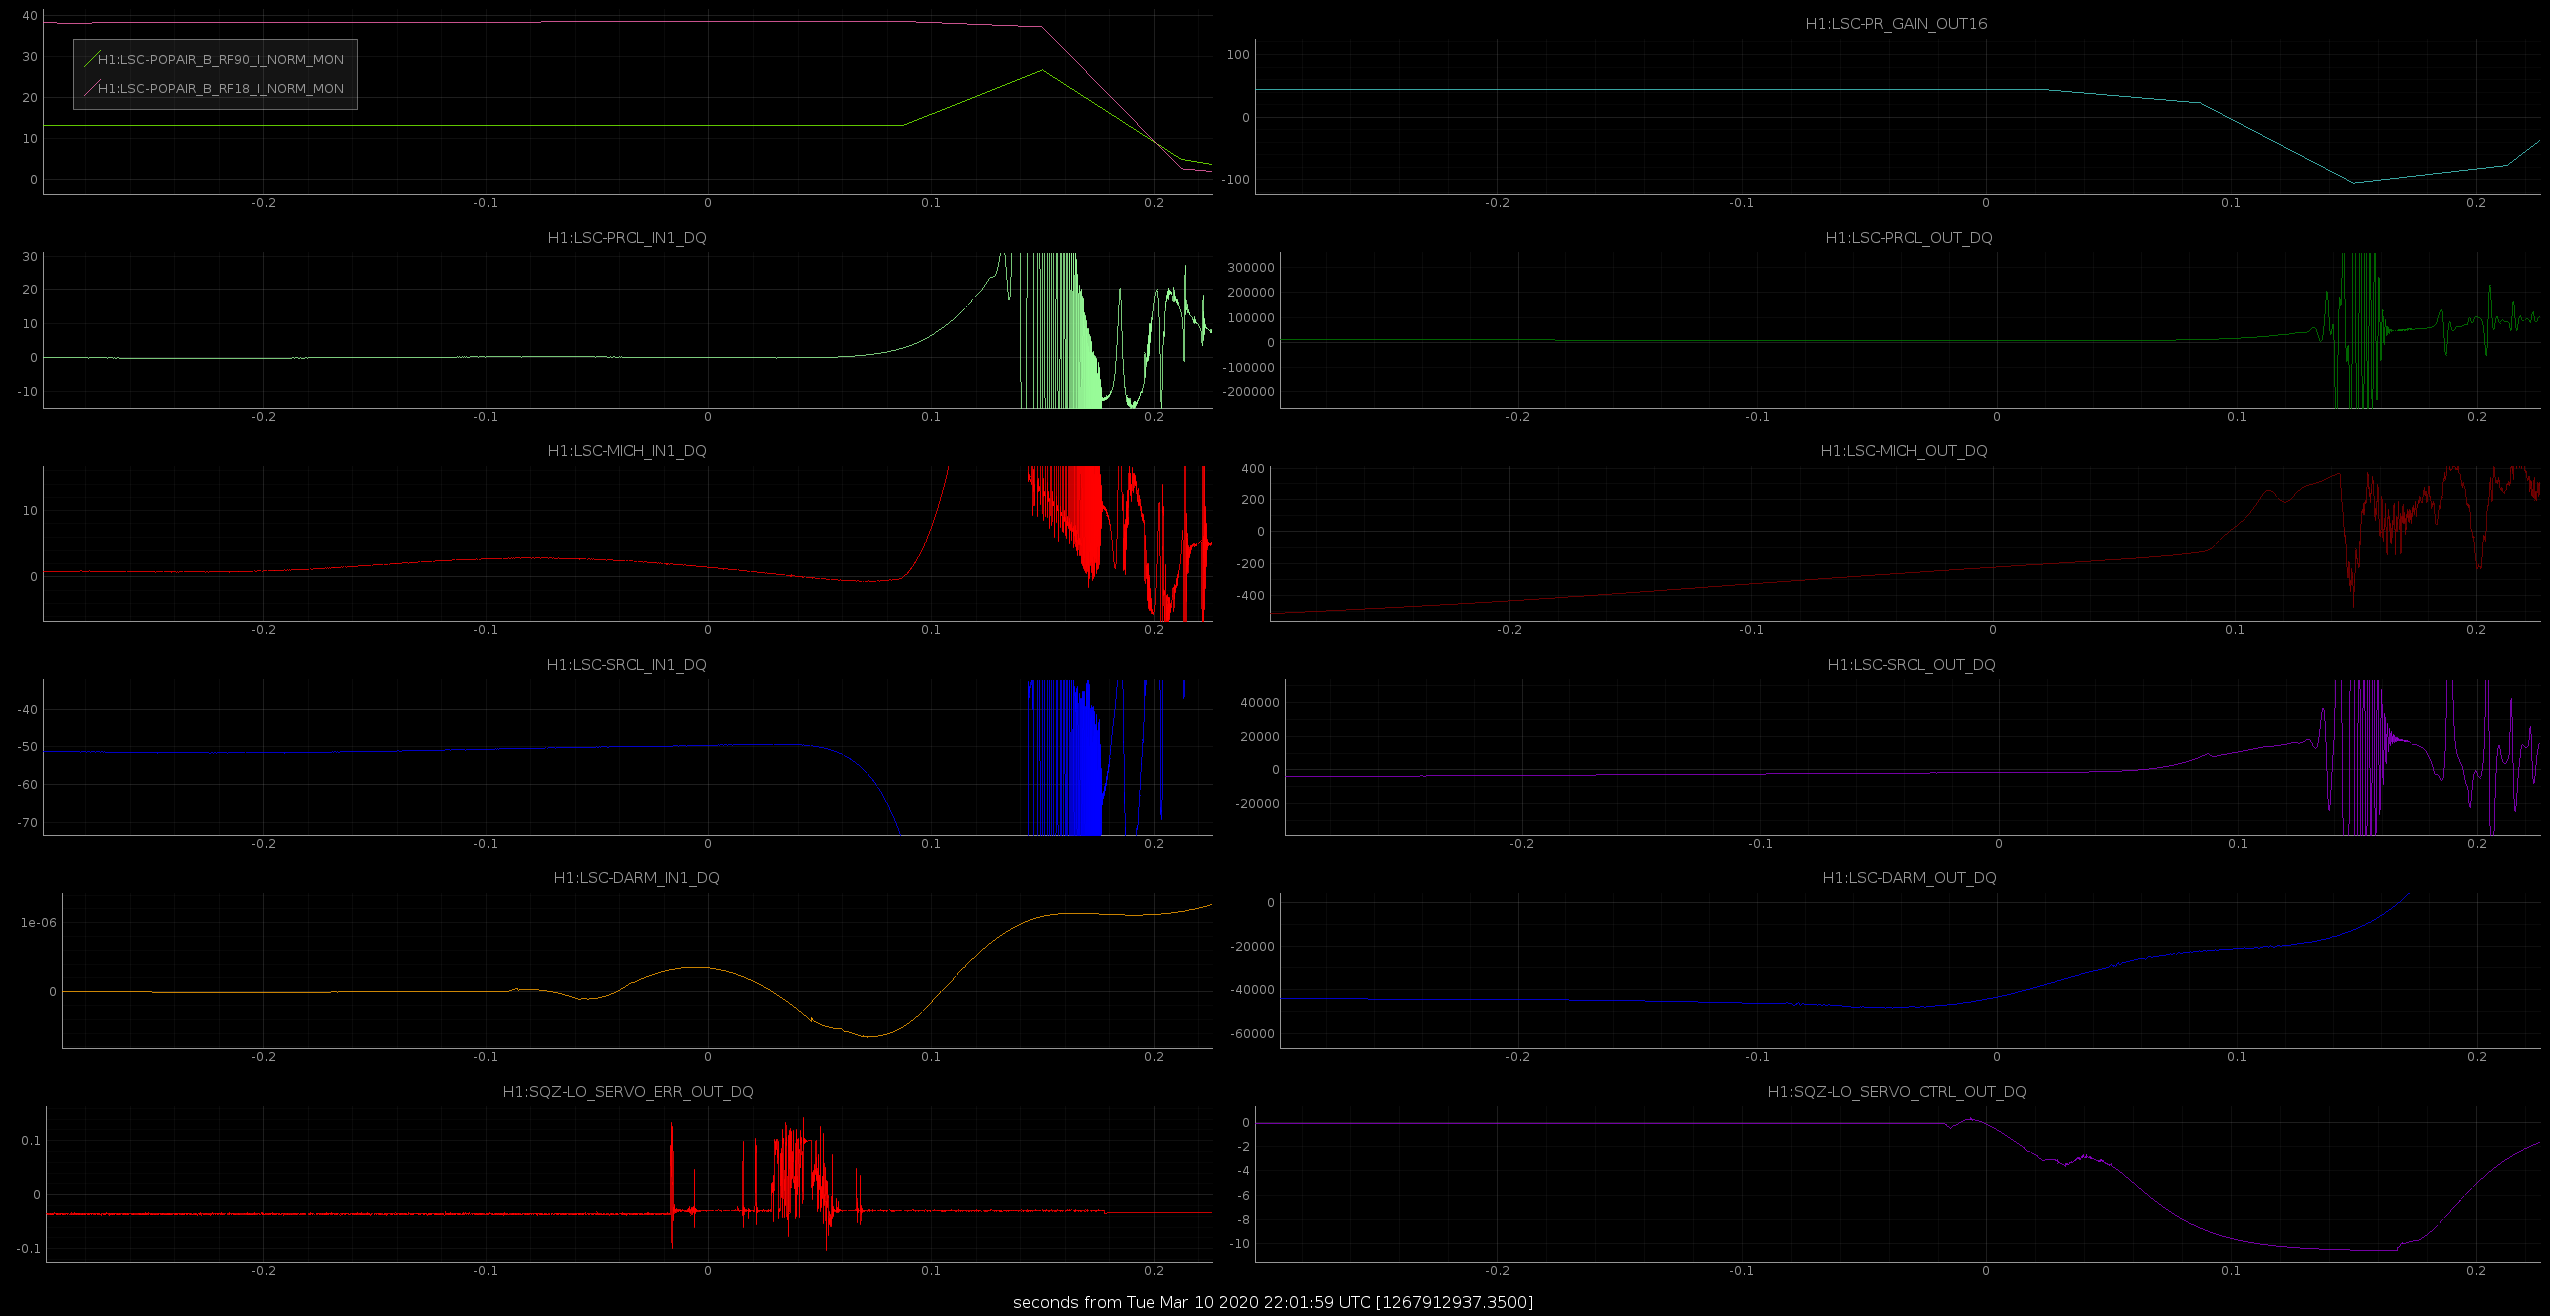
Recovery from maintenance was not problematic. We had one lock loss at RESONANCE where the BS ISI ST2 tripped, just like on yesterday morning (alog55506). After that it came right back up. I did not do an initial alignment.
HAM2 West door analog camera gave intermittant images, which appeard to be related to the power cable, which was not resolved by repositioning the cable. I removed the camera and the camera can, and covered the viewport with a yellow cover. The viewport is called as HAM2 viewport A1F1, as it is identified in T1200240 (AKA West door, top viewport on the North side). Filiberto is looking at the cable, and initial assessment is that the cable is good. I'll be checking the camera as well.
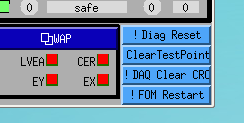
On the lower right corner of the CDS O3 overview I've added a "!FOM Restart" button. When pressed, this will restart all the NDS client FOM applications (ndscope and DTT). We need to do this after every DAQ restart.
Note that this SSH logs into each FOM machine to run a local restart script, if you don't have SSH key-pairs established with the FOM machines you will be asked for the controls password each time.
If you run the command as user controls on your workstation then the restart script will proceed with no passwords required.
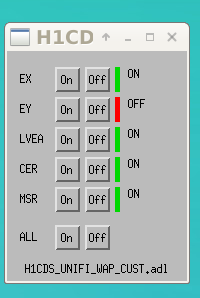
following some RED/GREEN confusion between the detailed WAP and the WAP status on the O3 overview, I've reworked the WAP MEDM to show the status both as a colour and a text. The status colours on the O3 run overview remains the same, GREEN = nominal for observation, RED = must be investigated when in observation.
A reminder that there is a delay of several seconds between pressing the On and Off buttons and the WAP transitioning to the requested state.
I reset both PSL power watchdogs at 18:21 UTC (11:21 PDT). This completes FAMIS 10753.
The channel names had started with H3 to avoid conflicts with those for the previous WAPs. Now that those are gone I changed H3 to H1.
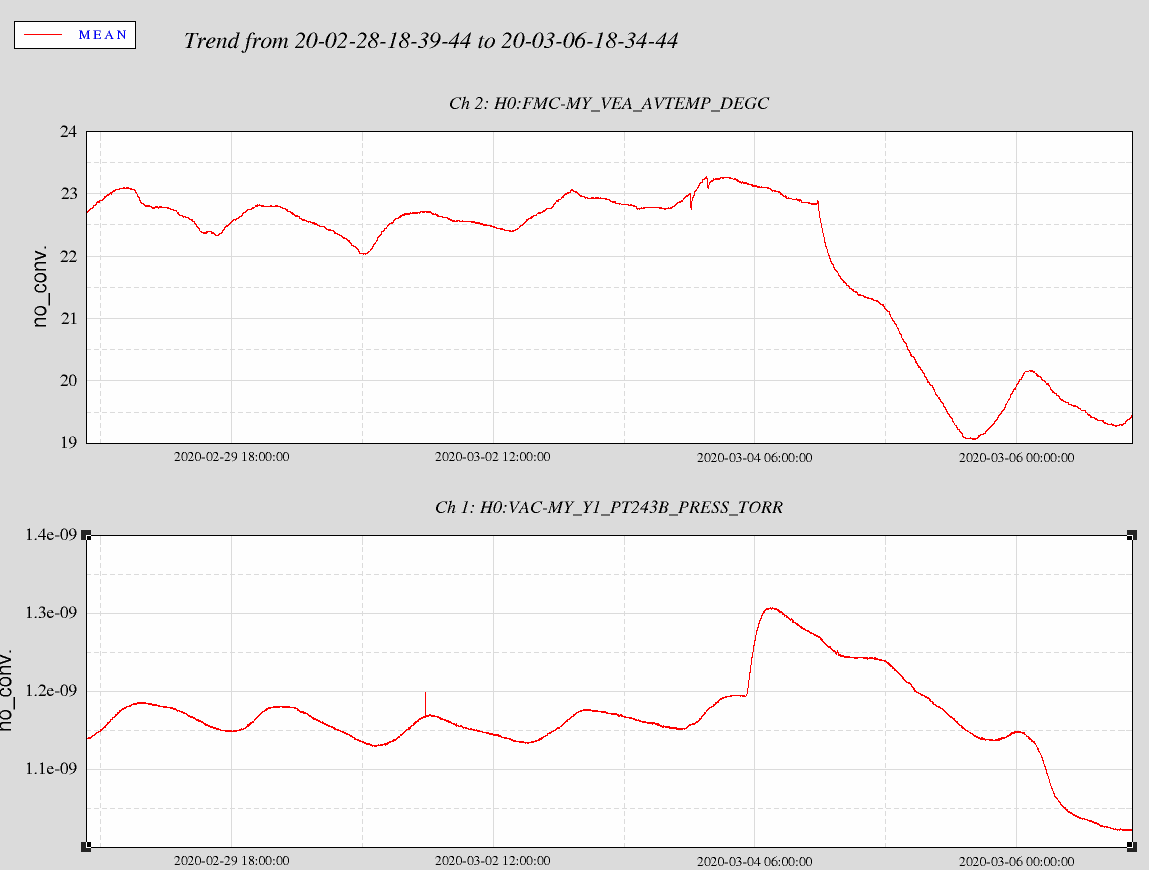
As seen in the attached 10-day pressure trend, we had some sort of pressure transient around 2100 hrs. local time on Tuesday. This doesn't appear to correspond with any of the normal suspects, i.e., a loss of pump speed due to an ion pump HV switching event or from an ambient temperature increase (corresponding VEA temperture compared separately). Note that the amount of gas needed to cause this trivial increase is of no concern. Rather, it is the "unexplained" nature of this that is of concern. These circumstances are similar to past events in which we theorized that ice may have fallen off of the cryopump's inner vessel, evaporated and then re-condensed.
Attached is more recent data. This is troubling to me. Upon further consideration the "ice" theory isn't applicable because of the time duration of the pressure anomaly. Chandra R. has had a long standing request to connect the RGA at the MY into the network but, for now, we can't "see" the partial pressures.
After looking at trend data in seconds, we see the pressure rose at corner station first.
Here is a seven day pressure and temperature trend in mid-Y VEA. No surprise that as temperature decreases, so does pressure. However, doesn't explain the initial abnormal rise in pressure we saw on Tuesday evening. Let's keep an eye on this, and I will work with CDS team to connect RGA for remote access.
Took ASC sensing matrix measurement with 'userapps/asc/h1/scripts/sensingMatrix/run_sensmat.py', using updated injection amplitudes. DHARD & CHARD yaw were too low to get a coherent measurement, I've left a note for next time.
| dof: | DHARD | CHARD | DSOFT | CSOFT |
| AS_A_DC_PIT | 7.4e+04 118 | 1.7e+02 -60 | 4.6e+02 66 | 3.6e+02 86 |
| AS_A_RF36_I_PIT | 1.1e+06 -16 | 2.3e+03 13 | 1.37e+05 163 | 2.1e+04 -170 |
| AS_A_RF36_Q_PIT | 1.3e+06 -80 | 9.2e+03 157 | 2.17e+05 156 | 2.4e+04 -125 |
| AS_A_RF45_I_PIT | 3.0e+05 18 | 3.98e+03 -130 | 8.57e+03 170 | 9.39e+03 11 |
| AS_A_RF45_Q_PIT | 8.54e+05 -24 | 1.53e+04 -171 | 1.43e+04 -119 | 2.09e+04 -8 |
| AS_B_DC_PIT | 2.7e+04 -83 | 3.3e+02 -49 | 6.0e+02 161 | 8.8e+02 -135 |
| AS_B_RF36_I_PIT | 2.9e+06 37 | 1.7e+04 -57 | 2.52e+05 -19 | 1.1e+05 168 |
| AS_B_RF36_Q_PIT | 3.5e+06 -162 | 1.3e+04 148 | 2.24e+05 -24 | 5.4e+04 -24 |
| AS_B_RF45_I_PIT | 1.2e+05 -29 | 3.22e+03 176 | 7.94e+03 -162 | 5.5e+03 100 |
| AS_B_RF45_Q_PIT | 7.70e+05 157 | 8.82e+03 39 | 1.01e+04 29 | 1.98e+04 154 |
| AS_C_PIT | 1.6e-02 58 | 5.49e-04 -69 | 1.55e-03 -119 | 1.0e-03 109 |
| REFL_A_DC_PIT | 4.1e+04 150 | 3.6e+02 -103 | 1.7e+03 -87 | 3.1e+03 155 |
| REFL_A_RF9_I_PIT | 7.1e+06 137 | 2.42e+05 168 | 1.9e+05 -117 | 4.7e+05 135 |
| REFL_A_RF9_Q_PIT | 7.4e+06 -7 | 9.76e+04 -12 | 6.0e+04 24 | 2.3e+05 -38 |
| REFL_A_RF45_I_PIT | 6.3e+06 107 | 3.42e+05 172.9 | 1.9e+05 -88 | 2.2e+05 147 |
| REFL_A_RF45_Q_PIT | 3.1e+06 52 | 1.01e+05 171 | 3.1e+04 88 | 1.3e+05 -17 |
| REFL_B_DC_PIT | 1.6e+04 48 | 5.4e+02 173 | 7.7e+02 -66 | 3.4e+03 137 |
| REFL_B_RF9_I_PIT | 4.5e+06 130 | 1.71e+05 162 | 6.8e+04 -120 | 1.5e+05 147 |
| REFL_B_RF9_Q_PIT | 1.4e+06 -3 | 4.80e+04 -15 | 2.3e+04 -69 | 3.0e+04 -10 |
| REFL_B_RF45_I_PIT | 3.0e+07 143 | 3.26e+05 161 | 3.6e+05 -105 | 3.0e+05 110 |
| REFL_B_RF45_Q_PIT | 9.6e+06 146 | 1.03e+05 160 | 1.1e+05 -110 | 6.7e+04 88 |
| POP_X_RF_I_PIT | 2.7e+06 -3 | 1.62e+05 -16 | 9.3e+04 158 | 2.2e+05 -37 |
| POP_X_RF_Q_PIT | 3.3e+06 -97 | 2.3e+04 172 | 2.5e+04 -3 | 4.2e+04 164 |
| POP_A_PIT | 3.8e+03 -119 | 7.81e+01 -28 | 2.2e+01 92 | 9.0e+01 -55 |
| POP_B_PIT | 3.1e+02 148 | 1.34e+01 143 | 1.2e+01 72 | 7.2e+00 -152 |
| X_TR_A_PIT | 2.5e+03 -179 | 4.31e+03 157 | 1.01e+02 -3 | 1.8e+02 -32 |
| X_TR_B_PIT | 3.5e+03 -166 | 5.29e+03 157 | 2.89e+02 159 | 3.46e+02 164 |
| Y_TR_A_PIT | 6.2e+03 -20 | 5.37e+03 159 | 3.78e+02 163 | 3.3e+02 -6 |
| Y_TR_B_PIT | 4.0e+03 -80 | 1.53e+03 156 | 7.75e+02 -22 | 7.37e+02 167 |
| dof: | DHARD | CHARD | DSOFT | CSOFT |
| AS_A_DC_YAW | 8.1e+04 40 | 7.6e+03 157 | 5.1e+02 -169 | 4.0e+02 -2 |
| AS_A_RF36_I_YAW | 3.8e+06 -129 | 9.0e+04 52 | 1.12e+05 -12 | 6.37e+04 167 |
| AS_A_RF36_Q_YAW | 4.7e+06 -154 | 1.2e+05 -75 | 2.05e+05 -19 | 2.4e+04 -22 |
| AS_A_RF45_I_YAW | 3.3e+05 0 | 1.1e+04 87 | 1.02e+04 20 | 3.1e+03 -22 |
| AS_A_RF45_Q_YAW | 9.0e+05 -5 | 1.7e+04 127 | 1.12e+04 57 | 4.8e+03 40 |
| AS_B_DC_YAW | 6.6e+04 -84 | 2.5e+03 128 | 6.6e+02 49 | 3.1e+02 -17 |
| AS_B_RF36_I_YAW | 3.8e+06 -118 | 1.7e+05 -60 | 2.11e+05 167 | 1.2e+05 145 |
| AS_B_RF36_Q_YAW | 4.2e+06 154 | 3.9e+05 117 | 2.26e+05 156 | 9.3e+04 -49 |
| AS_B_RF45_I_YAW | 1.8e+05 -23 | 1.7e+04 -130 | 6.14e+03 -19 | 2.1e+03 69 |
| AS_B_RF45_Q_YAW | 8.7e+05 -173 | 2.4e+04 -26 | 1.21e+04 -78 | 8.2e+03 172 |
| AS_C_YAW | 1.4e-01 -175 | 4.2e-03 -4 | 1.44e-03 143 | 6.2e-04 -147 |
| REFL_A_DC_YAW | 2.8e+05 -75 | 1.7e+04 -137 | 2.3e+03 52 | 3.2e+03 97 |
| REFL_A_RF9_I_YAW | 4.5e+07 -69 | 2.1e+06 -116 | 1.3e+05 171 | 3.0e+05 108 |
| REFL_A_RF9_Q_YAW | 7.2e+06 -116 | 3.1e+05 -17 | 5.6e+04 -136 | 2.5e+04 144 |
| REFL_A_RF45_I_YAW | 1.2e+08 -82 | 7.1e+06 -96 | 5.2e+05 -175 | 8.1e+05 133 |
| REFL_A_RF45_Q_YAW | 2.8e+07 -88 | 2.0e+06 -91 | 1.6e+05 -177 | 1.7e+05 152 |
| REFL_B_DC_YAW | 5.6e+04 -166 | 1.3e+04 -86 | 6.3e+02 -23 | 1.3e+03 141 |
| REFL_B_RF9_I_YAW | 9.9e+06 96 | 6.3e+05 165 | 4.7e+04 28 | 1.25e+05 -13 |
| REFL_B_RF9_Q_YAW | 1.6e+06 137 | 3.5e+05 11 | 1.5e+04 163 | 6.6e+04 170 |
| REFL_B_RF45_I_YAW | 5.8e+07 102 | 2.4e+06 108 | 3.0e+05 158 | 2.1e+05 -6 |
| REFL_B_RF45_Q_YAW | 1.9e+07 111 | 8.1e+05 76 | 8.2e+04 -169 | 5.0e+04 -34 |
| POP_X_RF_I_YAW | 8.1e+06 175 | 1.1e+06 7 | 8.6e+04 -145 | 1.4e+05 175 |
| POP_X_RF_Q_YAW | 4.6e+06 87 | 2.3e+05 -50 | 7.1e+04 -24 | 4.8e+04 -36 |
| POP_A_YAW | 7.2e+03 7 | 6.8e+02 -164 | 1.6e+02 -45 | 9.8e+01 -59 |
| POP_B_YAW | 2.3e+03 11 | 7.7e+01 84 | 3.9e+01 -38 | 9.4e+00 46 |
| X_TR_A_YAW | 5.2e+03 -76 | 4.39e+03 161 | 1.2e+02 -168 | 1.8e+02 129 |
| X_TR_B_YAW | 6.6e+03 -93 | 3.22e+03 169 | 7.96e+02 -23 | 6.17e+02 -23 |
| Y_TR_A_YAW | 9.0e+03 177 | 5.50e+03 -24 | 2.7e+02 147 | 2.8e+02 -14 |
| Y_TR_B_YAW | 1.2e+04 165 | 2.72e+03 -22 | 6.74e+02 -31 | 6.24e+02 166 |
Updated yaw sensing matrix, with DHARD & CHARD inputs increased by a factor of 3:
| dof: | DHARD | CHARD | DSOFT | CSOFT |
| AS_A_DC_YAW | 2.8e+04 -152 | 2.2e+03 -25 | 4.6e+02 -100 | 4.0e+02 108 |
| AS_A_RF36_I_YAW | 6.3e+05 -177 | 9.6e+04 -84 | 1.22e+05 -18 | 5.7e+04 130 |
| AS_A_RF36_Q_YAW | 1.6e+06 -28 | 5.4e+04 -49 | 1.98e+05 -15 | 1.9e+04 -39 |
| AS_A_RF45_I_YAW | 3.73e+05 -6 | 1.31e+04 164 | 1.11e+04 5 | 1.4e+03 16 |
| AS_A_RF45_Q_YAW | 9.41e+05 -22 | 2.9e+04 174 | 1.50e+04 47 | 3.5e+03 105 |
| AS_B_DC_YAW | 1.7e+04 37 | 1.7e+03 -96 | 3.8e+02 -43 | 4.9e+02 -50 |
| AS_B_RF36_I_YAW | 1.2e+06 -169 | 1.2e+05 -52 | 2.20e+05 162 | 7.1e+04 107 |
| AS_B_RF36_Q_YAW | 7.5e+05 -111 | 1.4e+05 171 | 1.96e+05 169 | 1.7e+04 -50 |
| AS_B_RF45_I_YAW | 8.6e+04 -47 | 7.8e+03 -163 | 6.00e+03 -12 | 4.9e+03 68 |
| AS_B_RF45_Q_YAW | 7.93e+05 161 | 2.96e+04 -4 | 1.10e+04 -91 | 4.5e+03 -105 |
| AS_C_YAW | 4.94e-02 -163 | 1.9e-03 -38 | 1.2e-03 129 | 7.9e-04 -126 |
| REFL_A_DC_YAW | 4.0e+04 -56 | 7.3e+02 -37 | 1.2e+03 109 | 7.2e+02 -7 |
| REFL_A_RF9_I_YAW | 1.9e+06 131 | 2.7e+05 82 | 2.1e+05 80 | 8.3e+04 63 |
| REFL_A_RF9_Q_YAW | 1.2e+06 -168 | 3.5e+05 18 | 4.0e+04 23 | 3.0e+04 68 |
| REFL_A_RF45_I_YAW | 8.0e+06 149 | 1.9e+06 36 | 7.2e+05 65 | 2.3e+05 49 |
| REFL_A_RF45_Q_YAW | 3.3e+06 133 | 6.9e+05 38 | 2.2e+05 56 | 7.8e+04 52 |
| REFL_B_DC_YAW | 1.6e+04 -94 | 3.1e+03 20 | 2.6e+02 106 | 7.8e+02 -36 |
| REFL_B_RF9_I_YAW | 1.4e+06 8 | 3.85e+05 154 | 4.4e+04 103 | 9.6e+04 -4 |
| REFL_B_RF9_Q_YAW | 5.3e+05 124 | 1.2e+05 -94 | 4.4e+04 -122 | 4.7e+04 -166 |
| REFL_B_RF45_I_YAW | 3.4e+06 43 | 1.3e+06 -169 | 2.6e+05 -127 | 1.2e+05 -167 |
| REFL_B_RF45_Q_YAW | 2.6e+05 -110 | 2.6e+05 -147 | 1.0e+05 -116 | 4.8e+04 -93 |
| POP_X_RF_I_YAW | 2.0e+06 -172 | 2.9e+05 -58 | 1.2e+05 -104 | 5.4e+04 179 |
| POP_X_RF_Q_YAW | 7.1e+05 161 | 9.7e+04 -169 | 3.7e+04 -75 | 7.3e+04 118 |
| POP_A_YAW | 1.1e+02 -48 | 7.16e+01 -21 | 6.4e+00 45 | 3.7e+00 -50 |
| POP_B_YAW | 6.0e+02 -50 | 5.84e+01 159 | 8.9e+00 -124 | 1.0e+01 148 |
| X_TR_A_YAW | 5.3e+03 165 | 3.53e+03 159 | 1.6e+02 -120 | 4.5e+01 -31 |
| X_TR_B_YAW | 3.6e+03 167 | 2.73e+03 160 | 7.08e+02 -26 | 6.96e+02 -32 |
| Y_TR_A_YAW | 7.1e+03 159 | 6.04e+03 -20 | 3.69e+02 156 | 2.8e+02 -10 |
| Y_TR_B_YAW | 4.3e+03 152 | 2.01e+03 -25 | 7.64e+02 -22 | 6.72e+02 151 |
The whitening / anti-whitening gains in runAnalysis_vII.py were outdated. Attached are the tables with corrected gains, and also in raw cts/rad.
[M. Wade, J. Kissel, A. Viets]
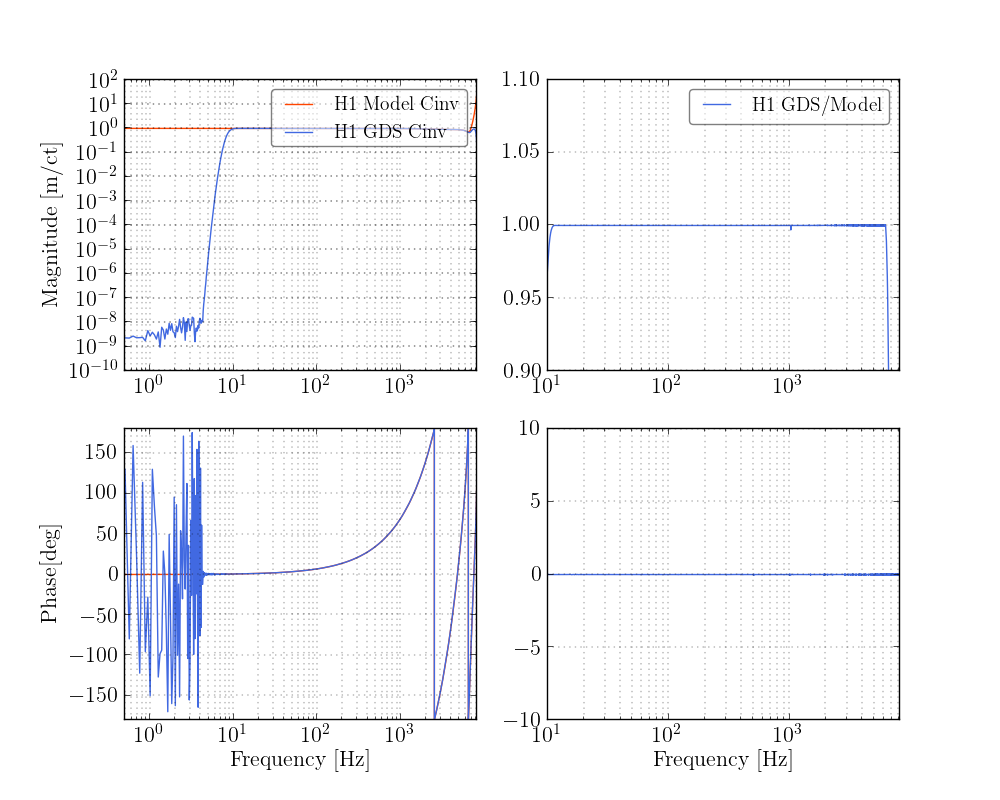
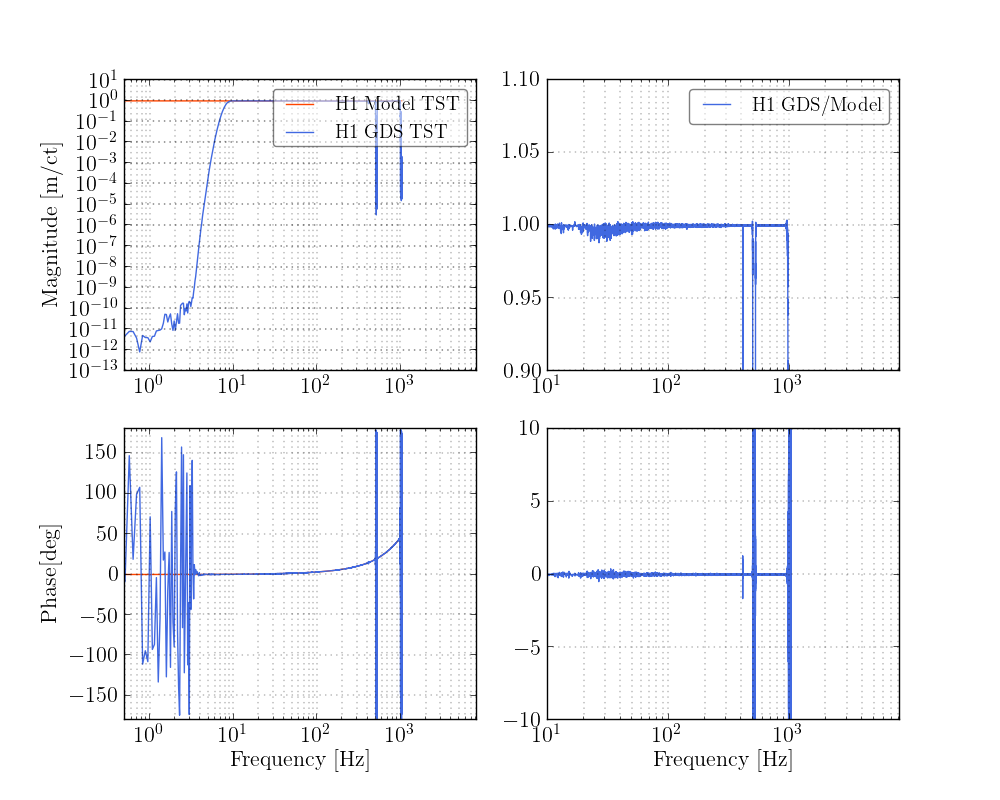
Maddie and I have produced new GDS filters for the calibration model update described in LHO aLOGs 54269 and 54473.
I restarted the primary, redundant, and testing calibration pipelines on the DMTs around GPS time 1262990593. Data seems to flowing normally.
The filters are found in revision 9137 of the calibration SVN here:
aligocalibration/trunk/Runs/O3/GDSFilters/H1GDS_1262900044_no_response_corr.npz
They were produced using the run script
aligocalibration/trunk/Runs/O3/H1/Scripts/TDfilters/H1_run_td_filters_1262900044_no_response_corr.sh
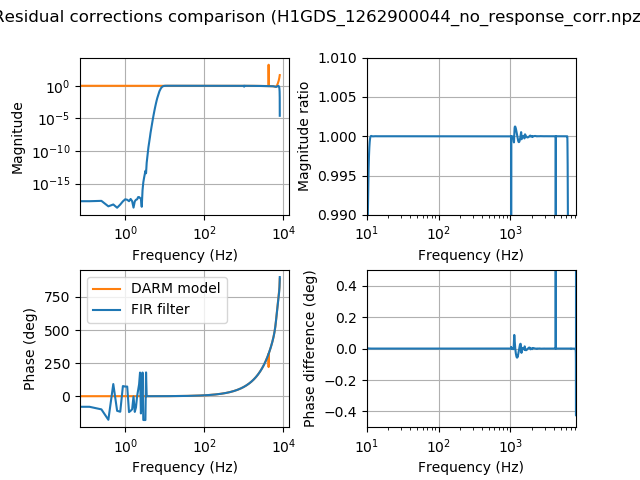
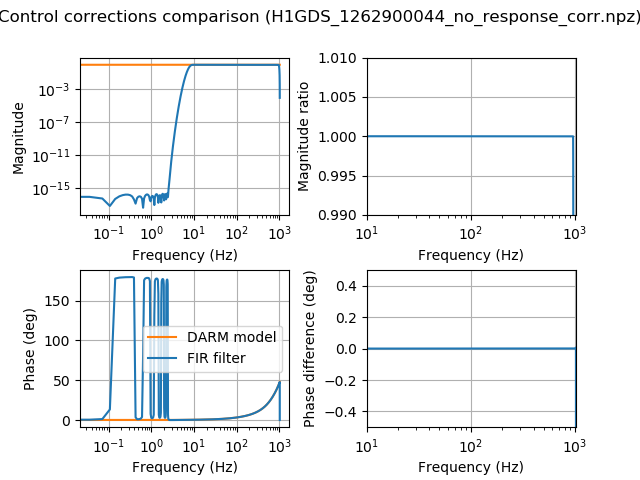
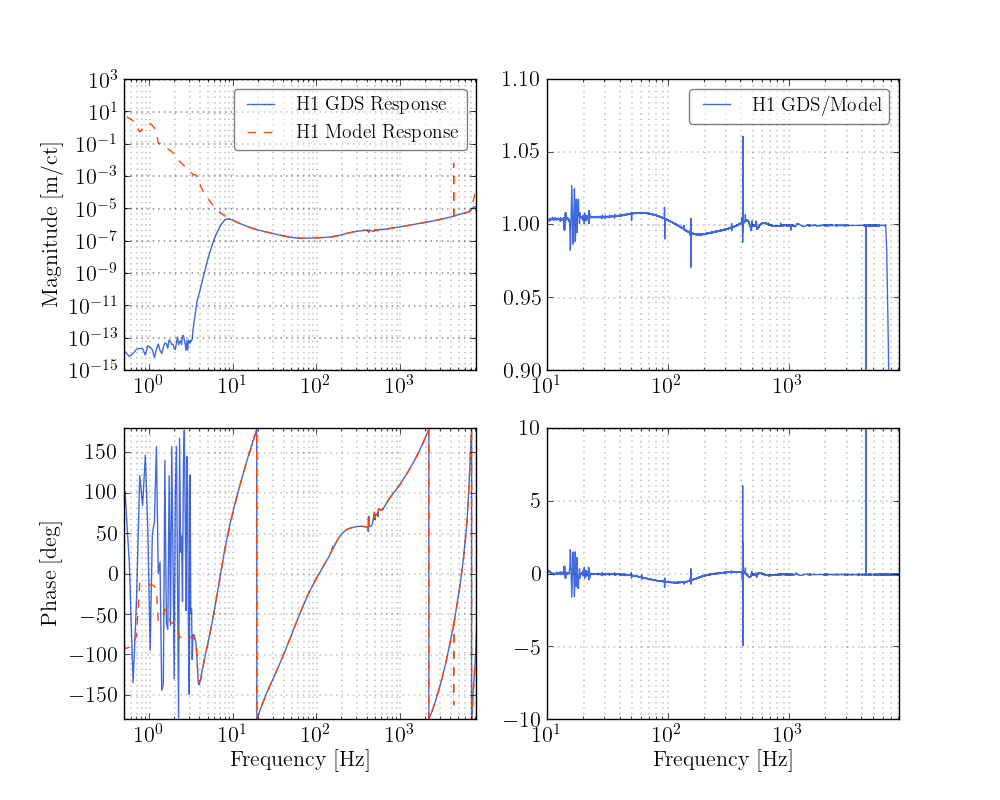
Plots of the frequency response of the filters are attached, comparing them to the frequency-domain model. Note the line at ~4kHz in the resudual corrections filter. This is actually in the control correction model, but it shows up the residual corrections filter plot because we normally apply control corrections above 1kHz in the residual path, since the control path is sampled at only 2kHz. It is surprising to something this large coming from the actuation at such a high frequency. Moreover, modeling this accurately would require a much longer filter sampled at at least 8 kHz, which we do not currently have the computational power to do. Given our skepticism, these filters do not model anything in the actuation above 1 kHz. We have an opportunity tomorrow to update the filters again should we decide that it is a good idea to model this the best we can.
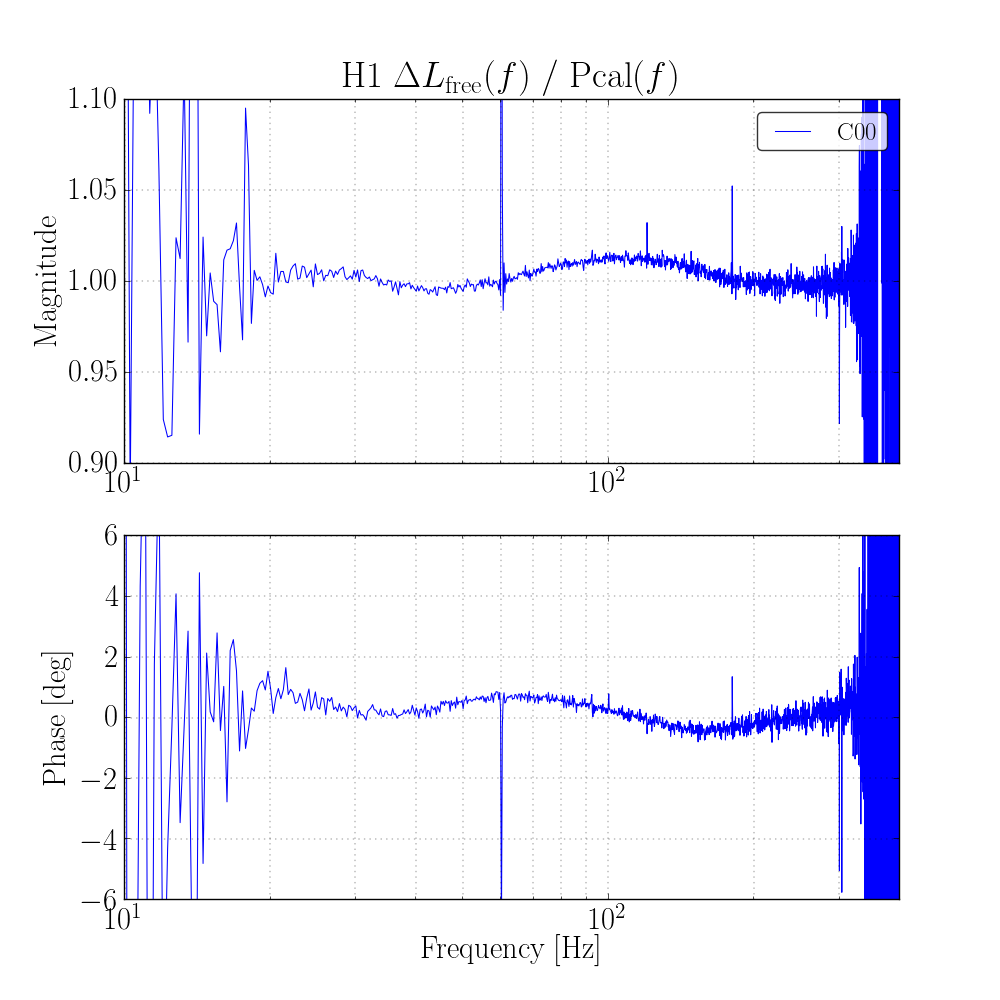
Jeff did a Pcal broadband injection just after the pipelines got running, so once the C00 frames are available, I will add GDS results from that injection. I also plan to test these filters on real data to see how well the model the response function once enough data is available.
The first observation ready segment with the updated calibration model start just now at Jan 14 2020 00:47:59 UTC, or GPS 1262998097.
Attached are plots of GDS data during the broadband injection, as well as plots showing how well the filters represent the frequency-domain DARM model. The broadband injection (first plot) looks good, showing deviations no greater than ~2% from 20 Hz - 350 Hz. The last plot shows how well the low-latency (front-end + GDS) calibration pipeline applies the response function R(f). The "spike" seen at 4276.0 Hz is not modeled at all by the filters. The source of this in the model is in all 3 stages of the actuation (only TST and PUM contribute significantly to the response function), and I assume it is a violin mode. This is a very narrow freature in the model, no wider than 0.25 Hz. Models for TST, PUM, and UIM all rise 12 or 13 orders of magnitude at this very narrow feature. We can attempt to model this in the inverse sensing path (which has a high enough sample rate), but it won't be modeled very well if we try, since it is such a narrow feature. Moreover, this would also compromise accuracy in neighboring frequency bins. Most likely, there will still be a loud spectral line in h(t) at 4276 Hz, and the systematic error induced by using the current filters would be that this line appears 3 orders of magnitude lower than it actually is.
Here's a comparison between GDS-CALIB_STRAIN's response to a broadband PCAL Y injection before vs. after this model update. Assuming PCAL is a perfect reference, this should be equivalent to a direct measure of the systematic error in the response function and h(t). One can see that, while we've cleaned up the UIM feature at 153 Hz, and improved the response ratio below 30 Hz, we seemed to made the systematic error worse between 60 and 150 Hz. In the first attachment, I show each of the transfer functions on top of each other, to show the former vs. the current level of systematic error. In the second attachment, I show the ratio of the two transfer functions, to show the *change* in systematic error. This second attachment should correspond to what Vlad predicted in LHO aLOG 54523. It's close... but not quite right. Still investigating... The script used to make this plot can be found here: /ligo/svncommon/CalSVN/aligocalibration/trunk/Runs/O3/H1/Scripts/FullIFOSensingTFs/ plot_GDS_BB_20200115.py and relies on data processed by Aaron and committed to /ligo/svncommon/CalSVN/aligocalibration/trunk/Runs/O3/H1/Results/GDS_BB_plots/ H1_C00_over_CAL-PCALY_RX_PD_OUT_DQ_1262638969-178.txt H1_C00_over_CAL-PCALY_RX_PD_OUT_DQ_1262990871-153.txt
I did some empirical probing into what could be giving this kind of responce between 20 and 300 Hz.
For this I created a new copy of the modelparams_H1_20200103.py file to play with.
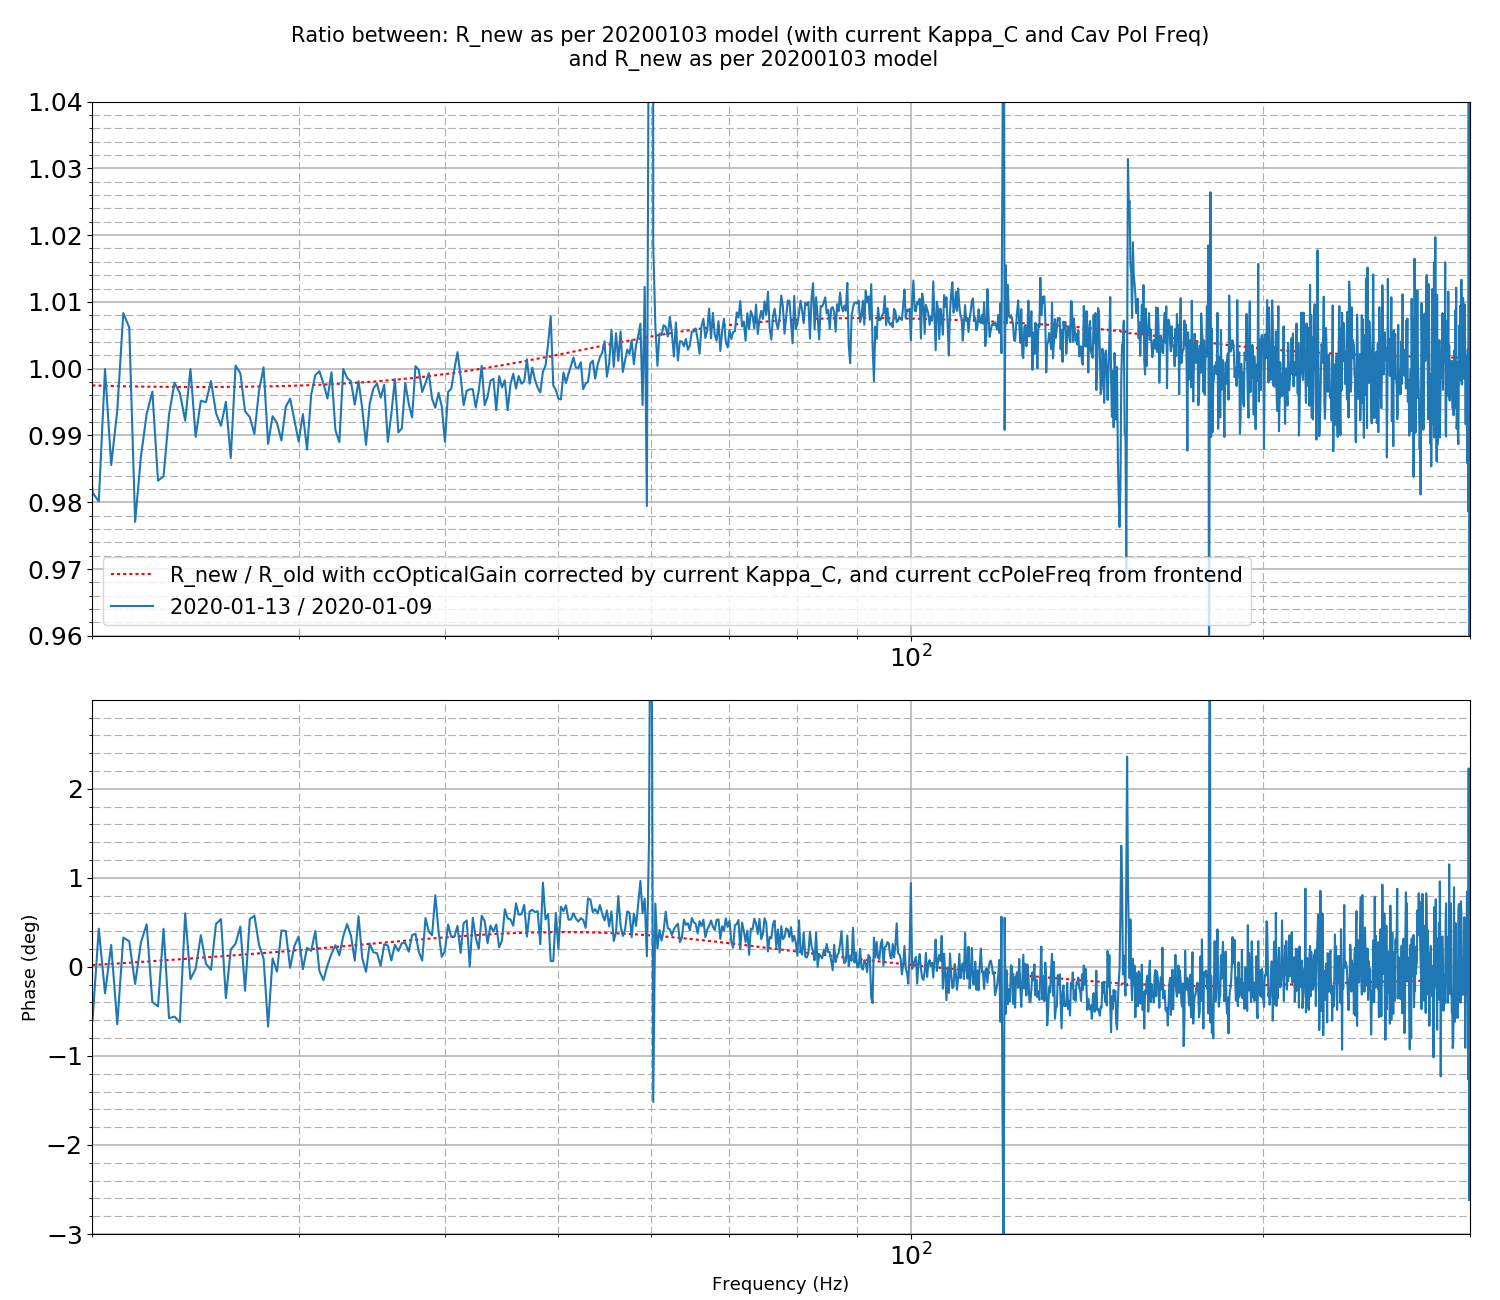
The plot attached here, is where I have taken the ratio of my new version over the currently used version, but I have altered:
This is plotted against the very data in the above comment, for reference.
It looks like the current systematic error trend can be ?just about? completely explained by this correction! It seems response in this range is *extremely* sensitive to the value of ccOpticalGain in the model.
EDIT: spoke to Jeff - more convincing to reanalyse this w.r.t the Orange line in his figures in the previous comment, and see if it explains the complete error in response.
For reference, here are the values of the TDCFs that were applied to the data in the GDS pipeline during the broadband injections.
During the injection starting at 1262638969:
kappa_tst = 1.0052612
kappa_pum = 1.0198756
kappa_uim = 0.99628365
kappa_C = 0.99136031
f_cc = 411.13184 Hz
During the injection starting at 1262990871:
kappa_tst = 0.99716723
kappa_pum = 1.017796
kappa_uim = 0.99592042
kappa_C = 0.99556768
f_cc = 410.88696 Hz
We needed a better understanding of the impact of this systematic error at ~150 Hz. for the UIM, so I added a copy of ratio plot from LHO aLOG 54565 to the same script, ^/trunk/Runs/O3/H1/Scripts/FullIFOSensingTFs/plot_GDS_BB_20200115.py and zoomed in around the 100-200 Hz frequency region. Attached are the results. (1) We're, of course, limited by the frequency resolution and noise of the measurement, BUT, (2) We see what Vlad has told us all along: there are actually three features: highQ anti-resonance at 151 Hz, highQ anti-resonance at 153 Hz, and then a high Q resonance at 154 Hz (rounding to the nearest Hz). Note that this description is of the *ratio* of (fixed) / (not fixed), so take my description of whether the feature is a "resonance" vs. "anti-resonance" with a grain of salt. (3) Each highQ feature peaks at around a -2%, -3%, and +3%, BUT -- that includes influence from the "underlying" broad frequency dependent error "sweeping through" this region -- known to be a result of problems with the TST actuator model in this low-latency data.