TITLE: 02/12 Day Shift: 16:00-00:00 UTC (08:00-16:00 PST), all times posted in UTC
STATE of H1: Lock Acquisition
INCOMING OPERATOR: Jim
SHIFT SUMMARY: Lost lock within this hour from some commissioning activity. Currently relocking.
LOG:
We were doing some PEM and sensing funtion injections, so it could have been one of those, but we are not 100% sure.
TITLE: 02/12 Day Shift: 16:00-00:00 UTC (08:00-16:00 PST), all times posted in UTC
STATE of H1: Observing at 120Mpc
OUTGOING OPERATOR: Patrick
CURRENT ENVIRONMENT:
SEI_CONF state: WINDY
Wind: 3mph Gusts, 1mph 5min avg
Primary useism: 0.02 μm/s
Secondary useism: 0.19 μm/s
QUICK SUMMARY: Locked and observing for almost 9 hours, calm environment.
TITLE: 02/12 Owl Shift: 08:00-16:00 UTC (00:00-08:00 PST), all times posted in UTC STATE of H1: Observing at 119Mpc INCOMING OPERATOR: TJ SHIFT SUMMARY: Locked and in observing the entire shift. No issues. LOG: 09:25 UTC Power cycled nuc5 (bottom eq plot had disappeared) 10:50 UTC GRB-Short INJ_TRANS to INJECT_KILL E363754 Fermi Trigger ID 603197394 TRIGGER_DUR: 0.512 [sec] Stand Down 14:05 UTC INJ_TRANS back to INJECT_SUCCESS
Have remained locked and in observing. No issues.
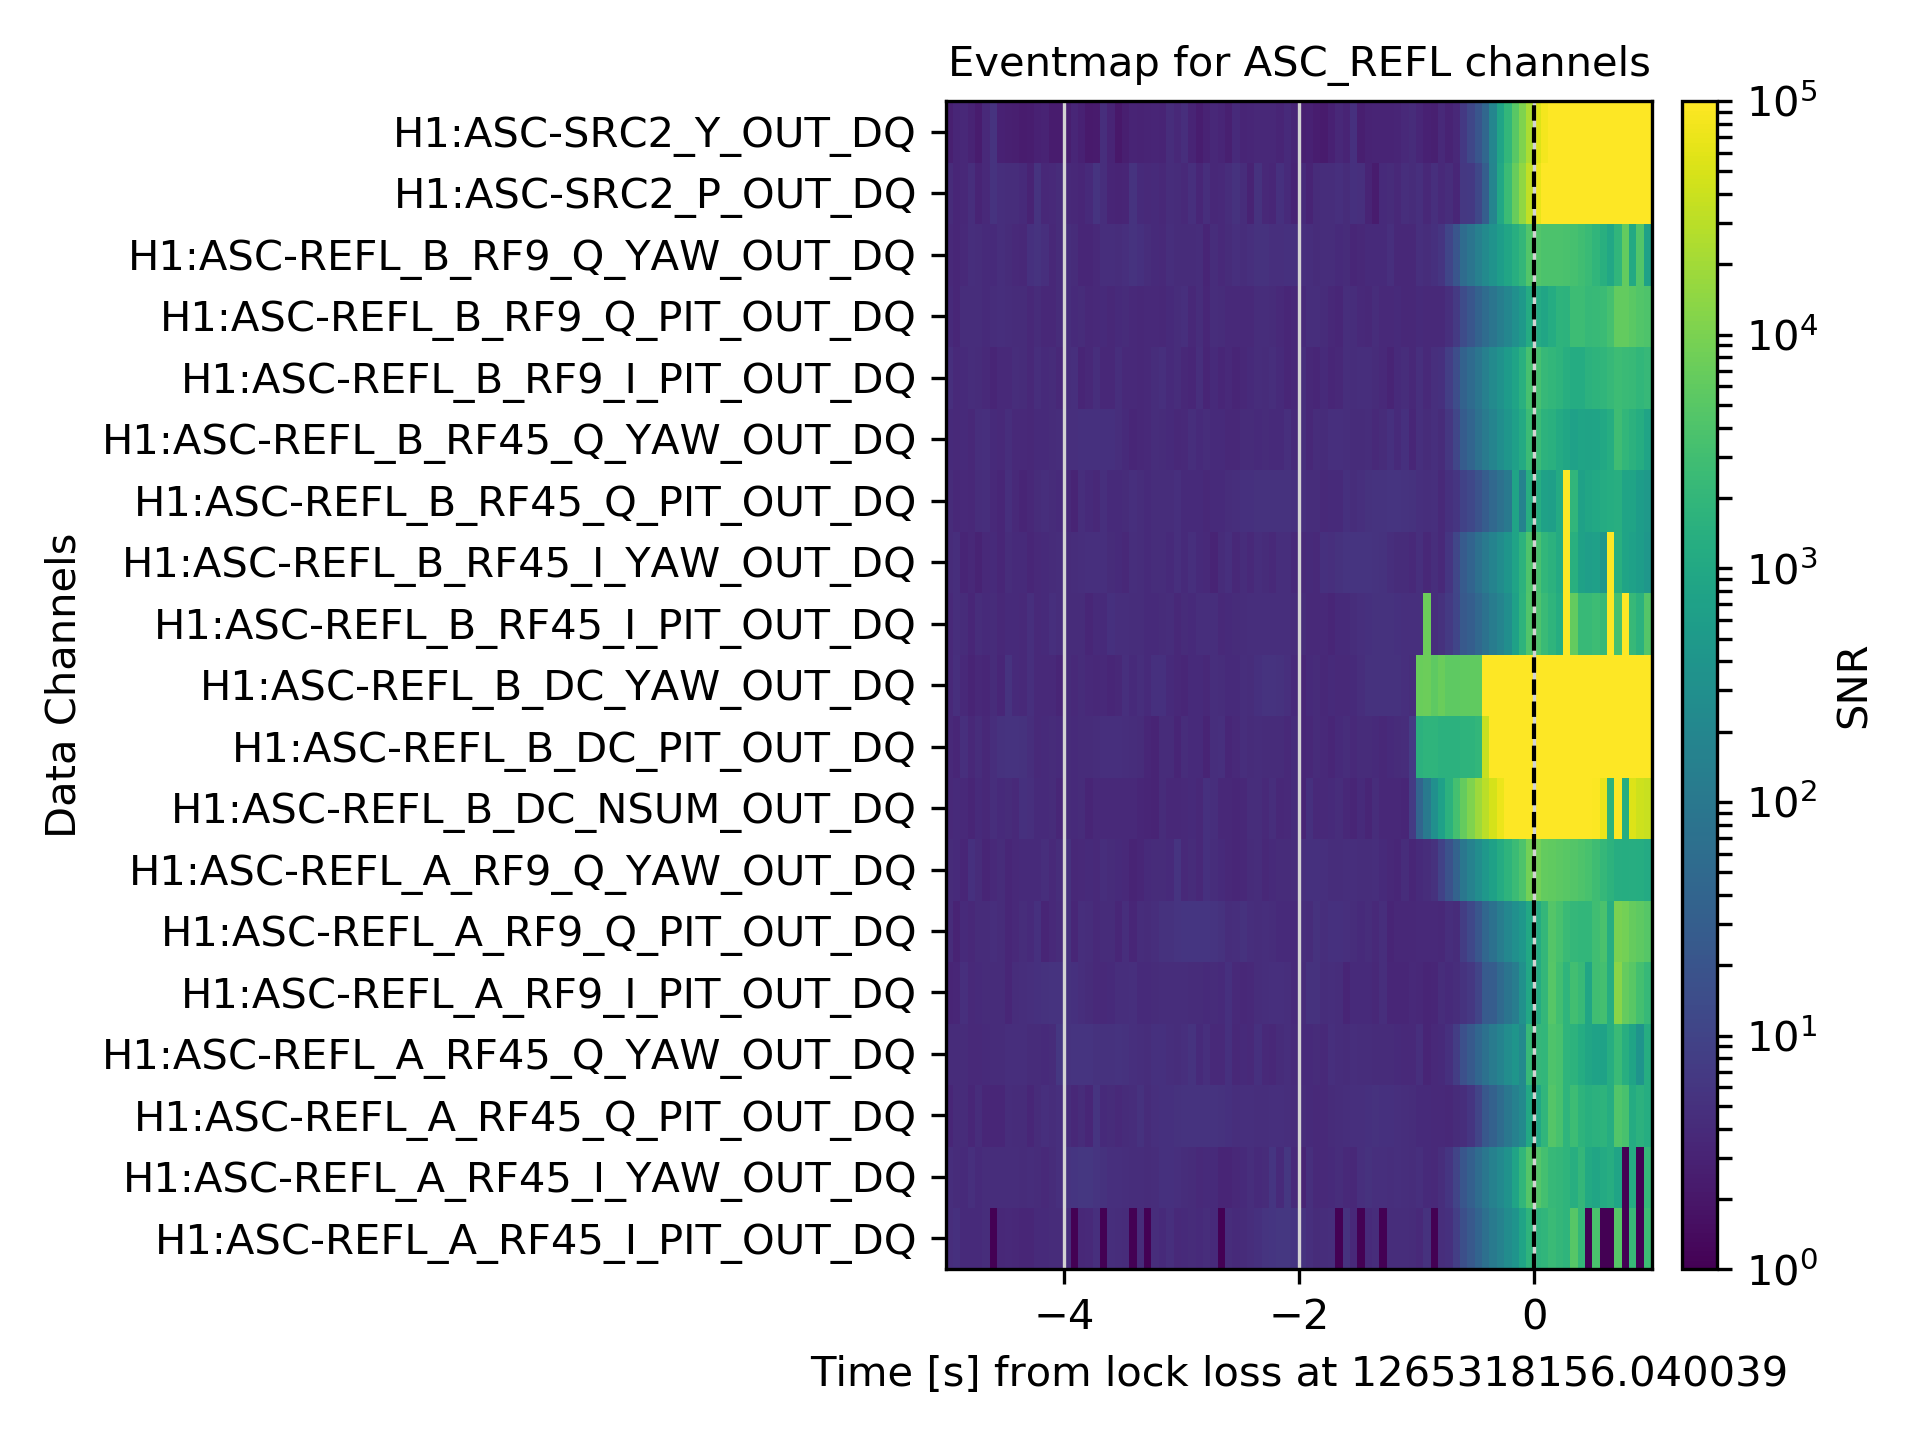
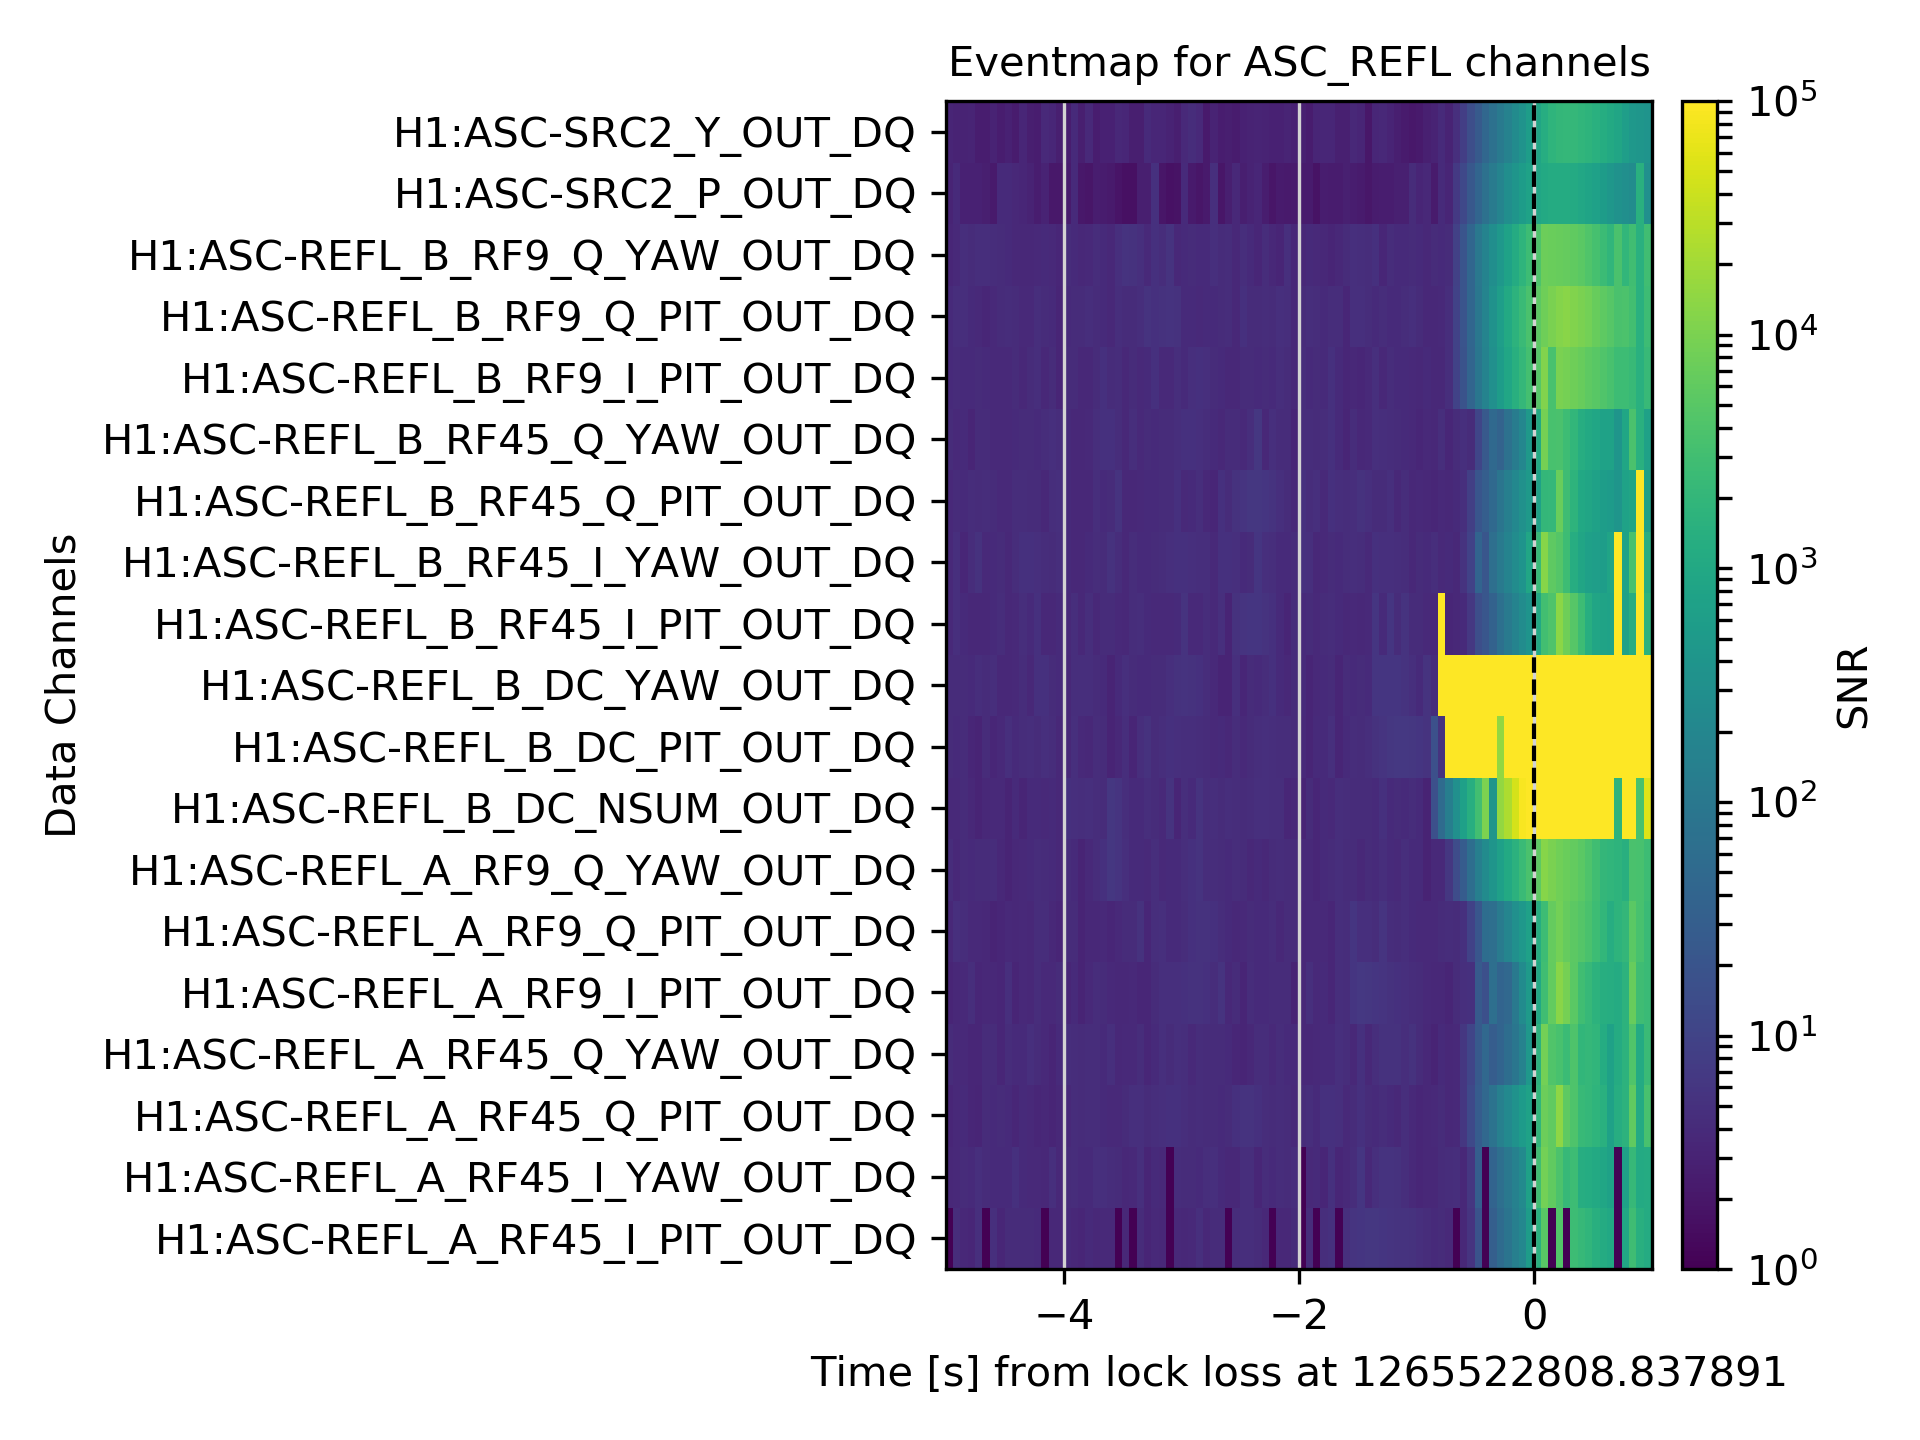
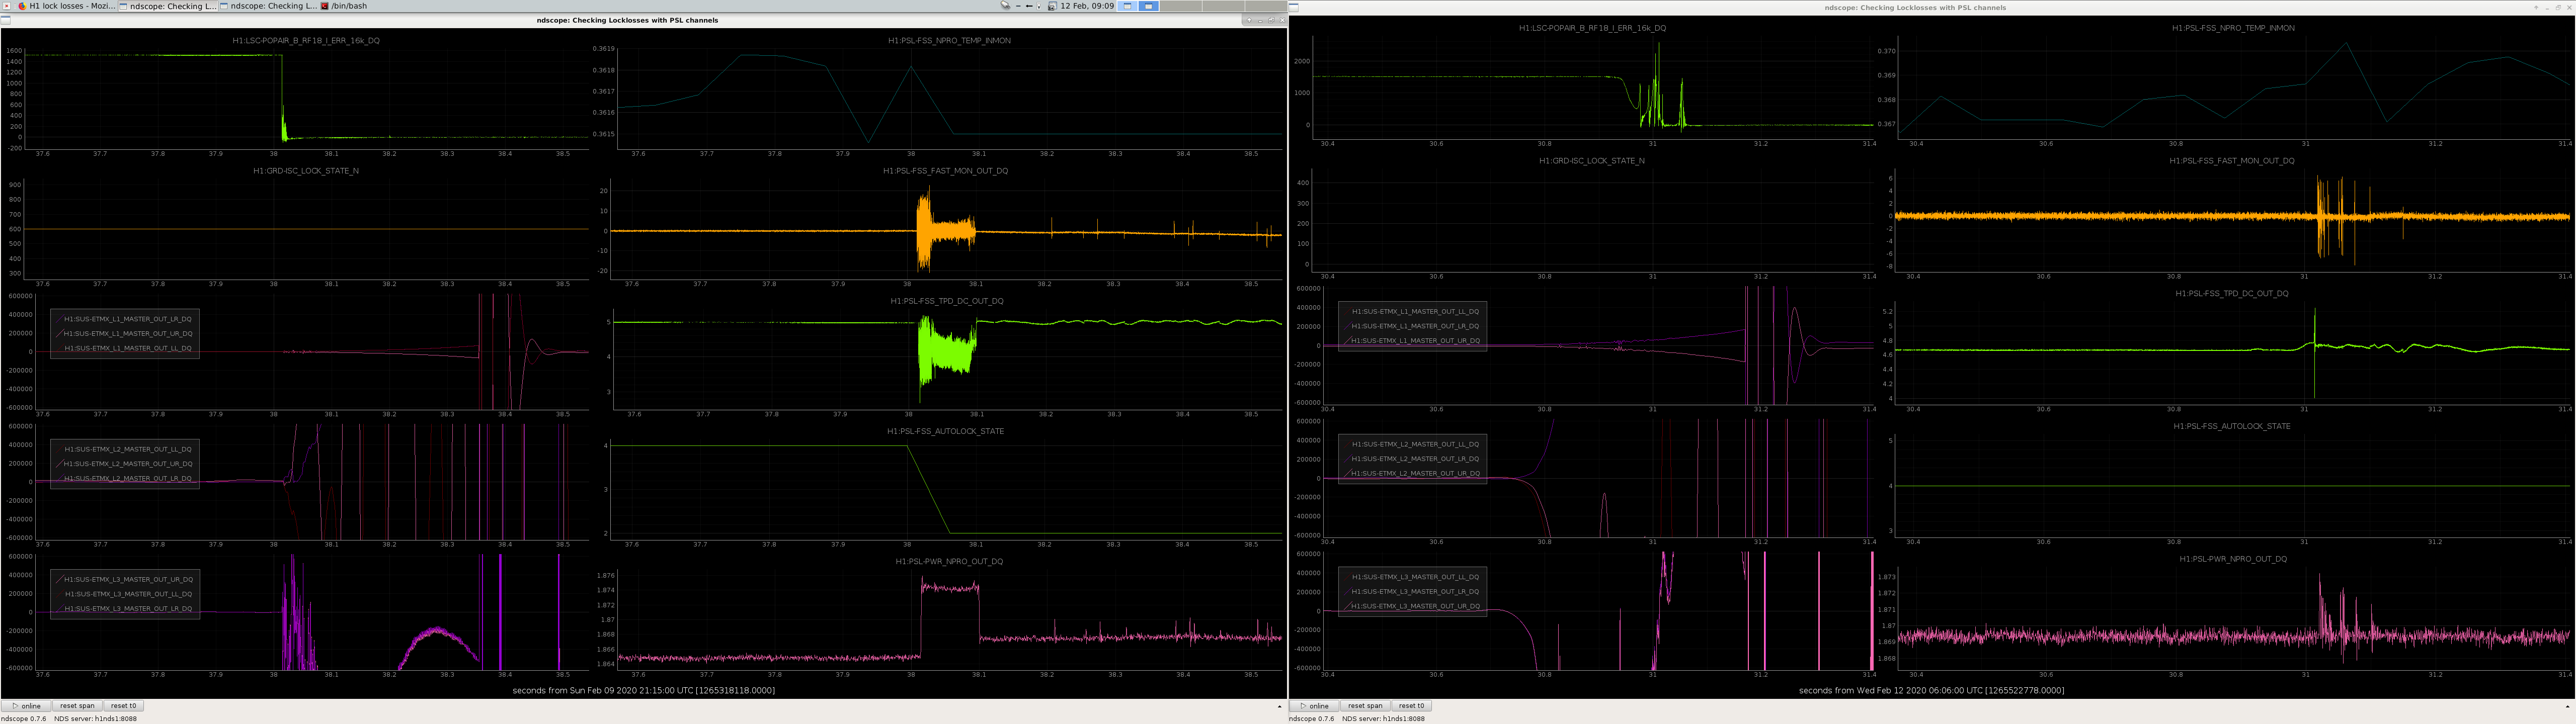
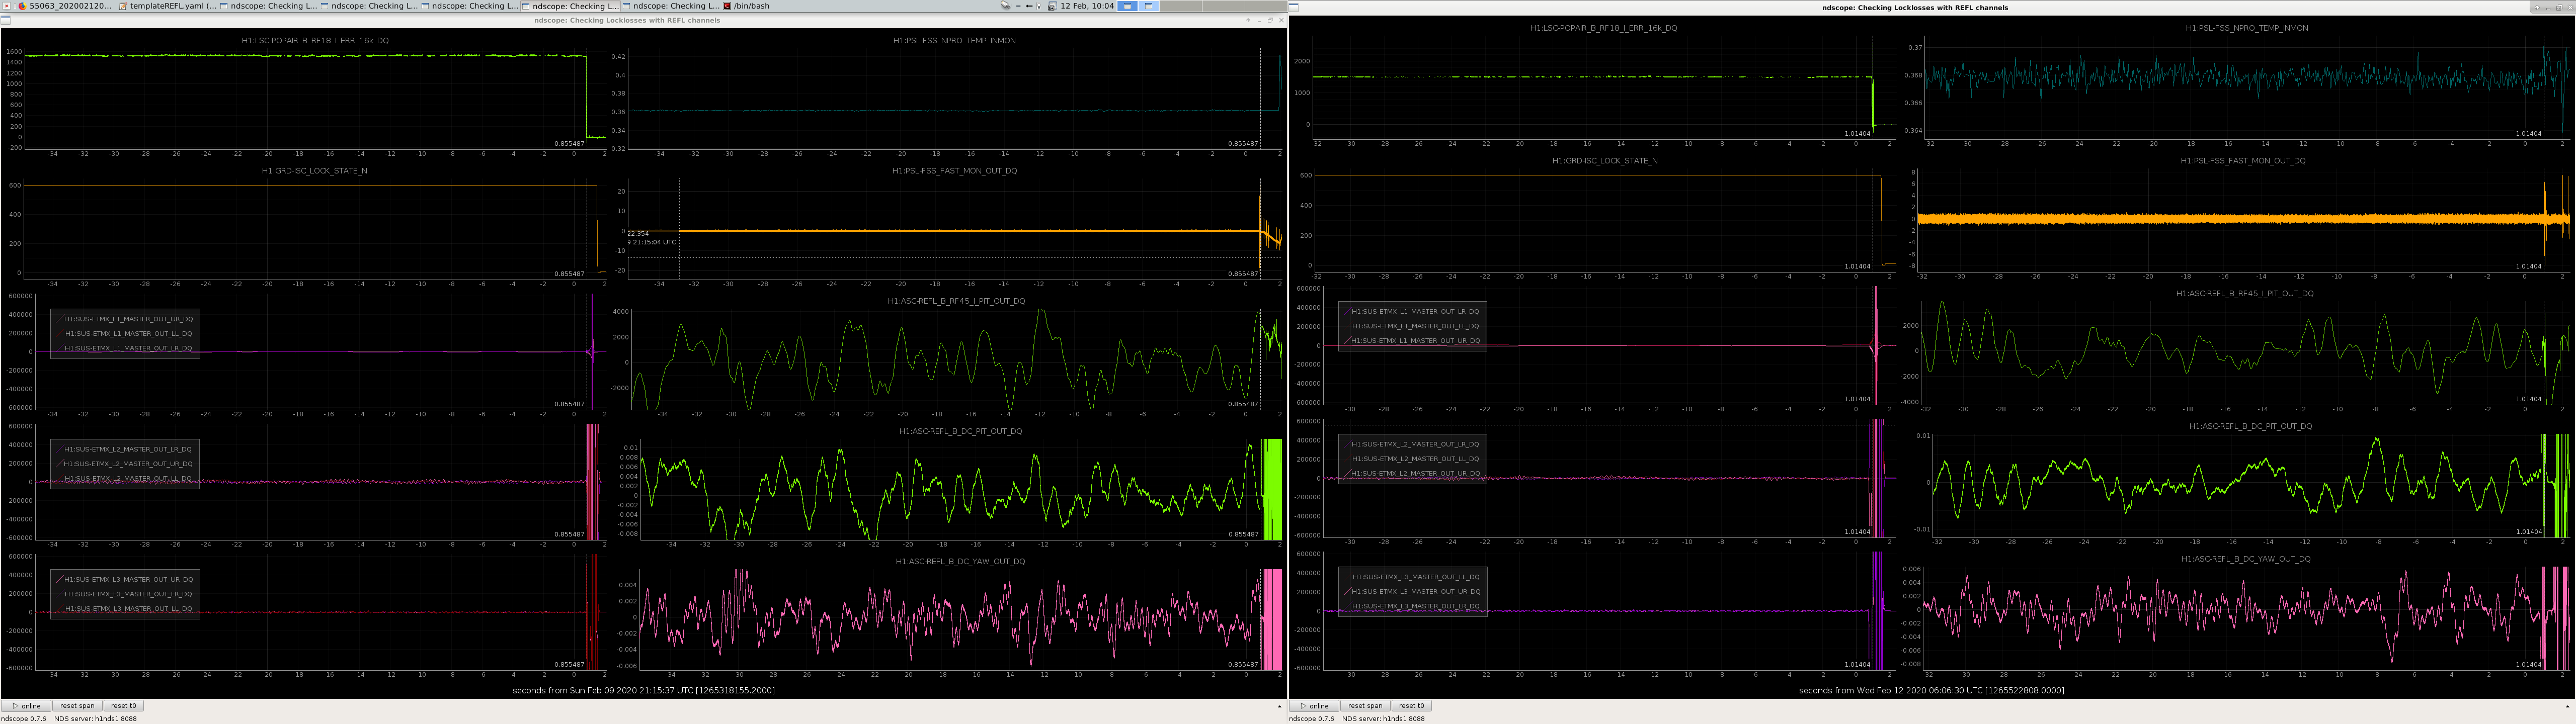
A lockloss on 9 Feb 2020 at 21:15 UTC, and on 12 Feb 2020 at 06:06 UTC, were both suggested as belonging to the catagory "fast lockloss." Both show there are no saturations in ADC Overflow Plots, however both have very similare patterns in Glitch Heatmaps for H1:ASC-REFL_B_RF45_I_PIT_OUT_DQ before lockloss.
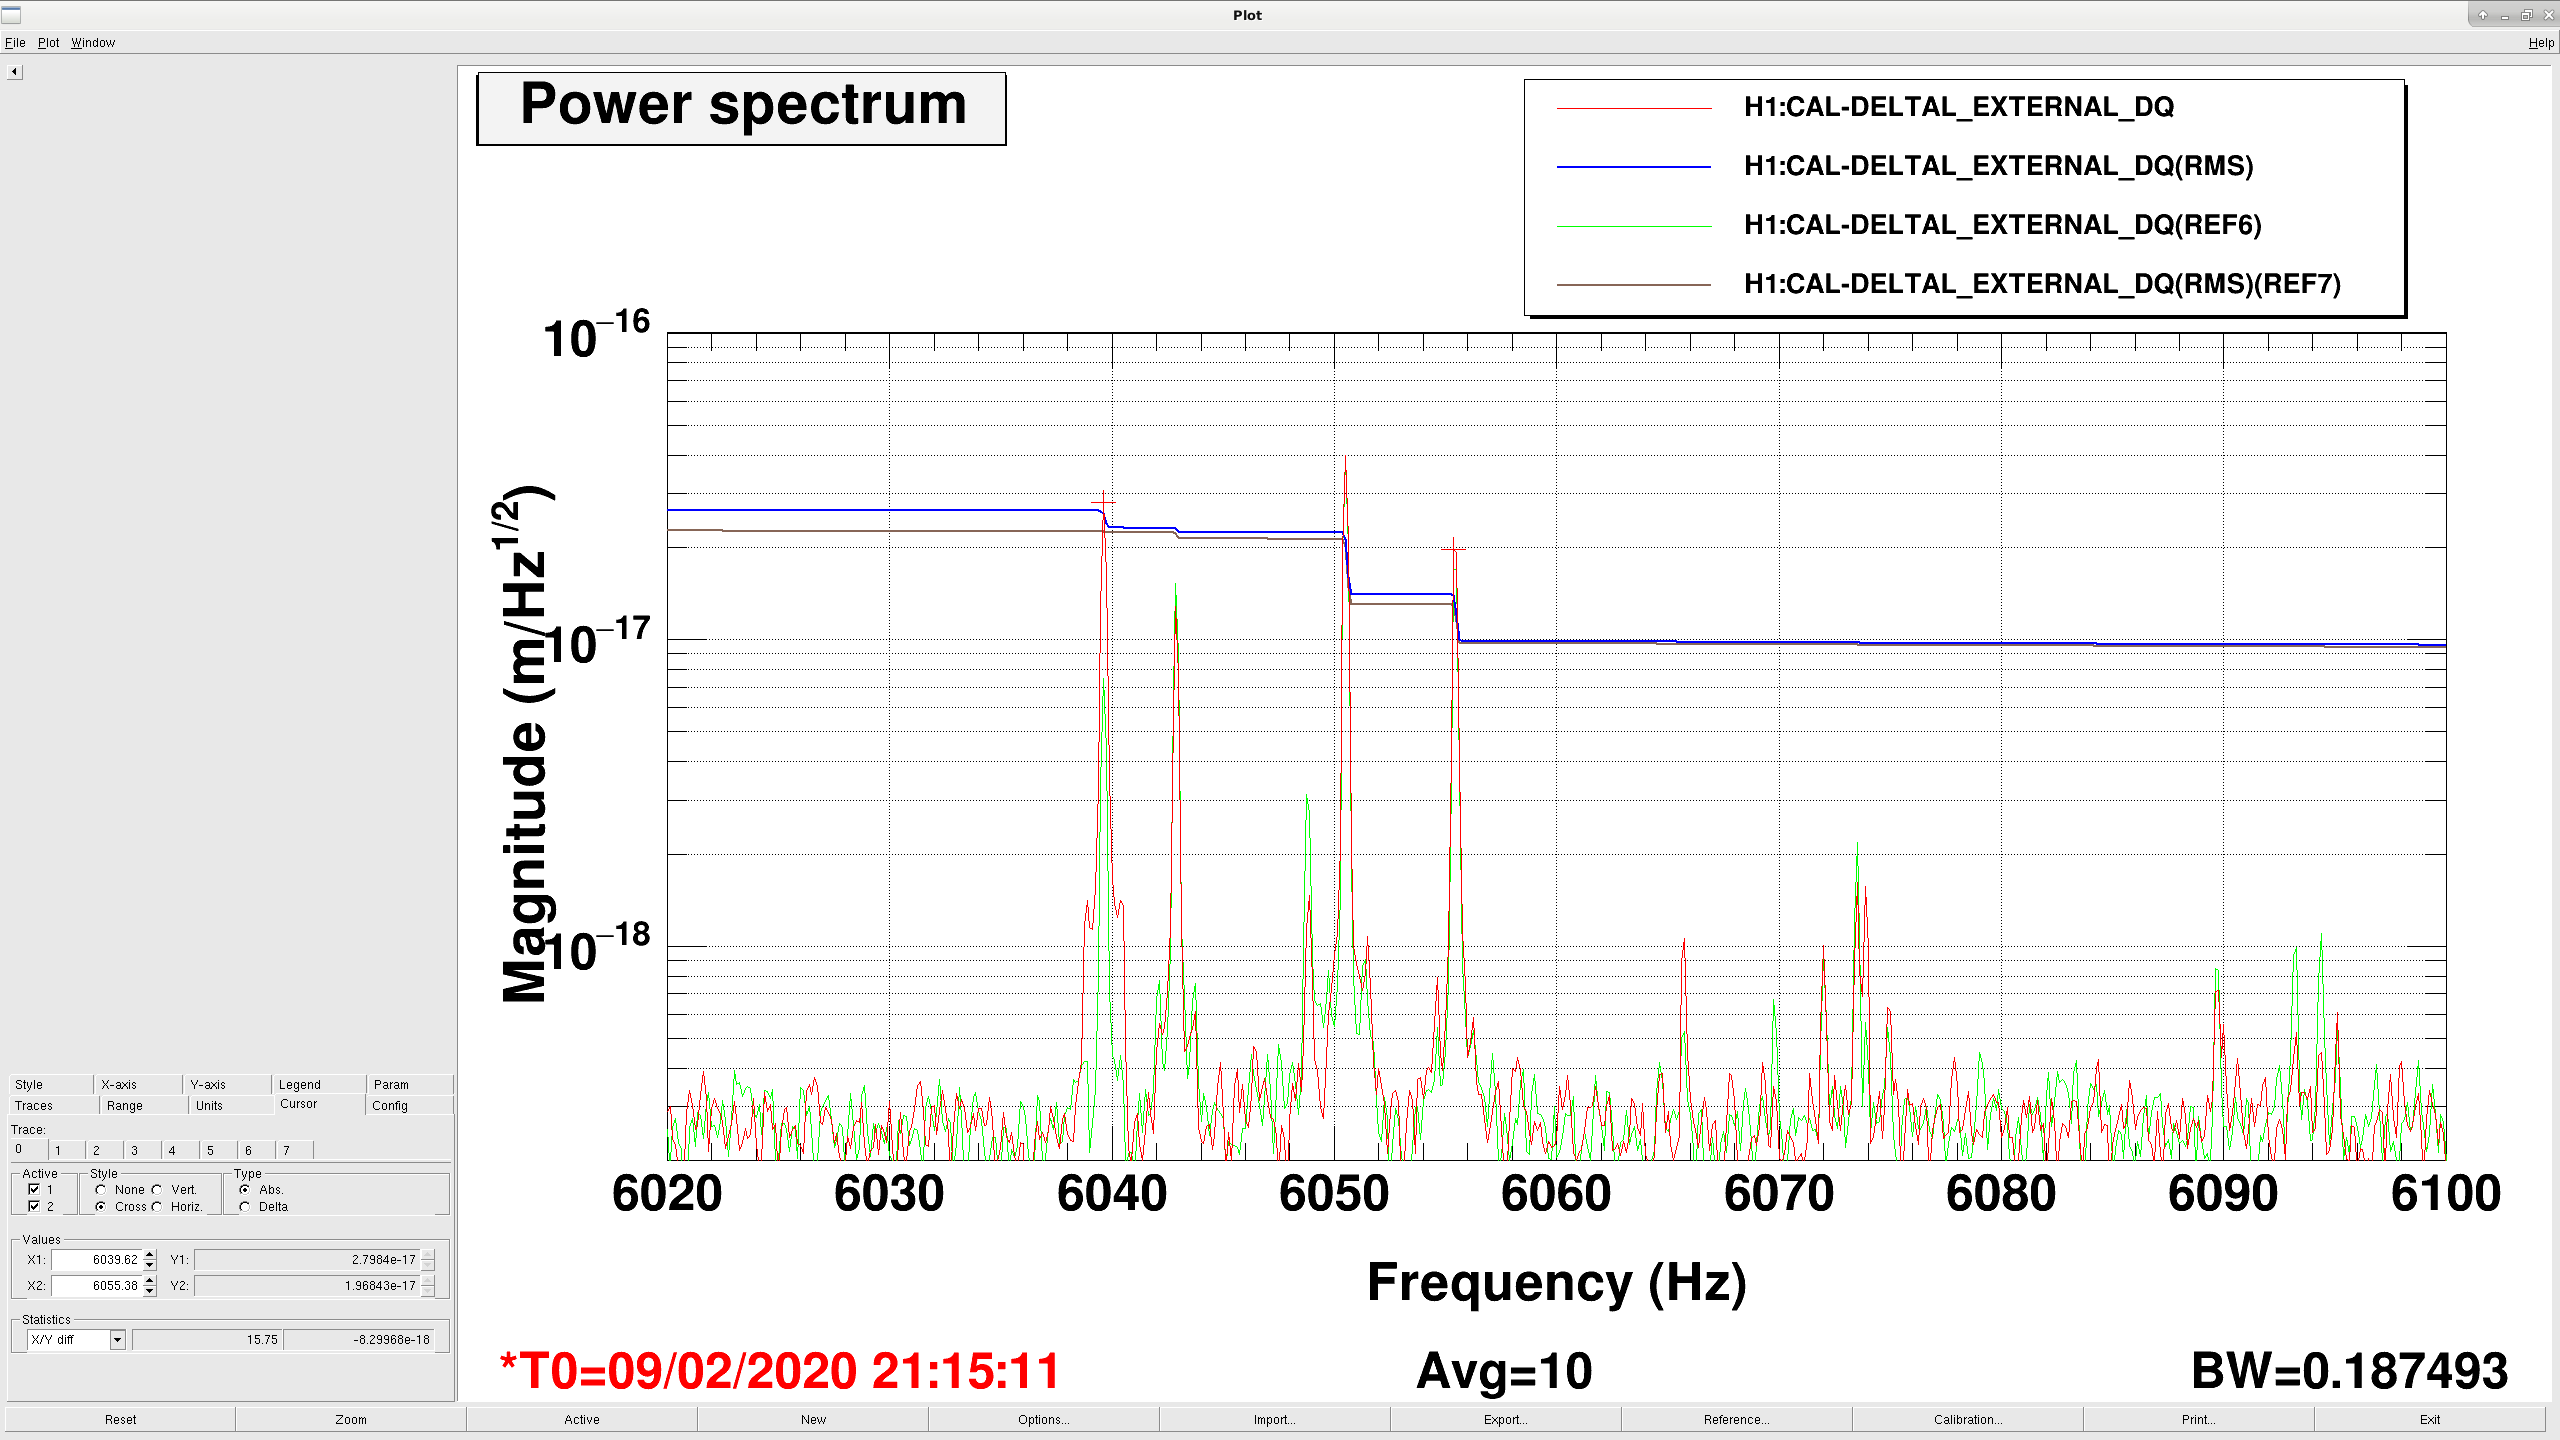
For the lockloss on 9 Feb, the downsampled PI mode peaks in DARM around 6KHz increase near the lockloss, when compared to earlier in the lock.
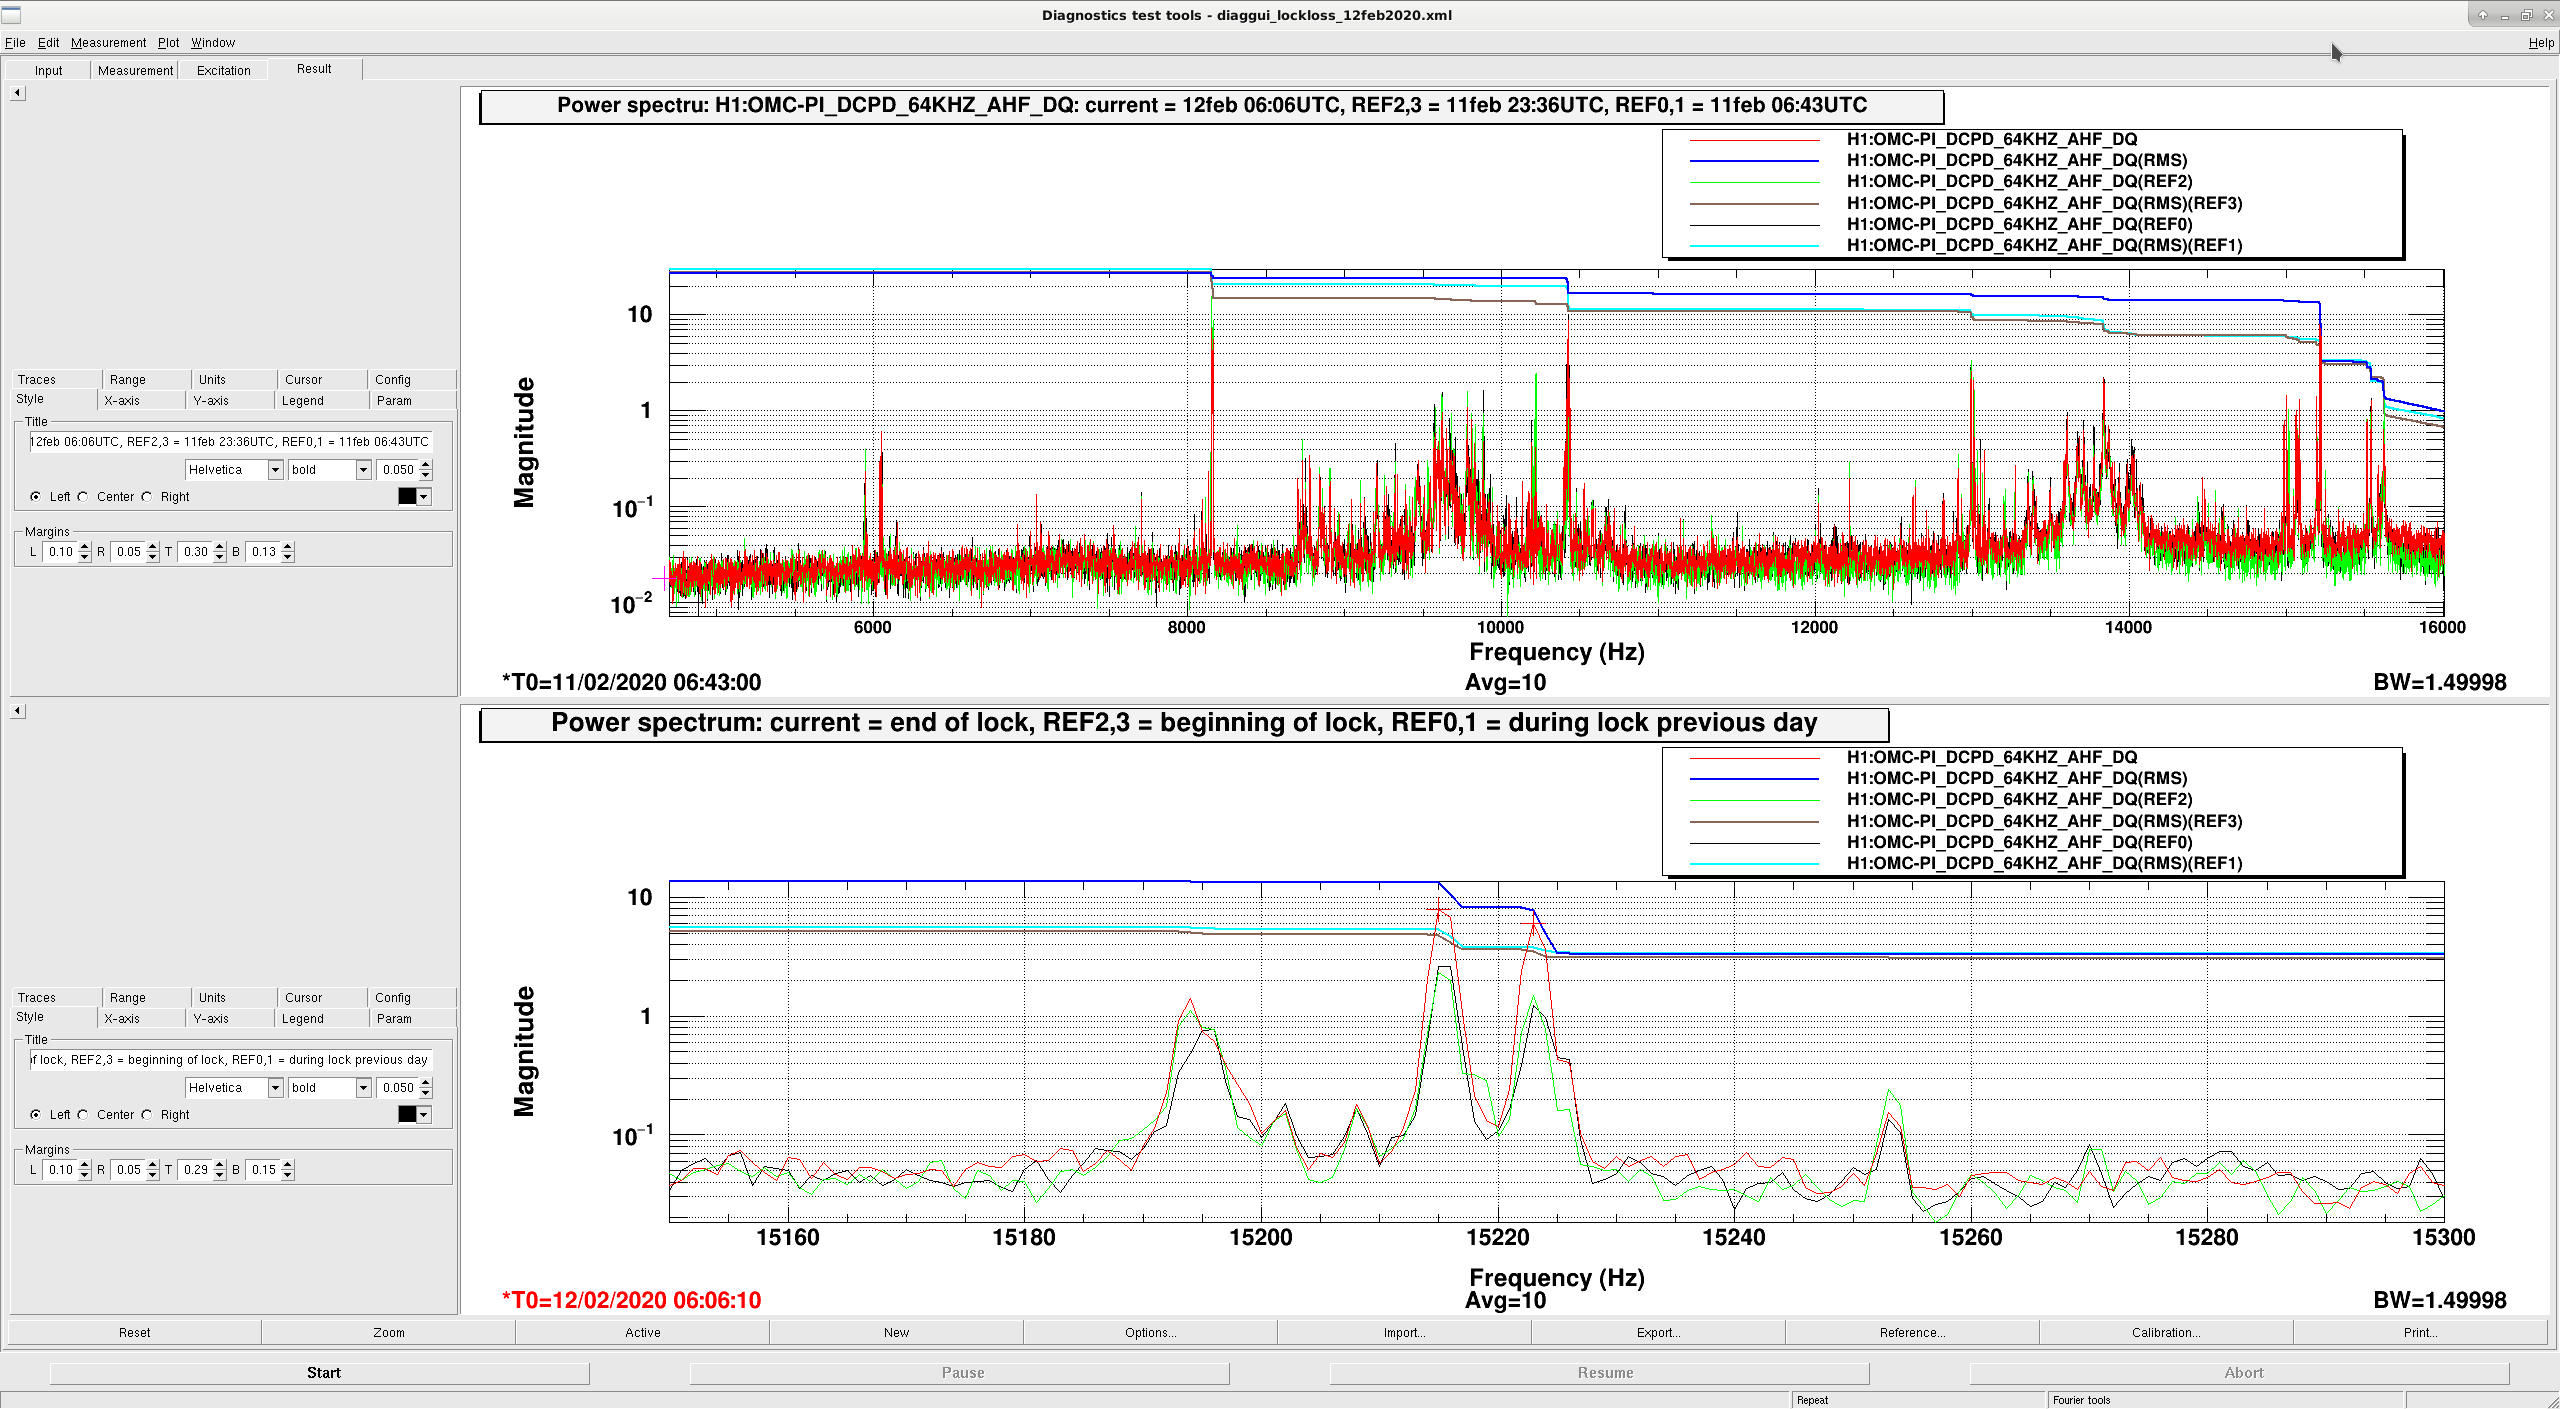
For the lockloss on 12 Feb, the peaks in OMC-PI_DCPD_64K around 15220Hz increase just before the lockloss when compared to earlier in the same lock, and when compared to the middle of the lock on the previous day.
Attached:
Looks very interesting Cheryl!
I would suggest that the two lockloss are quite different though. 09 Feb 2020 21:15 UTC being very fast (1ms), but 12 Feb 2020 06:06 UTC actually being relatively slow (40ms with the ETMX suspension signals starting to saturate 200ms before lockloss). This can see from the attached ndscope plots (1 second in length), using the H1:LSC-POPAIR channel for measuring how long the lockloss took and the 3 bottom left plots for ETMX suspention L1, L2, L3.
TITLE: 02/12 Eve Shift: 00:00-08:00 UTC (16:00-00:00 PST), all times posted in UTC
STATE of H1: Observing at 120Mpc
INCOMING OPERATOR: Patrick
SHIFT SUMMARY: one lockloss
LOG:
H1 relocked on it's own, fully automated, one attempt that made it to NLN, with a DRMI to PRMI back to DRMI automated alignment adjustment.
Today TJ and I entered survey answers manually to record the one-attempt-back-to-NLN relock.
TITLE: 02/12 Owl Shift: 08:00-16:00 UTC (00:00-08:00 PST), all times posted in UTC
STATE of H1: Observing at 120Mpc
OUTGOING OPERATOR: Cheryl
CURRENT ENVIRONMENT:
SEI_CONF state: WINDY
Wind: 11mph Gusts, 9mph 5min avg
Primary useism: 0.03 μm/s
Secondary useism: 0.20 μm/s
QUICK SUMMARY: No issues.
SEIPROC add ramped mux matrix
Jim, Dave:
Jim installed a new h1seiproc, which removes the P5_FADER code section and adds four 2-element ramped mux matrix parts (one per test mass).
New guardian node IFO_NOTIFY
TJ, Dave:
The new guardian node creates a state which will permit the lock loss alerting system to notify that there are locking issues which need attention. I modified the lock-loss-alert code to service this request and the new code is being tested.
DAQ Restart:
For above changes. h1edc was restarted for the guardian node addition.
Slow Controls EX temporary photodiode removal, MEDM modified
Richard, Dave:
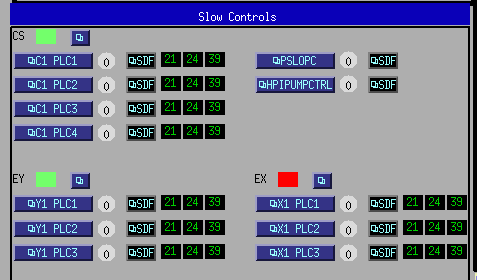
The EX slow controls system will run in a hardware error state for the next week. To 'UN_RED' the CDS overview screen, I have taken EX out of the condition to make the large red header block visible. The EX small red rectangle will remain RED. Image of the new nominal is attached.
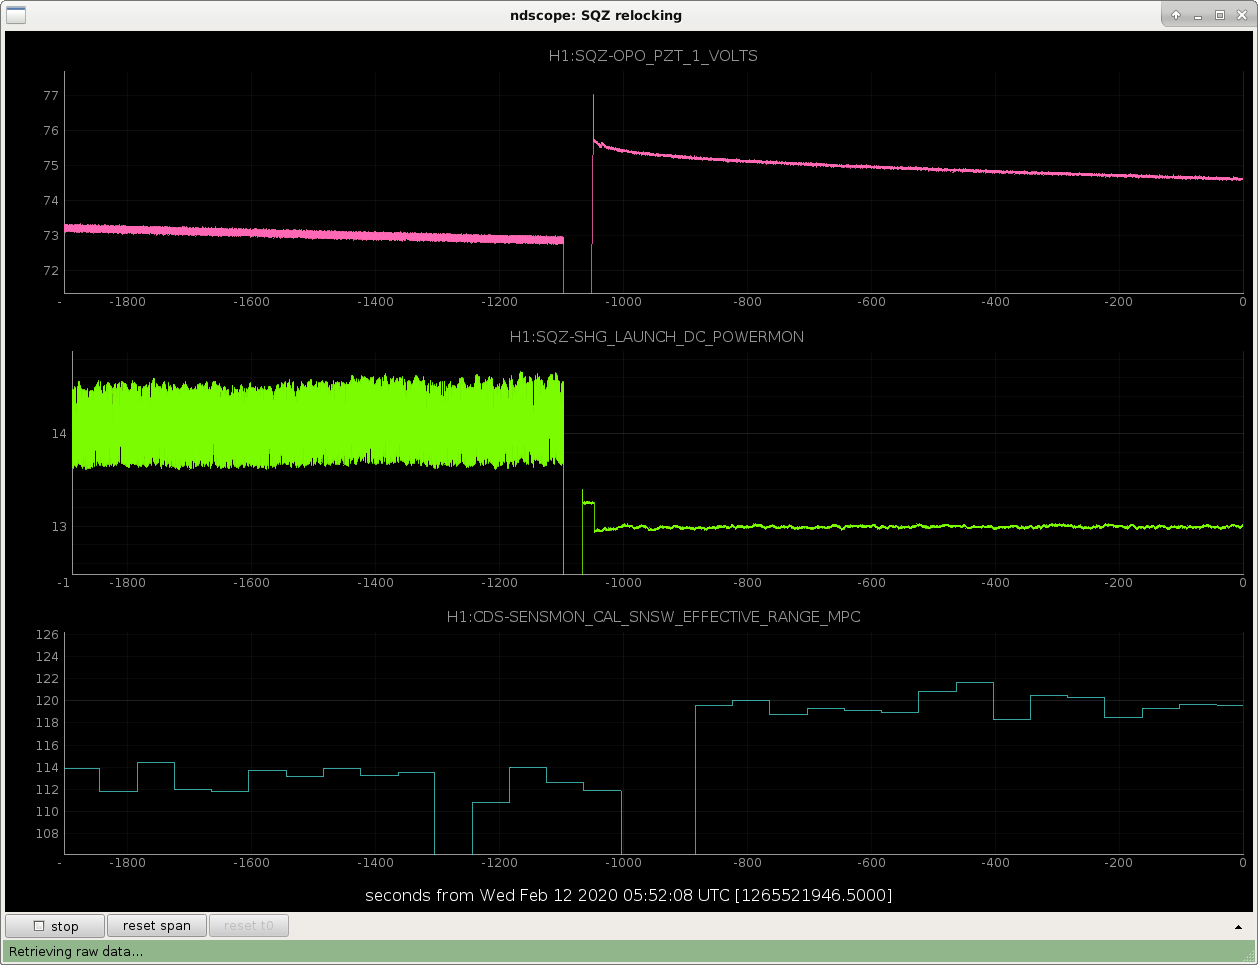
H1 has been in Observe. The range has been droping and recovering. The wind has certainly had an effect on the range, however, subjectively it looks like something else is in there. Both Robert and I independently had this observation. I've been checking SQZ, and looking at some of the channels that grow in amplitude and show and increase in DC levels when SQZ is effecting the range, and the channels are not showing that change. I did notice that a couple days ago when Patrick unlocked and relocked SQZ, to correct it's effect on range, the PZT1 dropped from around 80 to around 20. The PZT is currently around 80, so maybe there's something there? Winds have been mostly above 10mph, with some spikes up to 40mph.
J. Kissel I've processed yesterday's measurement suite (see LHO aLOG 55018) to the point where I've been able to add it to the collection of measurements used to produce an estimate of the unknown, frequency-dependent (but time independent) systematic error in the model (i.e. the Gaussian Process Regression of the measurement collection's residual frequency dependence after the model has been divided out of the measurement, and the measurement has been compensated for time dependence). I've done this for four reasons: (1) To confirm that most of the response function uncertainty in the middle frequency range (20-300 Hz) is dominated by the uncertainty in this estimate of unknown systematic error (2) I've always been curious how much "one more data set" gathered improves the overall uncertainty (you would guess it should improve by sqrt(N), but N is different for each of the four model components -- C, A_UIM, A_PUM, and A_TST -- and the digital filtering on each of these components means that the contribute to the uncertainty in a sophisticated, frequency dependent way that is in no way easy to predict) (3) In the event that we *do* throw away the data prior to 2020-11-12's fix to the known PCAL systematic error (aka PCALSYSERR) because it's easier than figuring out how to salvage the data prior, as alluded to in LHO aLOG 55007, then I'd like to see as much PCALSYSERR-free data included in the estimate as possible (4) To see if adding "one more data set" would help us "resolve" the discrepancy we see between a processed GDS-CALIB_STRAIN in the presence of a broad-band PCALY injection. The results satisfy (1) through (3) positively, but they leave (4) unresolved. See the attached figure, which shows the two uncertainty envelopes from 2020-02-07 (i.e. LHO aLOG 55007) and 2020-02-11 (today, this aLOG) compare against the same 2020-01-13 pre-processed GDS transfer function data (from LHO aLOG 54565). We see improvement (frequency dependent, of course) with the addition of the 2020-02-10 measurement suite. This confirms (1), and demonstrates (2) that we're still in the "winning" region of 1/sqrt(N) for the actuator, given that the number of measurements, N, is 5 to 6 for each stage. Since we measure it every week, the sensing function measurement number 13, so we don't see "as much" improvement above ~100 Hz where the sensing function's contribution to the response function is dominant. Addressing (3) the improvement (again, it's frequency dependent -- look at the plot -- so in this sentence I'm just using "verbal" numbers to describe what I see) at ~50 Hz is about 0.5% / 0.25 deg -- and when you're talking about a budget that is achieving a 3-4% / 1-2 degree level, that's pretty substantial. So, for the next few calibration measurement days, I might start getting actuator data too (i.e., until N gets large, increase the frequency of measuring the actuator suite from ~twice a month to once a week). As far as (4) -- In the region that we're seeing the largest discrepancy between median predicted systematic error (plus uncertainty) and the measured systematic error between PCAL and the final product -- between 40 Hz and 150 Hz -- the uncertainty remains too large to "resolve" the discrepancy. In fact -- if we focus on exactly 100 Hz, I'm now pretty confident that we're limited by the overall PCAL uncertainty (a frequency independent 0.54%) and *not* the GPR uncertainty, so this discrepancy may never get resolved. I still would like to see - a different day's broad band injection process and put on this plot, and - all of the swept sine transfer functions for which we only have CAL-DELTAL_EXTERNAL, but properly corrected for time-dependence, such that the comparison with this "reference time" envelope is valid and we can see how the envelope compares to measurement across all frequencies from 5 to 5000 Hz, before declaring that "it won't get any better than this -- let's release this envelope!" Stay tuned for the results of that work. Also -- remember, this envelope will likely *not* be valid for the first 2 hours of every lock stretch. Analysis of showing the systematic error as the IFO thermalizes (based on the data from LHO aLOG 53951) is underway.
Information about how the 2020-02-11 uncertainty envelope was created:
To produce the new GPR fits:
/ligo/svncommon/CalSVN/aligocalibration/trunk/Runs/O3/H1/Scripts/Uncertainty
process_allmeas_writeGPRHDF5_20200211_A_meas20191204-20200210_model20200103_NOPCALSYSERR.py
process_allmeas_writeGPRHDF5_20200211_C_meas20191120-20200210_model20200103_NOPCALSYSERR_withHF.py
committed to rev 9412.
The new HDF5 files from the fit:
2020-02-11_GPR_Run_H1_A_O3B_meas20191204-20200210_collection_model20200103_NOPCALSYSERR_ALL_UIM_f7-250Hz_L0p1_PUM_f7-500Hz_L0p2_TST_f10-1000Hz_L0p5_posteriors.hdf5
2020-02-11_GPR_Run_H1_C_O3B_meas20191120-20200210_collection_model20200103_NOPCALSYSERR_nofsQcorr_MCMCfmin20Hz_GPRfmin20_lengthscale0p35_withPCALXHFdata_model20200103_posteriors.hdf5
committed to rev 9413.
The updated call to RRNom.py:
python3.5 /ligo/svncommon/CalSVN/aligocalibration/trunk/Common/pyDARM/RRNom.py --IFO=LHO --HDF5_A_MCMCresults=/ligo/svncommon/CalSVN/aligocalibration/trunk/Runs/O3/H1/Results/Uncertainty/O3B_H1_A_MCMC_20200103Model_REF.hdf5 --HDF5_A_GPRresults=/ligo/svncommon/CalSVN/aligocalibration/trunk/Runs/O3/H1/Results/Uncertainty/2020-02-11_GPR_Run_H1_A_O3B_meas20191204-20200210_collection_model20200103_NOPCALSYSERR_ALL_UIM_f7-250Hz_L0p1_PUM_f7-500Hz_L0p2_TST_f10-1000Hz_L0p5_posteriors.hdf5 --HDF5_C_MCMCresults=/ligo/svncommon/CalSVN/aligocalibration/trunk/Runs/O3/H1/Results/Uncertainty/O3_H1_C_MCMC_2019-12-26_forreference_fmin20Hz.hdf5 --HDF5_C_GPRresults=/ligo/svncommon/CalSVN/aligocalibration/trunk/Runs/O3/H1/Results/Uncertainty/2020-02-11_GPR_Run_H1_C_O3B_meas20191120-20200210_collection_model20200103_NOPCALSYSERR_nofsQcorr_MCMCfmin20Hz_GPRfmin20_lengthscale0p35_withPCALXHFdata_model20200103_posteriors.hdf5 --modelPath=/ligo/svncommon/CalSVN/aligocalibration/trunk/Runs/O3/H1/params/ --modelFilename=modelparams_H1_20200103 --IFOmodel=modelPars --sampleNumber=1000 --seed=1111 --version=ref --outDir=/ligo/svncommon/CalSVN/aligocalibration/trunk/Runs/O3/H1/Results/Uncertainty/ --plot1SigmaUncs --saveSummaries --gpsTime=1261415486
The resulting uncertainty envelope:
/ligo/svncommon/CalSVN/aligocalibration/trunk/Runs/O3/H1/Results/Uncertainty
2020-02-11_O3_LHO_GPSTime_1261415486_ref_RelativeResponse1SigmaUncertainty.png
2020-02-11_O3_LHO_GPSTime_1261415486_ref_RelativeResponseUncertainty_FinalResults.txt
2020-02-11_O3_LHO_GPSTime_1261415486_ref_RelativeResponseUncertainty_MinMax.txt
committed to rev 9414.
The script to produce the attached plot:
/ligo/svncommon/CalSVN/aligocalibration/trunk/Runs/O3/H1/Scripts/FullIFOSensingTFs
plot_GDS_BB_vs_Uncertainty_20200211.py rev 9415
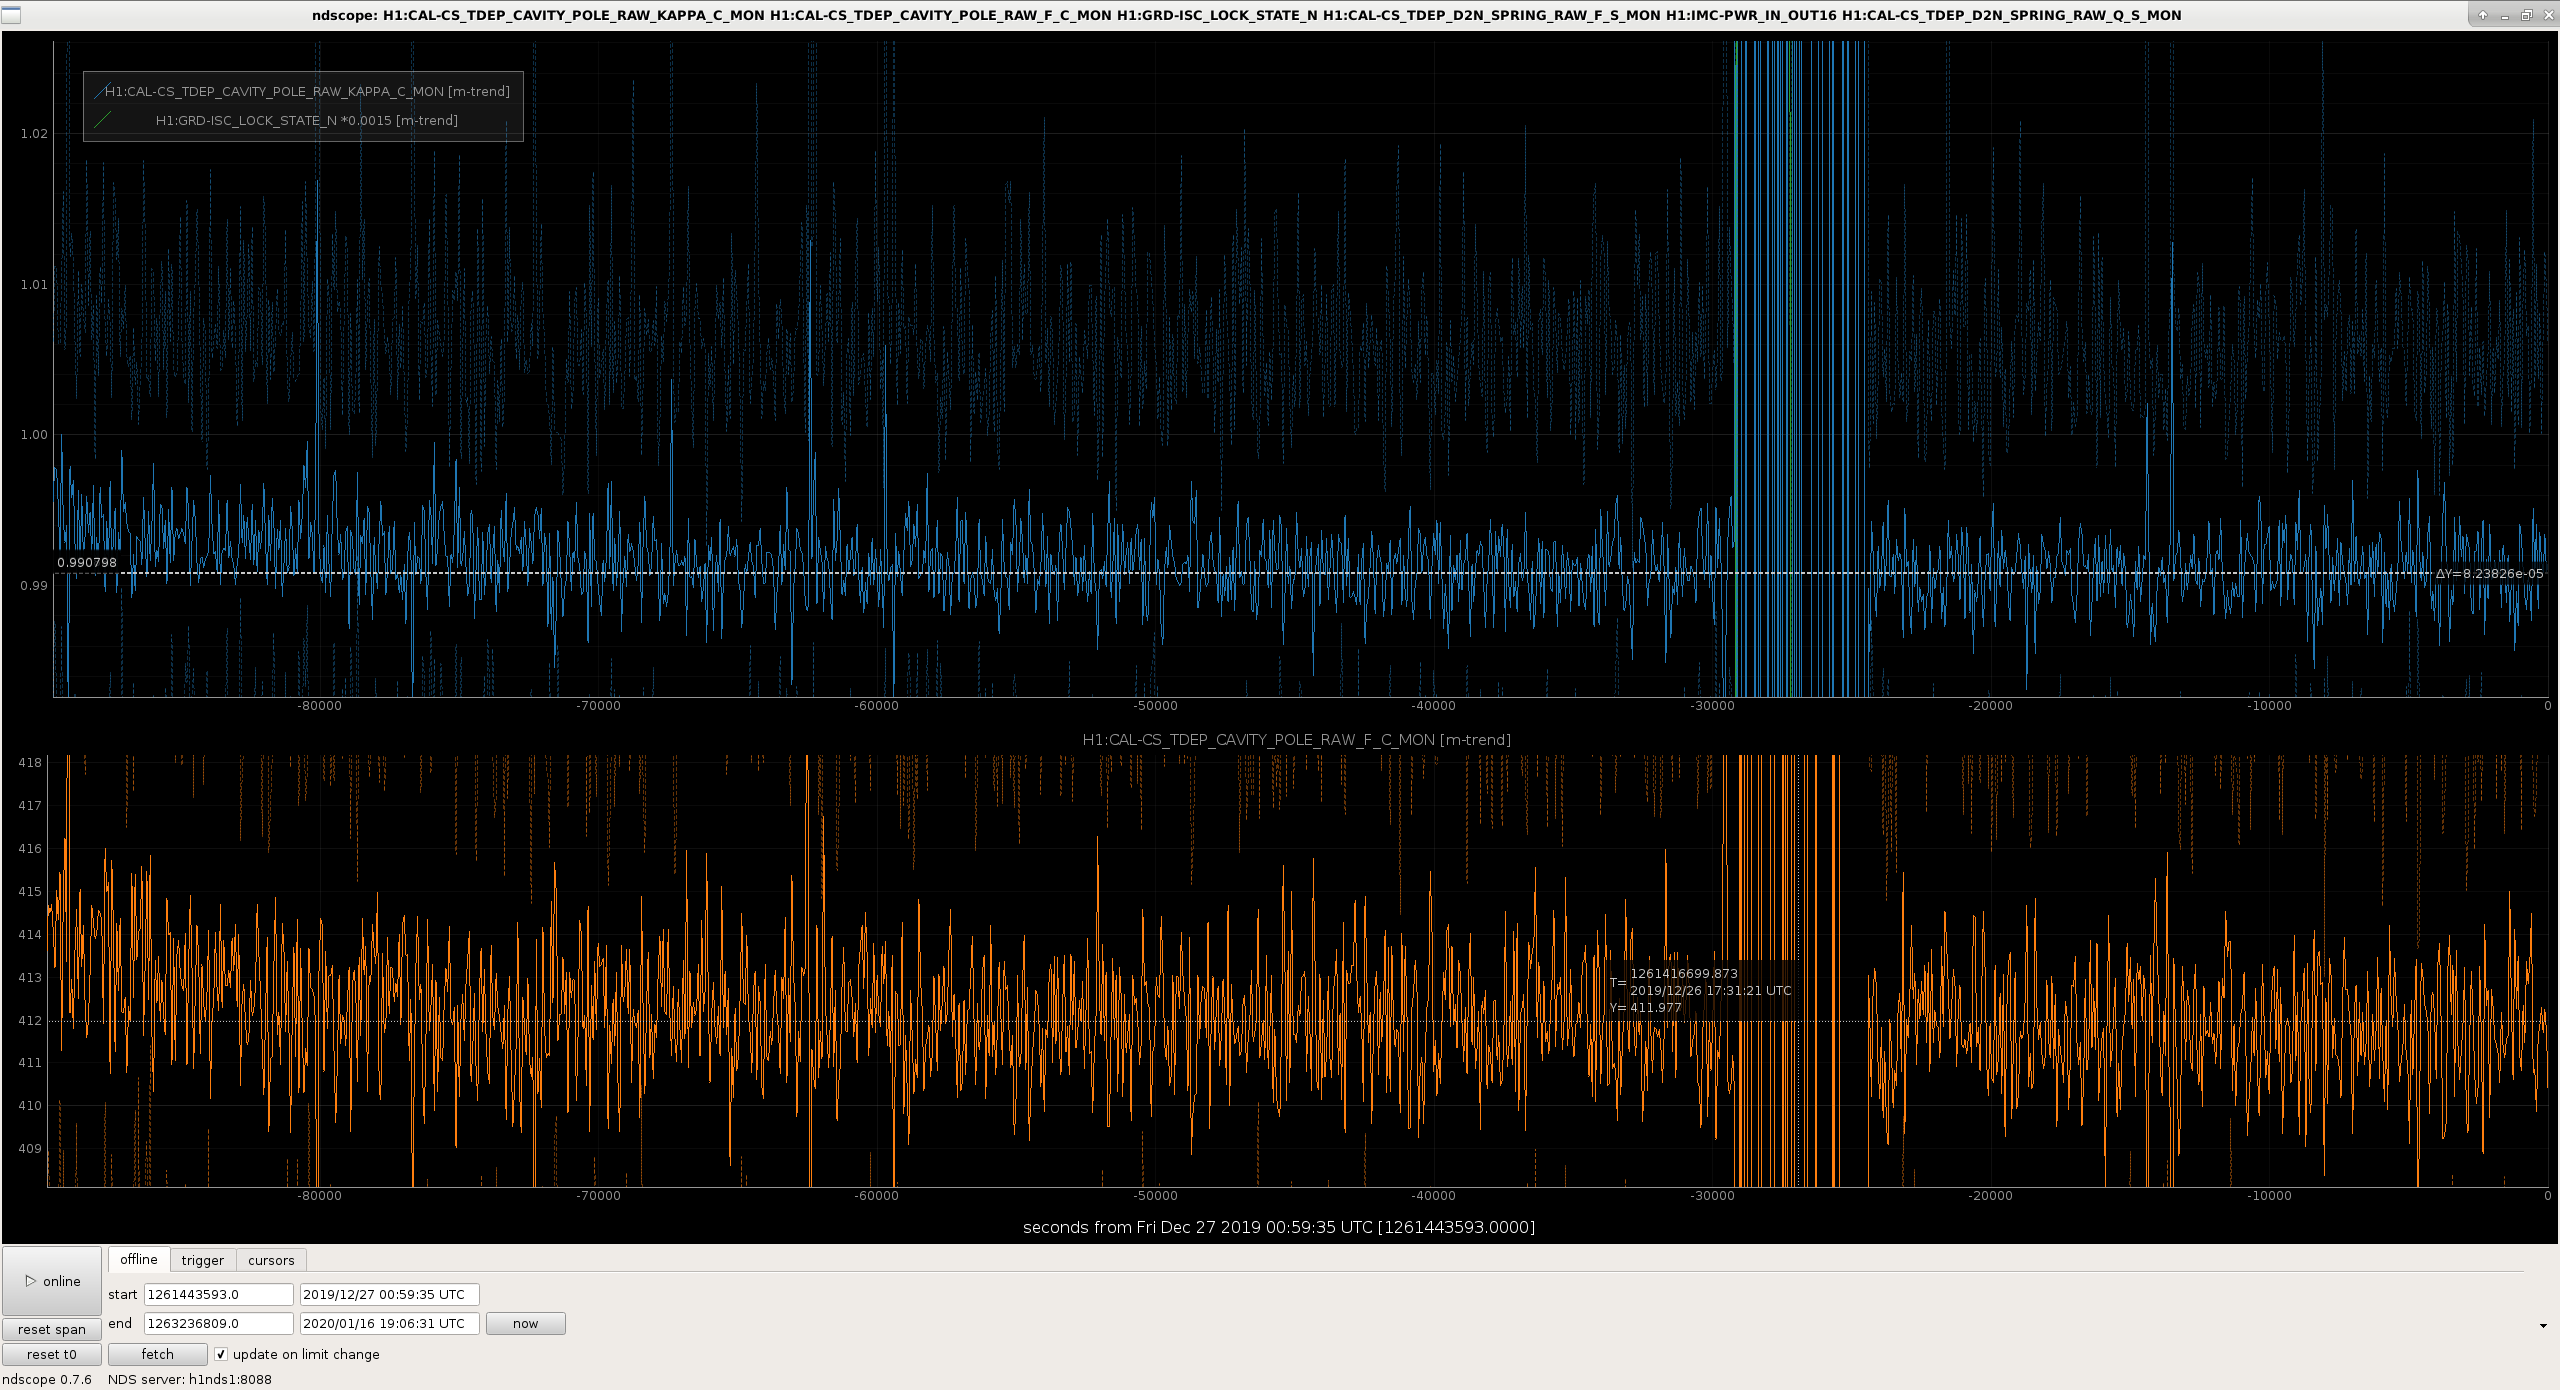
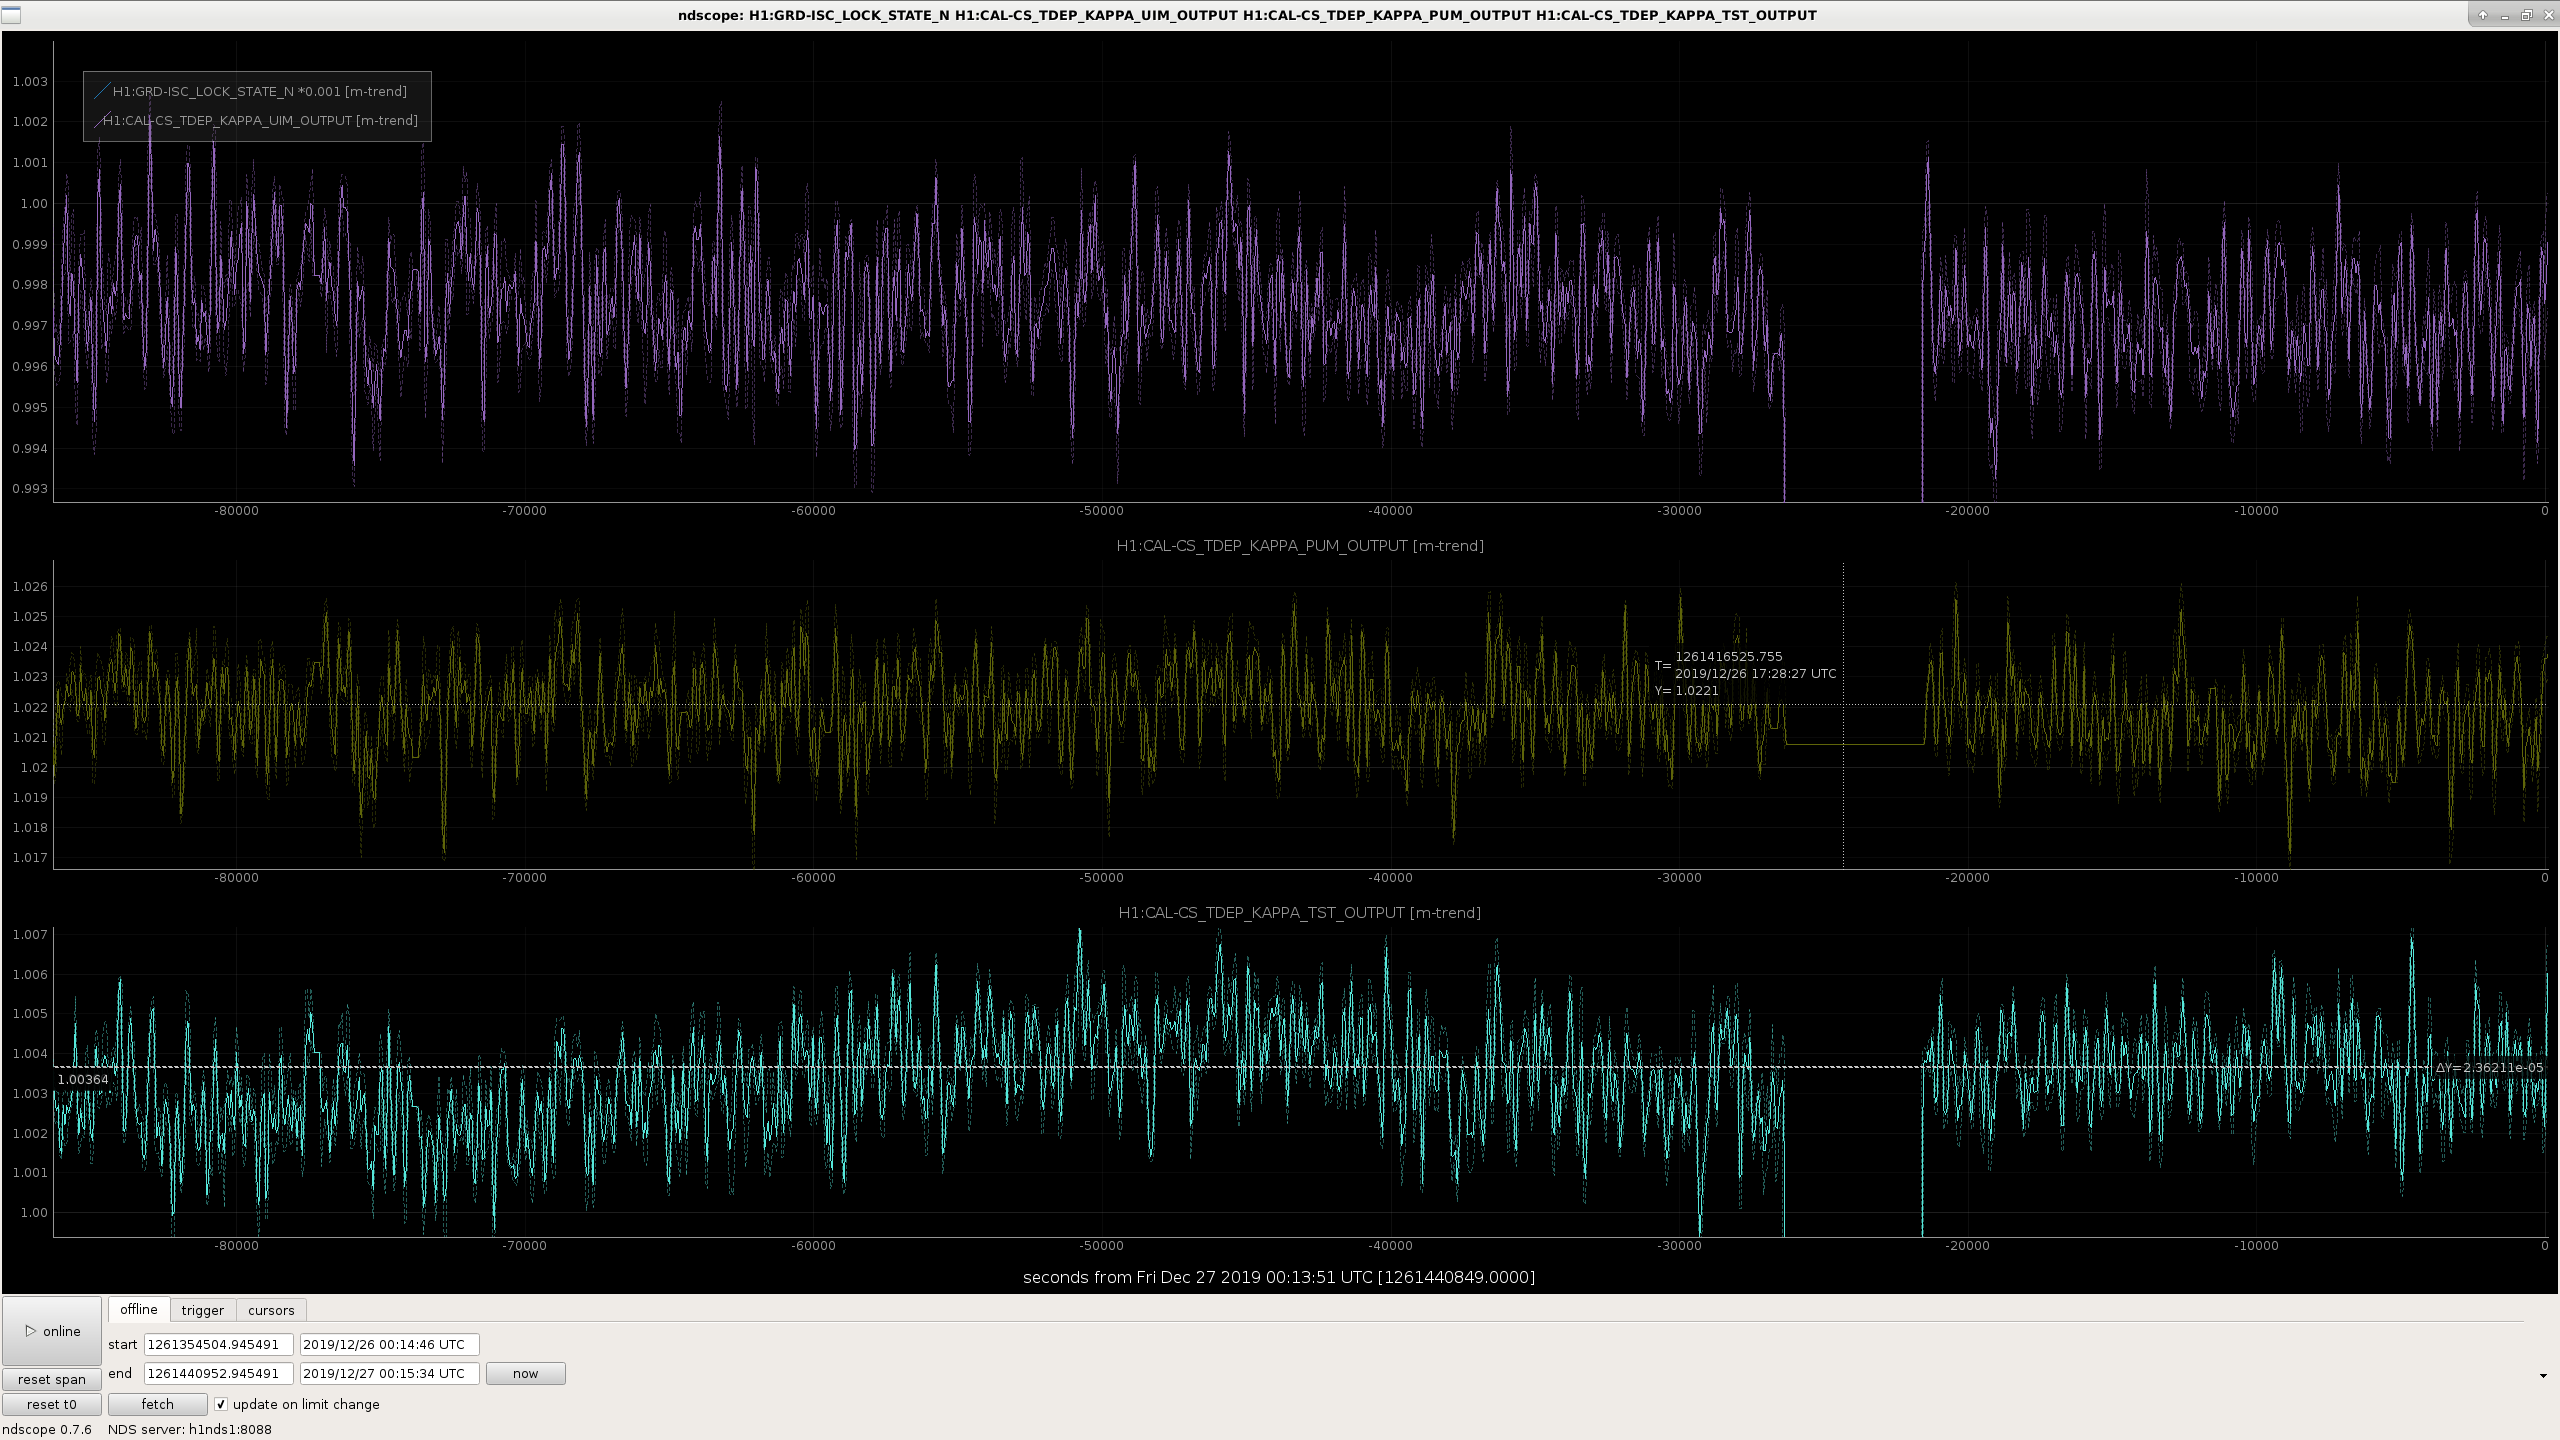
Just trying gather some further clues -- today, I thought "I know that the measured broadband injection shown in these plots has been corrected for TDCFs as per LHO aLOG 54676. That means the measurement has been 'propogated' back to the reference time and is directly comparable to the RRNom-produce uncertainty envelope, using the argument version=ref. But what if we correct the *envelope* for the TDCFs surrounding the reference time?" The results are the *incorrect* thing to do, but they do help in understanding how much impact the TDCFs can make on the estimate. I envoked RRnom with --version=C00, and set the --gpsTime=1261411218 (2019-12-26 16:00 UTC, just *before* the *reference* measurement was taken -- not when the broadband injection was taken), and the data gathering method to --GetData=GWPY, with otherwise everything else identical, python3.5 /ligo/svncommon/CalSVN/aligocalibration/trunk/Common/pyDARM/RRNom.py --IFO=LHO --HDF5_A_MCMCresults=/ligo/svncommon/CalSVN/aligocalibration/trunk/Runs/O3/H1/Results/Uncertainty/O3B_H1_A_MCMC_20200103Model_REF.hdf5 --HDF5_A_GPRresults=/ligo/svncommon/CalSVN/aligocalibration/trunk/Runs/O3/H1/Results/Uncertainty/2020-02-11_GPR_Run_H1_A_O3B_meas20191204-20200210_collection_model20200103_NOPCALSYSERR_ALL_UIM_f7-250Hz_L0p1_PUM_f7-500Hz_L0p2_TST_f10-1000Hz_L0p5_posteriors.hdf5 --HDF5_C_MCMCresults=/ligo/svncommon/CalSVN/aligocalibration/trunk/Runs/O3/H1/Results/Uncertainty/O3_H1_C_MCMC_2019-12-26_forreference_fmin20Hz.hdf5 --HDF5_C_GPRresults=/ligo/svncommon/CalSVN/aligocalibration/trunk/Runs/O3/H1/Results/Uncertainty/2020-02-11_GPR_Run_H1_C_O3B_meas20191120-20200210_collection_model20200103_NOPCALSYSERR_nofsQcorr_MCMCfmin20Hz_GPRfmin20_lengthscale0p35_withPCALXHFdata_model20200103_posteriors.hdf5 --modelPath=/ligo/svncommon/CalSVN/aligocalibration/trunk/Runs/O3/H1/params/ --modelFilename=modelparams_H1_20200103 --IFOmodel=modelPars --sampleNumber=1000 --seed=1111 --version=C00 --outDir=/ligo/svncommon/CalSVN/aligocalibration/trunk/Runs/O3/H1/Results/Uncertainty/ --plot1SigmaUncs --saveSummaries --gpsTime=1261411218 --GetData=GWPY This plot is flawed, because at 2019-12-26 16:00 UTC, GDS was still using the 2019-09-09 model parameter set. That means the TDCFs were computed against the 2019-09-09 model, when we know that the interferometer was behaving more like the 2020-01-03 model parameter set. So, the uncertainty envelope has been corrected for by the *the wrong thing*. In order to truly make this comparison, we should find the uncertainty envelop for a time *after* the CAL-CS / GDS calibration was updated on the 2020-01-13. I compared the uncertainty envelopes against the data just to show what it looks like. We should run this comparison again once we have C01, where all the O3B data has been calibrated with the 2020-01-03 model.
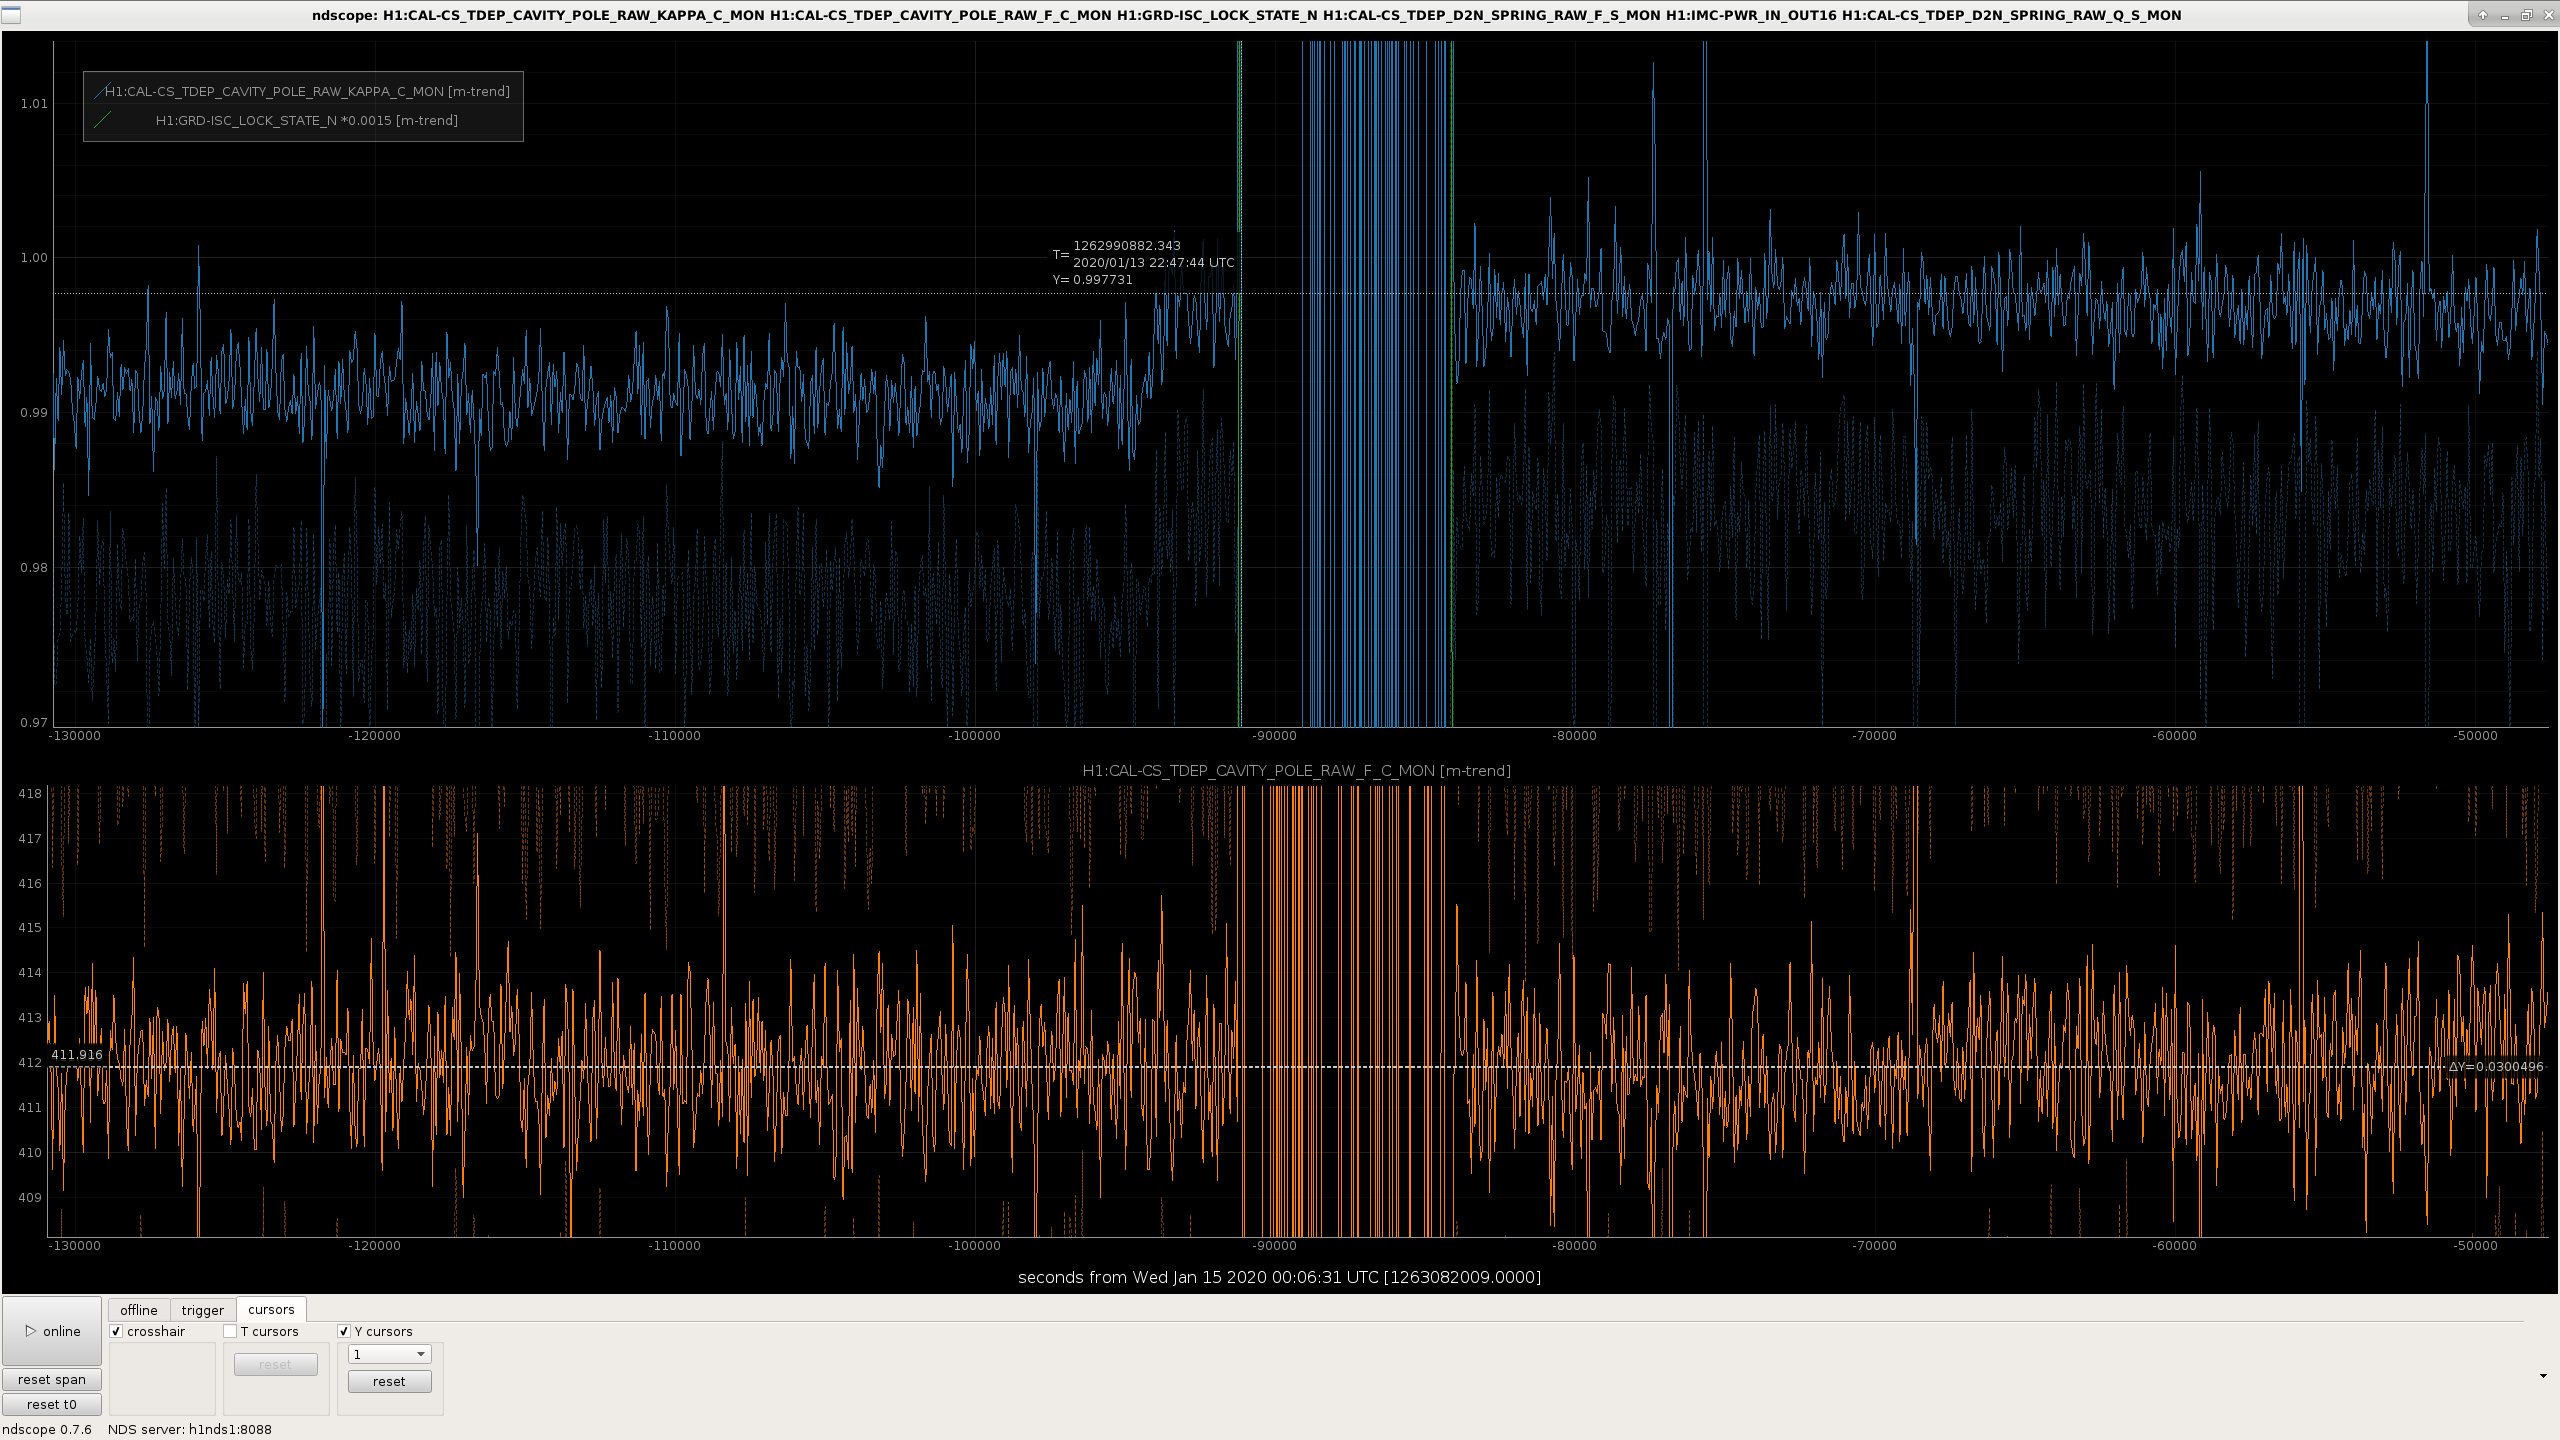
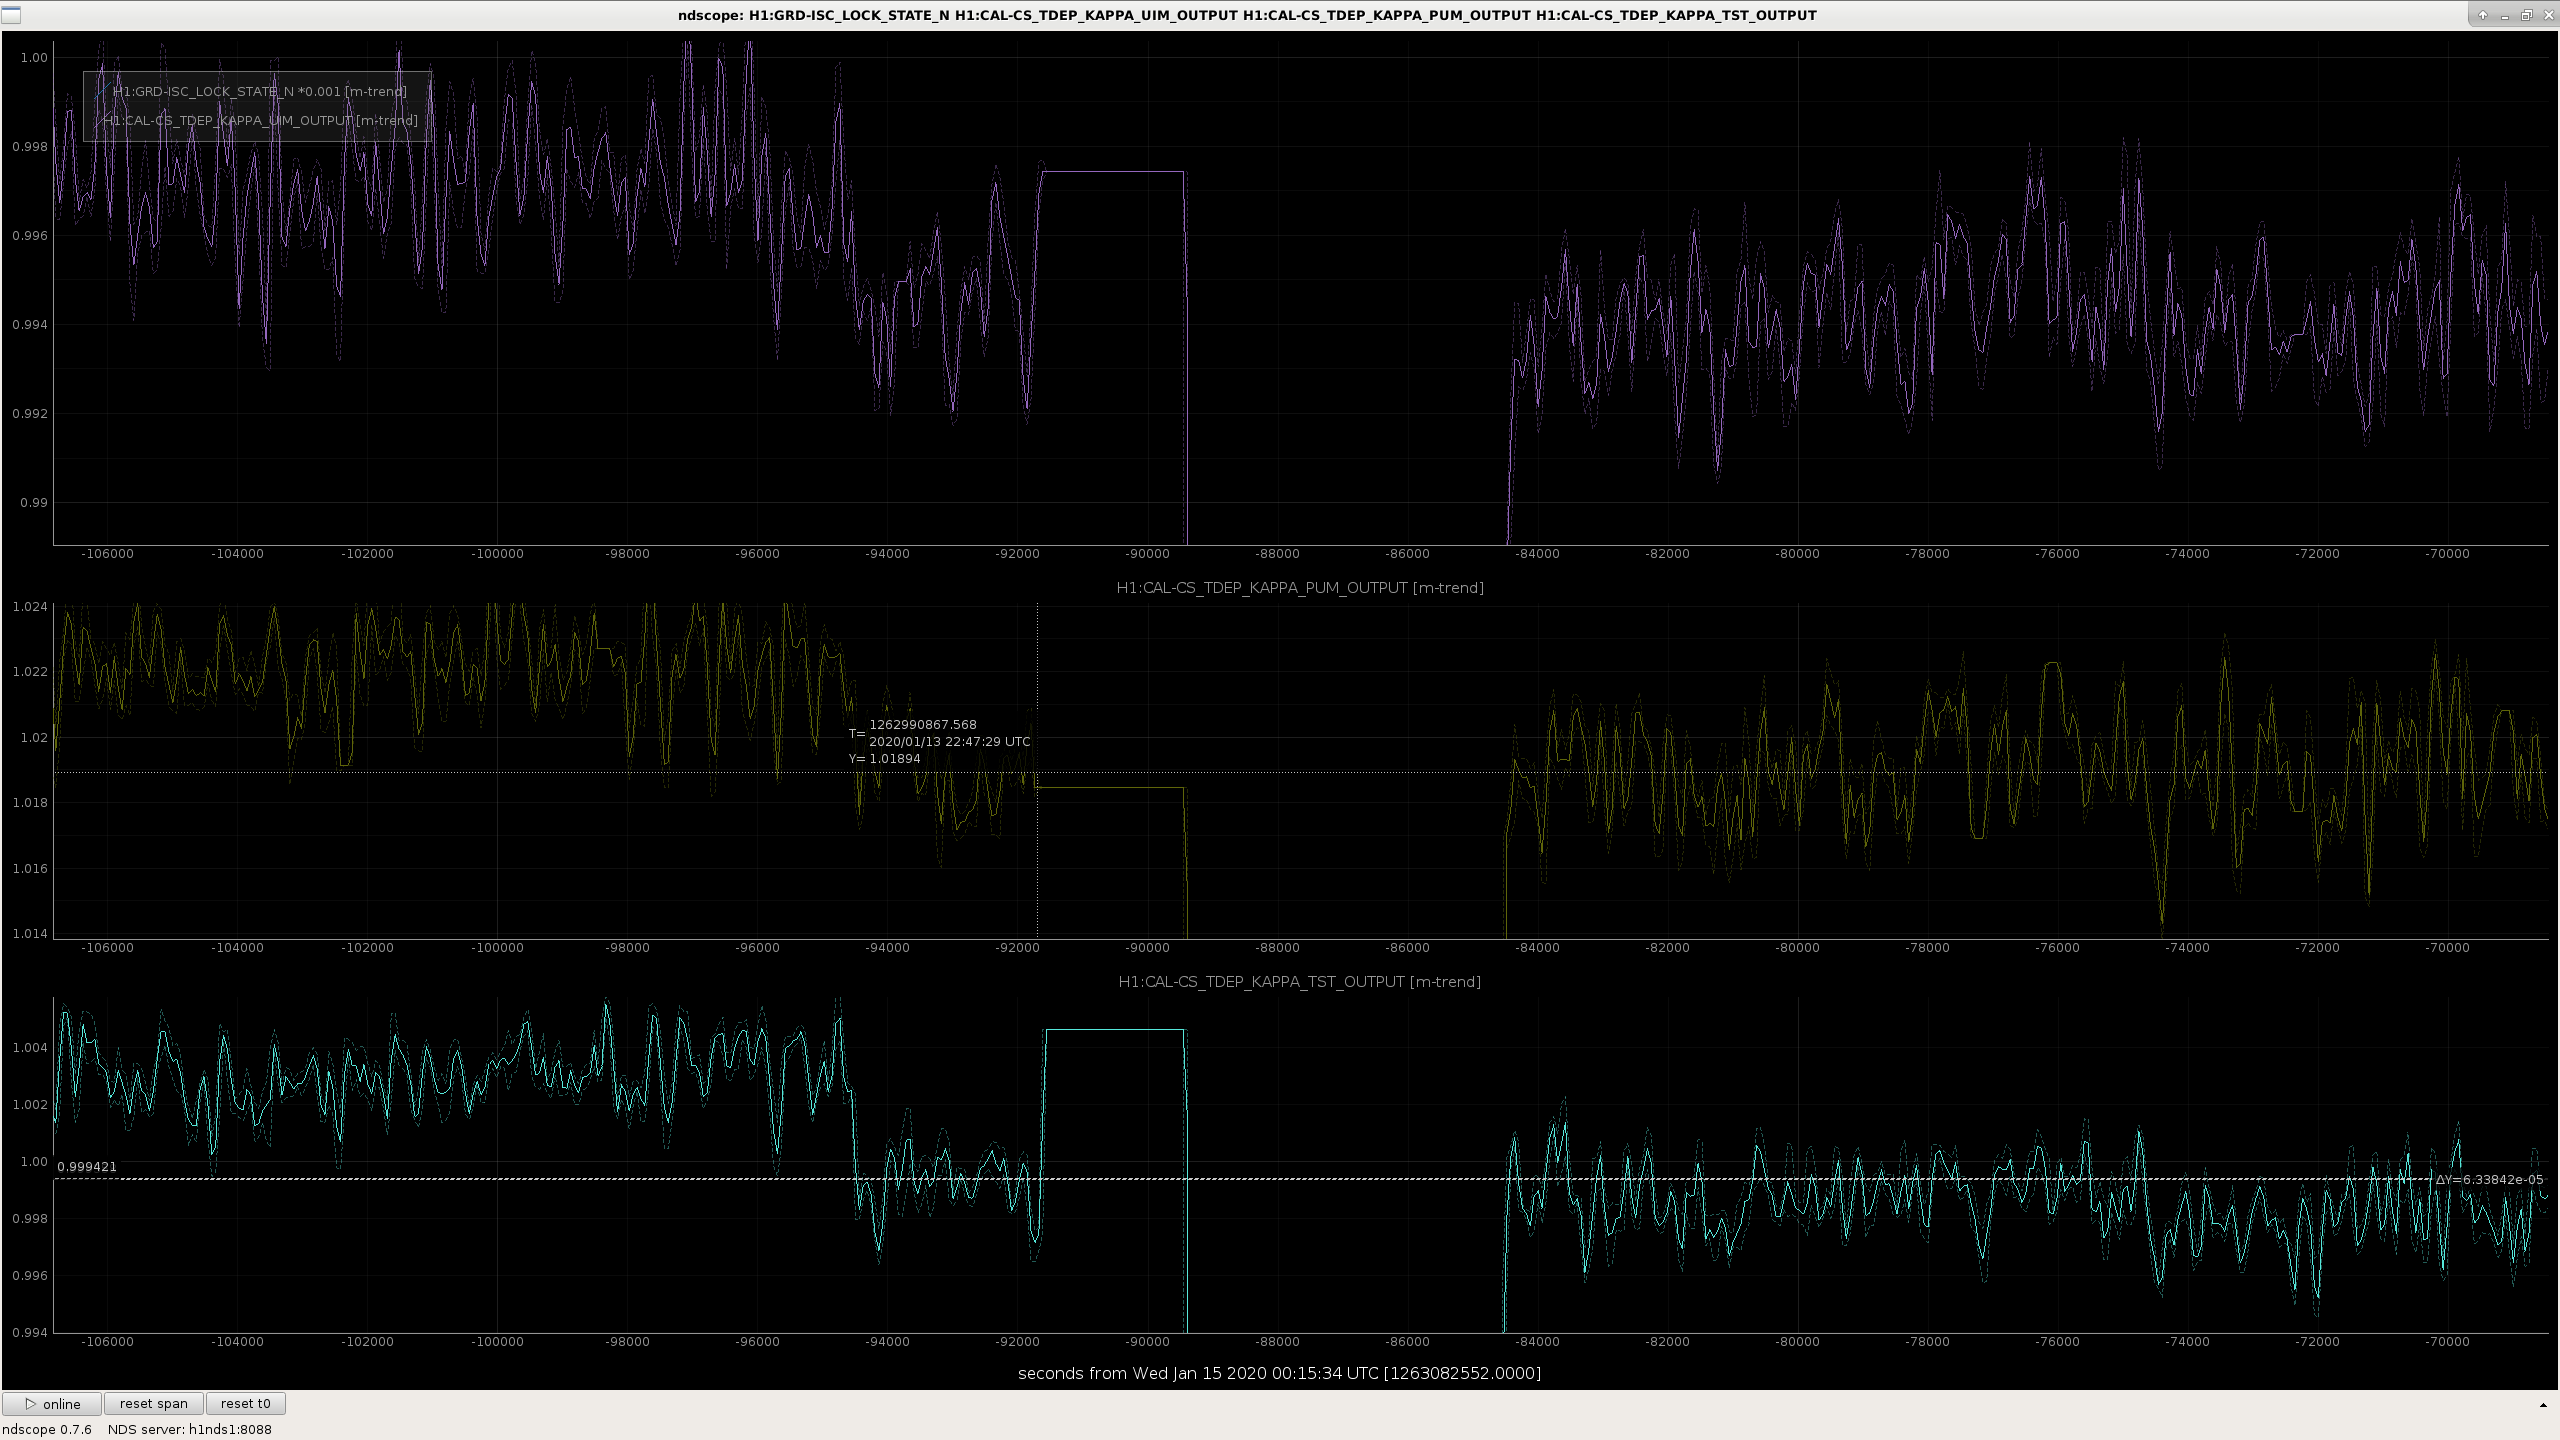
J. Kissel I've re-run the uncertainty estimate at 1263000618, Jan 14 2020 01:30:00 UTC, just after the broad band injection and compared *that* against the reference time envelope (i.e. one with no TDCFs applied). I also attach screenshots of the values of the TDCFs at *this* time, so we can compare them against what Aaron reported the GDS TDCFs that were used to correct the broadband injection in LHO aLOG 54676. One can see that the envelope disagrees with the data. HOWEVER -- an aLOG is still pending -- but Aaron believes he's uncovered a systematic error in the TST stage of the actuator. You can see a sneak peak of the preliminary investigation here. That plot shows the response function with (in blue) and without (in maroon) the systematic error present. You could convince yourself that the discrepancy between the GDS measurement (which would have this TST flaw) and the uncertainty envelope is *about* what you see as the blue curve in that preliminary plot. But, stay tuned for the analysis to be done right -- applying the correction in "the right direction" and putting these things on the same plot. Anyways, just wanted to show this data as well, given that this is actually a *legit* comparison as far as we know it -- and now I have a clue that points my finger back at GDS. It's still impressive how different the TDCF-applied envelope is from the reference envelope, but I suppose we shouldn't be surprised as the reference envelope is based on data from 2019-12-26 (for sensing) and 2019-04-03 (for the actuator). Stay tuned! The command to create this uncertainty envelope is python3.5 /ligo/svncommon/CalSVN/aligocalibration/trunk/Common/pyDARM/RRNom.py --IFO=LHO --HDF5_A_MCMCresults=/ligo/svncommon/CalSVN/aligocalibration/trunk/Runs/O3/H1/Results/Uncertainty/O3B_H1_A_MCMC_20200103Model_REF.hdf5 --HDF5_A_GPRresults=/ligo/svncommon/CalSVN/aligocalibration/trunk/Runs/O3/H1/Results/Uncertainty/2020-02-11_GPR_Run_H1_A_O3B_meas20191204-20200210_collection_model20200103_NOPCALSYSERR_ALL_UIM_f7-250Hz_L0p1_PUM_f7-500Hz_L0p2_TST_f10-1000Hz_L0p5_posteriors.hdf5 --HDF5_C_MCMCresults=/ligo/svncommon/CalSVN/aligocalibration/trunk/Runs/O3/H1/Results/Uncertainty/O3_H1_C_MCMC_2019-12-26_forreference_fmin20Hz.hdf5 --HDF5_C_GPRresults=/ligo/svncommon/CalSVN/aligocalibration/trunk/Runs/O3/H1/Results/Uncertainty/2020-02-11_GPR_Run_H1_C_O3B_meas20191120-20200210_collection_model20200103_NOPCALSYSERR_nofsQcorr_MCMCfmin20Hz_GPRfmin20_lengthscale0p35_withPCALXHFdata_model20200103_posteriors.hdf5 --modelPath=/ligo/svncommon/CalSVN/aligocalibration/trunk/Runs/O3/H1/params/ --modelFilename=modelparams_H1_20200103 --IFOmodel=modelPars --sampleNumber=1000 --seed=1111 --version=C00 --outDir=/ligo/svncommon/CalSVN/aligocalibration/trunk/Runs/O3/H1/Results/Uncertainty/ --plot1SigmaUncs --saveSummaries --gpsTime=1263000618 --GetData=GWPY
TITLE: 02/12 Eve Shift: 00:00-08:00 UTC (16:00-00:00 PST), all times posted in UTC
STATE of H1: Observing at 121Mpc
OUTGOING OPERATOR: Ed
CURRENT ENVIRONMENT:
SEI_CONF state: WINDY
Wind: 15mph Gusts, 11mph 5min avg
Primary useism: 0.06 μm/s
Secondary useism: 0.23 μm/s
QUICK SUMMARY: locked in Observe
TITLE: 02/11 Day Shift: 16:00-00:00 UTC (08:00-16:00 PST), all times posted in UTC
STATE of H1: Observing at 119Mpc
INCOMING OPERATOR: Cheryl
SHIFT SUMMARY:
LOG:
{Kyle, Tyler, Chandra}
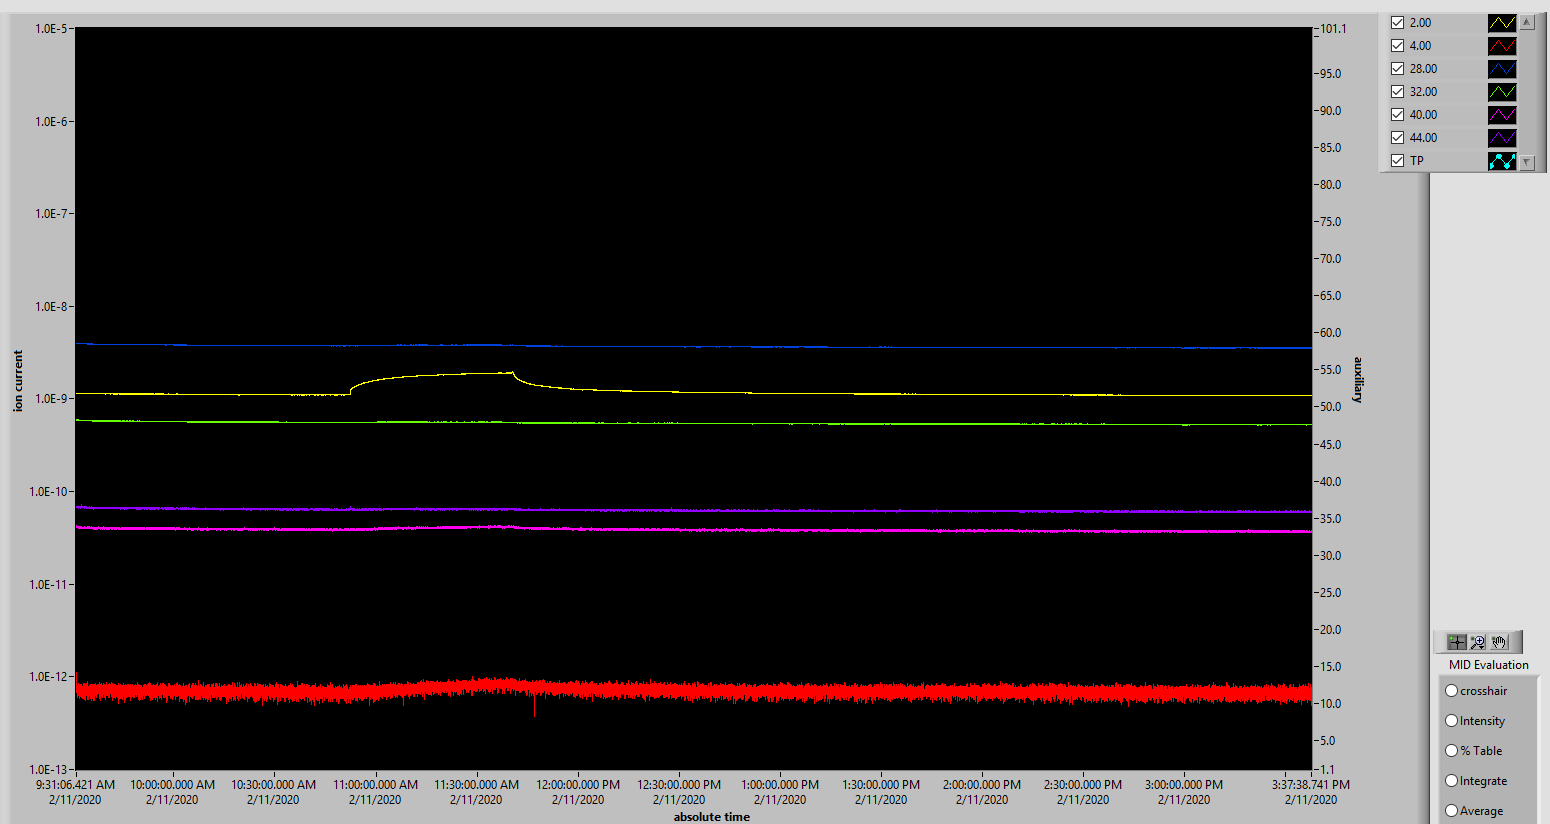
In an attempt to find air leak at EX and based on some aLOGs from summer 2018 (43165 & 43184), we had reason to believe that IP12 may be leaking and so today we isolated IP12 + chevron baffle from main volume and leak checked with a background of 1.5e-9 Torr-L/s of He. We sprayed ample amounts of He and saw no rise in signal.
We also sprayed the beamtube side flange of isolation GV while Jeff Jones remotely watched the RGA screen in control room, running in MID mode with new Labview based software with no change in AMU 4. This test is inconclusive, however, because we were opened to BT.
We suspect the leak is in the e-7 Torr-L/s range.
Next opportunity to leak check with BT GV closed is March 3 when we replace the maglev turbo.
Attached is RGA scan of AMUs 2,4,28,32,40,44 during leak checking. H2 rose when we isolated IP12 from main volume (no surprise). There is an ever so slight increase in He when we sprayed the tube side of GV flange.
Glad to see some things never change :)
https://alog.ligo-wa.caltech.edu/aLOG/index.php?callRep=5561
Gerardo and I reported no leaks on the new IP12 GV, but we will redo this measurement, including bonnet.
https://alog.ligo-wa.caltech.edu/aLOG/index.php?callRep=42721
The following modifications were made at EX to help with the ongoing noise hunting investigation.
1. Baffle Photodiode Amplifier moved from SUS-R1 to FAC-R1
2. Baffle Photodiode Amplifier powered down
3. Beckhoff hub isolated from rack
4. ESD current limit resistor box removed and SHV barrels installed
The removal of the current limit resistor should have no impact. The installed ETM Low Noise ESD Driver Chassis (D1500129) has built-in current limit protection.
The Baffle Photodiode Amplifier unit was powered down to see if the Beckhoff terminal might be a noise source. Unit at EX is normally not used to lock the Interferometer. Unit can be powered back on by reconnecting the ±24V power cable.
F. Clara, R. Mccarthy, R. Schofield
Tagging DetChar and CAL.
These changes *should* not have any *bad* effect on the detector, but
(DETCHAR) These changes were made in order to reduce the amount of spectral features in h(t) based on Evan's studies for the CW group (e.g. LHO aLOG 53439, G1902208) and the differences between H1 and L1.
We would appreciate any help that @DetChar can provide over the coming days/weeks in assessing whether this change made a difference (whether that be positive, negative, or even "can't tell.")
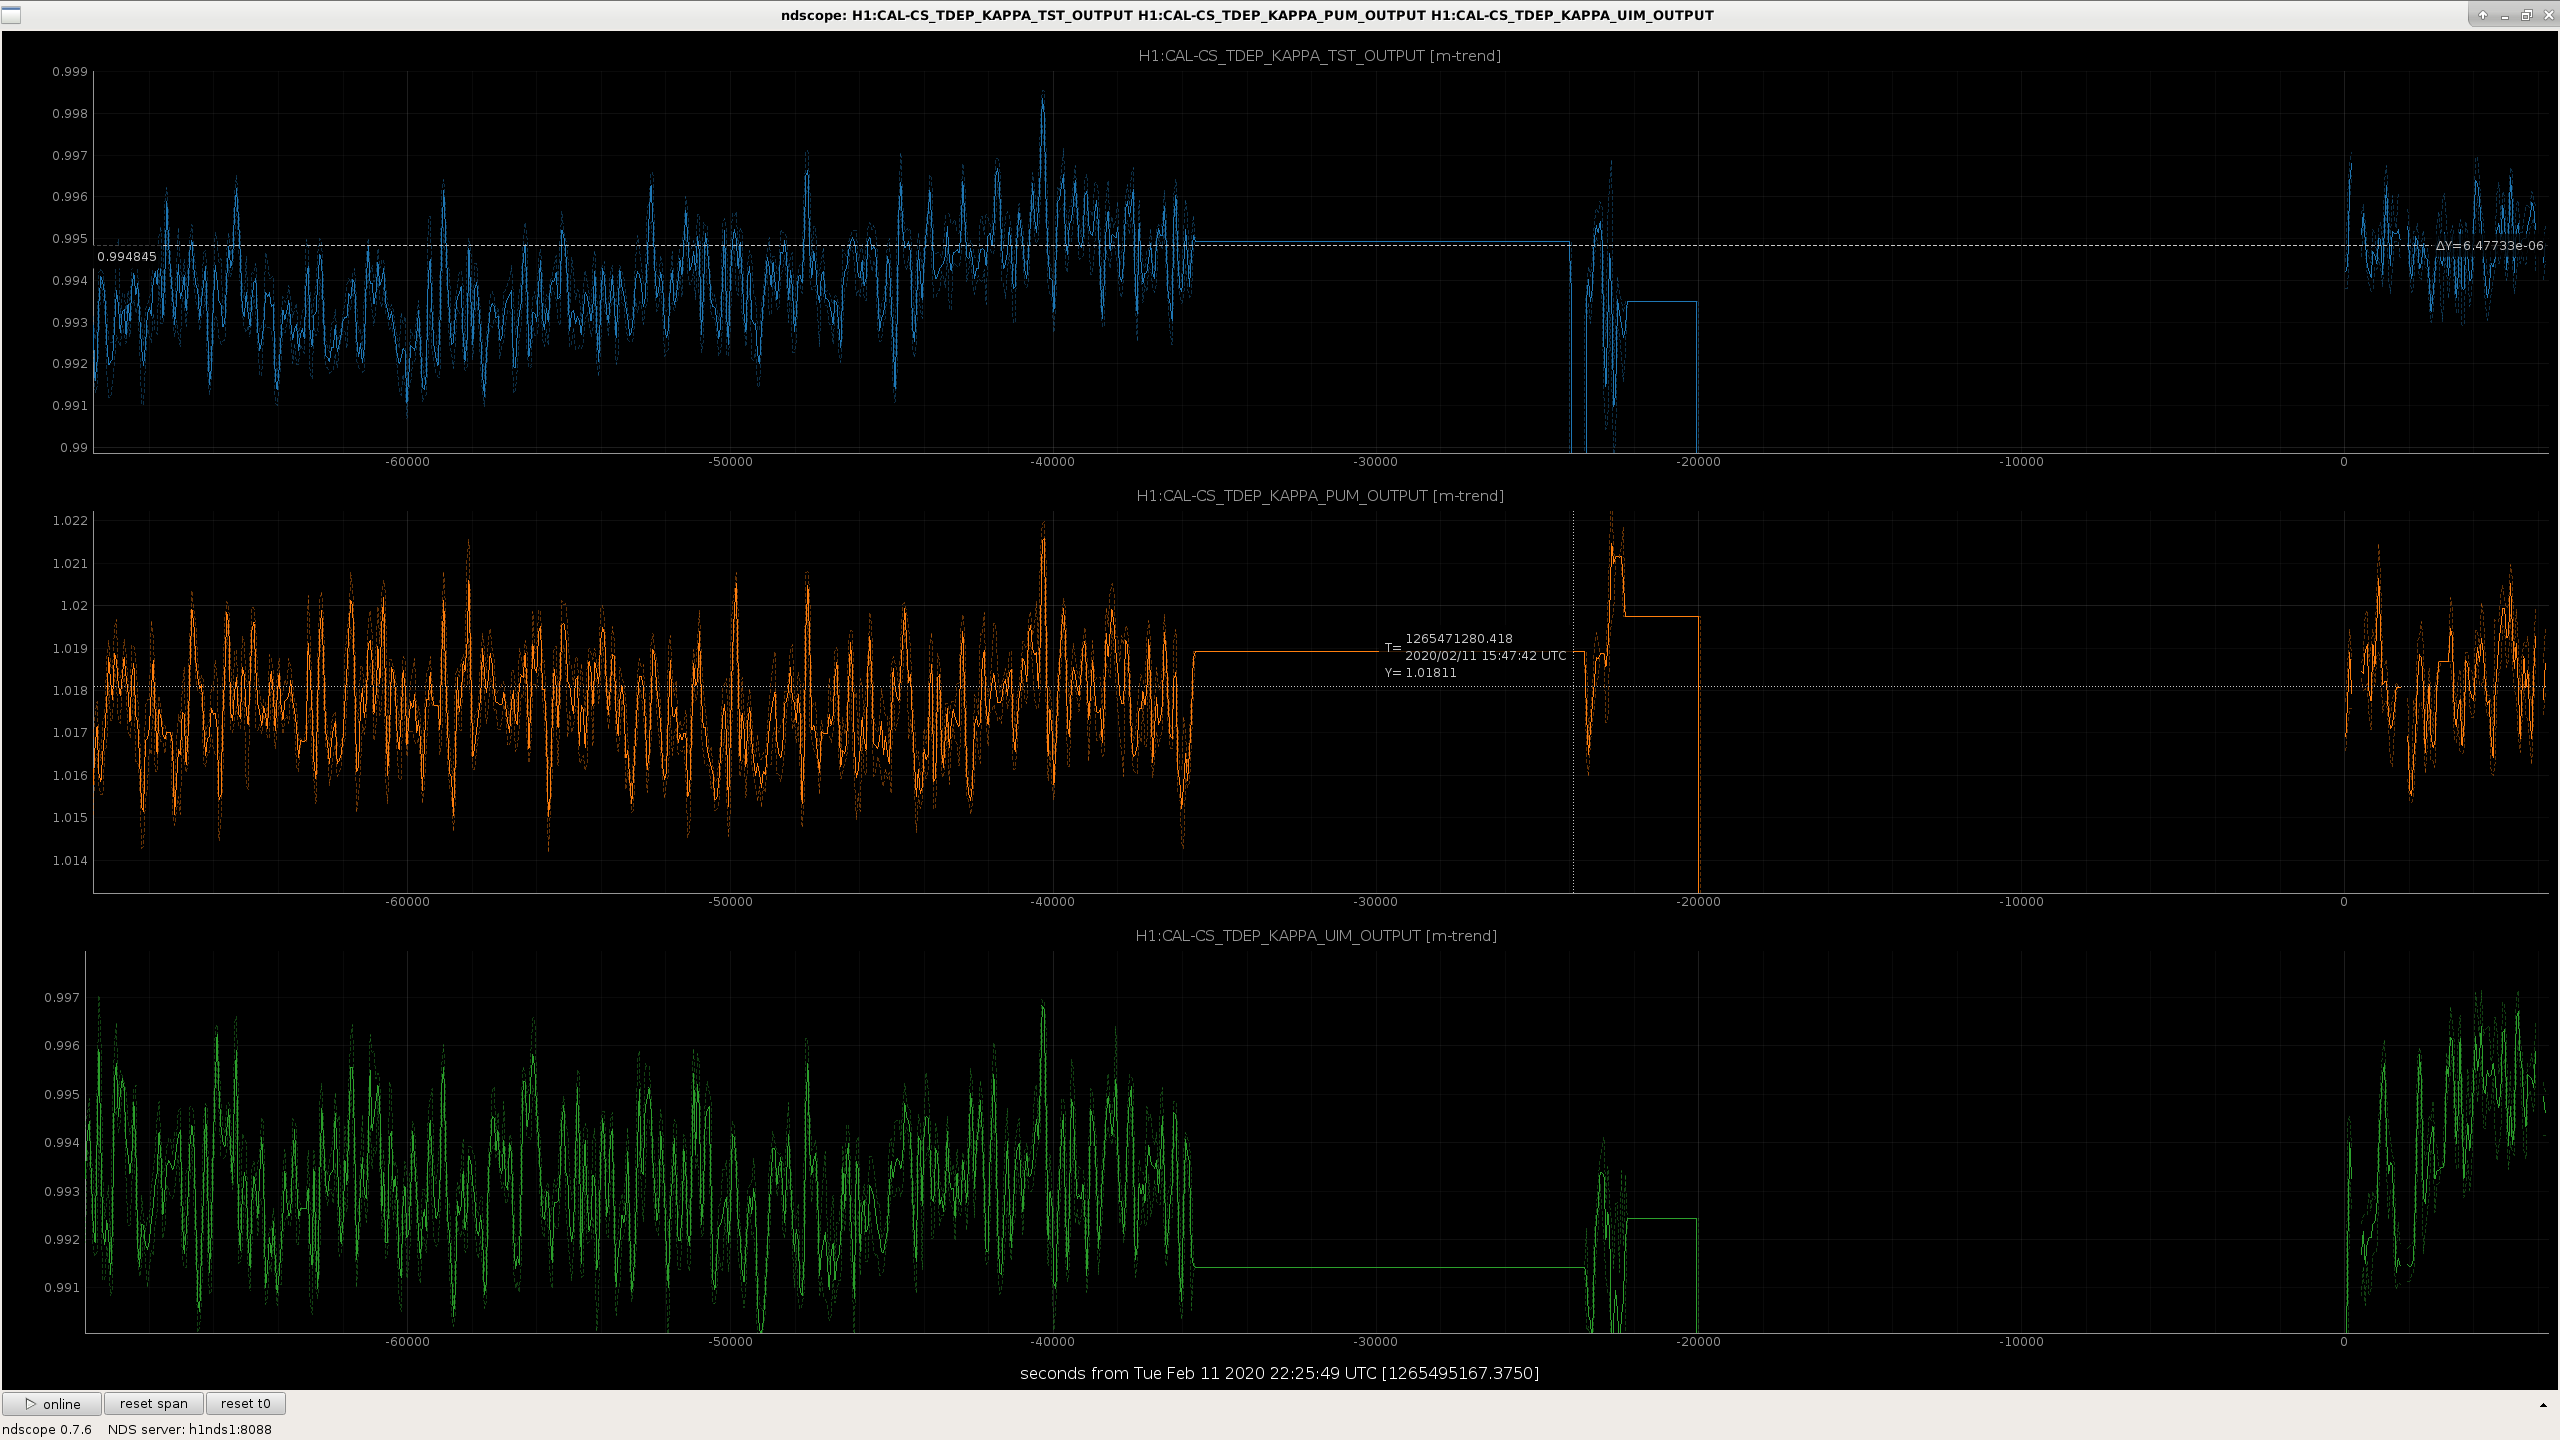
(CAL) The change in the resistor box -- "ESD current limit resistor box removed and SHV barrels installed" -- should, nominally, NOT affect the actuation strength of the ETMX ESD, but I'll be taking a look to see if the online tracking system *of* that strength made a difference.
The first observation ready segment after these changes were made started on Feb 11 2020 22:25:54 UTC, at GPS time 1265495172, or 14:25:54 PST. Upon initial investigation, the DARM actuator's time-dependent correction factors (i.e. the point-estimate of the actuation strength relative to the 2020-01-03 model installed on 2020-01-13) are the same as prior to today's maintenance activity and thus I'm 90% confident that there has been no change to the actuator as a result of the electronics activity at EX today. Nice!
R. Abbott, J. Kissel Upon further investigation of calibration measurements taken of the TST stage over the remainder of the run, there appears to be a clear bifurcation in the data between the 2020-02-10 and 2020-02-24 measurements (see attached data collection). The bifurcation in the data is consistent with a ~4-5 deg change at 1 kHz. After consulting with Rich, we agree that -- given the residual parasitic cable capacitance between the chamber feedthrough and the ESD pattern itself (we guesstimate at ~600 pF), the act of replacing the former 10k current limiting resistors on the quadrant "signal" paths with the SHV connections (which have negligible resistance) removed the voltage-divider-like, passive low-pass response of a pole at 1/(2*pi*10e3*600e-12) = 26525 kHz, which *was* incurring a phase loss at 1 kHz of 180/pi*atan(-2pi * 1000 Hz * 10e3 Ohm * 600e-12 Farad) = -2.15 deg. Given the uncertainty in the cable capacitance, we could easily imagine a phase change of 5 deg after switching to ~0 Ohm SHV barrels. The consequence: we'll just have to split up this collection TST measurements in O3B in to two periods, and run the standard fit for unknown systematic error separately.
Sheila, Richard,
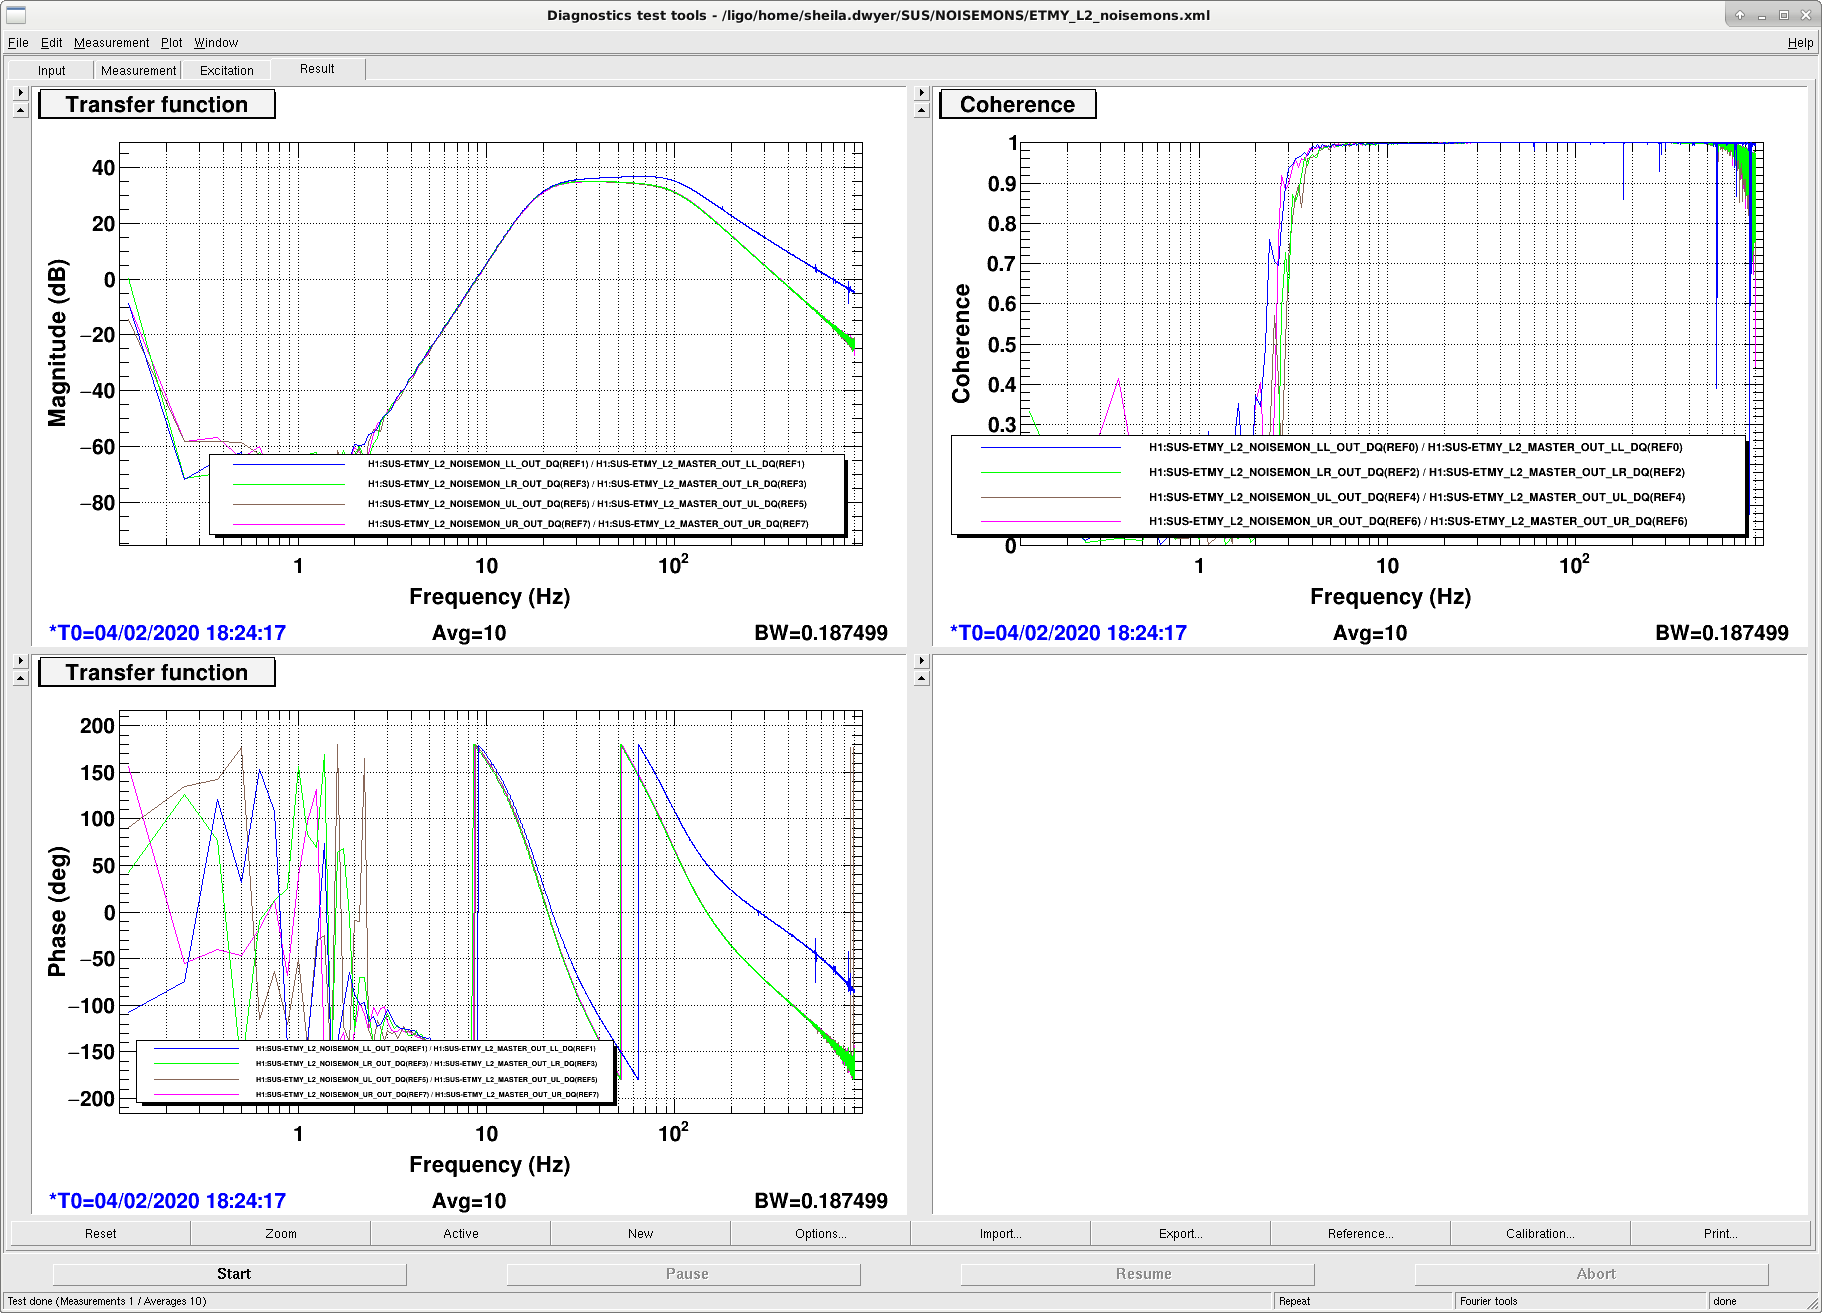
Filiberto and Richard installed new noise monitor circuits on the ETM PUMs last week, this morning I measured some transfer functions of them.
Attached are the dtt templates. Unfortunately I measured these TFs with the coil driver in state 3, which means that the low pass is on and the acq filter is off (the acq filter is after the noisemon pick off). In the digital noisemon filters I used the ANTILP filter zpk([0.4915;240.0583],[5.4697;21.8761],1,"n").
I'm also attaching the ITM measurements, which were taken in the same configuation 54614
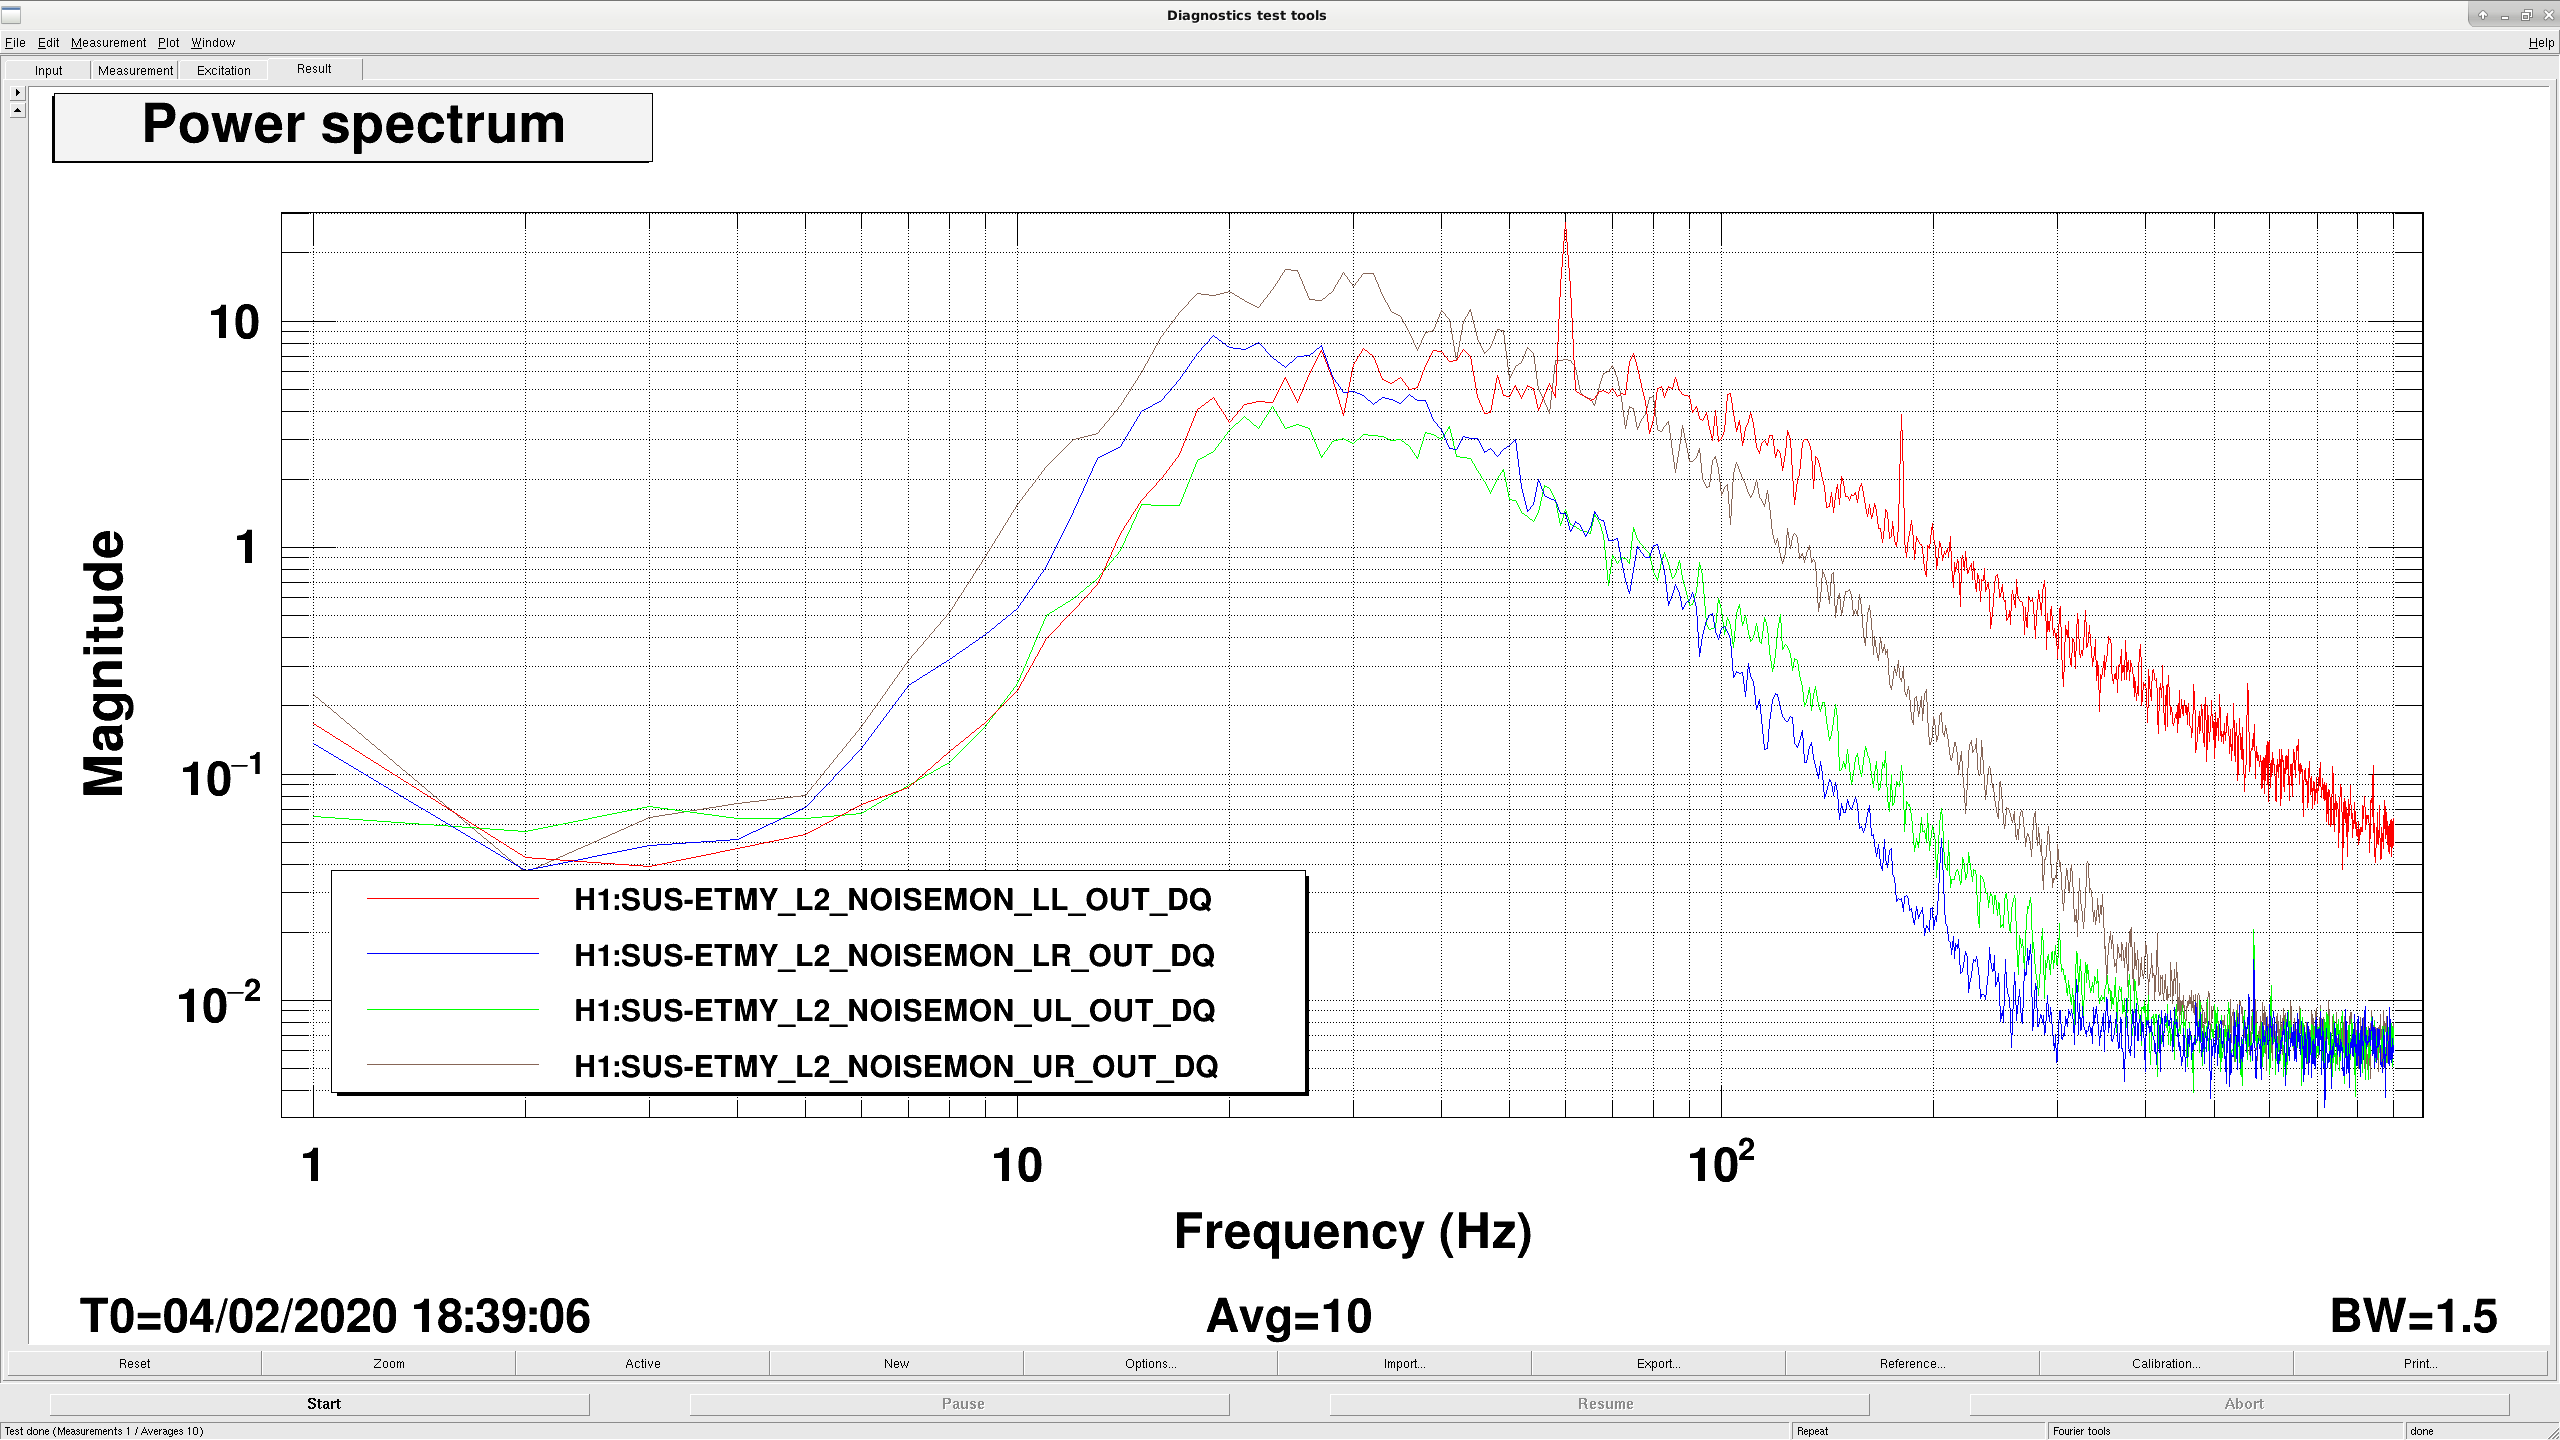
The transfer function for ETMY LL seems significantly different from the rest. Richard and I set the test/coil enable to 0 (seting the driver into test mode, which means no input from DAC, I'm not sure what it means about terminating or floating inputs) and looked at spectra, and LL also looks different (3rd screenshot).
Richard is heading to the end station to check if there is something like a capacitor that wasn't swapped in that channel.
The EE team did find a bad solder joint in the ETMY LL channel, and repaired it before the end of maintence. Richard also re-ran the set of transfer functions for the noise monitors for EY, the attached file has his new set of measurements. The quadrants all seem to be the same now.
This ETMY measurement was taken with coil drivers in state 2, but the antiLP filter was on. That means that to compare these TFs to the others, we need to remove the filter zpk([0.4915;240.0583],[5.4697;21.8761],1,"n").
Attached are filters to calibrate the noisemon outputs in DAC counts.
They are designed by fitting the above-measured transfer functions (using IIRrational) and then inverting them. The antiLP filter was removed from the ETMY data. Poles at very low frequencies were nudged up to 1 Hz to limit the DC gain.
Attachment 1: plots of the data and fitted filters.
Attachment 2: filter install script
Thank you very much Chris.
I have just run this script and turned on the new filters, because we are out of observing for ~40 minutes of commisioning time. The new filters are turned on as of 20:22 UTC Feb 13, so the noise mon channels are all calibrated into DAC counts now.