oli.patane@LIGO.ORG - posted 09:07, Monday 22 September 2025 (87056)
Overnight Out of Observing due to SQZ PMC
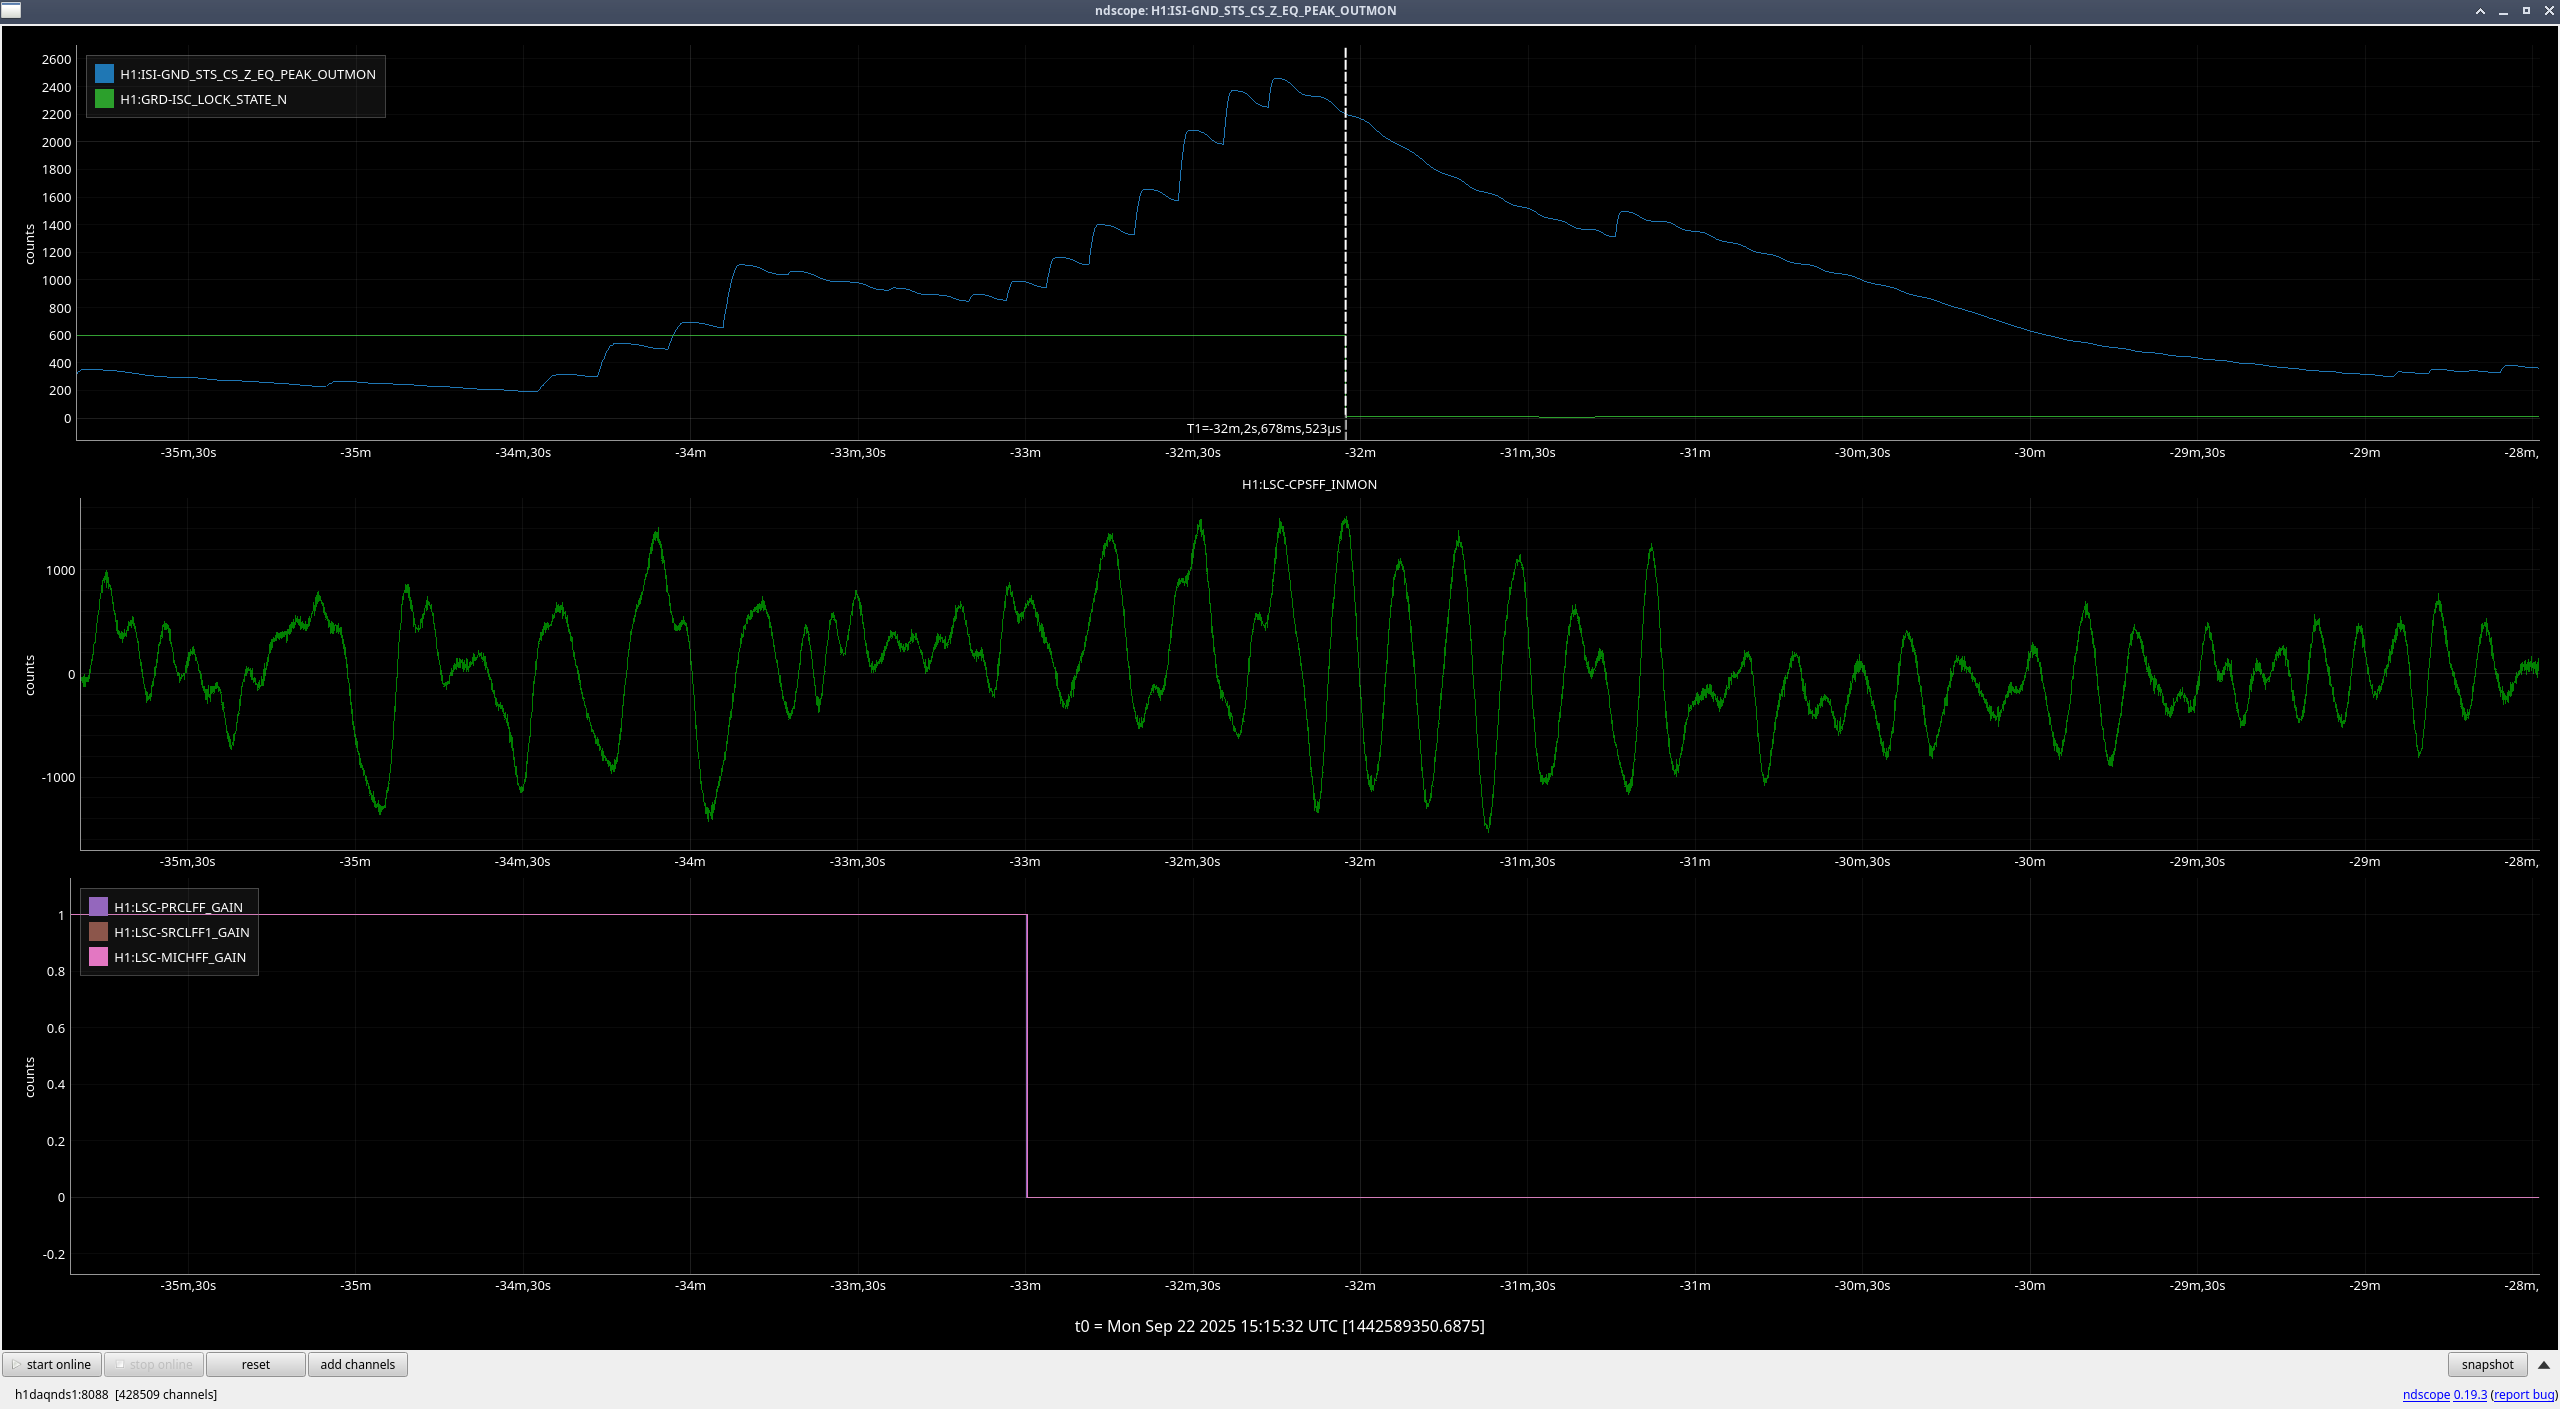
Overnight we had the ifo drop out of Observing briefly between 2205-09-22 08:23 and 08:27 UTC. This was due to the SQZ PMC PZT running out of range and unlocking. It was able to relock by itself and then get back to FDS
Non-image files attached to this report