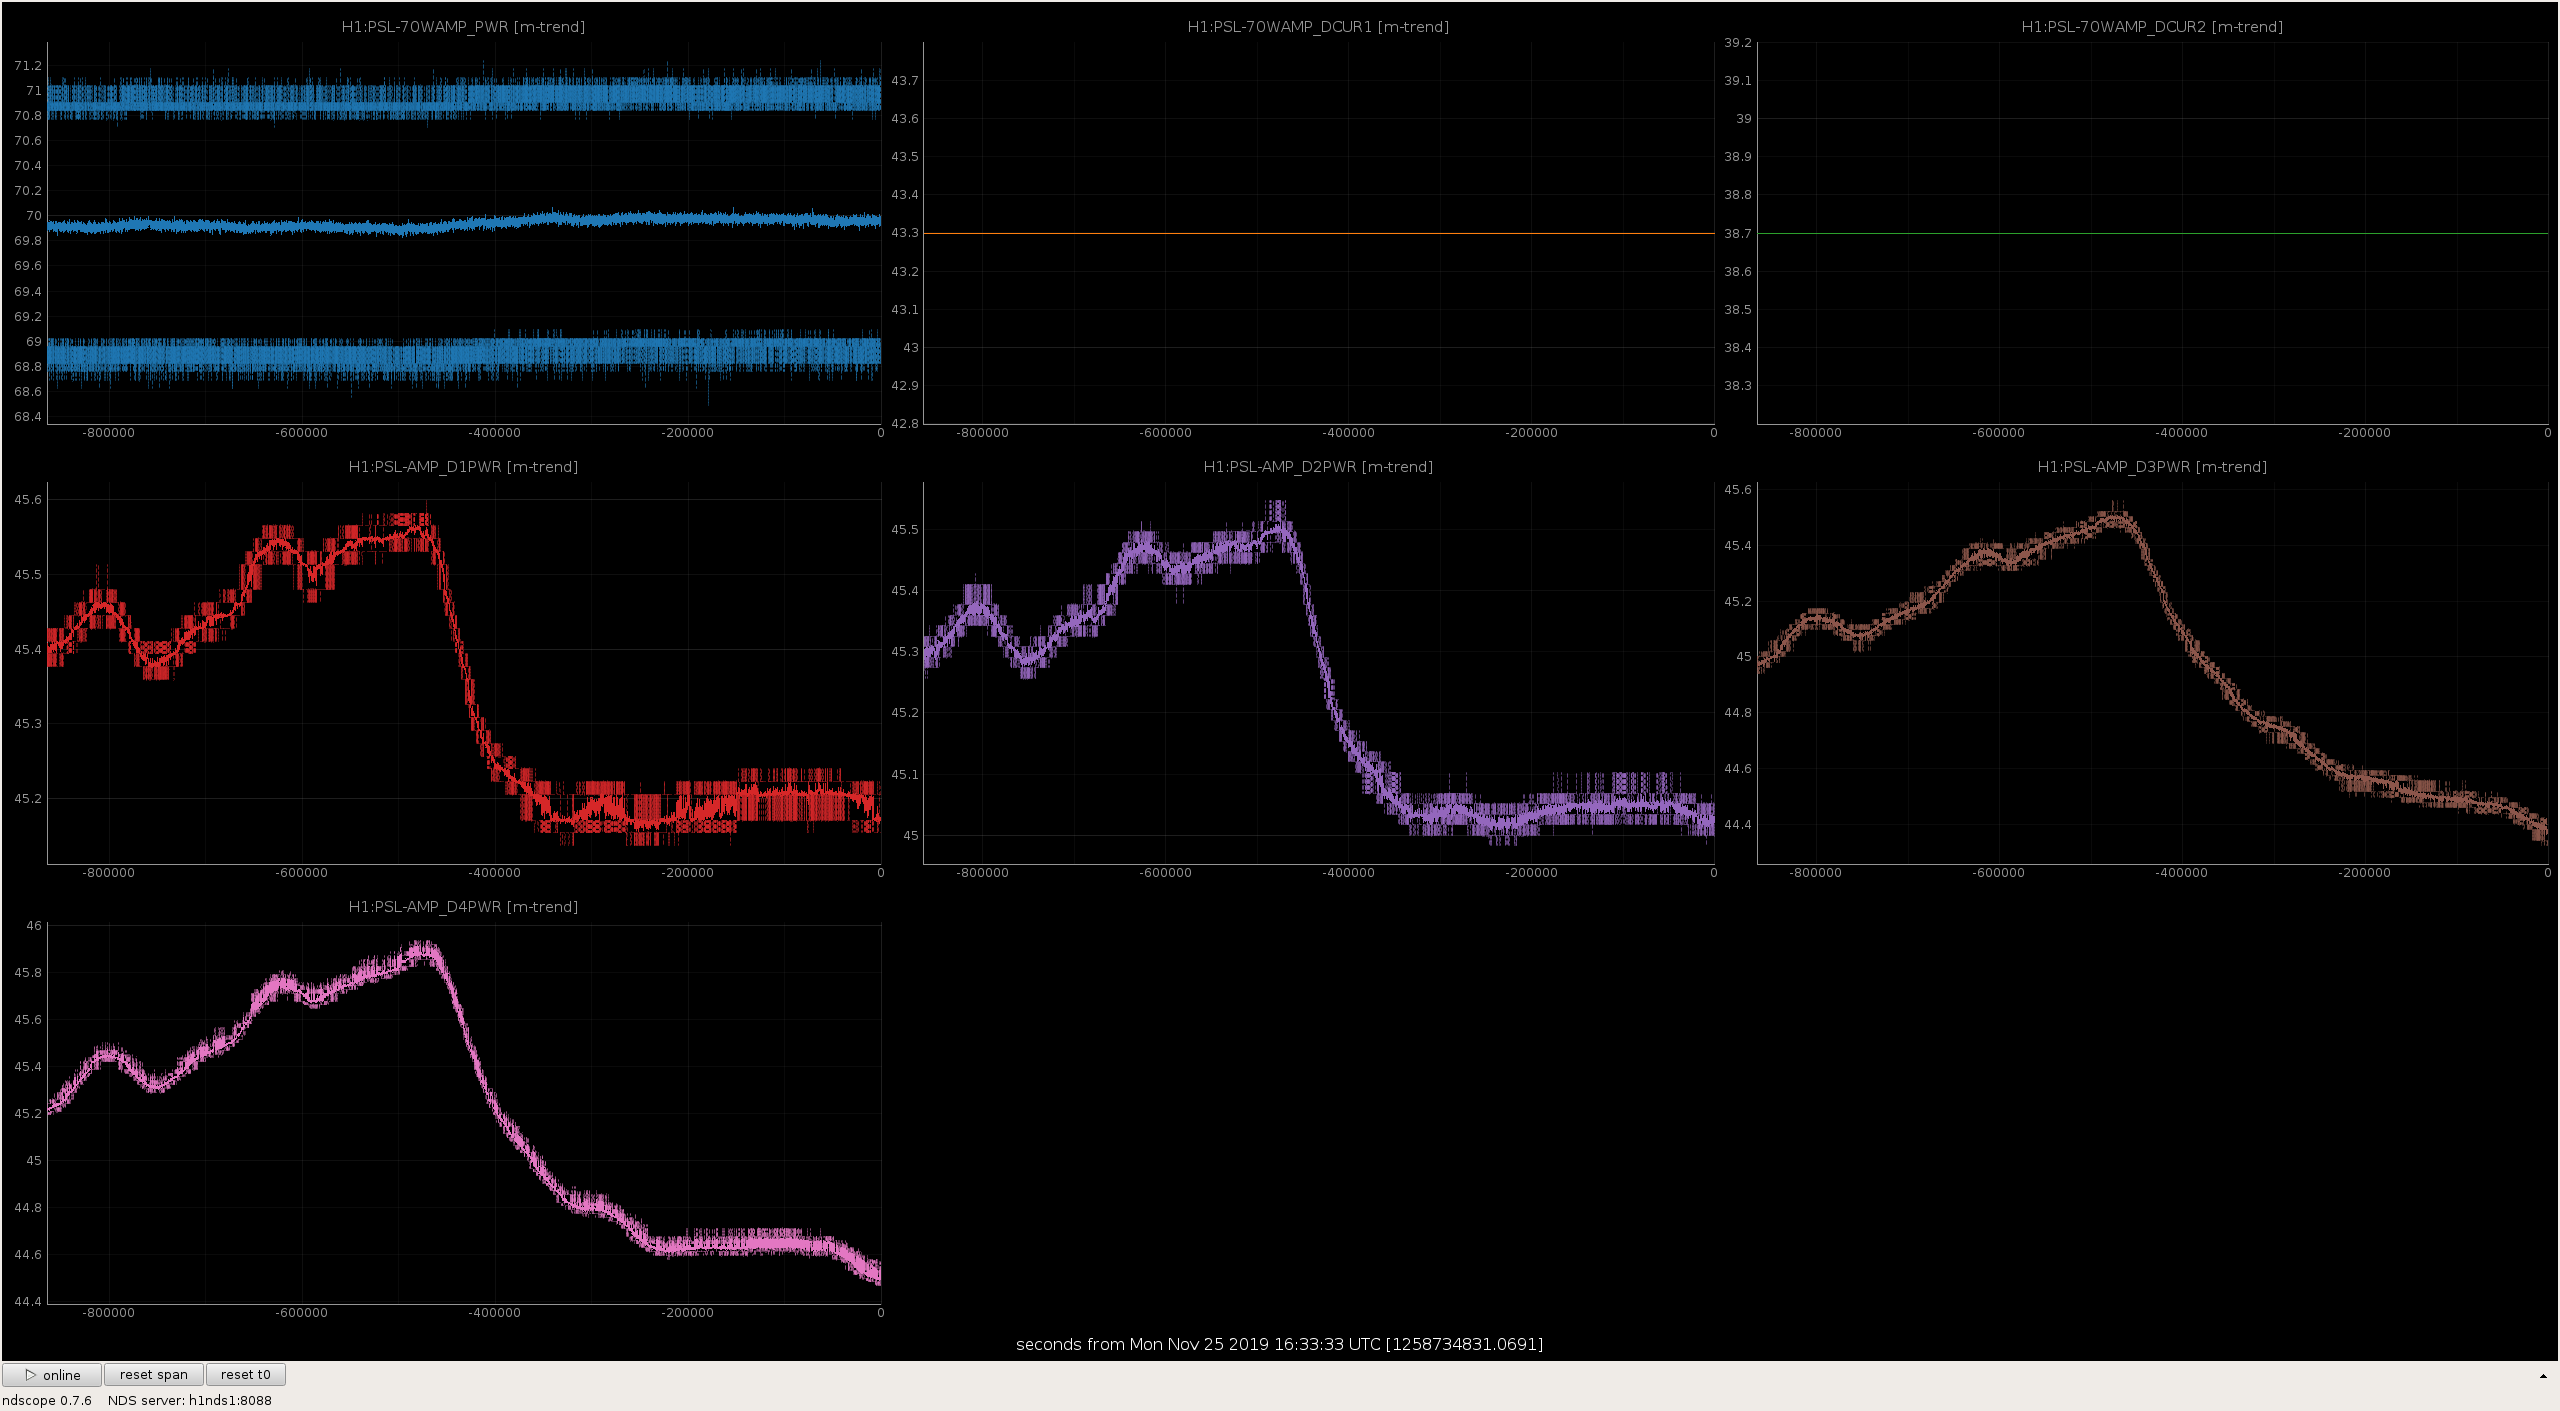
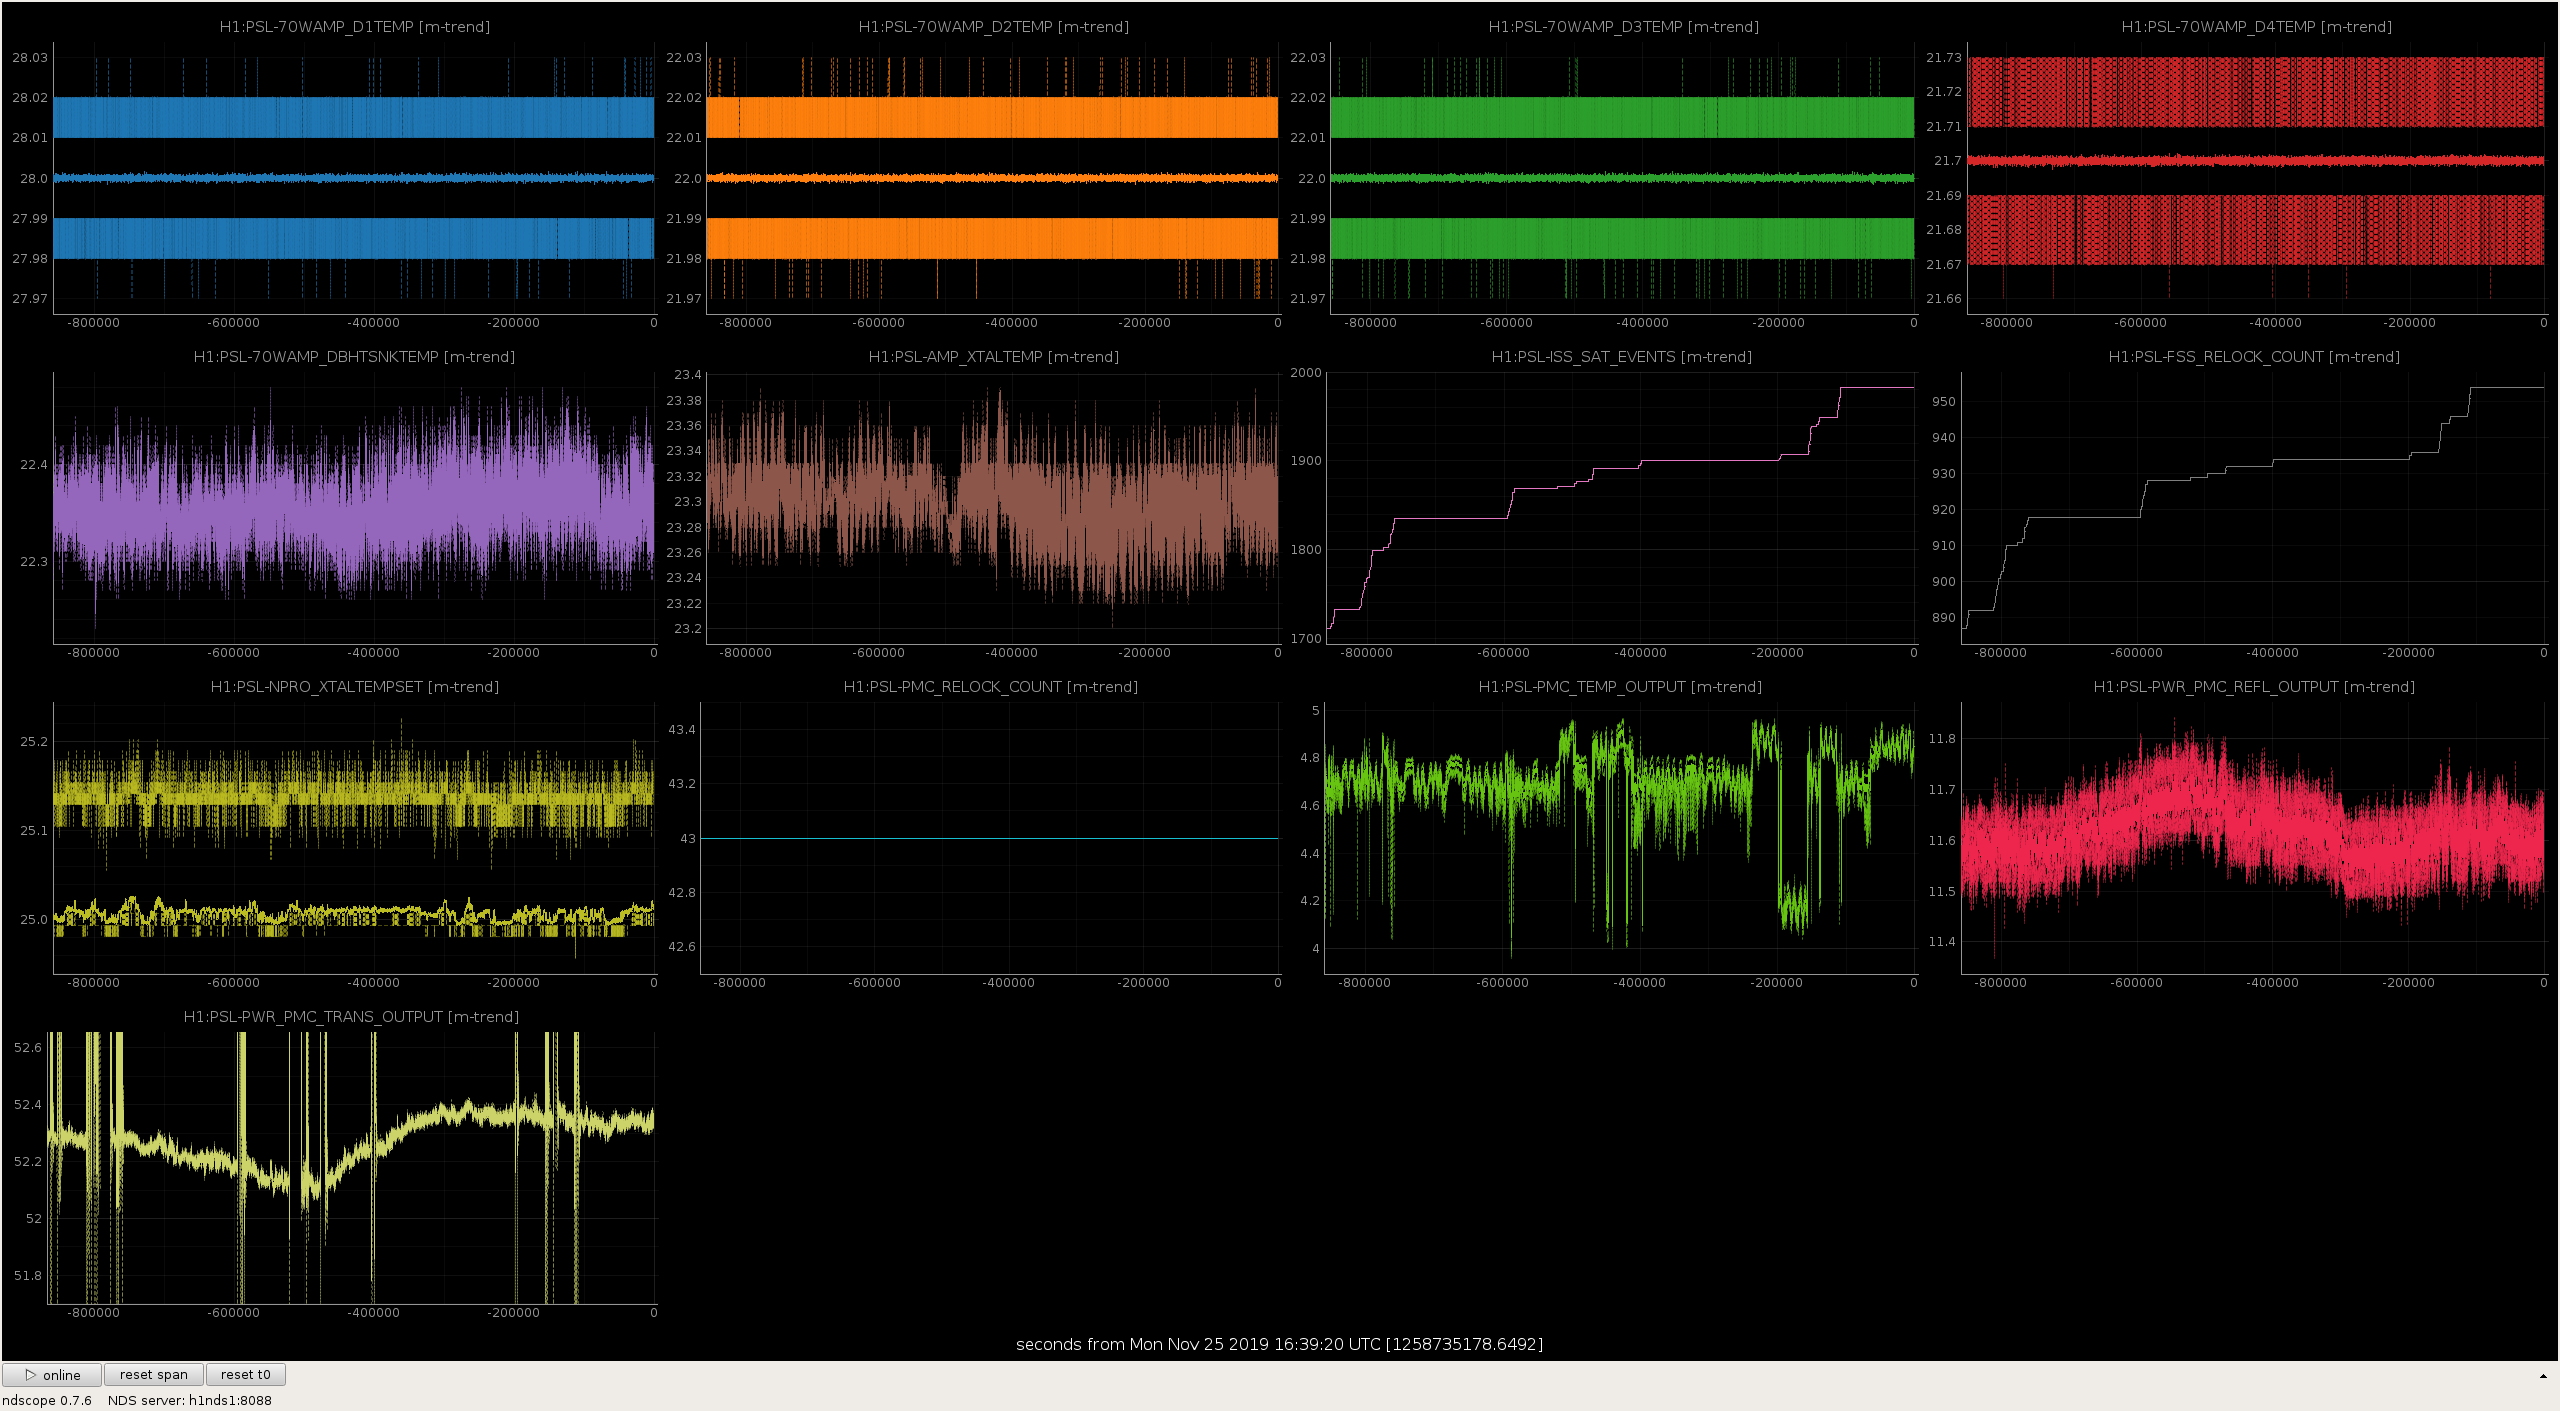
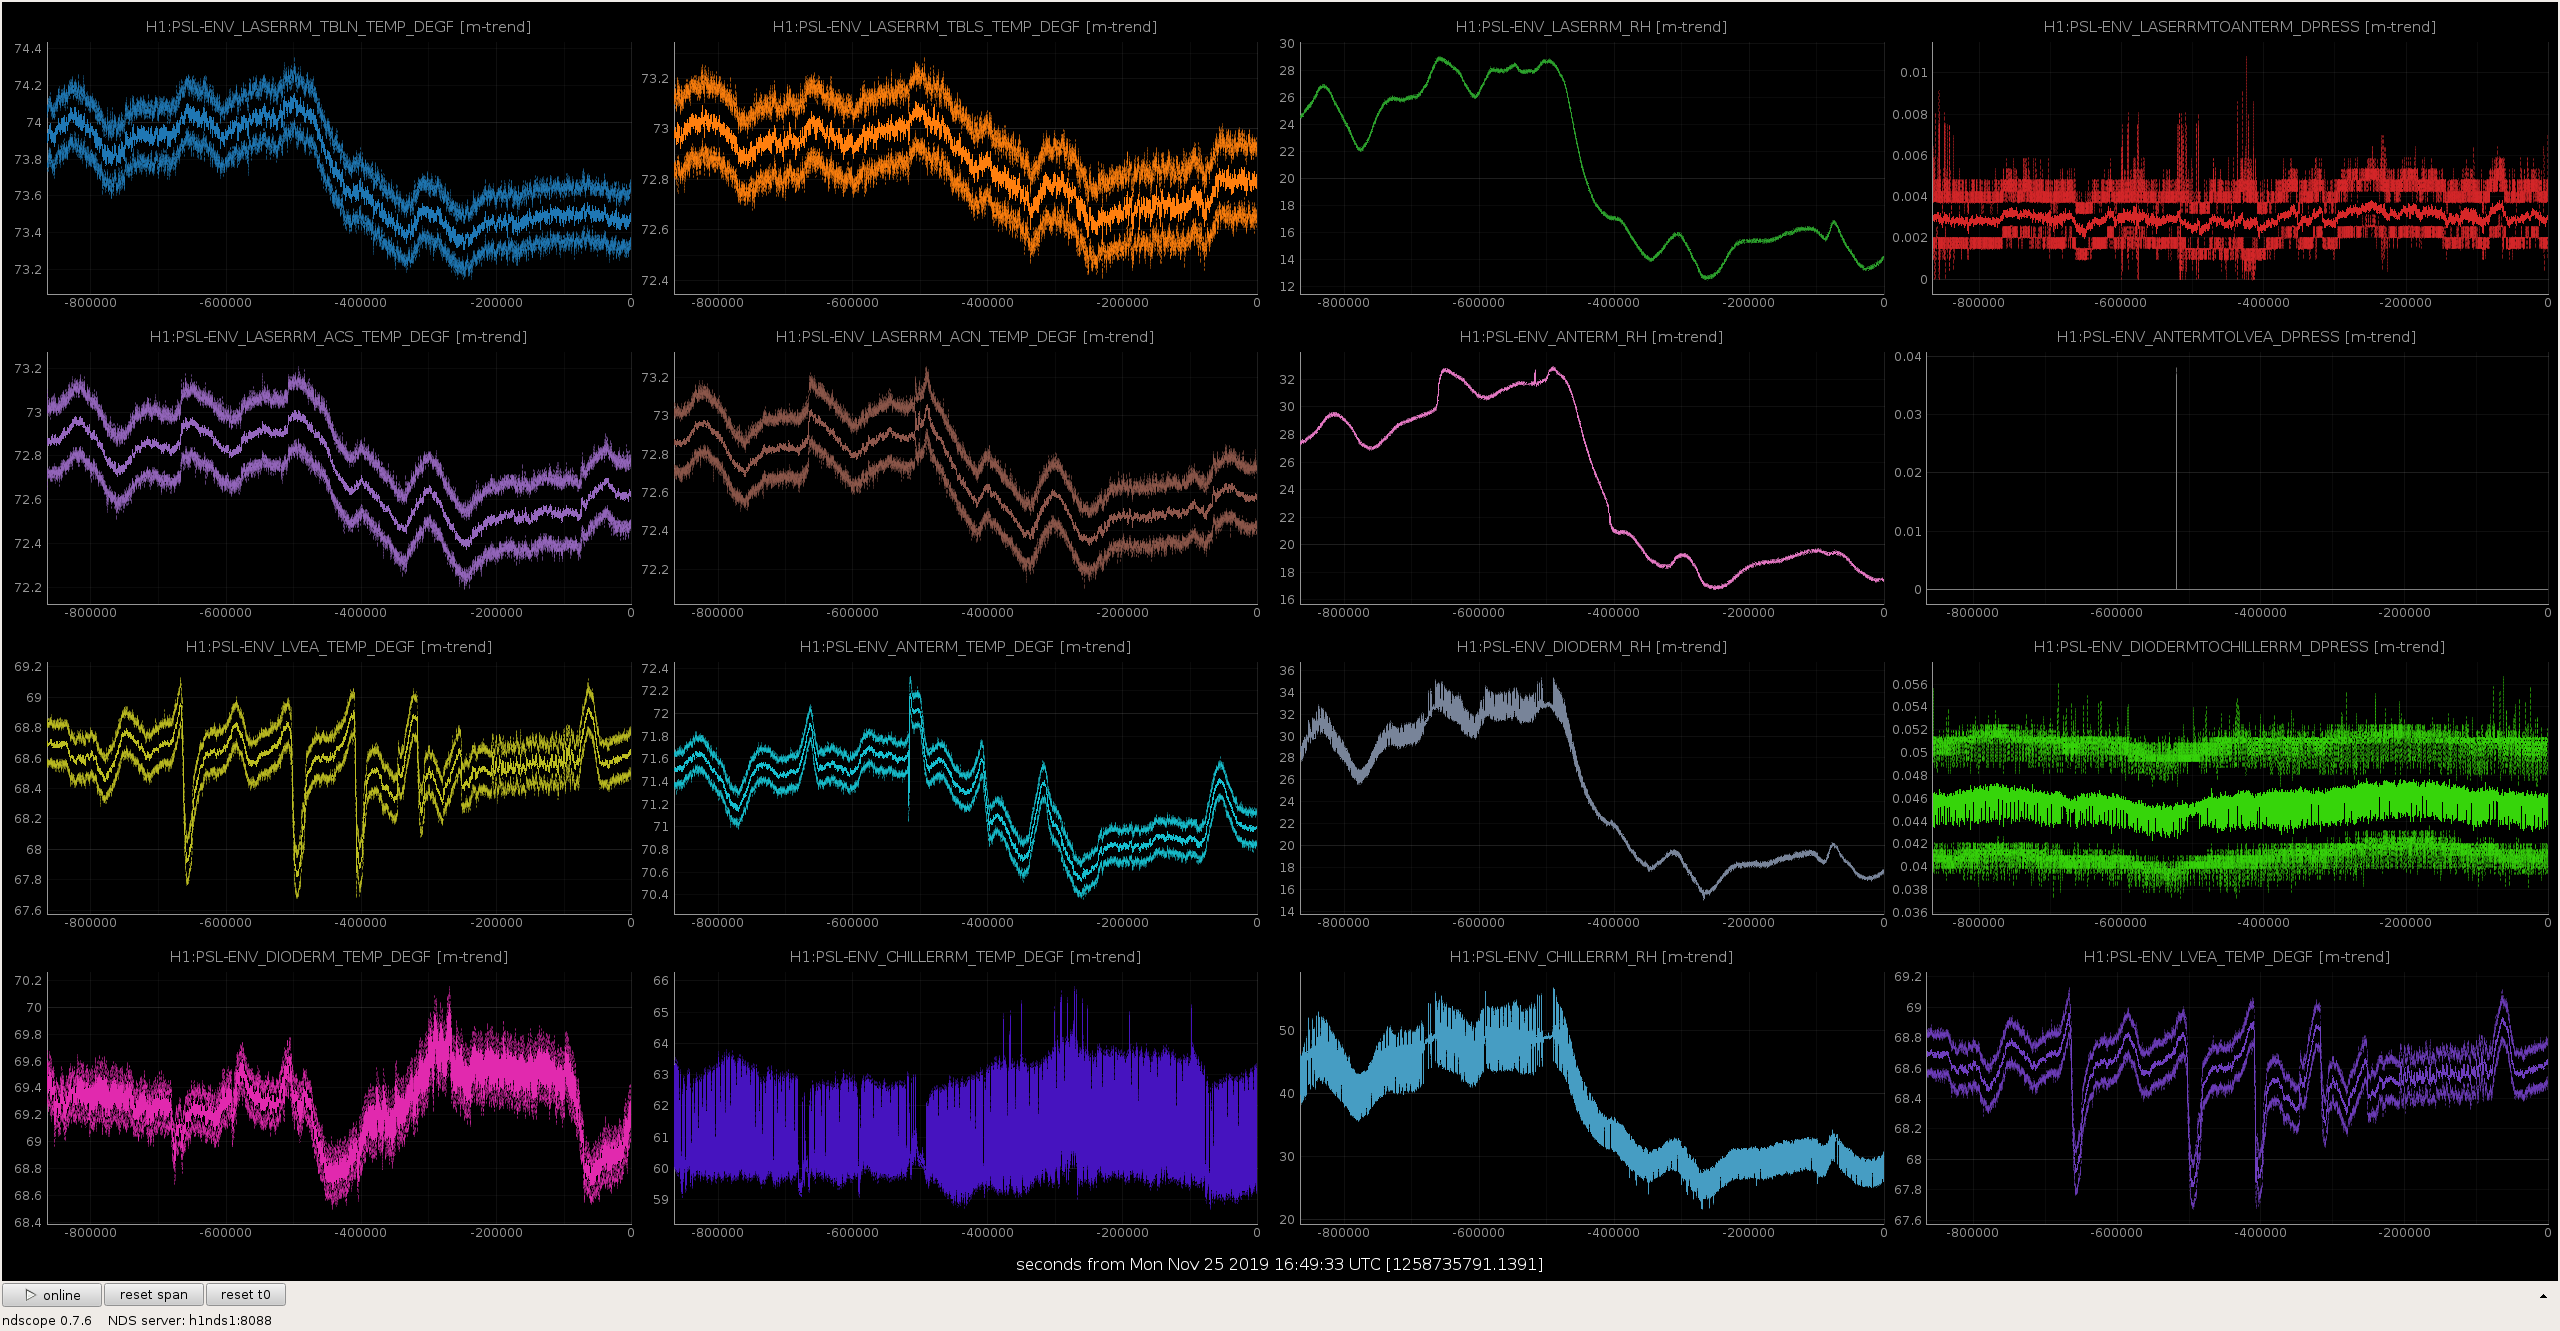
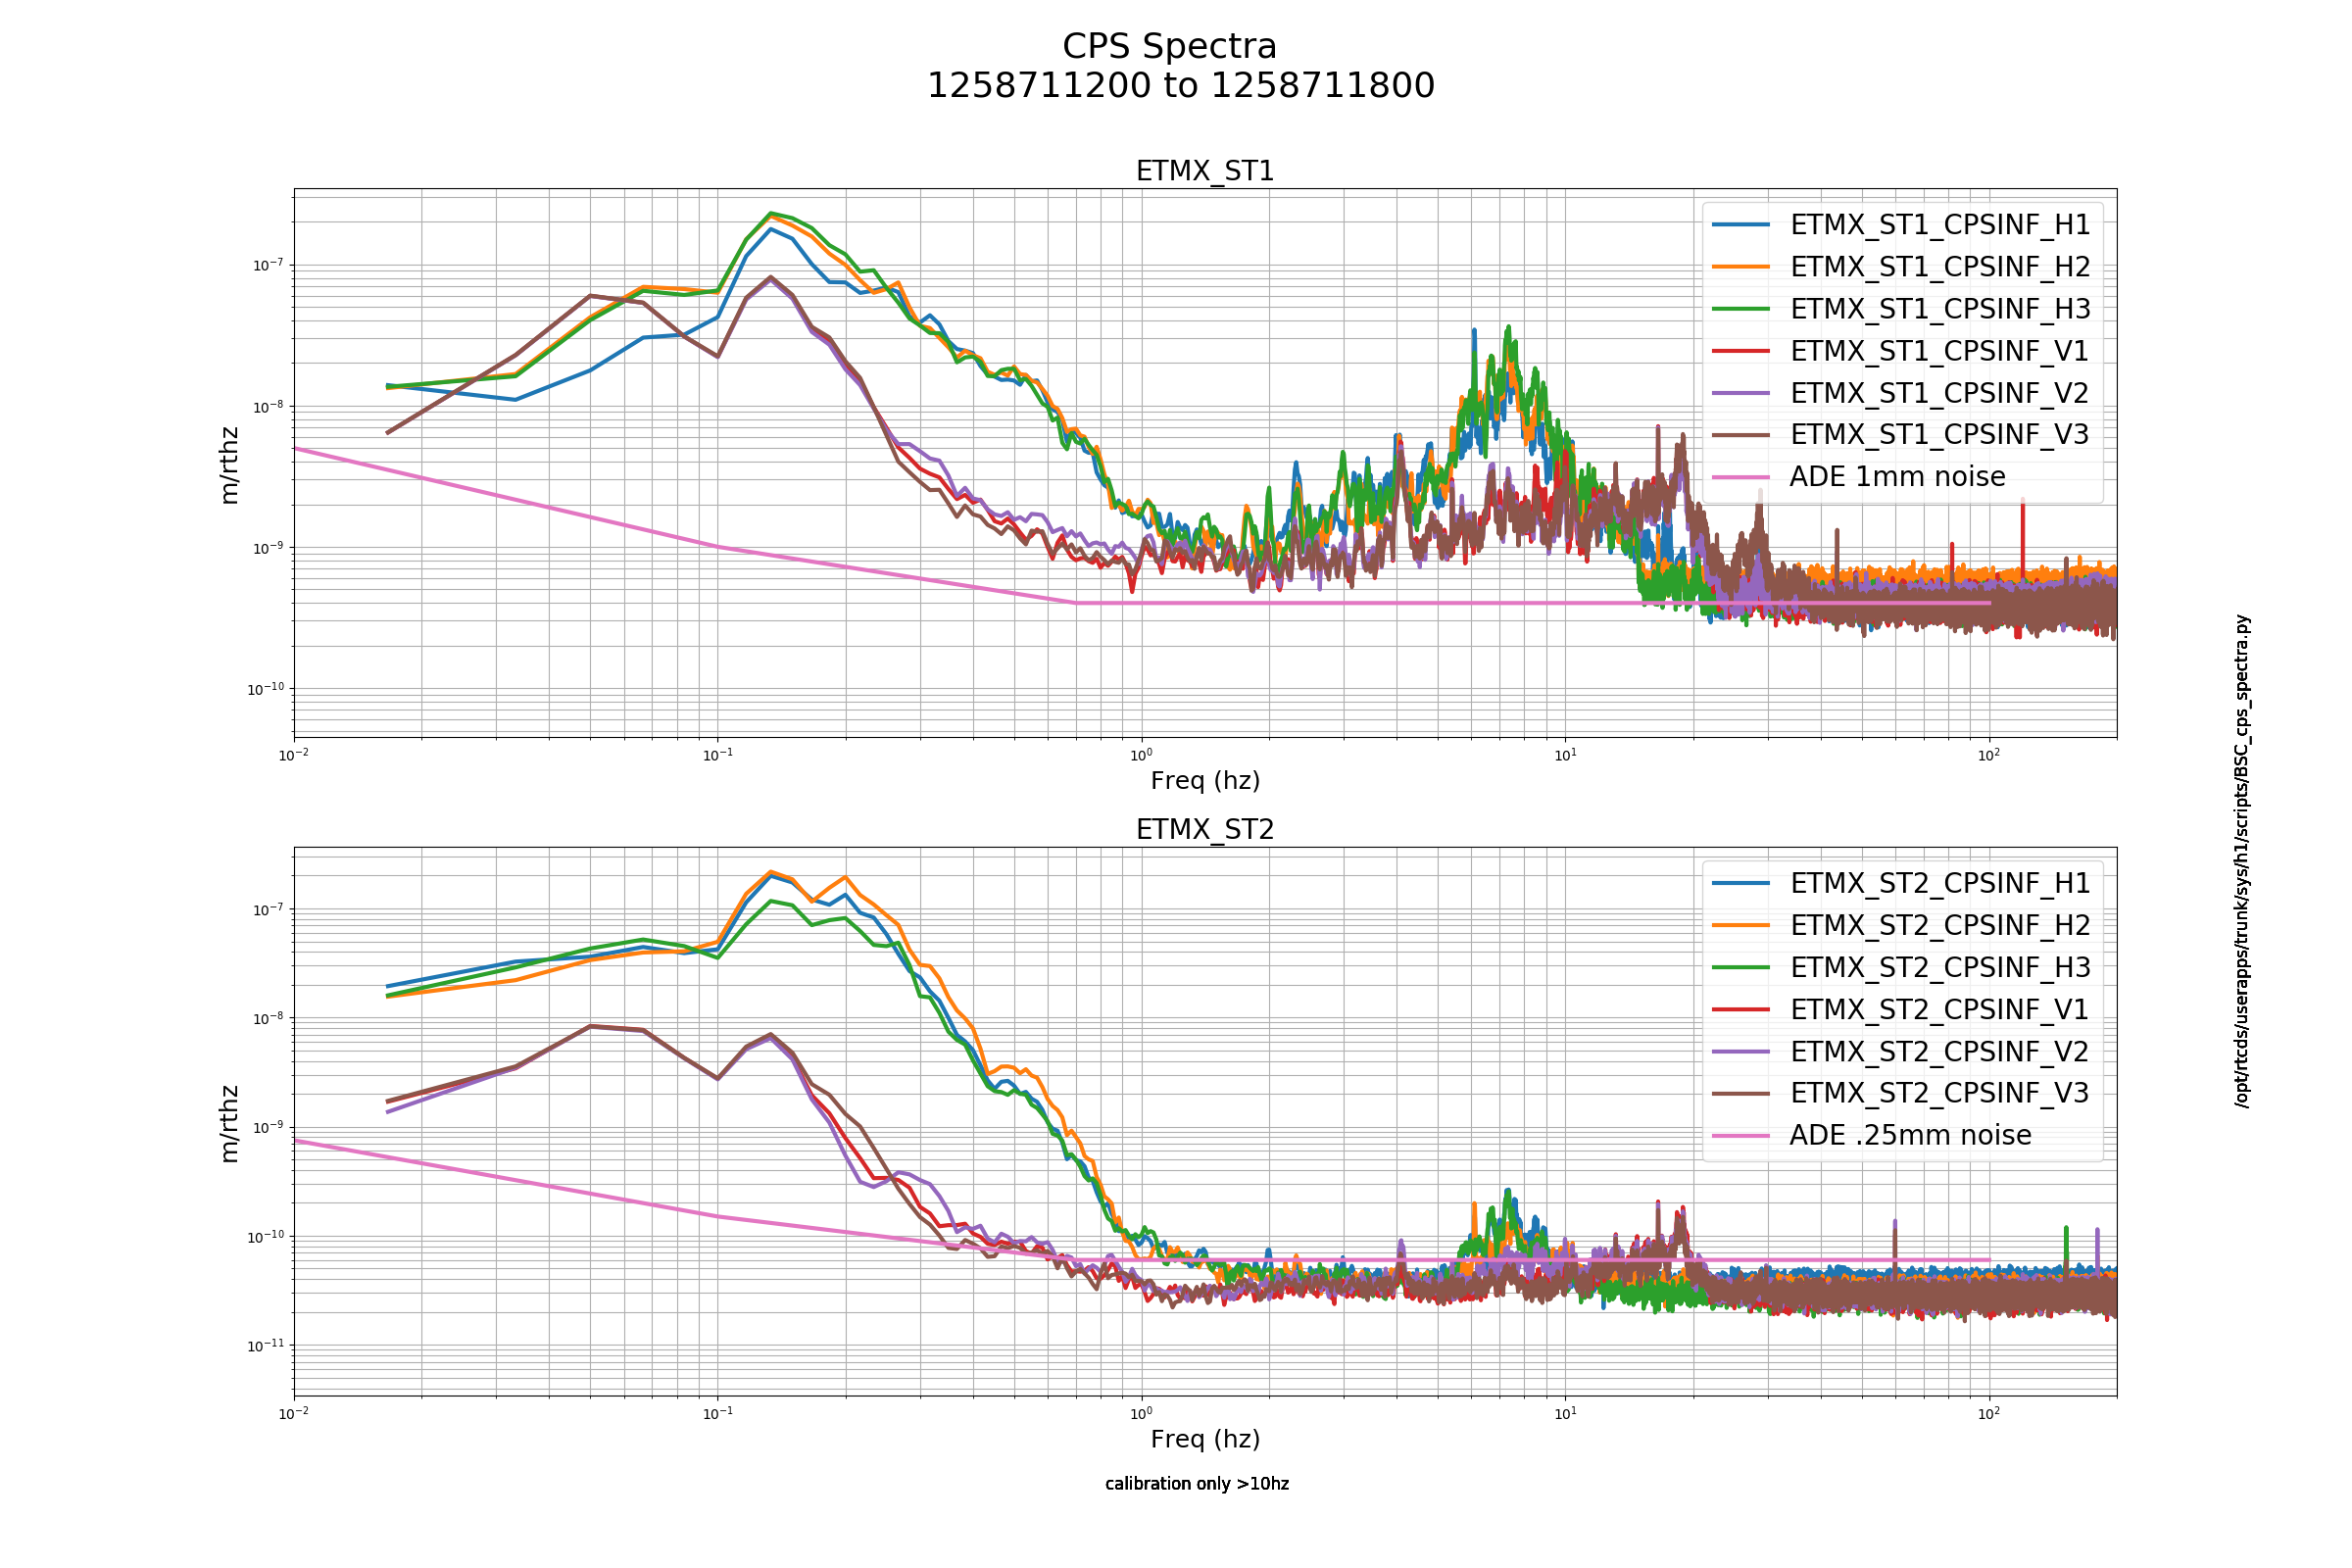
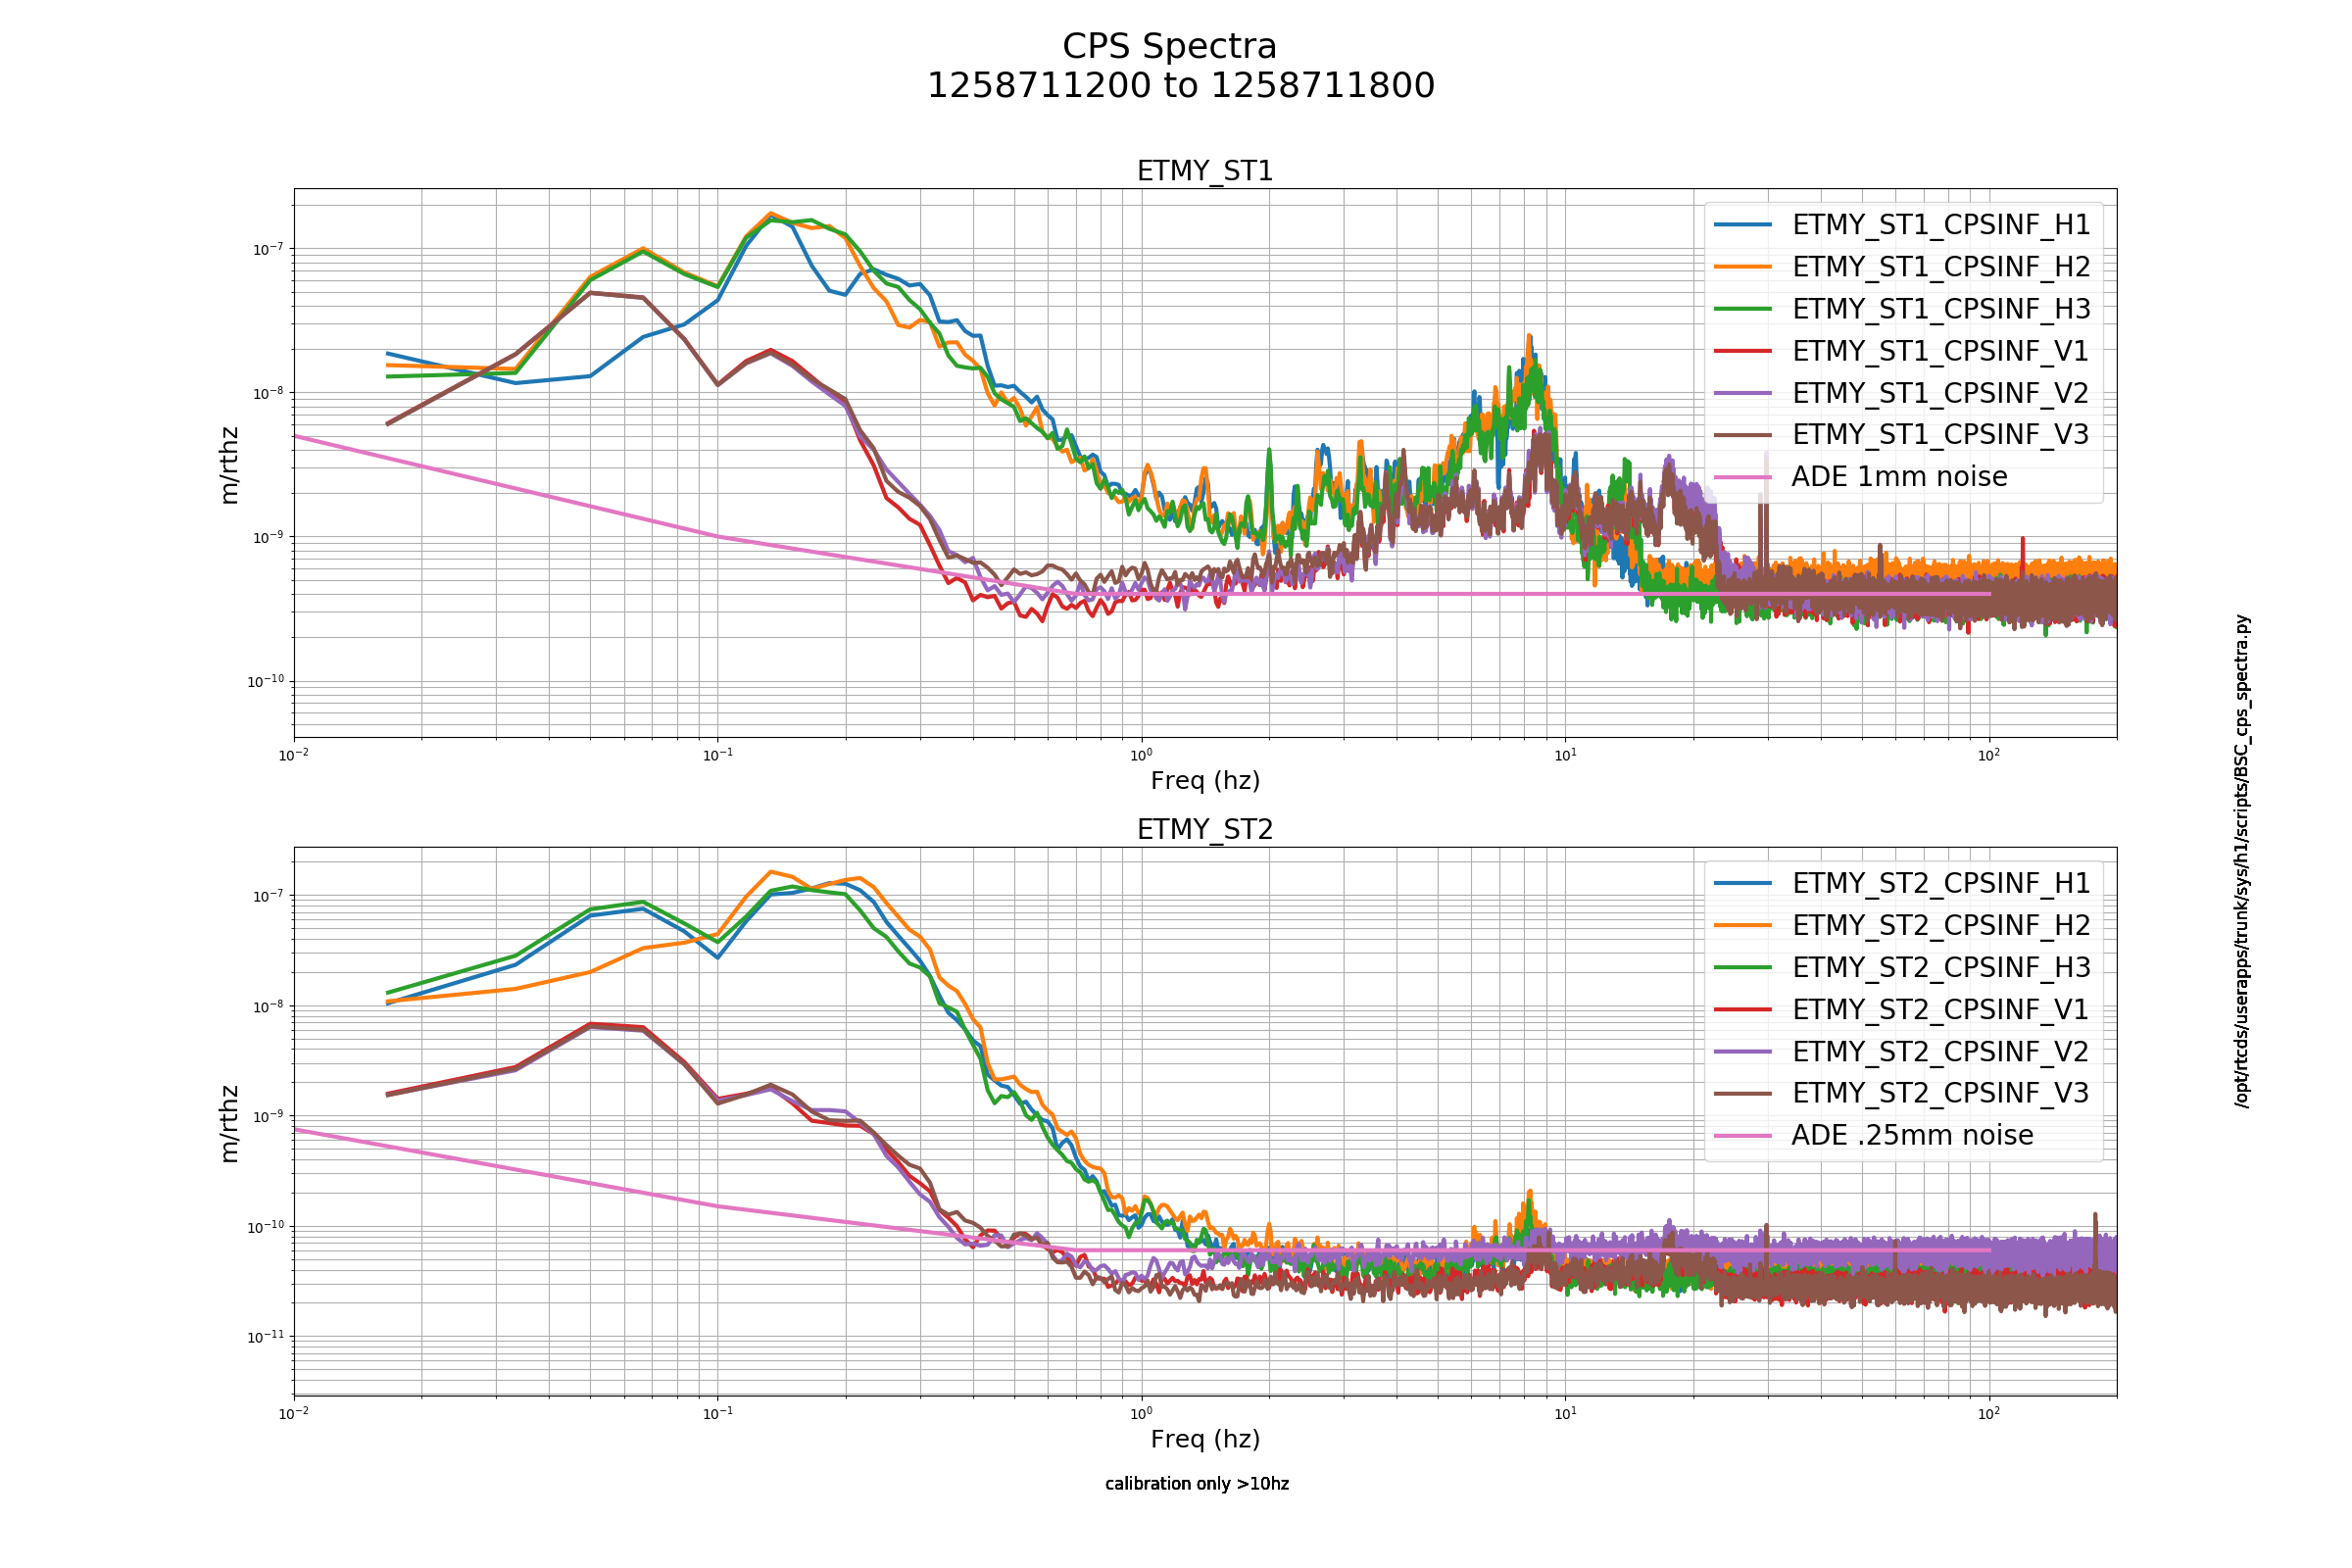
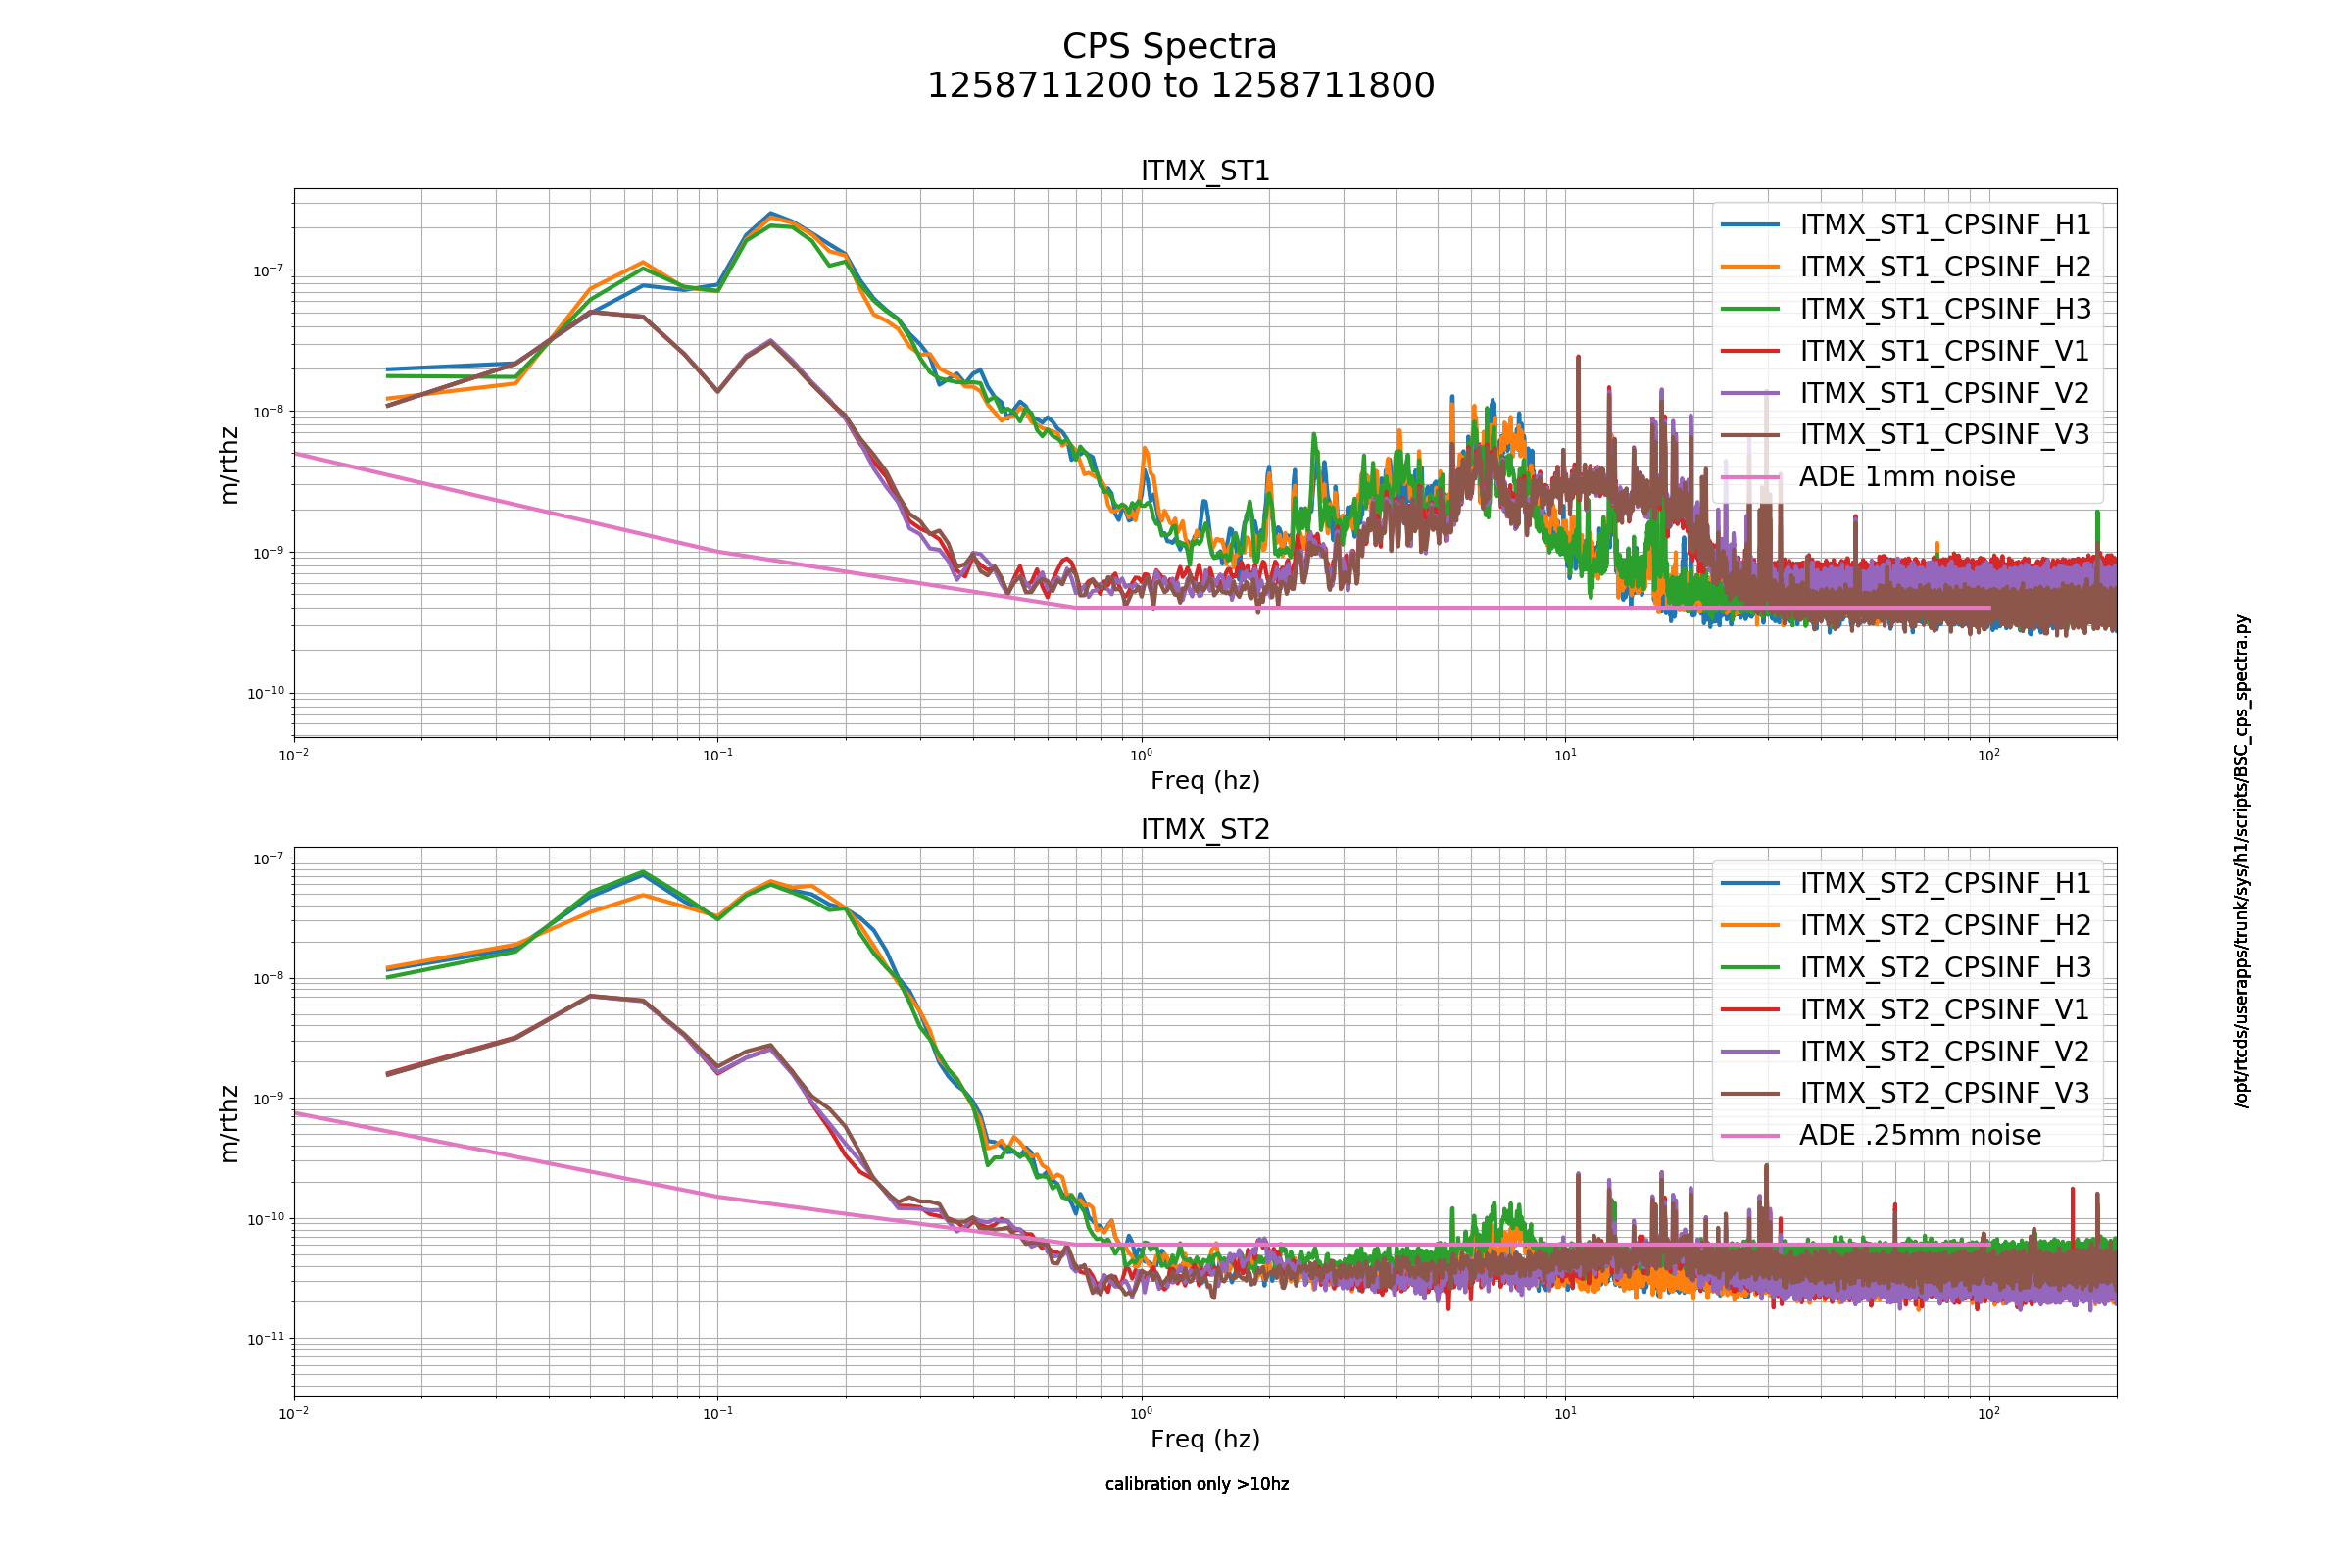
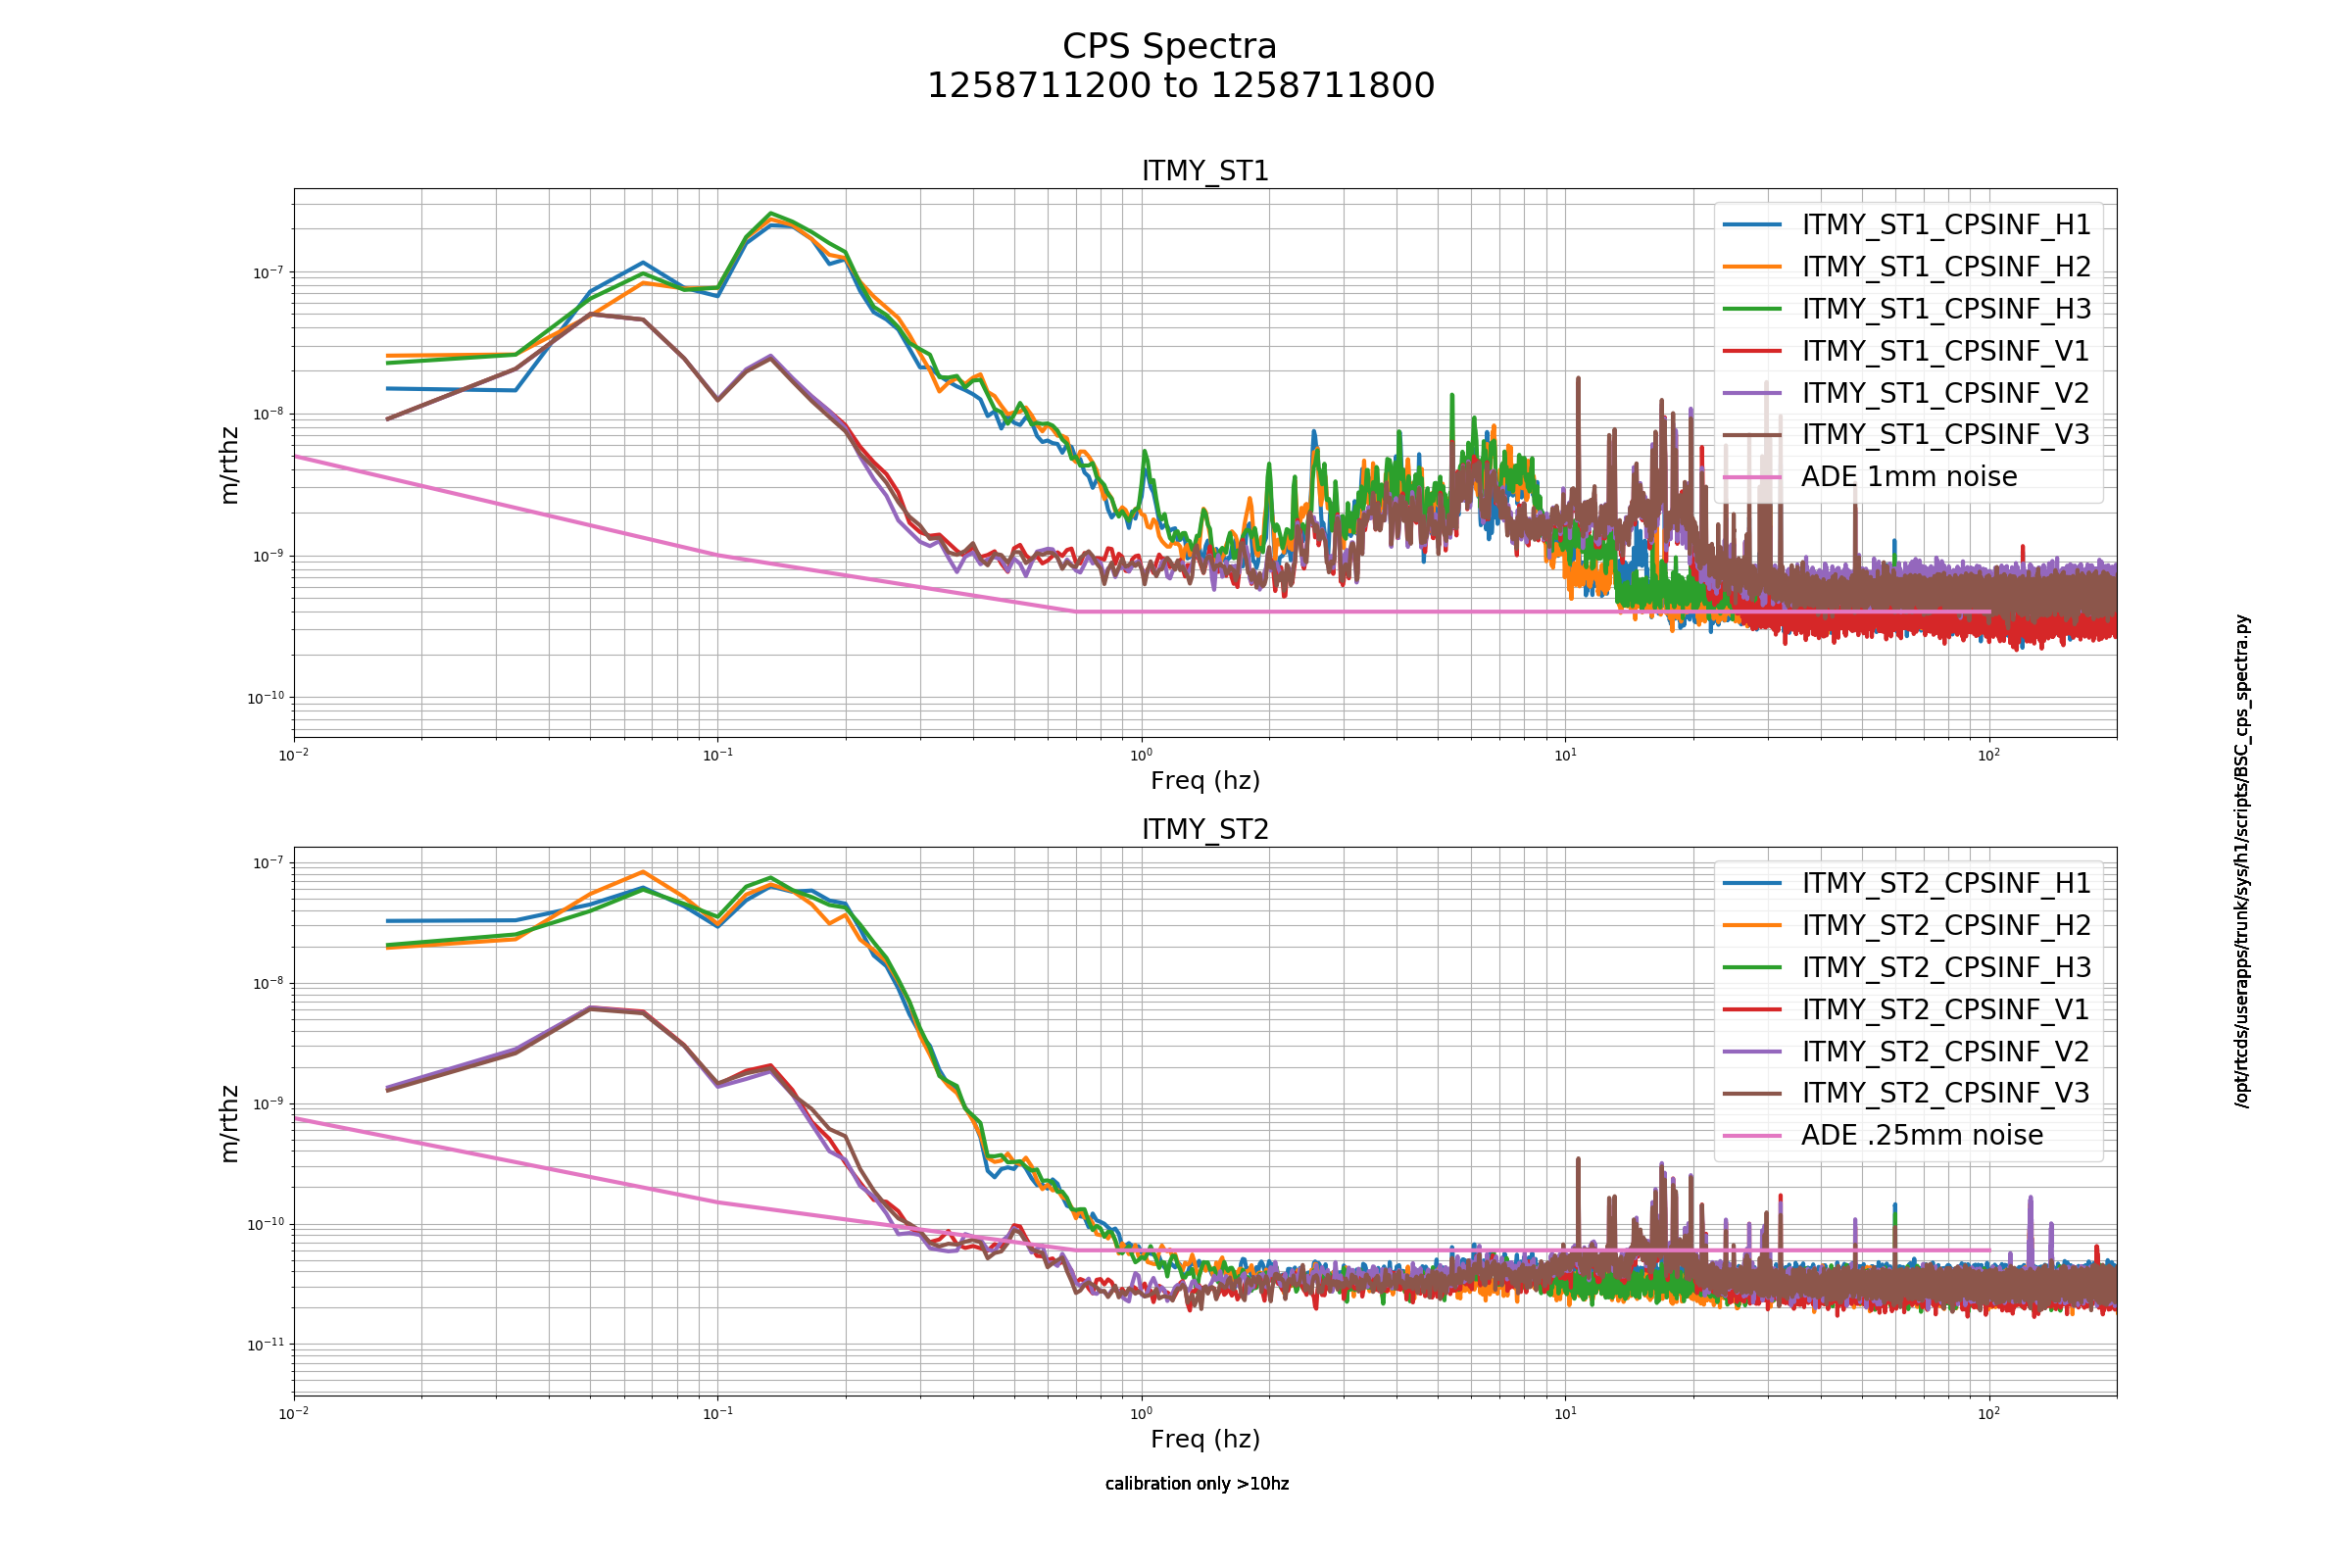
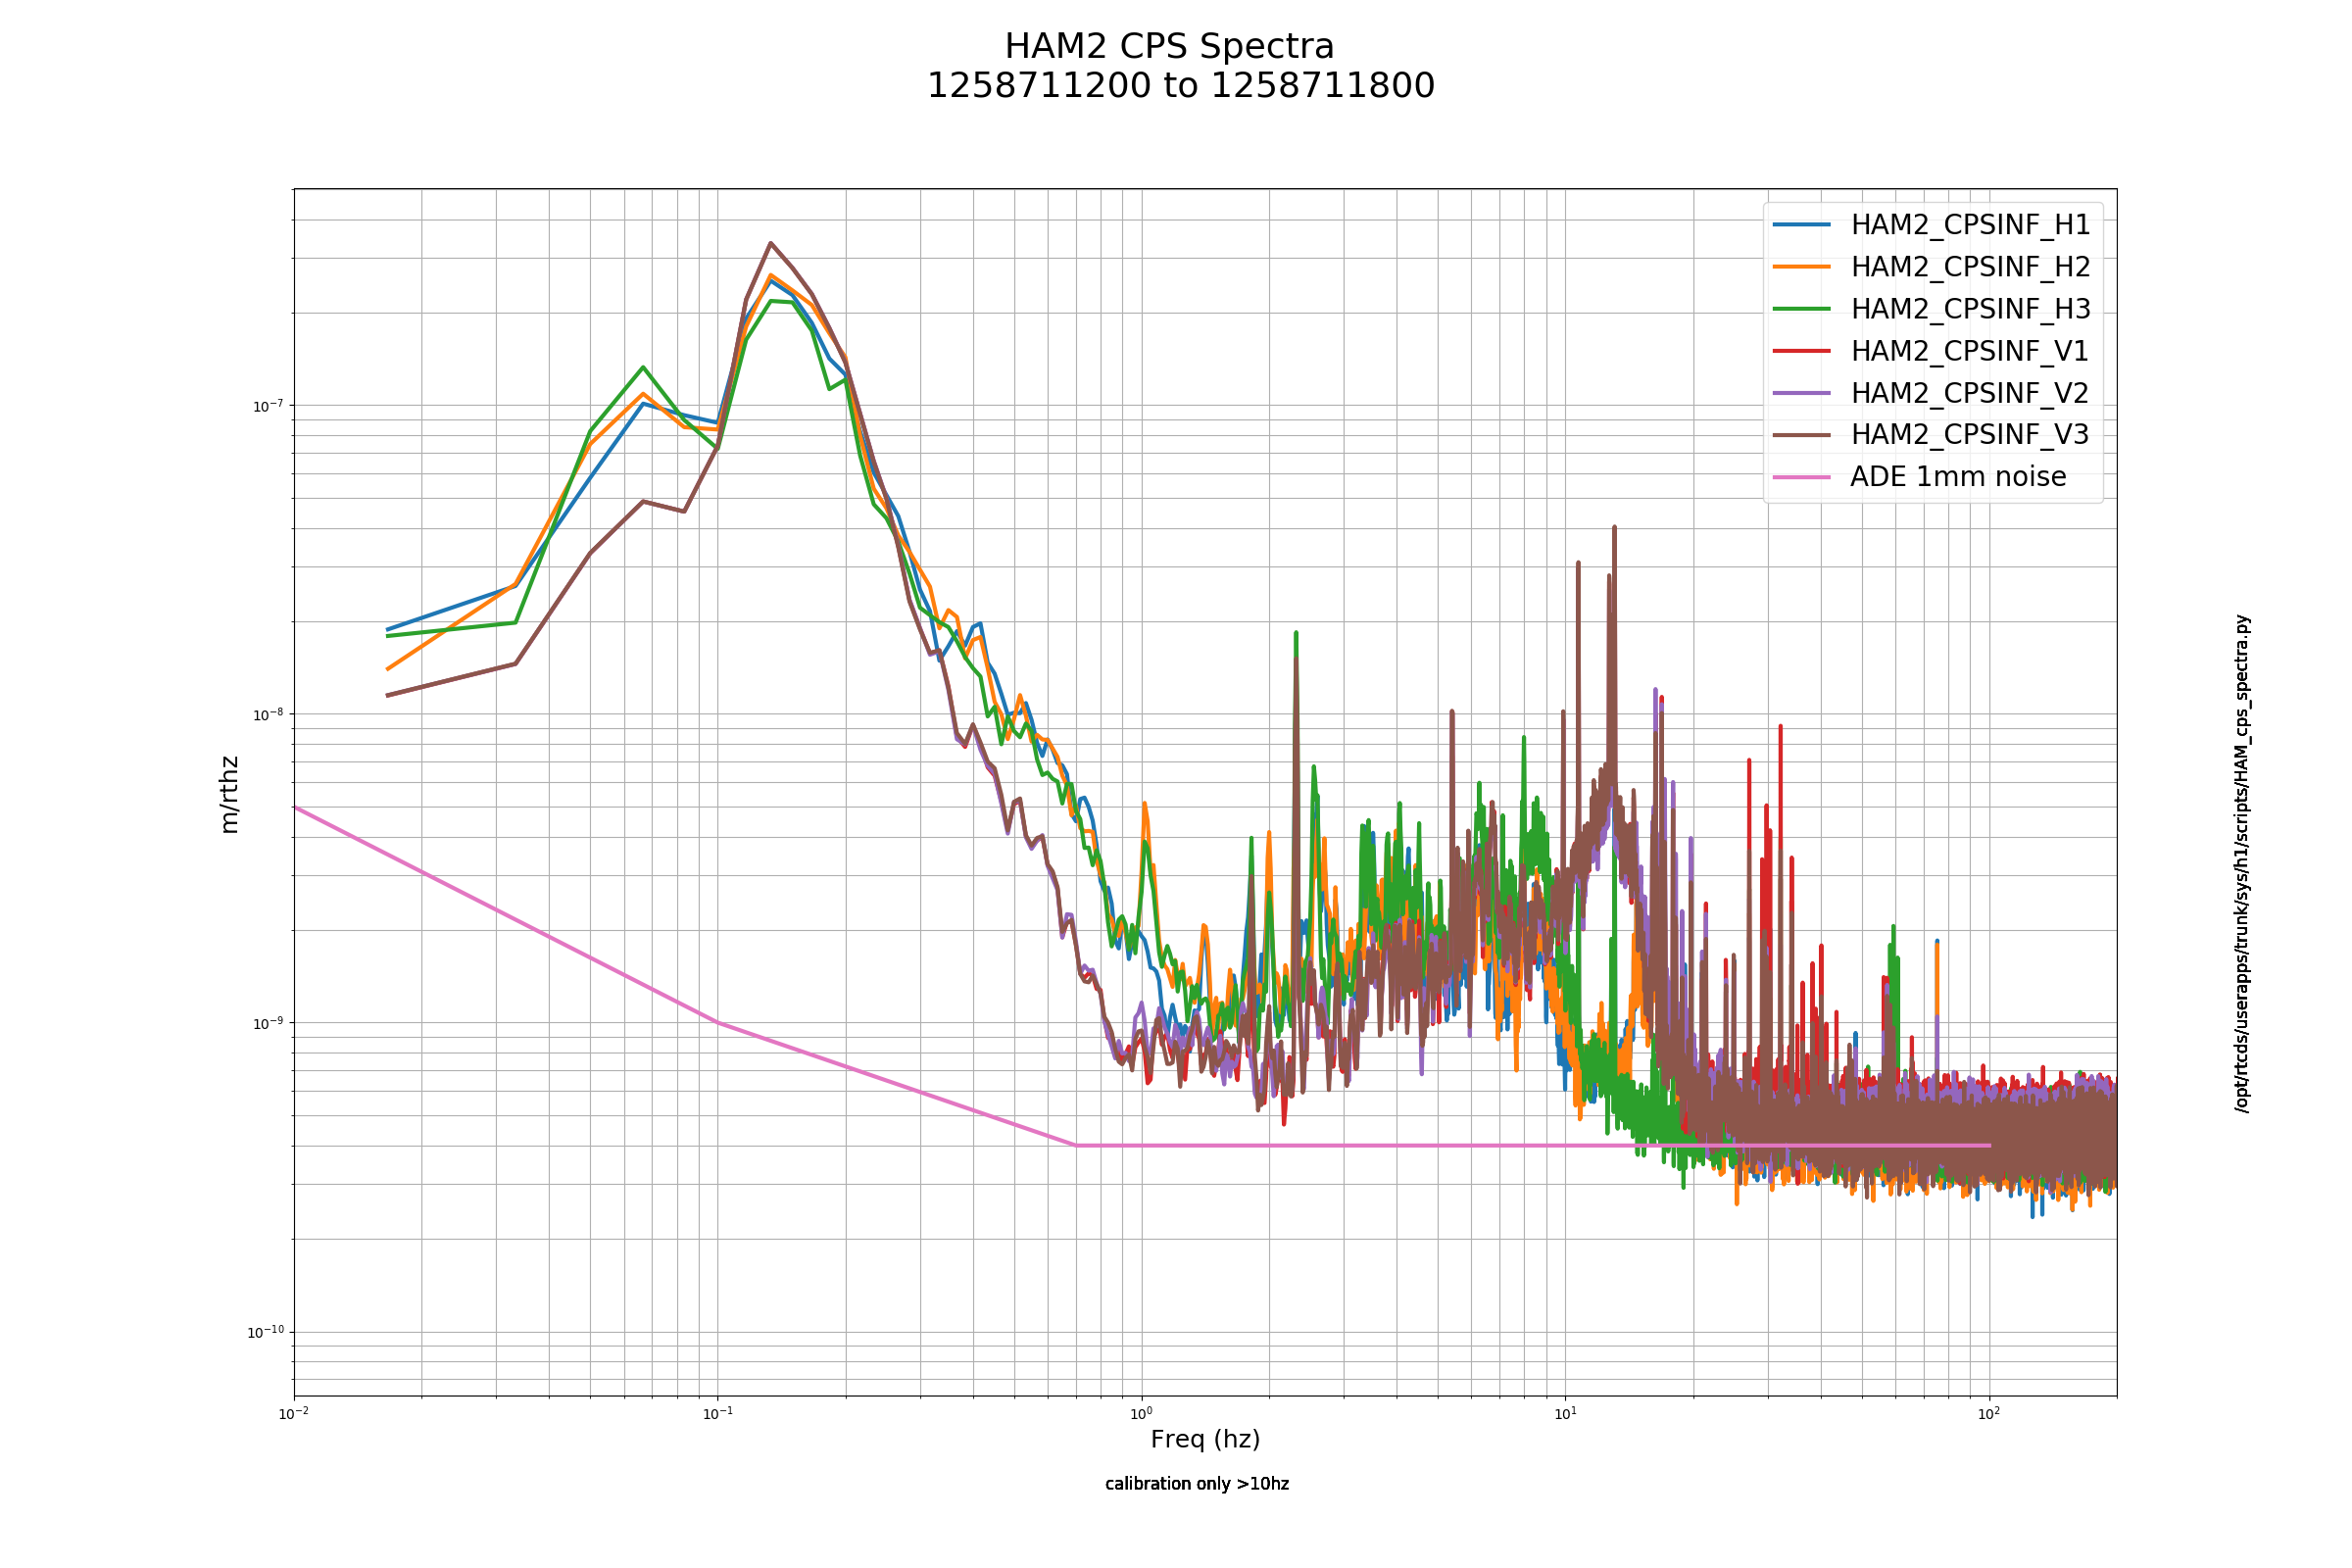
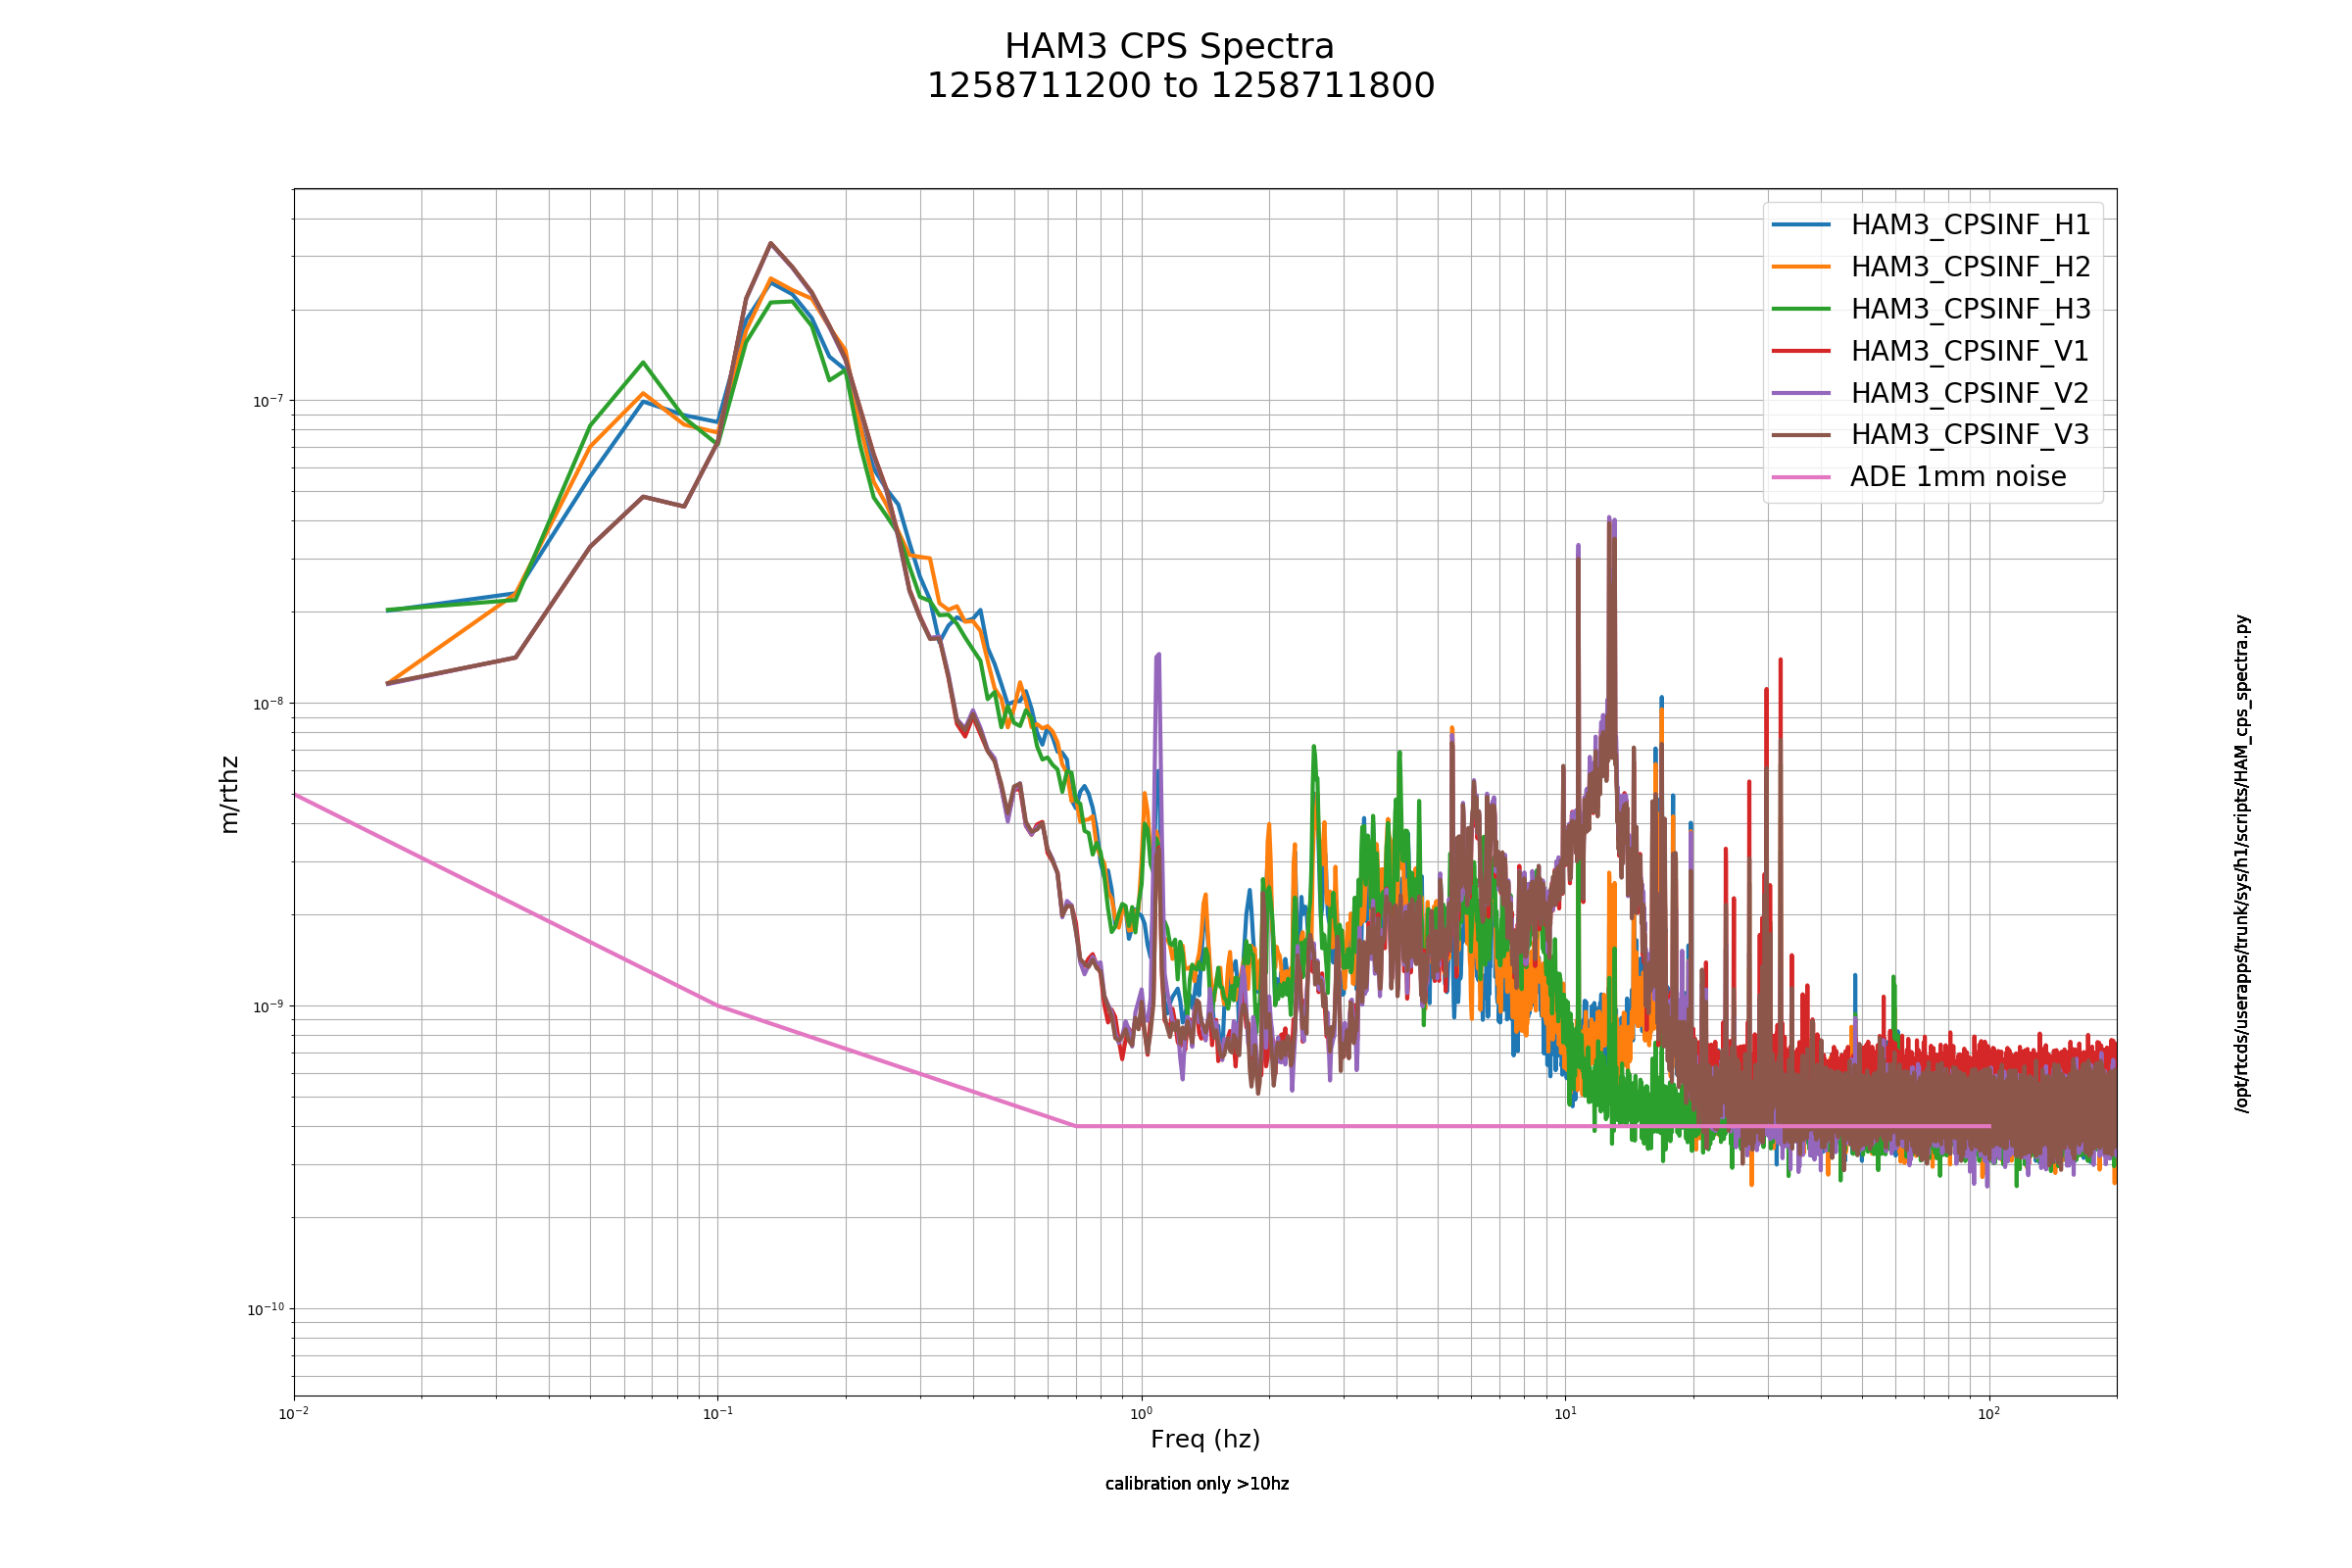
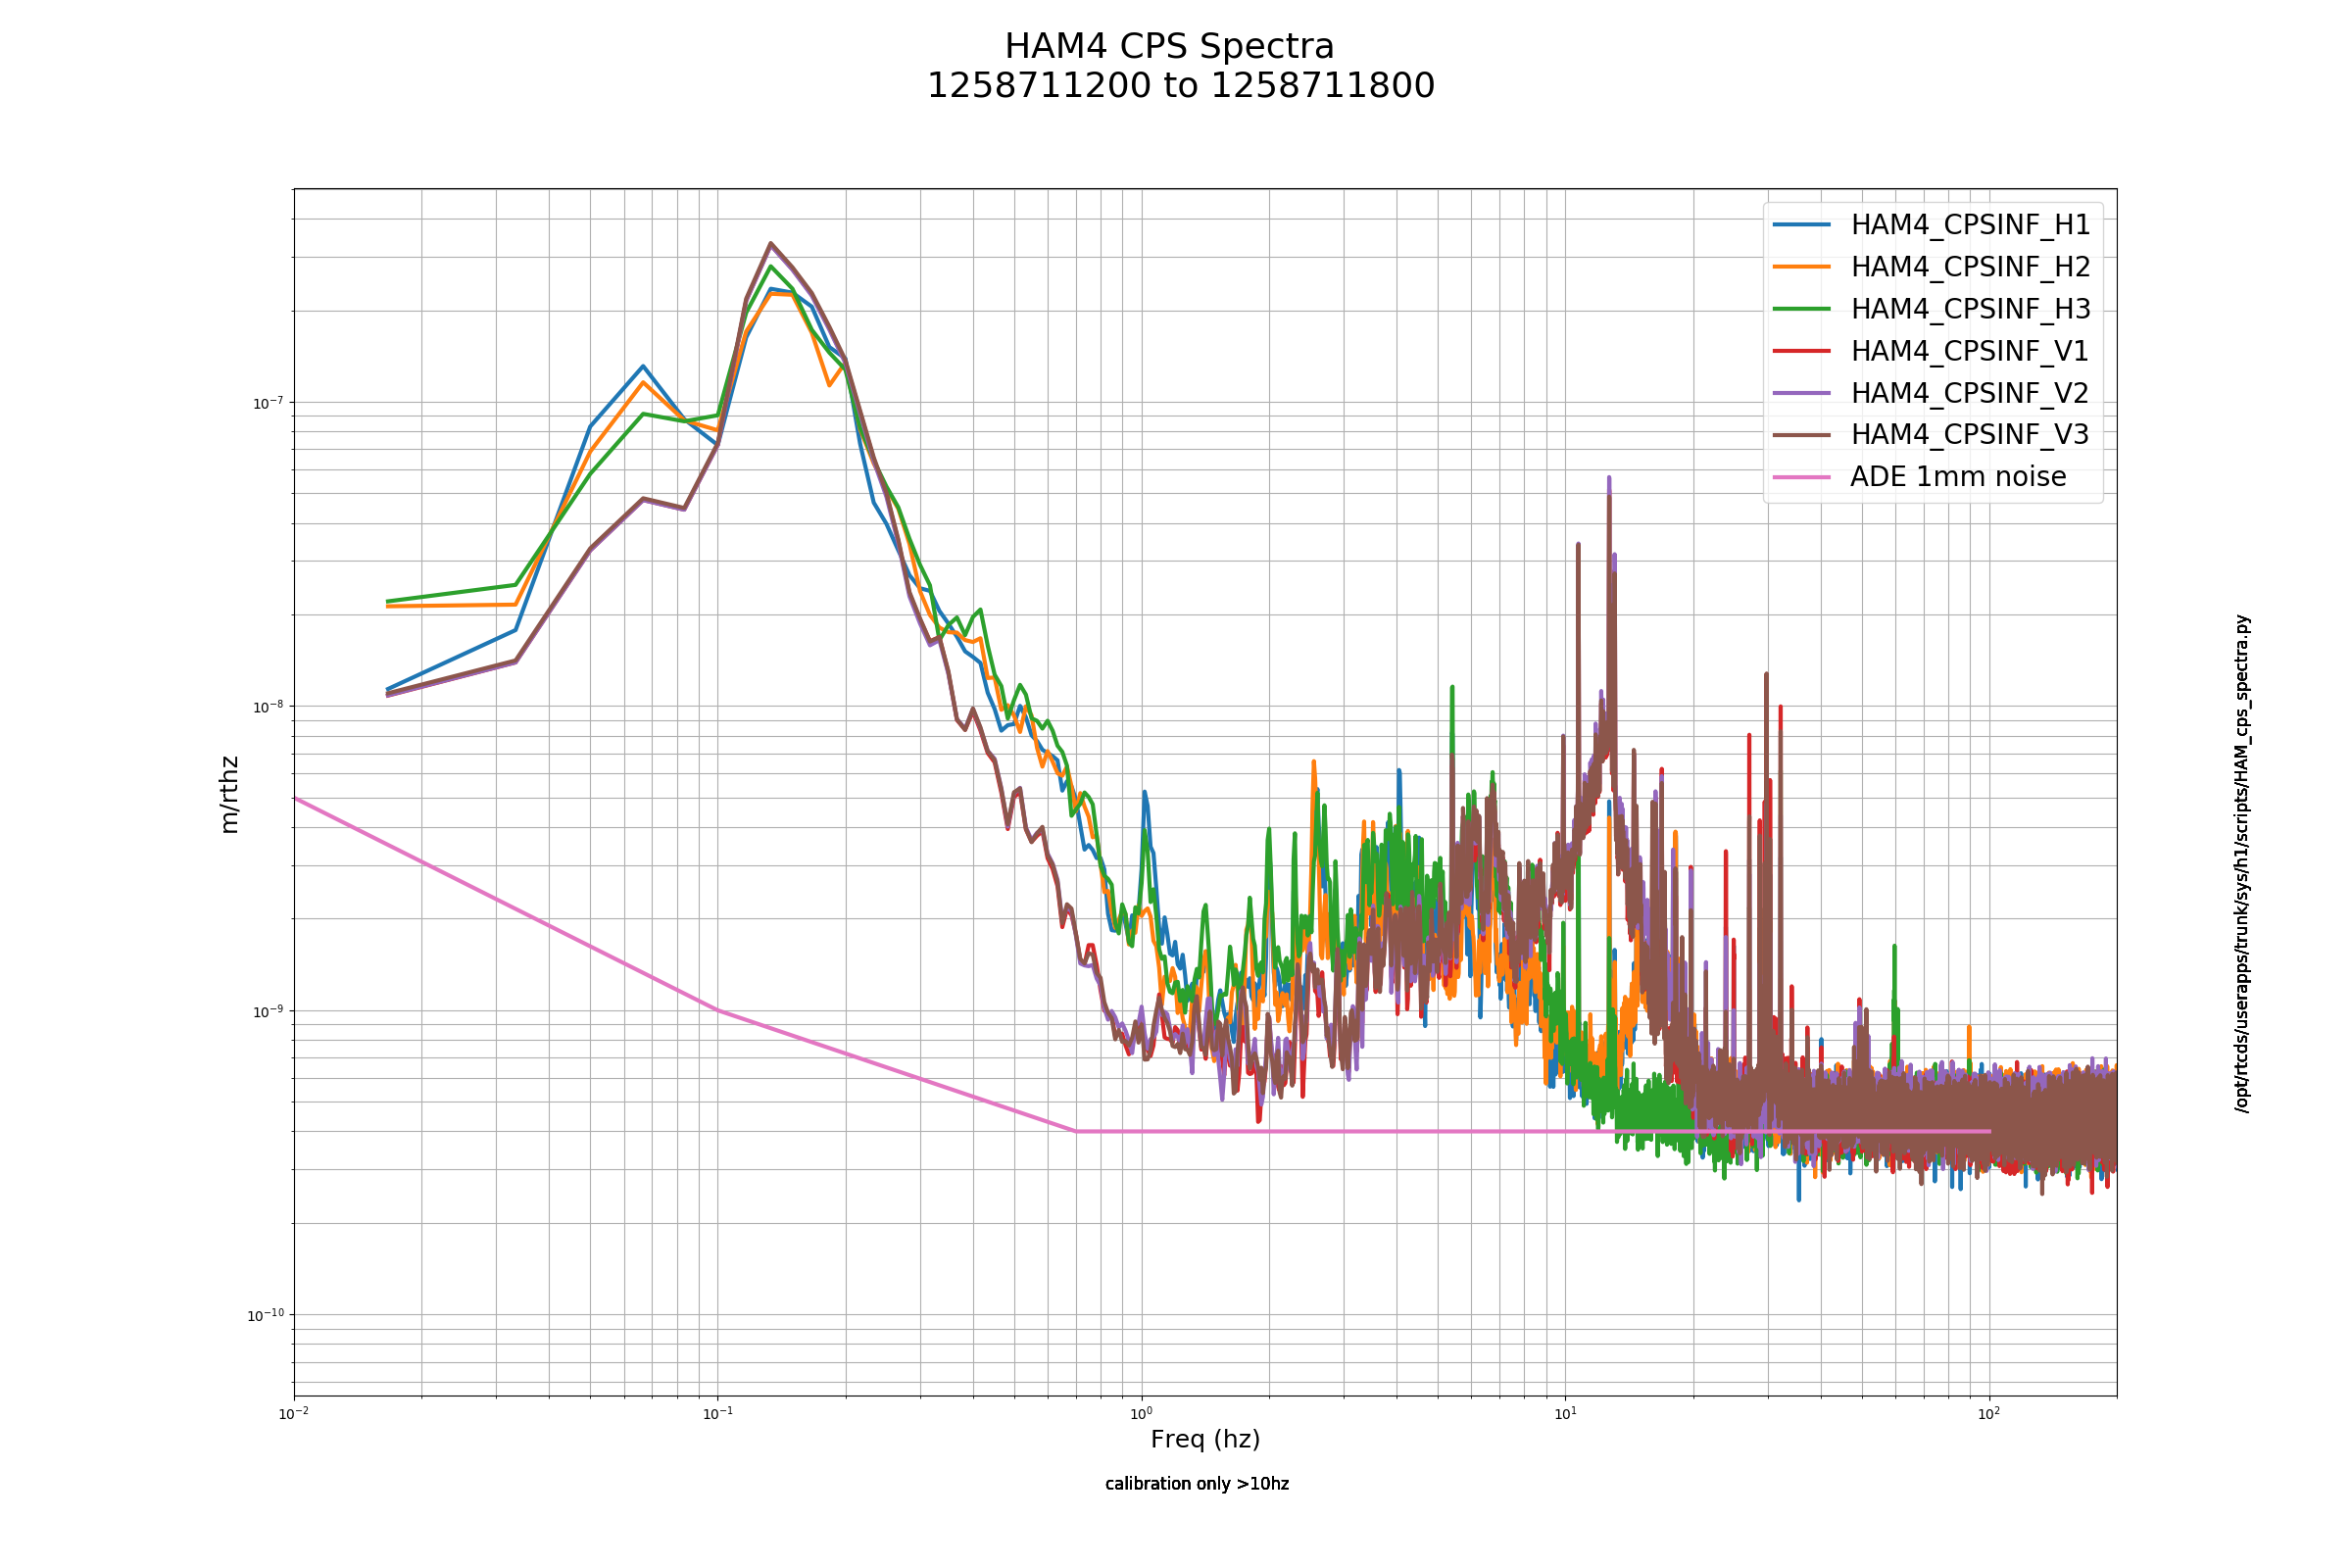
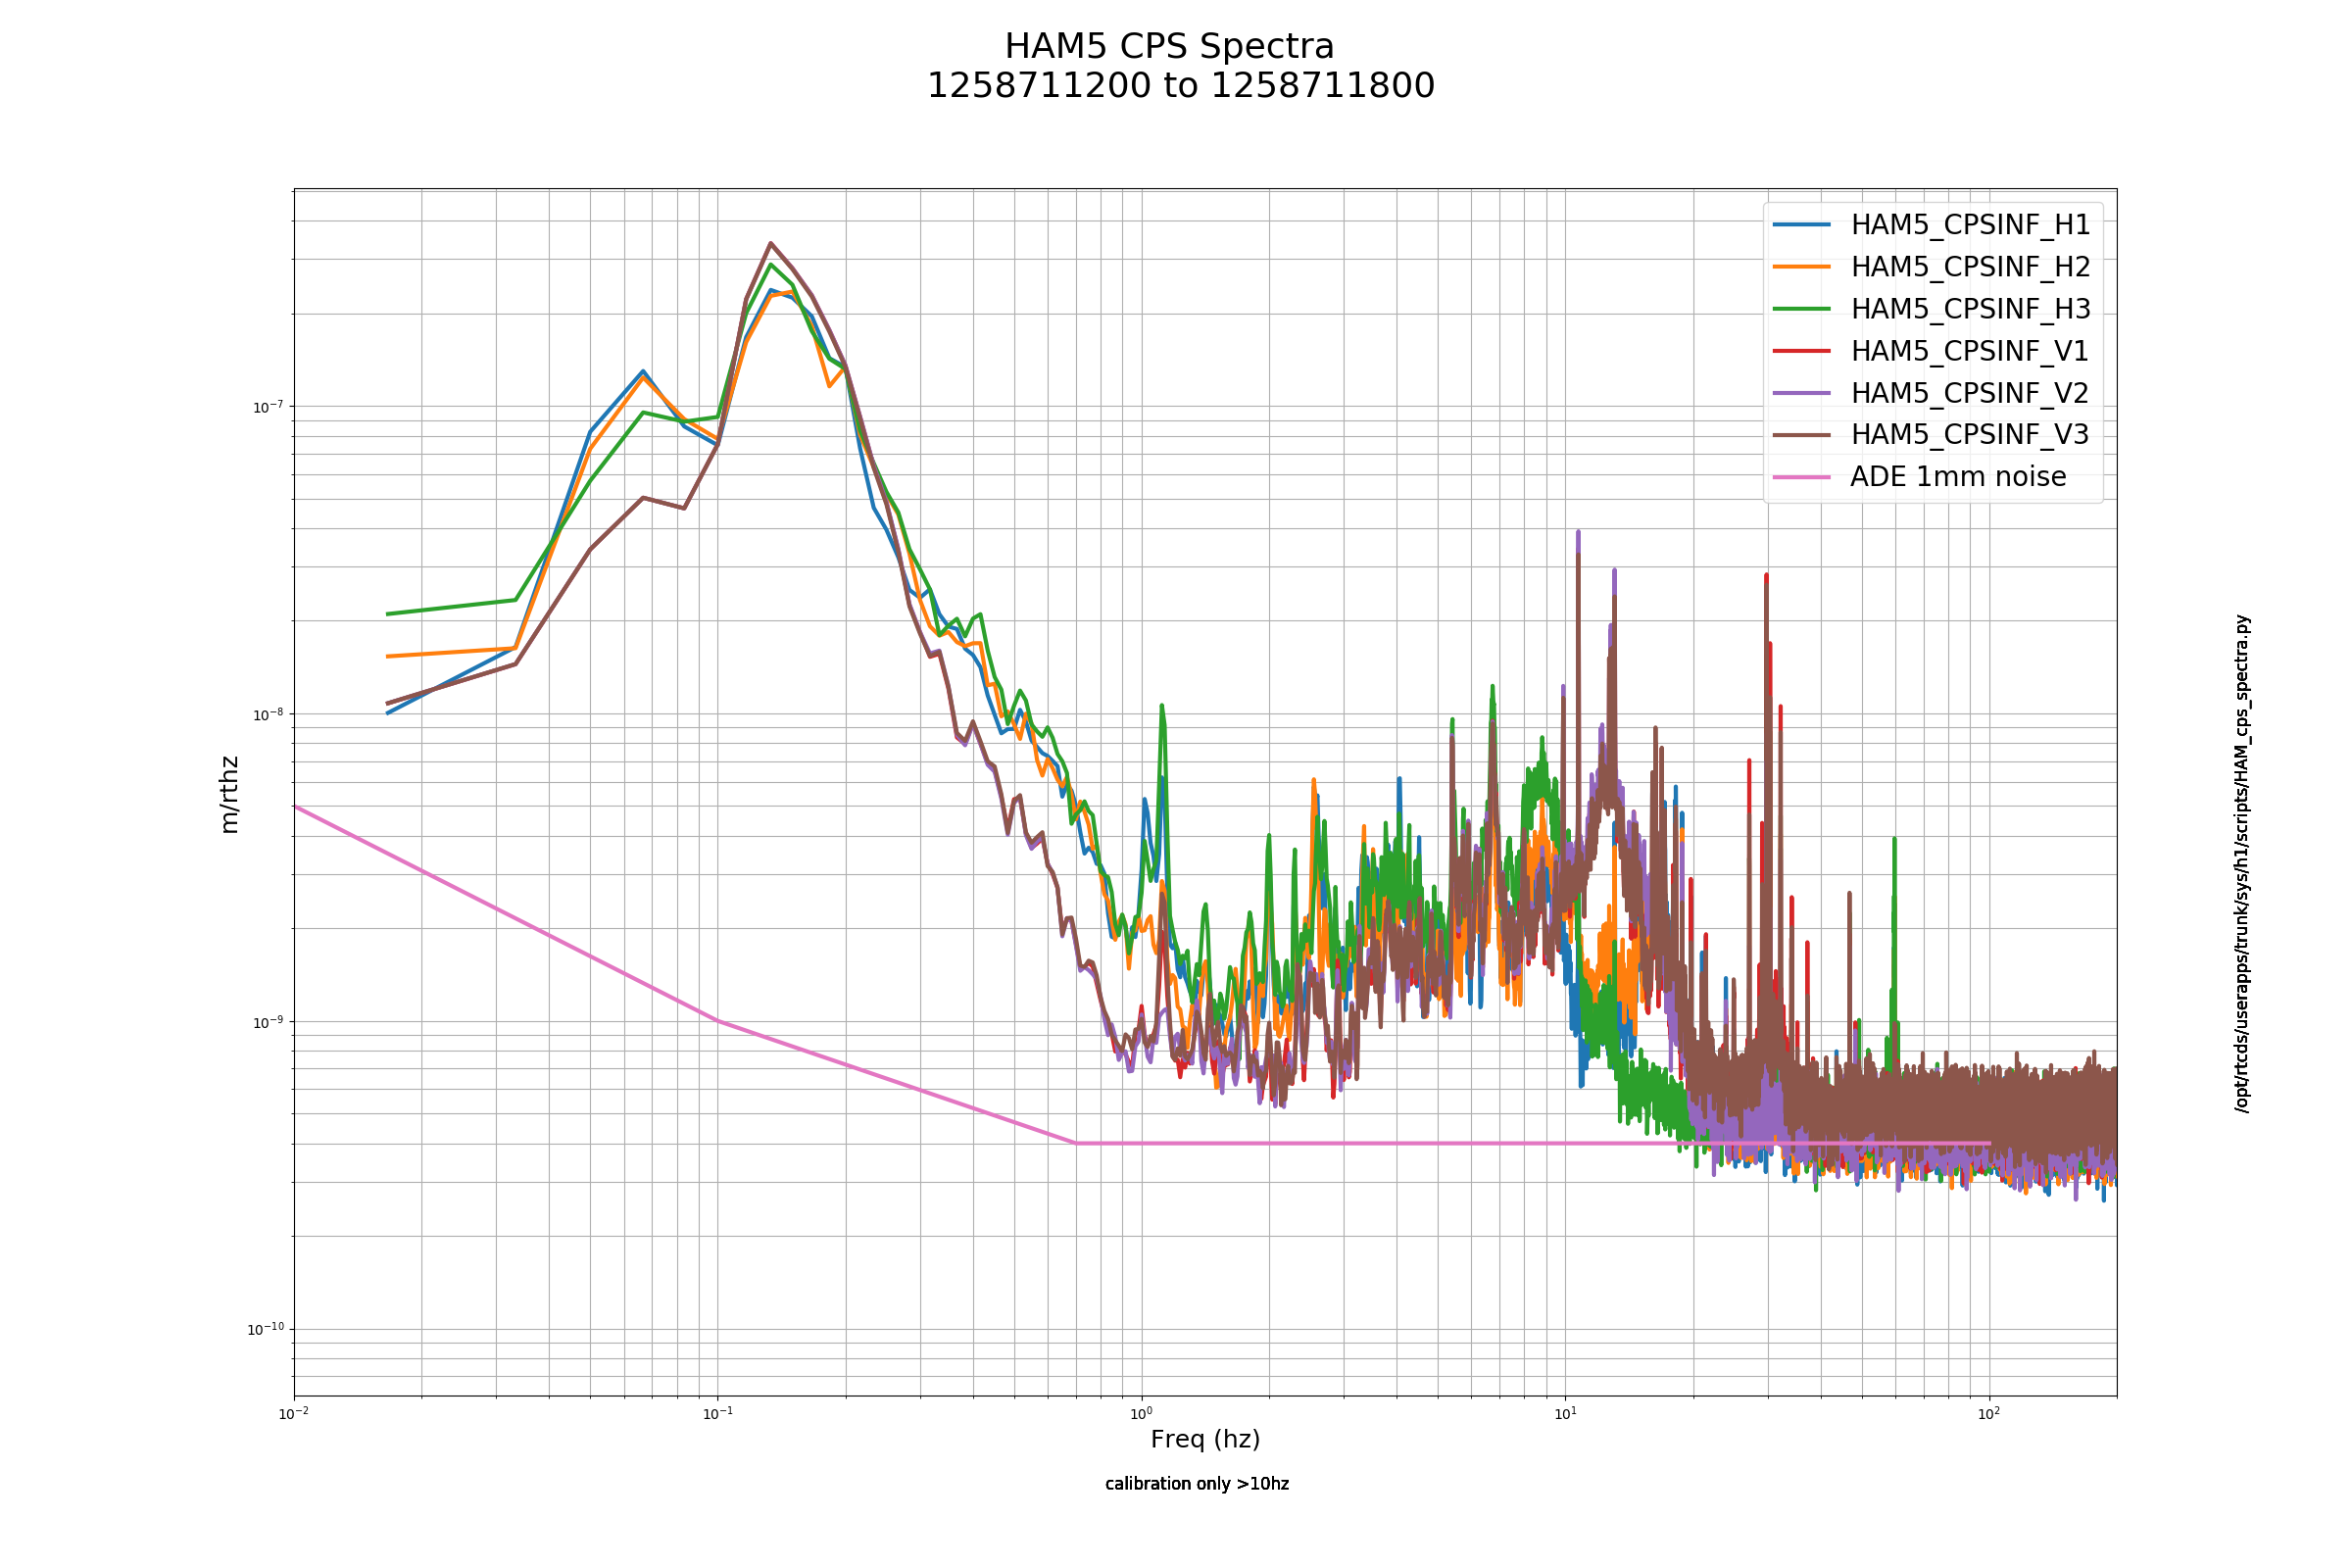
FAMIS 11040
Laser Status:
Front End Power is 32.25W (should be around 30 W)
70W Output Power is 70.23W
Front End Watch is GREEN
70W Watch is GREEN
PMC:
It has been locked 20 days, 7 hr 20 minutes (should be days/weeks)
Reflected power = 11.61Watts
Transmitted power = 52.38Watts
PowerSum = 63.99Watts.
FSS:
It has been locked for 1 days 15 hr and 26 min (should be days/weeks)
TPD[V] = 4.785V (min 0.9V)
ISS:
The diffracted power is around 2.4%
Last saturation event was 1 days 15 hours and 25 minutes ago (should be days/weeks)
Possible Issues: None
TITLE: 11/25 Day Shift: 16:00-00:00 UTC (08:00-16:00 PST), all times posted in UTC STATE of H1: Observing at 113Mpc INCOMING OPERATOR: Camilla SHIFT SUMMARY: Remained locked entire shift. Out of observing for about half an hour for commissioning. No issues. LOG: 16:20 UTC Karen to mid Y 16:39 UTC Karen leaving mid Y 17:03 UTC Ed to mechanical room to check on TCS chiller water 18:42 UTC Hugh to optics lab 18:54 UTC Hugh back 19:14 UTC Karen to H2 building 20:34 UTC Received Hanford monthly alert phone call 21:00 - 21:31 UTC Commissioning meeting 22:10 UTC Out of observing for Sheila and Sudarshan to run measurements 22:21 UTC Jason to optics lab 22:22 UTC Jim changing a filter on HAM4 22:35 UTC Sheila and Sudarshan done 22:37 UTC Back to observing 23:55 UTC Gerardo back from mid station 23:55 UTC Jason back
S. Dwyer, K. Kawabe, J. Kissel As we continue to gather evidence for the PUM driver actuator noise impacting DARM (see LHO aLOGs 53329 and 53253), we need an estimate of how much closer we would be to regular DAC saturation if we engaged the analog low-pass filter, transitioning from "State 1" to "State 3" -- and thus requiring a digital compensation filter that would amplify the existing request by a filter with two zeros at 0.5 and 250 Hz and two poles at 6 and 20 Hz (i.e. the ratio between state 1 and state 3). Attached is plot of the results for ETMX. I only plot the estimate for the H1 ETMX PUM UL coil, because - I've confirmed via measurement that UL is exemplary of all coils on the ETMX PUM. - We assume that ETMX PUM is a "worst case," since it is the only QUAD which receives both LSC and ASC drive at the PUM stage. The conclusion: by using State 3, we decrease our nominal low noise safety margin by 1 - (12.46 / 9.207) = 35%, but we're still a factor of 9 away. Note on the current conditions: useism between 90th and 50th percentile region at around 0.5 um/s, in low-ish winds at 10 mph. It is our plan to indeed code up the engagement of State 3 (ACQ OFF, LP ON) in the LOWNOISE_COIL_DRIVERS state tomorrow during maintenance, such that all subsequent observation ready segments will have state 3 engaged (until otherwise noted). One hopes that we would switch to State 3 *after* most of the lock acquisition sequence is complete, so the ASD shown here (taken during an observation ready segment) should be representative of the environment and requested drive that we would typically have. Driver Type Circuit Iso. Stages State Switch State Freq. Resp DC Transconductance [mA / V] ACQ | LP (z):(p) [Hz] [mA/V] PUM D070483-v5 QUADL2 1 OFF | OFF (12):(110) 0.27 2 ON | OFF (1.35):(80.5) | 3 OFF | ON (6 12 20):(0.5 110 250) | 4 ON | ON (1.35 6 20):(0.5 80.5 250) V You can find a plot of the magnitude difference between the states in the plot here, pulled from LLO aLOG 4495 The template for gathering the data lives here: /ligo/svncommon/SusSVN/sus/trunk/QUAD/H1/ETMX/SAGL2/Data/2019-11-25_H1SUSETMX_Actuator_DAC_Output.xml The script to process the exported data for the PUM lives here: /ligo/svncommon/SusSVN/sus/trunk/QUAD/H1/ETMX/SAGL2/Scripts/estimate_coildriverstate_impact_PUM_20191125.m
For a similar study on the UIM coil driver, see LHO aLOG 53486.
Around 22:24:00 UTC, during a commissioining period, I turned off the new iterative LSC feedforward filters. We will see if the range is a teeny bit better with these turned off, or not. If it is, then that implies that the requirements on the fits of the iterative filters are more stringent than I had thought, and will need to be done more carefully.
The range definitely went up a bit. I'll look at either fitting these more carefully, or perhaps trying to fit the iteration-of-the-iteration data that I took after installing these filters last week.
Summary:
Quantization error in QUAD suspension L1, L2 and L3 DAC channels are almost negligible except for ETMY L1 (which is only used for tidal).
ETMY L1 quantization noise is ~8E-3cts/sqrtHz per coil below 200Hz (as opposed to uniformly distributed error of 1.6E-3cts/sqrtHz), and this is just about a factor of 4 below the DARM feedback applied to EX L1 coils at 40Hz or a factor of 6 to 7 at 80Hz. Since the noise is incoherent between coils, there's another factor of 2, so overall this is about a factor of 8 at 40Hz or a factor of 12 to 14 at 80Hz.
It's not clear how much this matters to DARM (unless we apply the suspension model), but since EY L1 is only used for tidal, this noise is unnecessarily applied anyway. We should be able to enable any one of 3 stages of LPFs to mitigate this by a factor of 10.
Details:
I started checking if each DAC has an appropriate level of output such that the quantization noise is negligible. I looked at QUADs as the starting point.
Turns out that the only DAC that could matter is EY L1 OSEMs which receive only tidal as the input. Since tidal is just some really low frequency signal, digitization error power is concentrated to lower frequency.
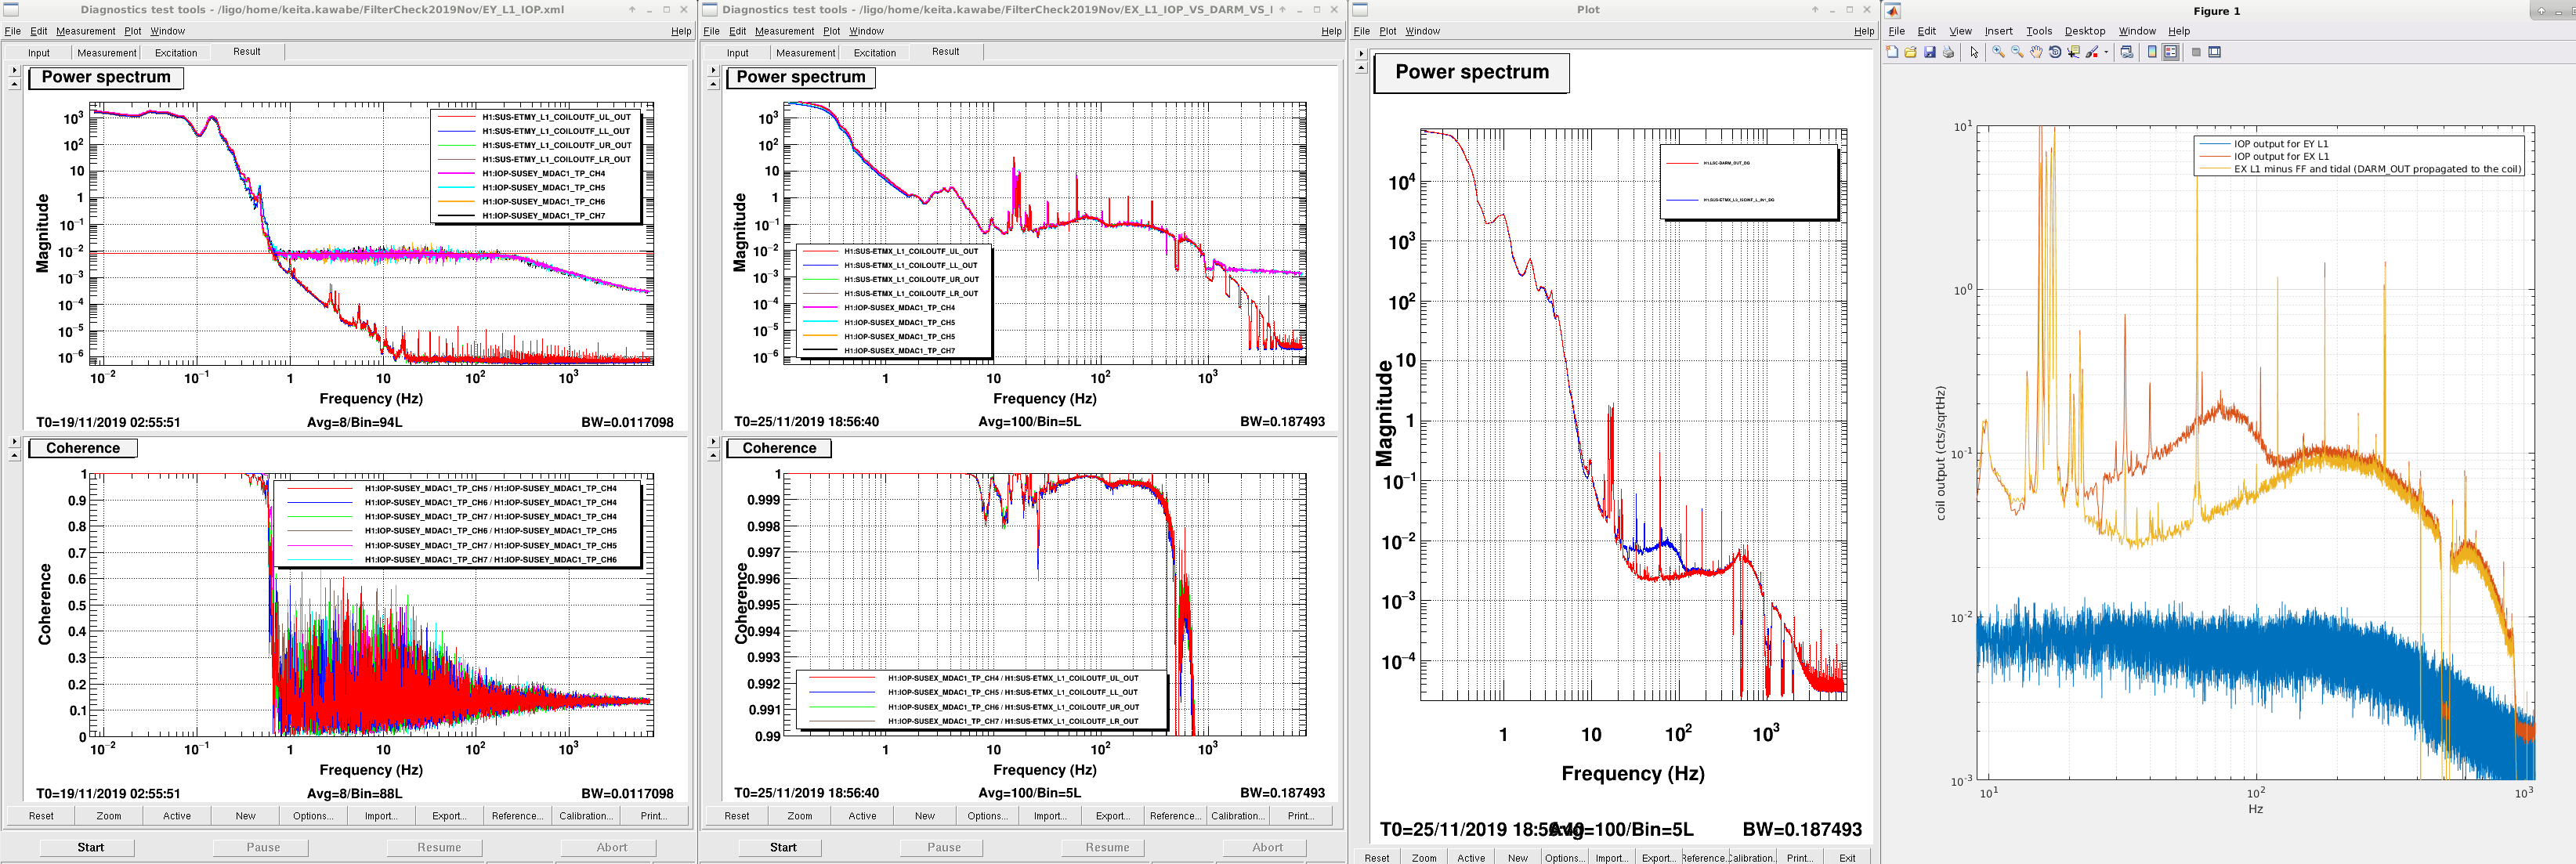
In the first attachment, to the left is the ETMY L1 stage coil ouputs (the most downstream of the user model) and the corresponding IOP outputs (that are the same as coil outputs but after upsampling, low-passing and then casting to integer) during the observation.
In an ideal uniformly distributed error, the digitization error spectrum will be sqrt(1/12) /sqrt(32768Hz)= 1.6E-3 cts/sqrtHz, but in the case of EY L1 it's about 8E-3cts/sqrtHz below 200Hz or so. The noise go down as the frequency becomes higher.
OTOH, the middle left panel is ETMX L1 stage coil outputs and IOP channels. High frequency noise in IOP is roughly consistent with the uniformly distributed error.
This is already a useful comparison, but I wanted to know how much of ETMX L1 stage output is coming from DARM feedback (other components are LSC feedforward and tidal), so I looked at the DARM_OUT and ETMX L3 ISC_INF (middle right). As you can see a funny bump between 20 and 100Hz is from LSC FF.
Finally I propagated DARM_OUT through the filter chain in EX to one of L1 coils (right, yellow-ish) and plotted with EX and EY IOP output (orange and blue).
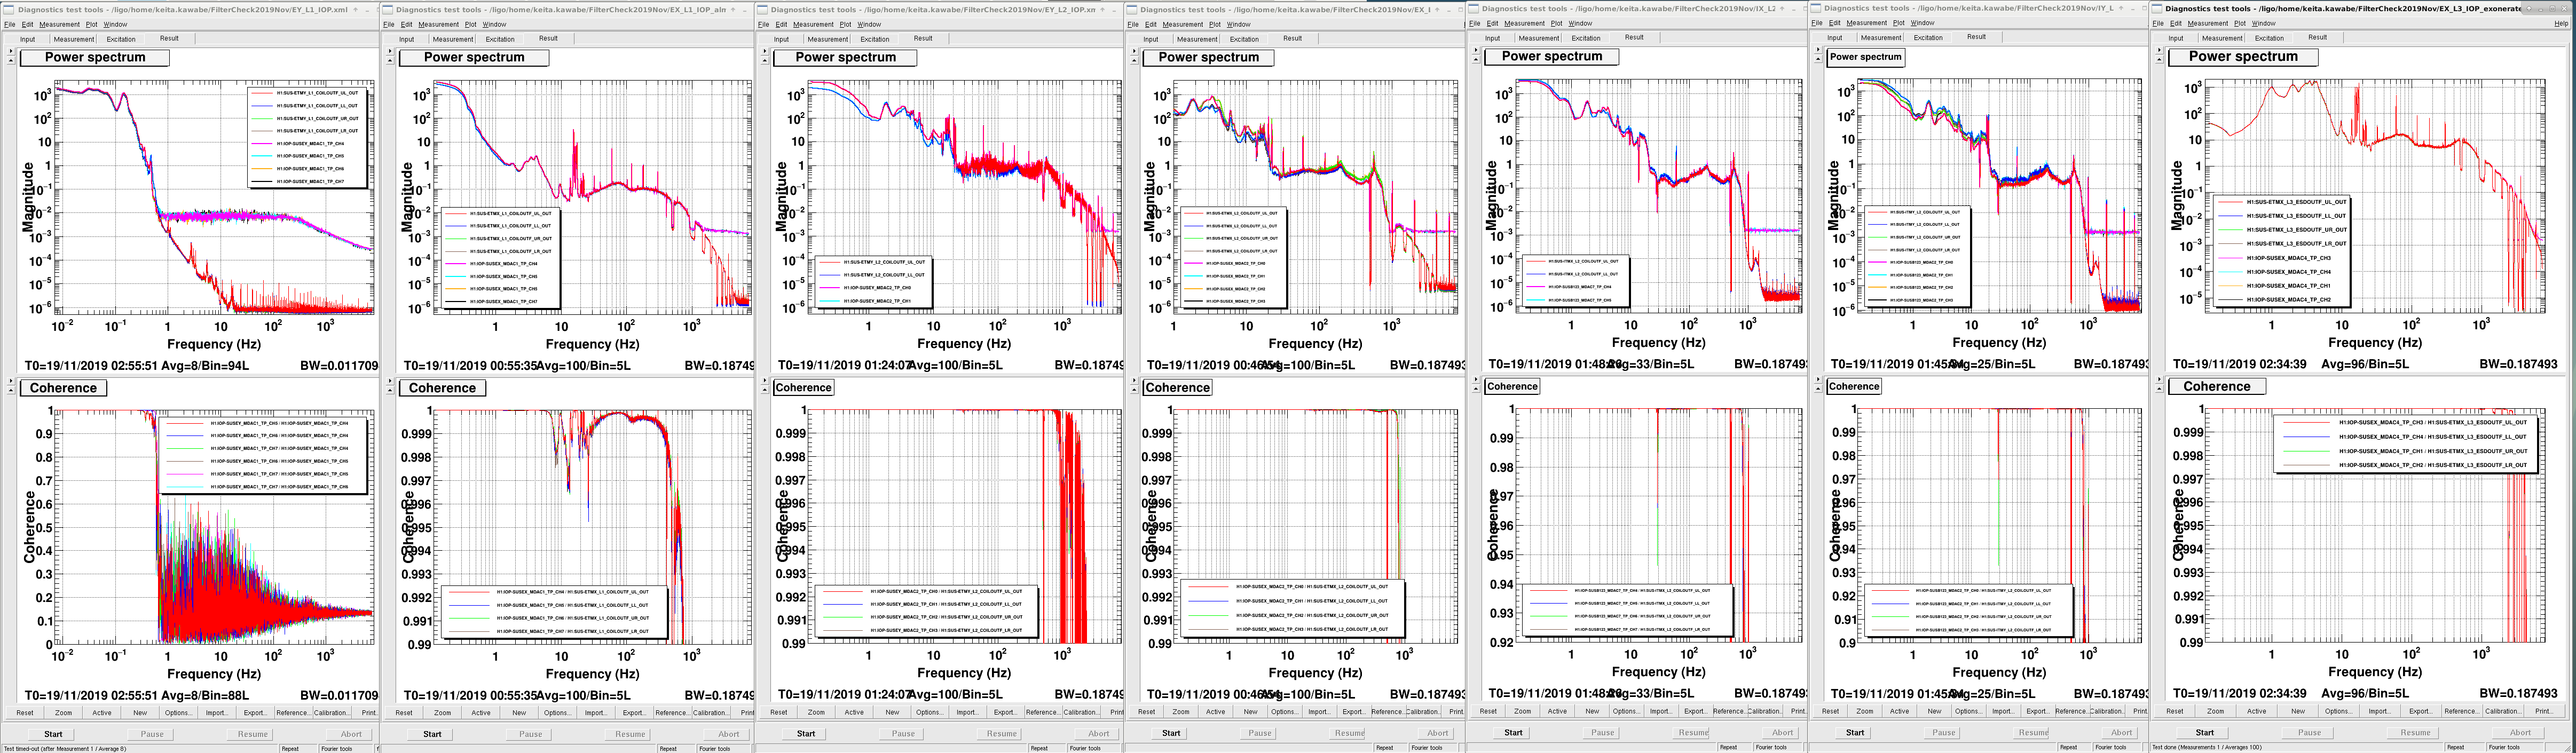
In the second attachment, other DACs in the QUADs look OK. Though we don't have a window to peek into the noise, the quantization noise at high frequency looks consistent with uniform distribution (1.6E-3) and the signal level of any of those channels seem to be large enough.
I'll check other suspensions.
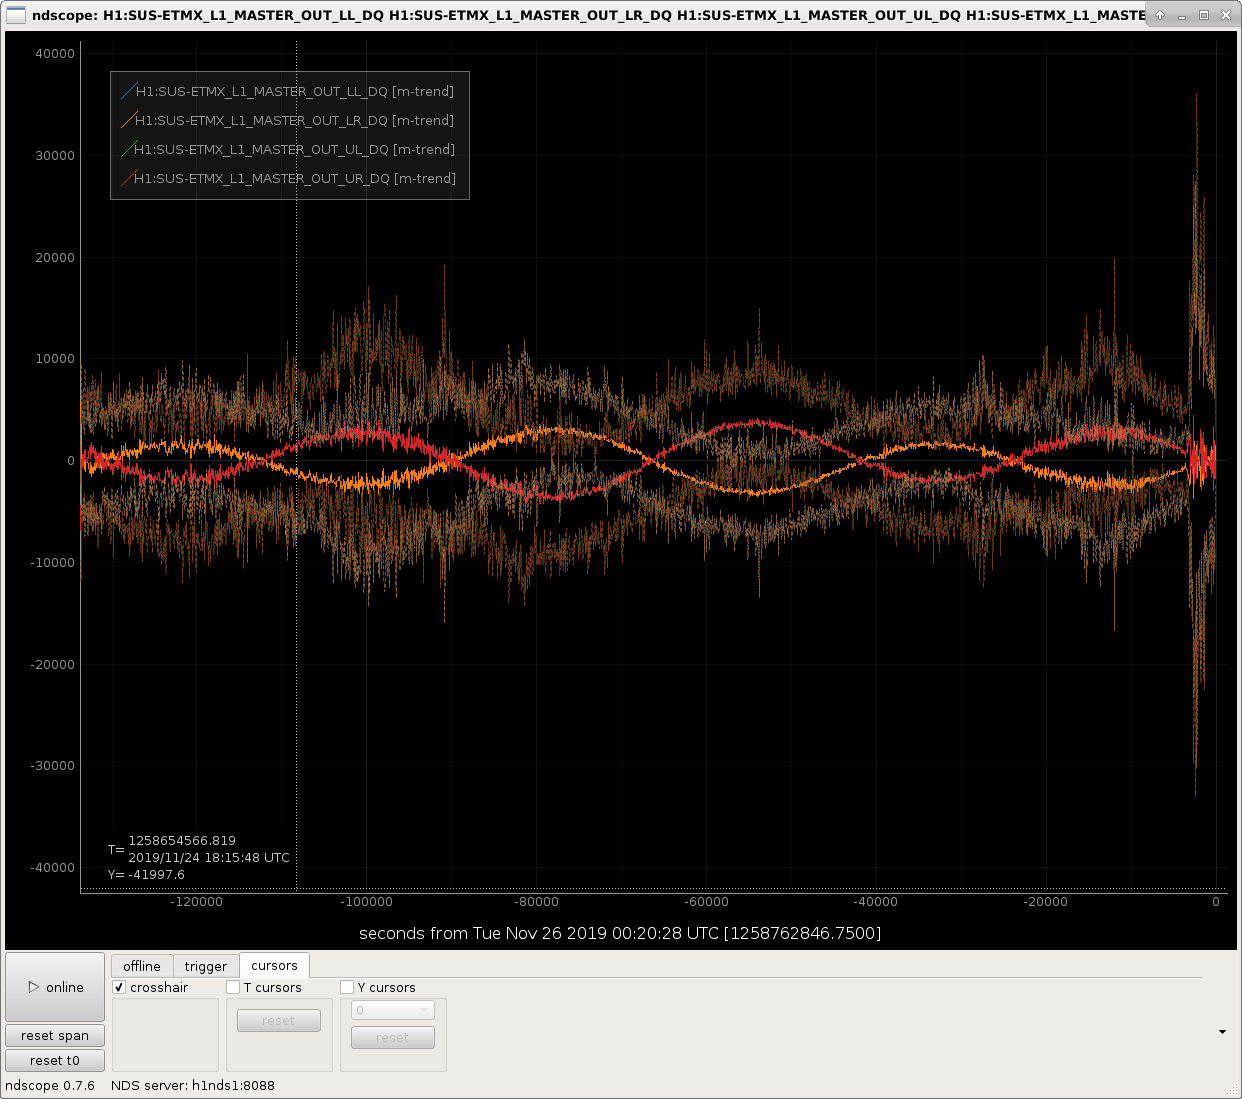
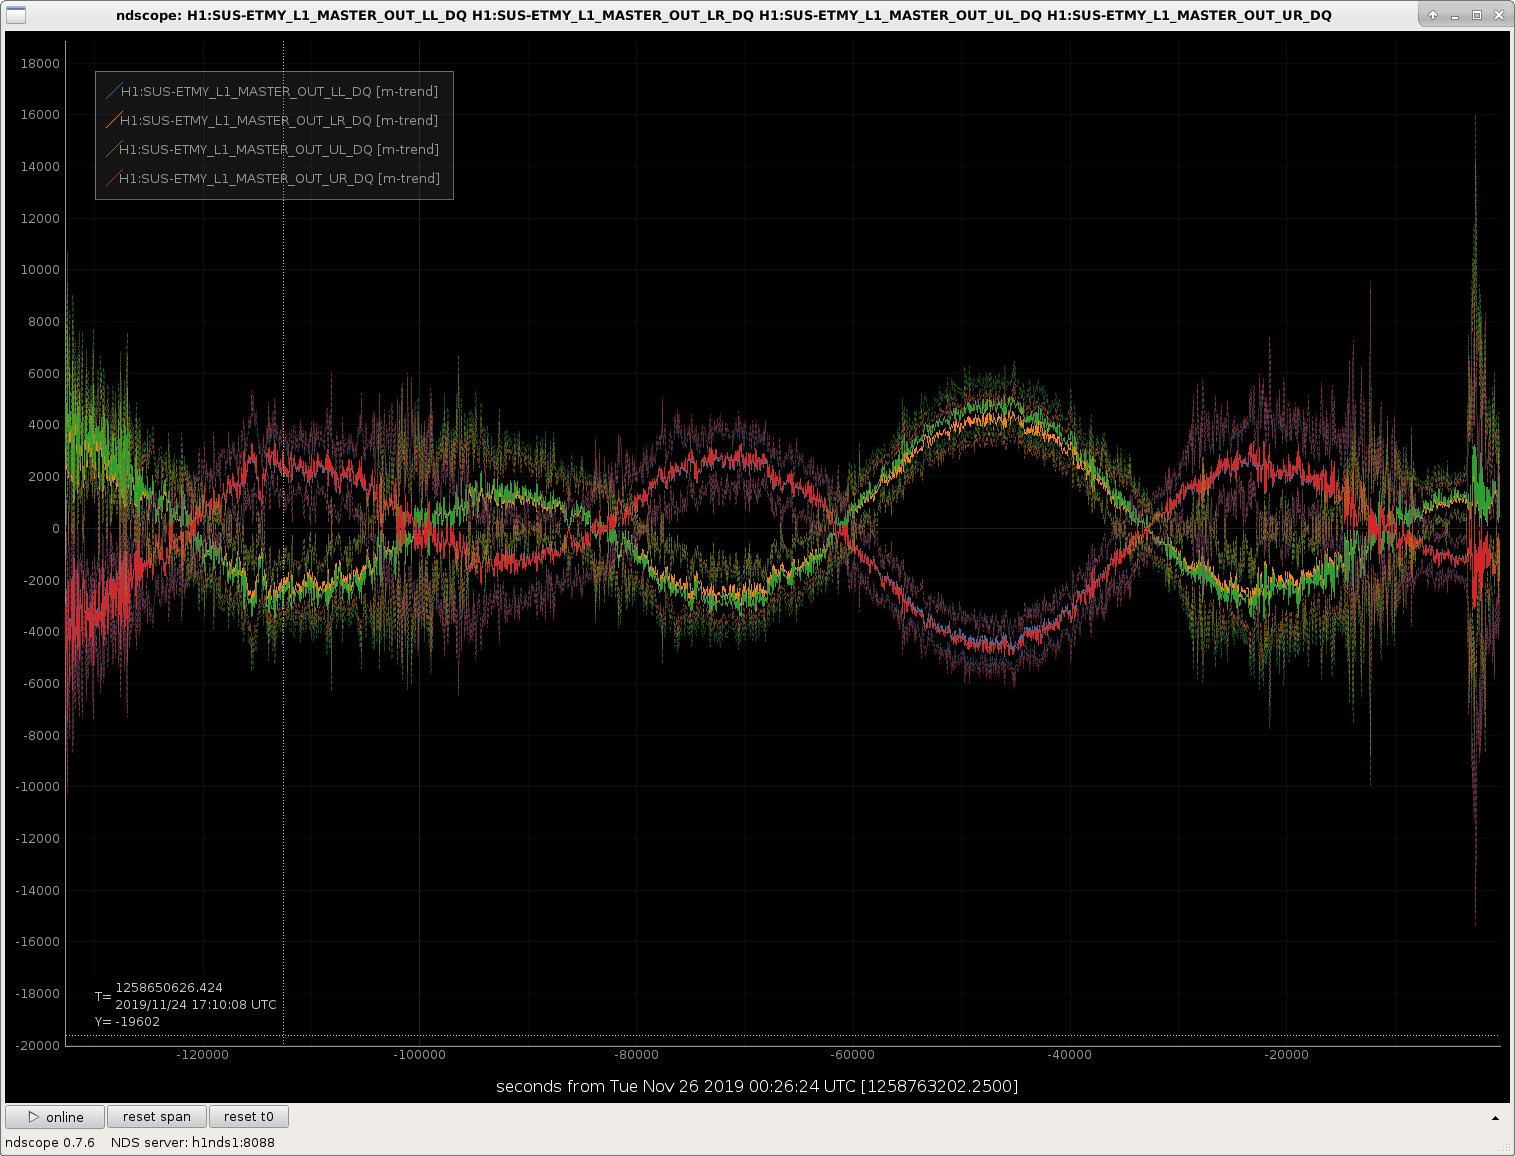
Performing a similar study as was done for the PUM (see LHO aLOG 53482), I've gathered DAC requested data from H1SUSETMX UIM (L1), UL coil and used that and a model of the coil driver filters to estimate the DAC requested if we applied one stage of analog low pass -- which would require a the addition of a amplifying filter with one zero at 1.0 Hz, and a pole at 10.5 Hz. Conclusion: we have plenty of head room. We will only marginally decrease the amount of safety factor to saturation. I attach three plots: (1) the same amplitude spectral density and RMS study as in LHO aLOG 53482. (2) A several-day trend of the requested drive to all coils for ETMX UIM, such that one can see the true impact of tidal control (3) A several-day trend of the requested drive to all coils for ETMY UIM. Note, that this data goes to much lower frequency than the PUM data (and was taken in the middle of a 40 mph wind storm), so it is nicely representative of a "bad environment" scenario. The size of the drive as a result of the wind-storm is clearly visible at the tail end of the trends. We don't have a ramping EUL2OSEM matrix on the UIM, so we can't engange State 2 (LP1 ON) in the LOWNOISE_COIL_DRIVERS state. Thus, we'll have to just request state 2 before lock acquisition tomorrow during maintenance, and accept in SDF, such that all subsequent observation ready segments will have state 2 engaged (until otherwise noted). Hopefully the lock acquisition sequence doesn't require several more orders of magnitude of > 0.5 Hz UIM actuation... A reminder of the options for the UIM coil driver, from LHO aLOG 4495 Driver Type Circuit Iso. Stages State Switch State Freq. Resp DC Transconductance ACQ | LP (z):(p) [Hz] [mA/V] UIM D070481-v4 QUADL1 1 n/a | OFF OFF OFF (50):(300) 0.15 2 n/a | ON OFF OFF (10.5 50):(1 300) | 3 n/a | ON ON OFF (10.5 10.5 50):(1 1 300) | 4 n/a | ON ON ON (10.5 10.5 10.5 50):(1 1 1 300) V The templates from which I exported the data into matlab live here: /ligo/svncommon/SusSVN/sus/trunk/QUAD/H1/ETMX/ SAGL1/Data/2019-11-25_H1SUSETMX_Actuator_DAC_L1_Output_LFZoom.xml # new data from 2 mHz to 10 Hz SAGL2/Data/2019-11-25_H1SUSETMX_Actuator_DAC_Output.xml # exported "high frequency" data that was taken any way for PUM study and the script to process the data lives here (where among other analysis, I merged the ASDs at 9 Hz, where they're clearly no different between pre-wind-storm "high frequency" data and during-wind-storm "low frequency" data): /ligo/svncommon/SusSVN/sus/trunk/QUAD/H1/ETMX/SAGL1/Scripts/ estimate_coildriverstate_impact_UIM_20191125.m
I checked the M0 F1, F2 and F3 coils for all QUADs and they were good.
I also checked BS, PRM, PR2, PR3, SRM, SR2 and SR3. For most of the channels the signal was much larger than the quantization noise. For PR2 and SR2 M3 stage the quantization noise is large but there's no more coherence between IOP channels and DARM nor PRCL/SRCL than between user channels and DARM.
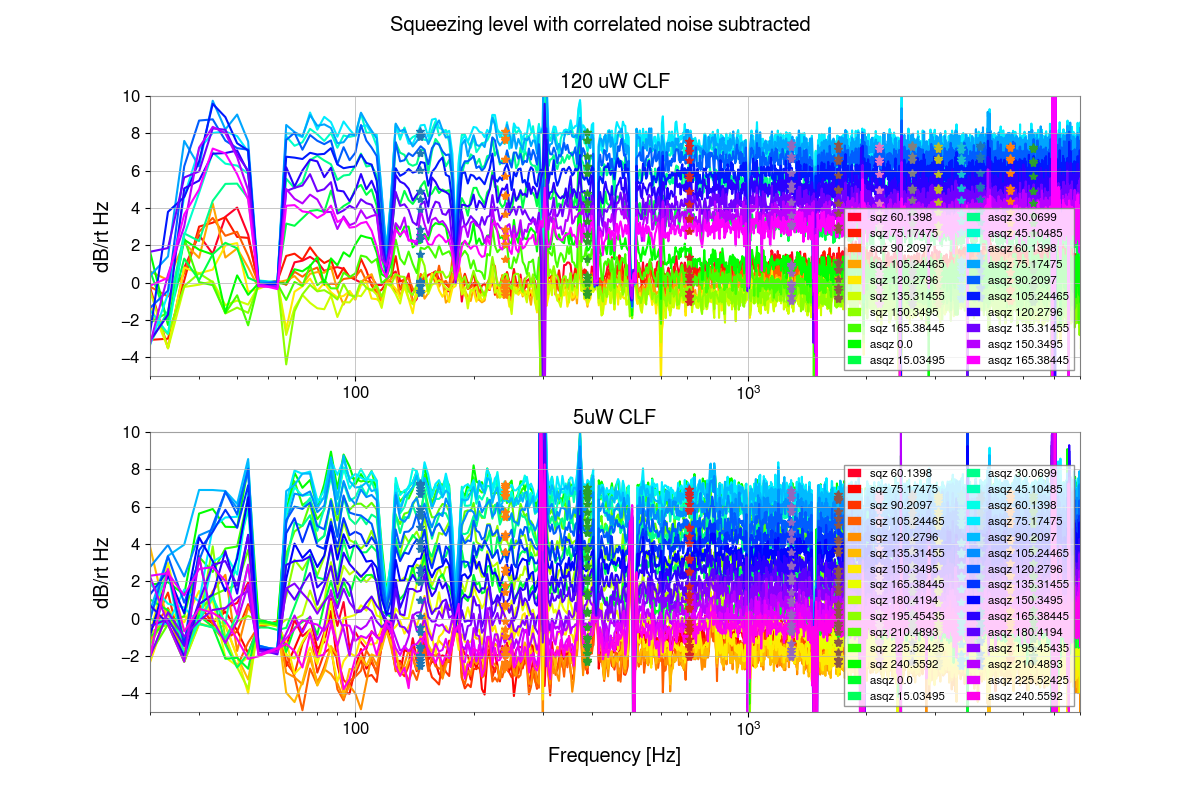
This is a delayed alog, with some preliminary results from two scans of the squeezing angle that we did with different CLF powers. The main message that we see more squeezing with less CLF power and more nonlinear gain, with around 3dB of squeezing at 200 Hz.
The first scan was on Nov 6th, with 120 uW of CLF power (in Reflection off the OPO). We ave been running O3b with 55uW of CLF power, since November 9th (53107), the nonlinear gain (amplifed seed over unamplified) was 4.9 on Nov 6th.
The second scan was on Nov 13th, and for the test we set the CLF power down to 5uW. The nonlinear gain was 4.5. Daniel and I adjusted the gains of the OPO, CLF, and LO loops once before starting the measurement:
The first attachment shows the squeezing level in dB, with the correlated noise subtracted. Here I've used the DCPD spectrum, taken the cross correlation at a time of no squeezing and subtracted that cross correlation from all the other measurements. In principle if we were limited by radiation pressure noise you would expect that to show up here the same way that a squeezing angle rotation does. However, I think that in reality we would need to take longer measurements and more averages to see the effect of QRPN. This plot is comparable to the ones in 51981 and 51546.
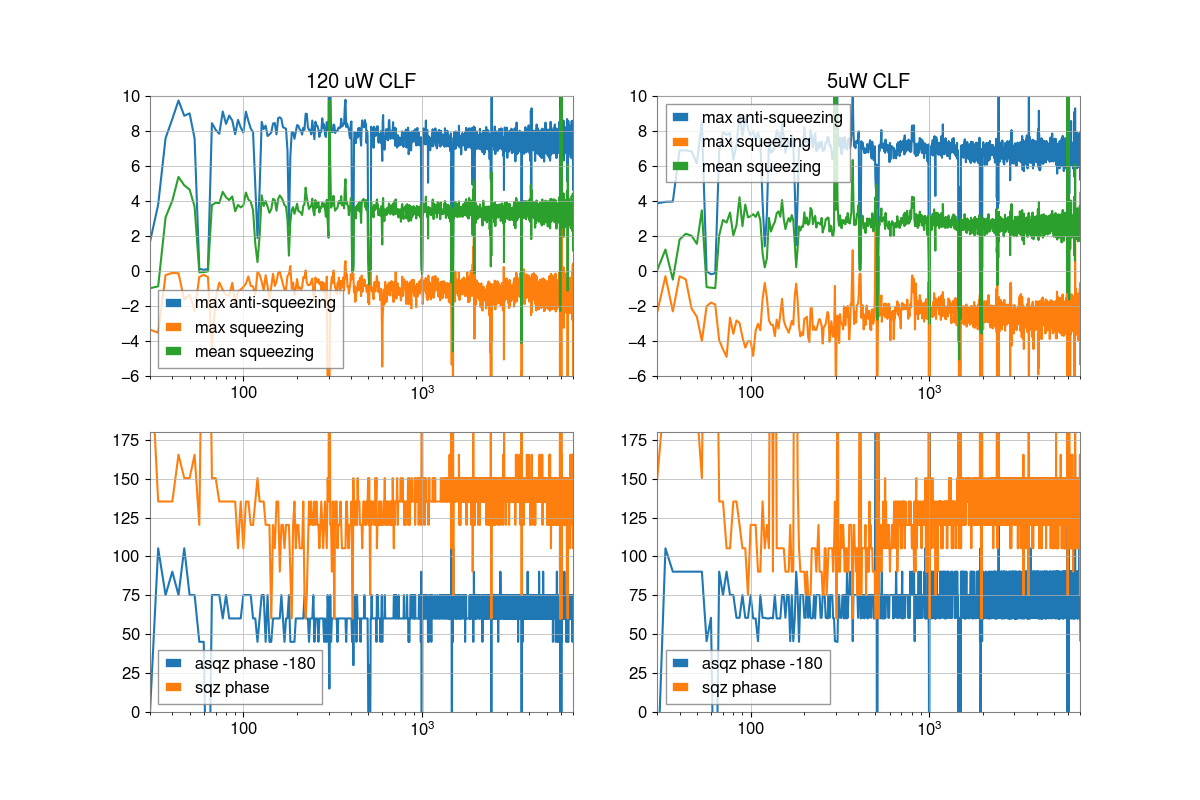
In those earlier measurements of scanning the squeezing angle I found median squeezing levels in a selection of hand picked frequency bands, and did fits to them. This can be done for this data as well, and I will try to get to that next week. As a faster way to get an understanding of what is happening, we can look at the max squeezing, anti-squeezing, mean squeezing and squeezing angle rotation for every frequency, shown in the second attachment. The angles plotted there are CLF demod angles at which we get the maximum anti-squeezing and squeezing at each frequency, I've subtracted 180 from the anti-squeezing angles just to make it easier to see what is going on. We moved the phase by 15 degrees at a time, which is why they are discrete, the angle could be found more precisely by fitting.
If we use the standard equations for squeezing and anti-squeezing from aoki (or other sources), the mean squeezing level is given by: (R_s+R_a)/2 = 1+2*x*eta(1/(1-x)^2-1/(1+x)^2) if R_s and R_a are variances normalized to unsqueezed shot noise. If we use this to try to infer the efficiency based on the mean squeezing in the second attachment, the higher measured anti-squeezing in the high CLF case would indicate lower losses, in that case, which doesn't seem believable. In both cases the non-squeezing reference was recorded before the scan of the squeezing angle, and not repeated after, however in both cases these measurements were made many hours into a lock stretch when we would expect the shot noise level to be pretty stable.
[R.Schofield, J.Drigger, S.Dwier, T.Mistry]
During the commisioning time on Friday 22nd November, we powered the encoder system On and Off in intervals ~20 minutes to see whether the gliches as reported in LHO alog 53396. During these measurements, the BRS sensor correction eeas turned off. As a result, the ongoing windfence installation was causing large scattering arches (glitches) in DARM. Therefore, I belive that todays tests maybe rather inconclusive since it will be difficult to tell if the glitches seen in DARM were the results of the NCAL encoder system or the wind fence crew. The time log below gives the state of the encoder system as it was being switched On/Off.
0944 PDT -- Encoder on
1004 PDT -- Encoder off
1027 PDT -- Encoder on
1100 PDT -- Encoder off
1120 PDT -- Exit EX
I will be collecting the results in G1902232
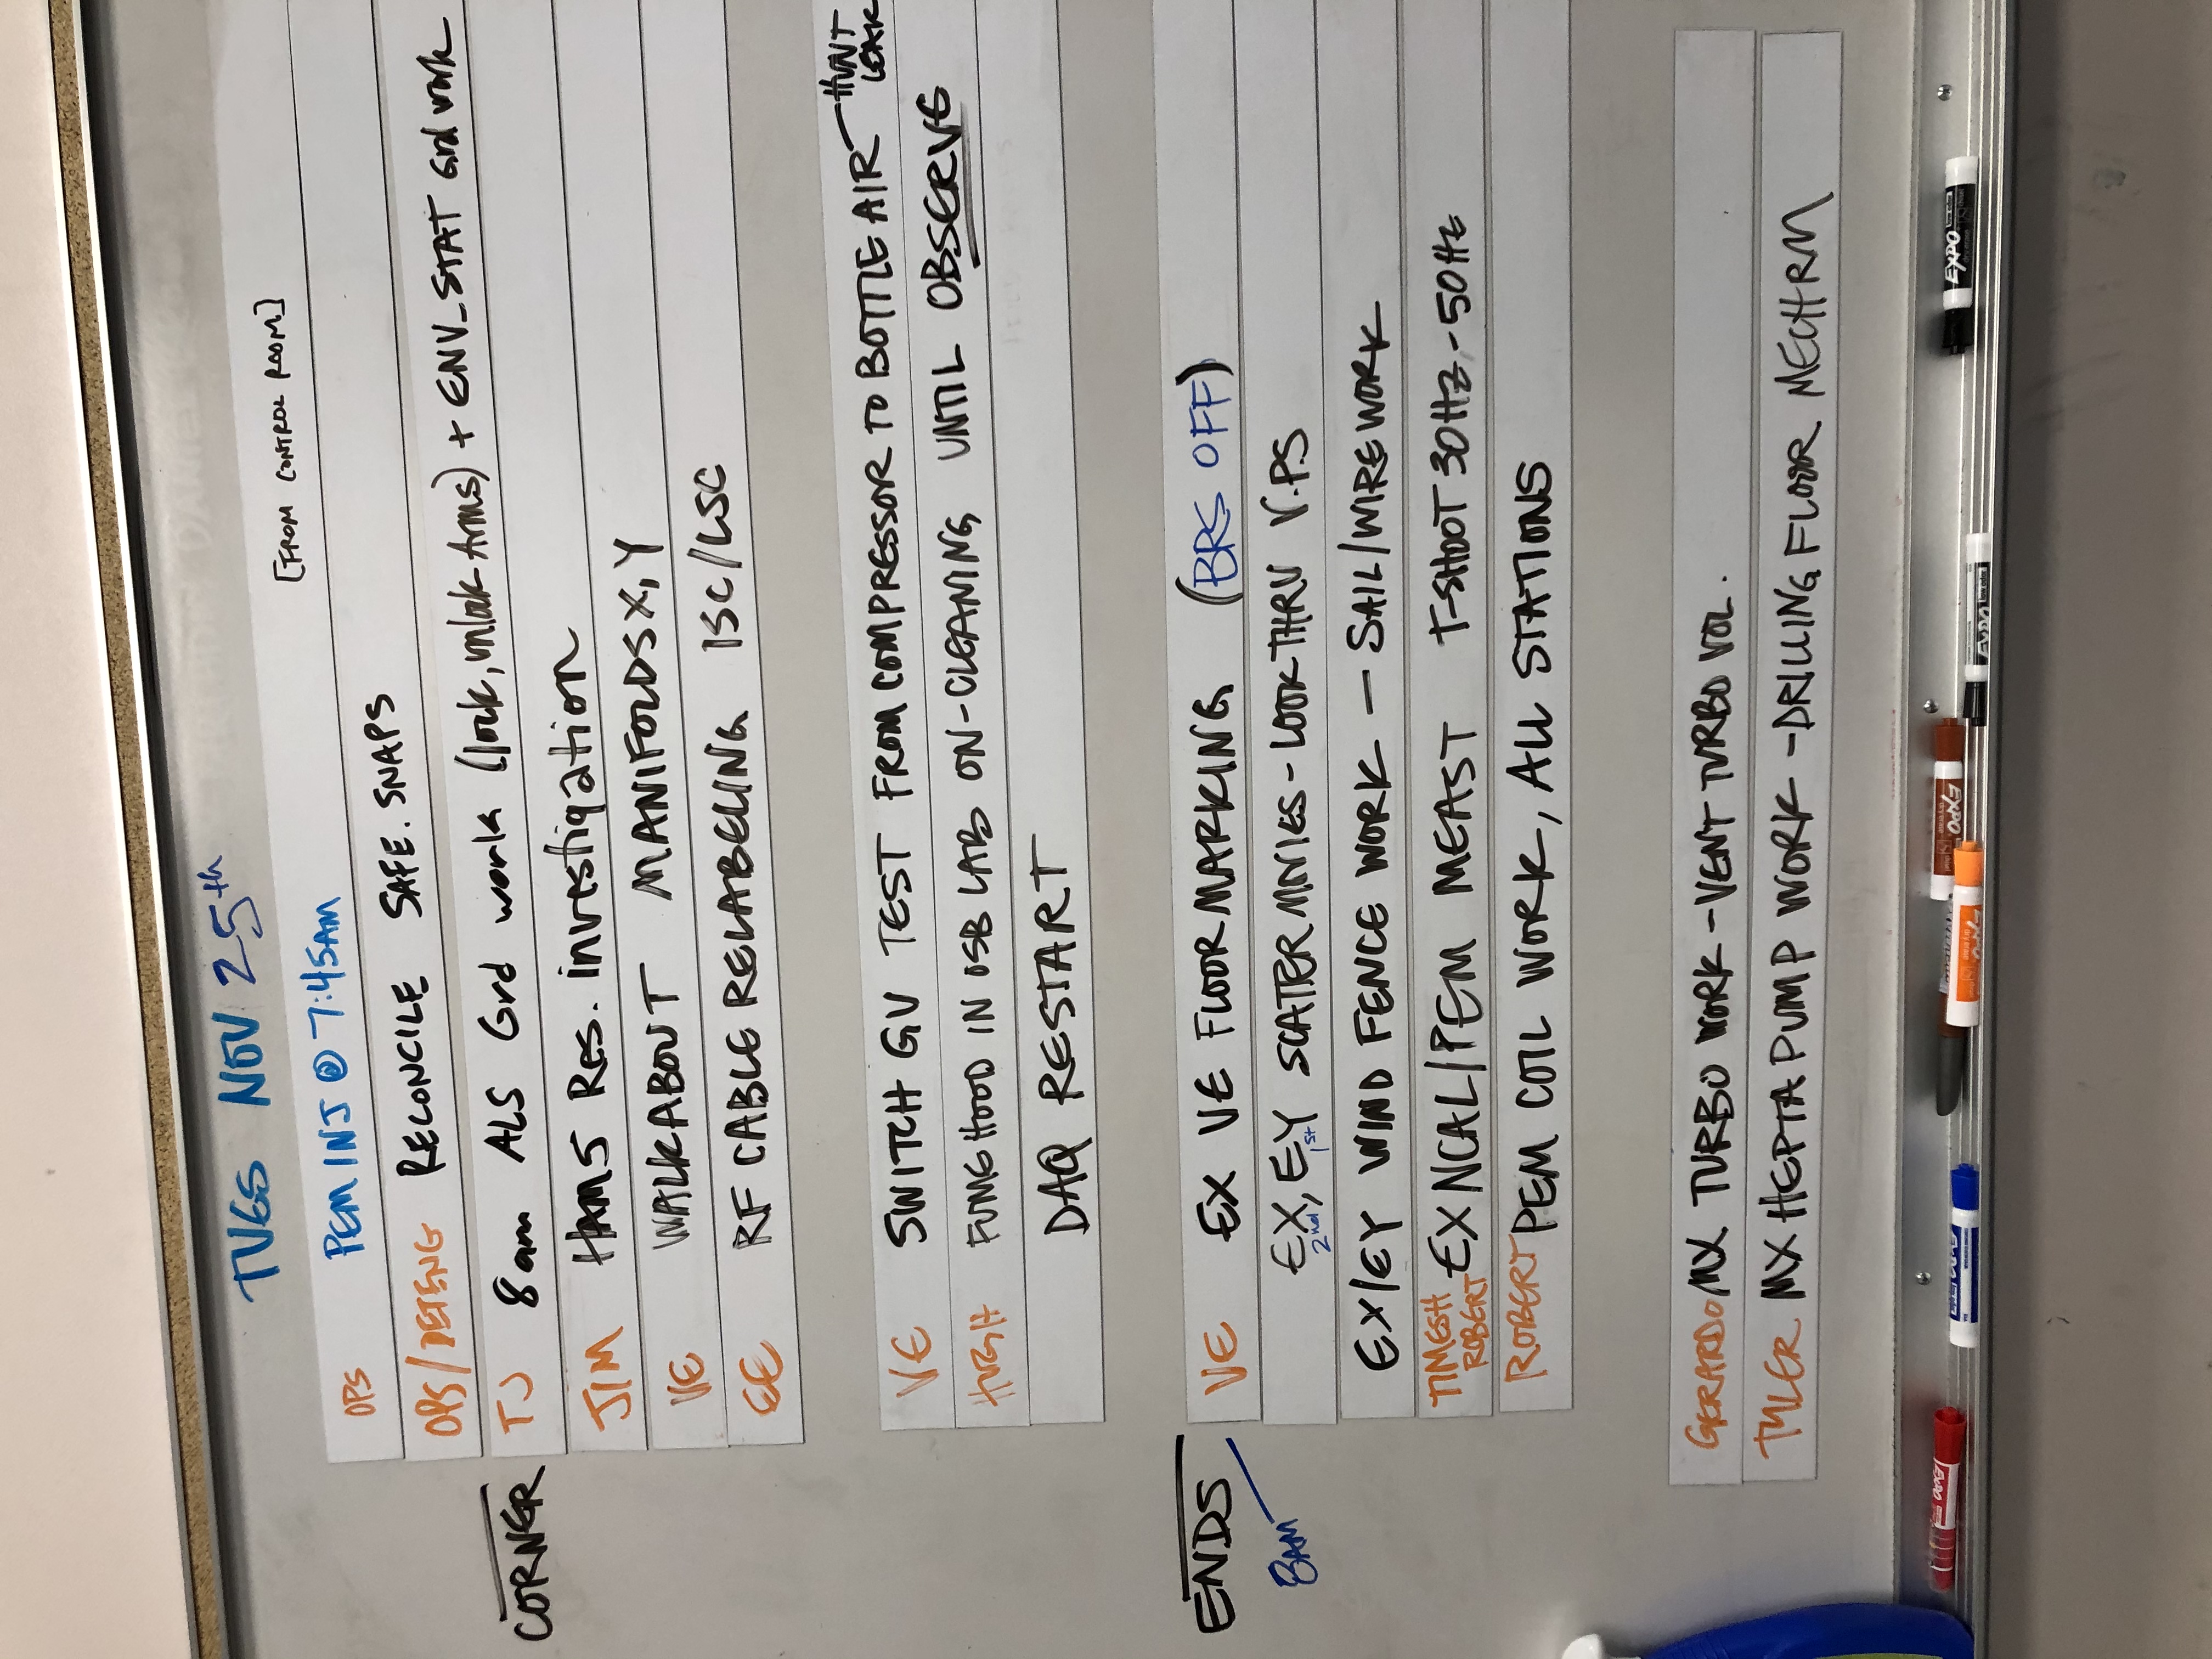
Here?s a pic of the whiteboard as a result of Monday morning?s coordination meeting.
Thank you Jeff! TJ will be taking the IFO out of lock at the start of maintenance for his ALS work. Some of the gate valves will be put on gas bottles. Robert will need both end stations at laser hazard.
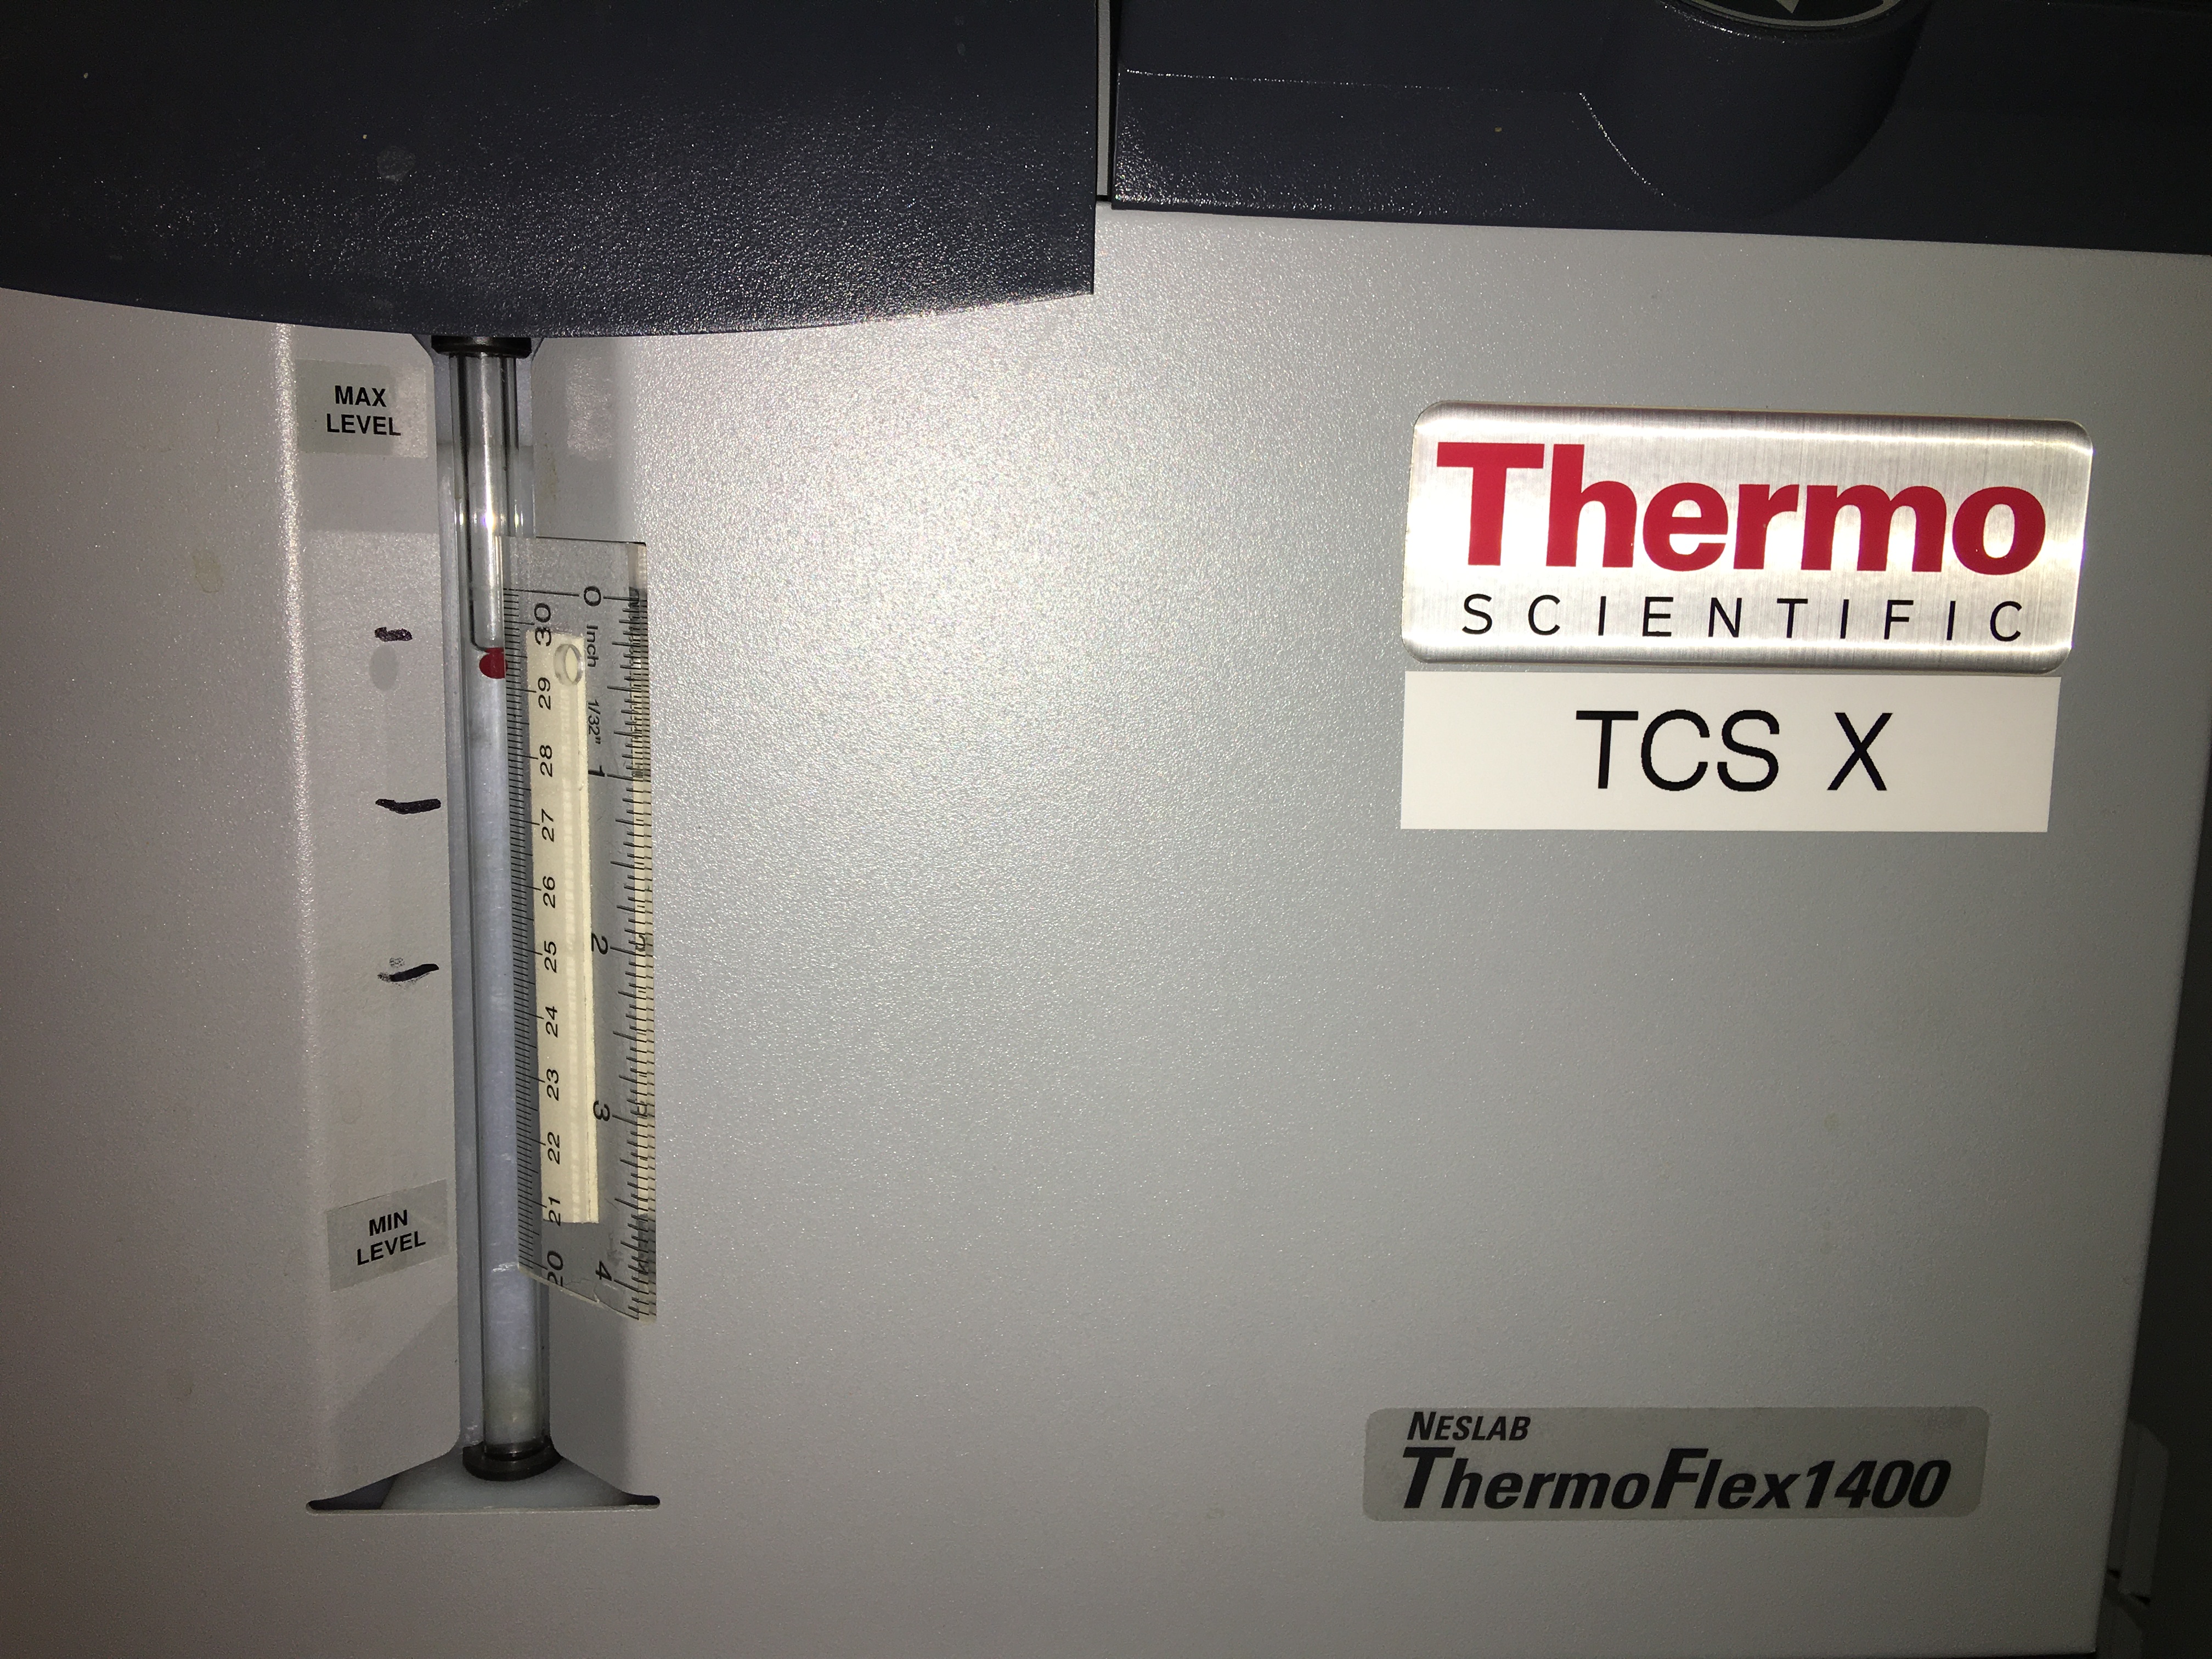
TCSX chiller water-level was sitting around the 29.5 mark. (see figure) I added 100ml which brought the level up to 30+ a little.
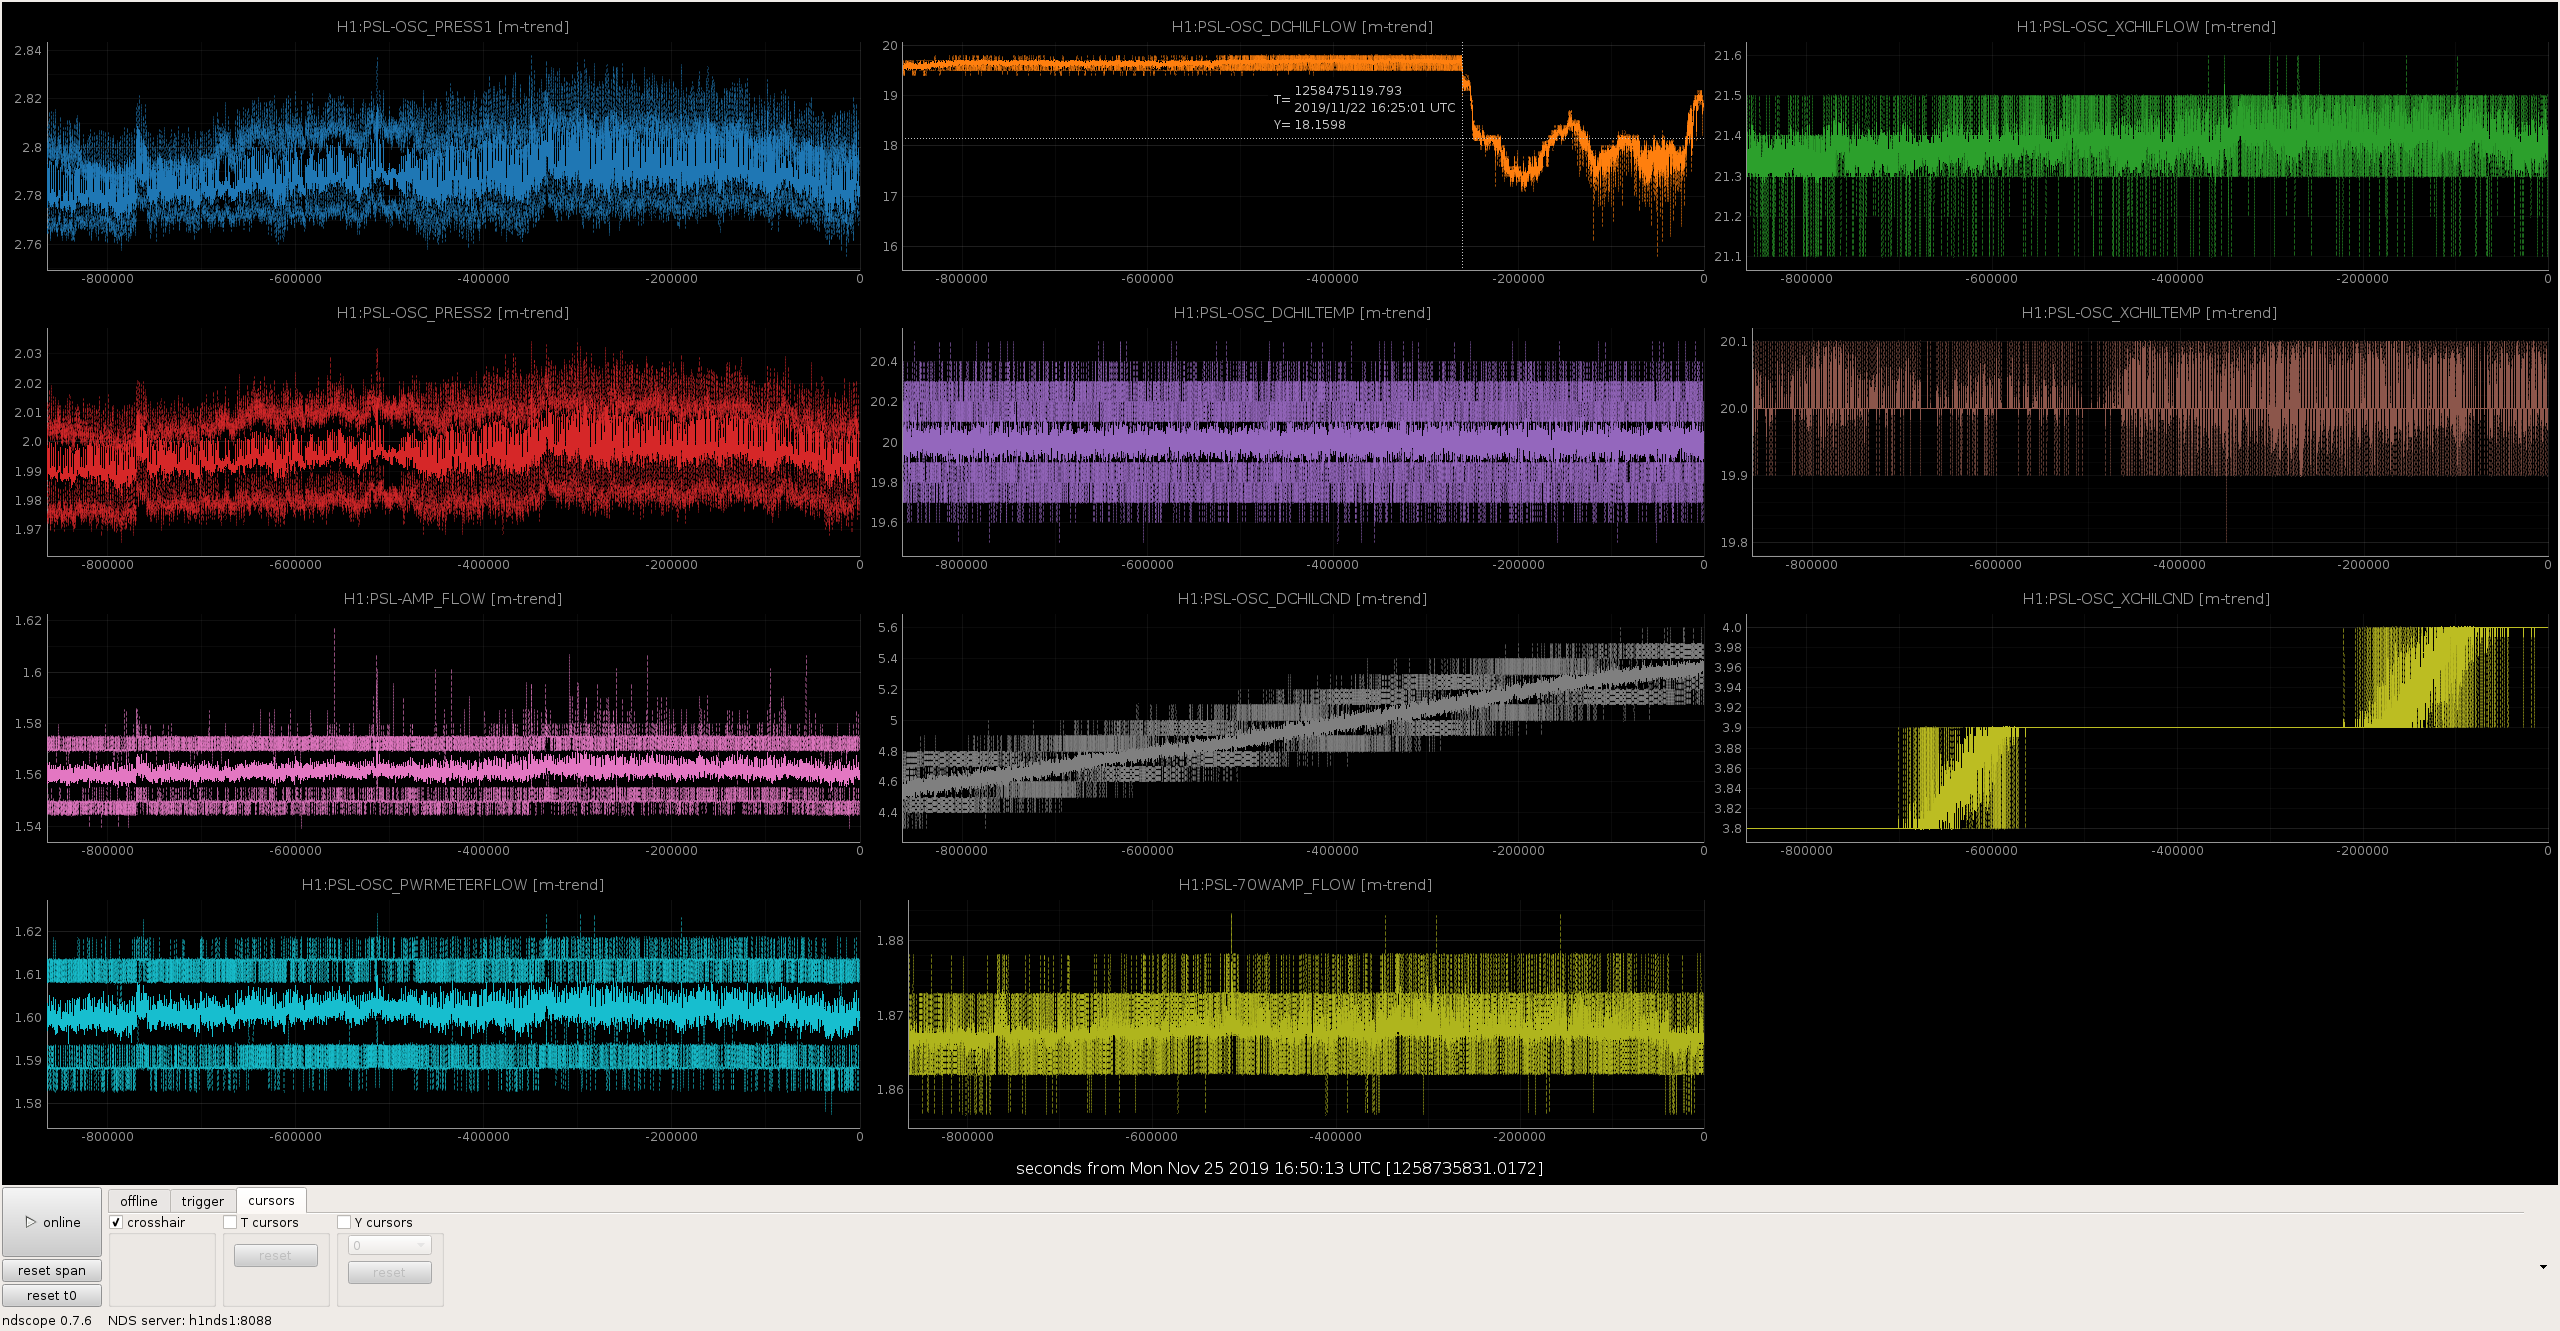
Took a quick look at the Diode chiller. At approximately 16:22 UTC (8:22 PST) last Friday, November 22nd, the flow reported by the Diode Chiller dropped slightly (~19.7 lpm down to ~19.2 lpm) and then begain behving somewhat erratically (dropped as low as ~17.2 lpm, reported flow stayed between 17.2 lpm and 18.4 lpm); this behavior continued over the weekend and into this morning, with the reported flow returning to ~19.1 lpm at ~17:00 UTC (9:00 PST). The other diode chiller signals included in Ed's plot show no other reason to think something is going wrong with the chiller (conductivity behaving as normal, water temp is steady). I checked on the chiller itself and it was operating normally, no odd or out-of-place noises or vibrations. This is still plenty of flow to cool the diode boxes, so laser performance was not affected (as can be seen in the attachment, diode box heat sink temp (what the diode chiller actually cools, the pump diodes are cooled by TECs attached to this heat sink) doesn't change in response to this reported flow change).
Therefore, at this point I have no reason to suspect a problem with the Diode Chiller. This could be a one-off event, or an early sign of flow meter failure (each chiller has an internal flow meter for monitoring flow). Recall that this chiller was borrowed from 3IFO (since replaced with a repaired and working unit to prevent interruption of PSL operation during pre-O3 commissioning) during an emergency in February 2019 where both our in-service and backup chillers experienced failures (many alogs, but the most relelvent is here). As noted in the linked alog, this chiller is still running the old style impeller-based internal flow meters, which have a shorter lifespan than the newer vortex flow meters we installed in the PSL chillers (sans 3IFO) in 2015. Therefore I'll keep an eye on this for signs of a failing flow meter.
FAMIS 12875 None appear strongly elevated.
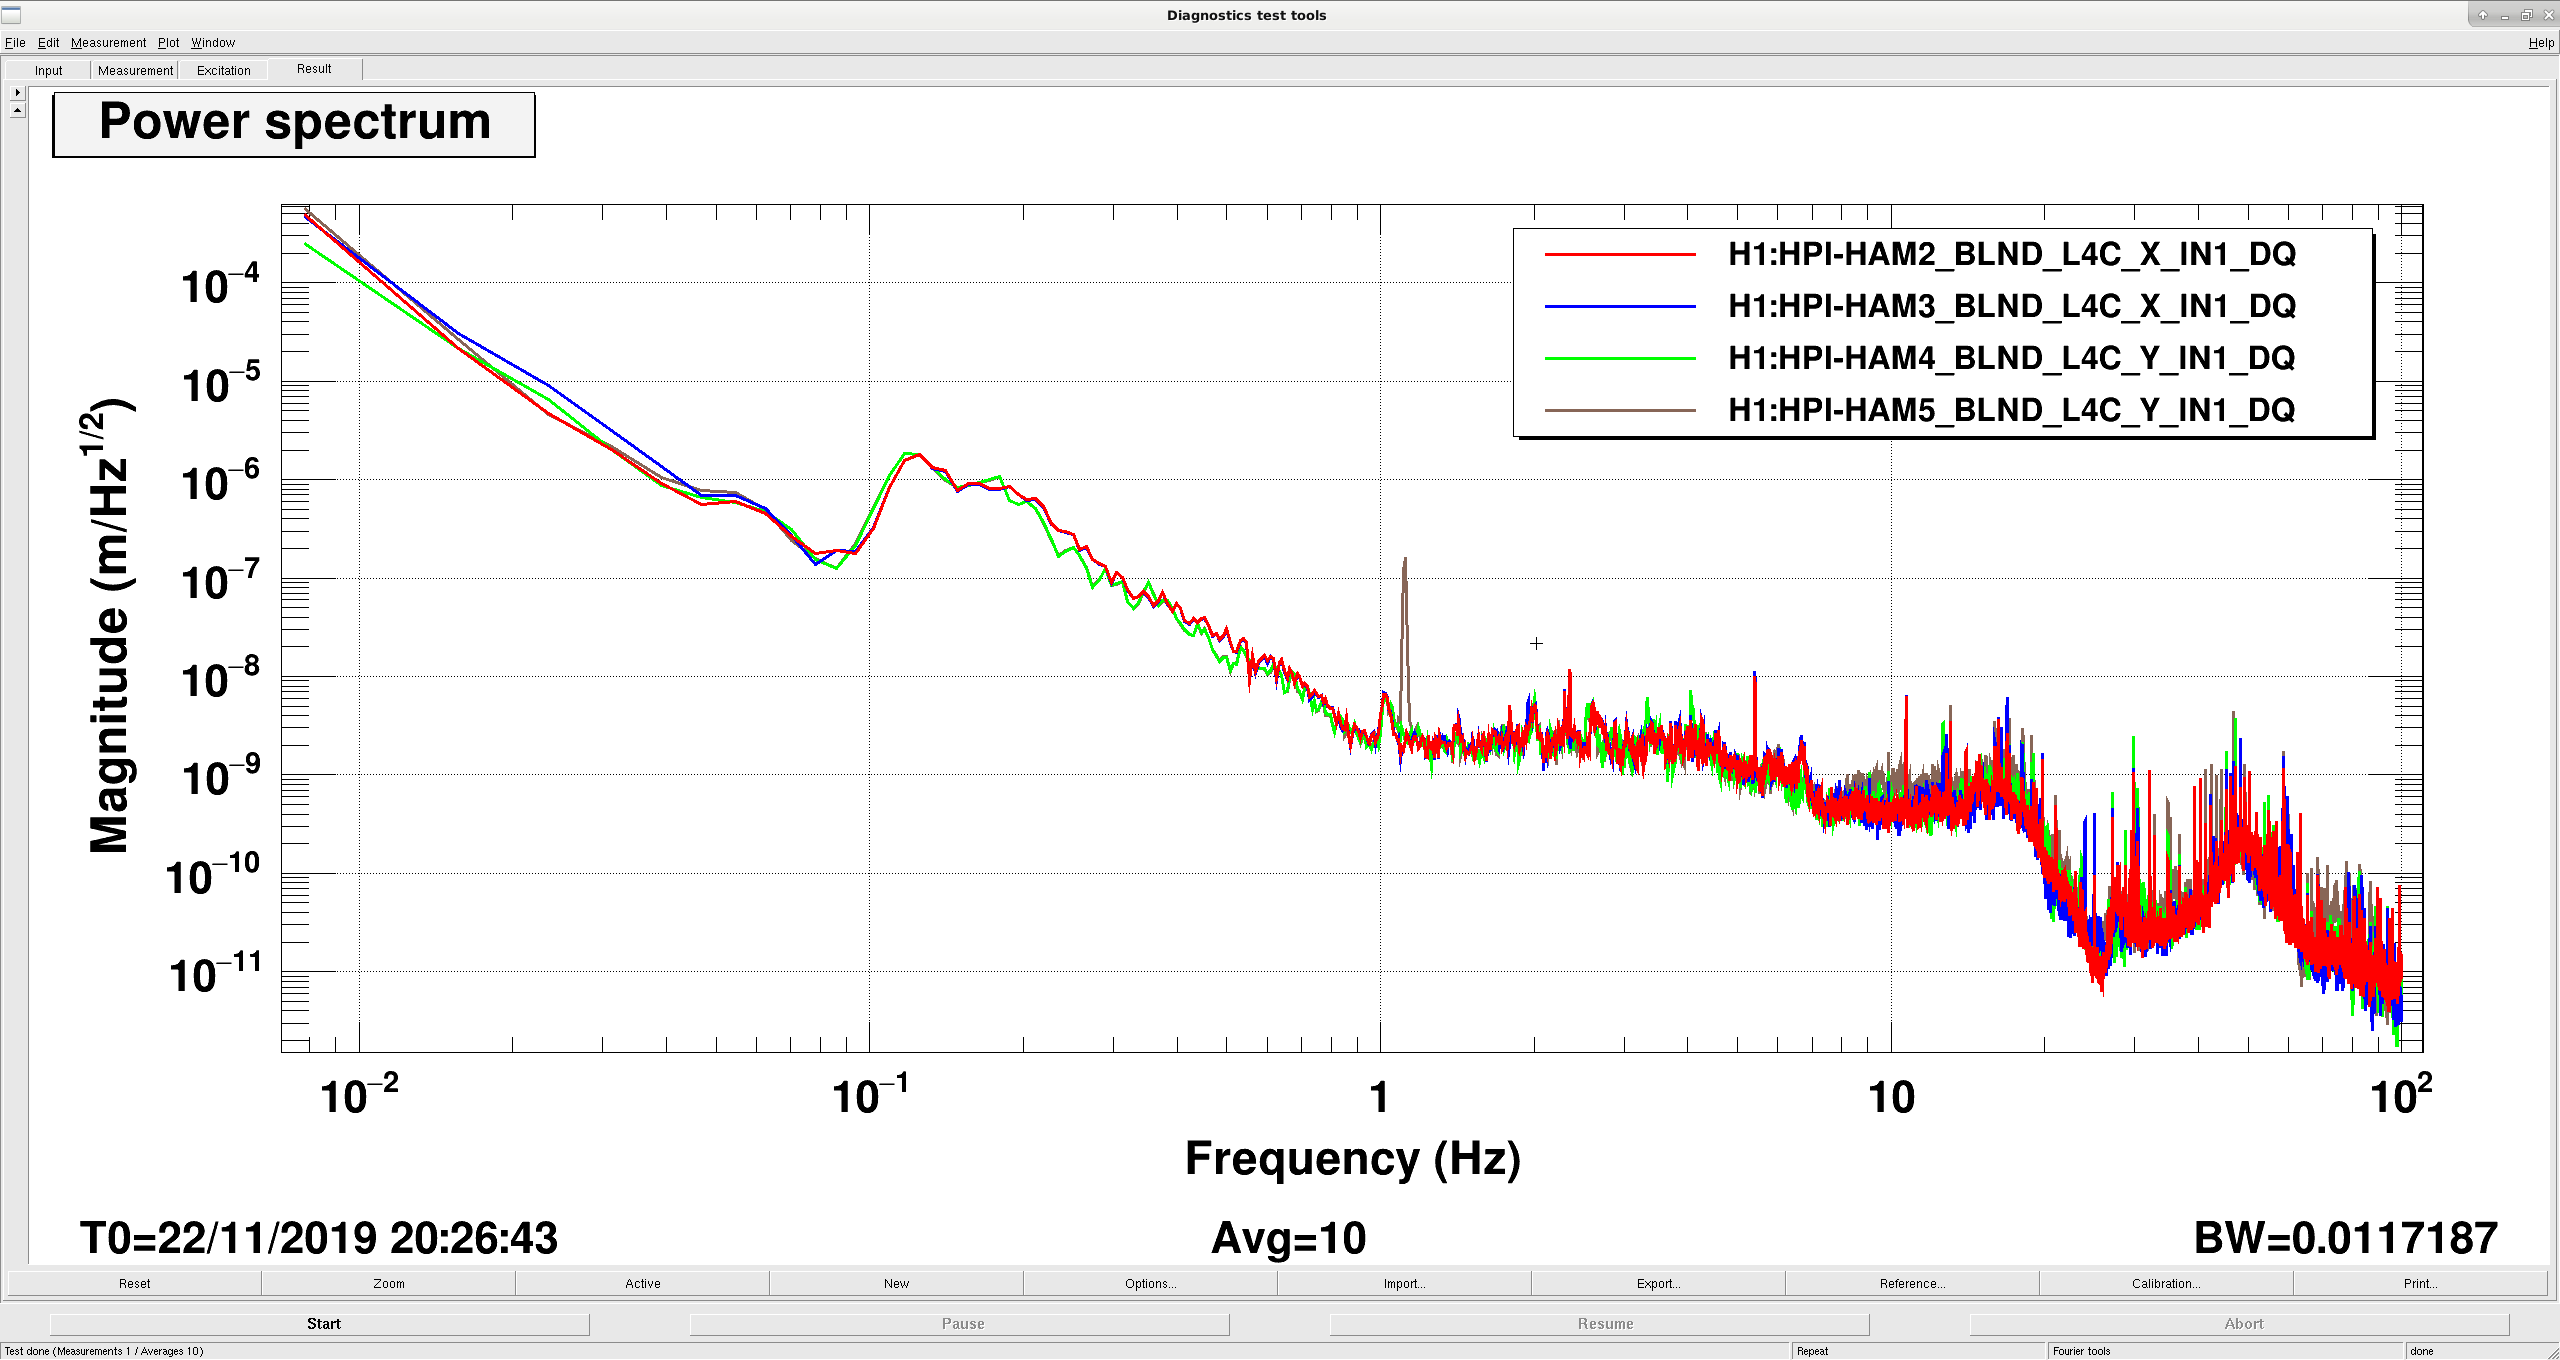
I noticed recently that there is a 1ish-hz peak on the HAM5. Digging through the summary pages it looks like it may have appeared around the 17th of Oct. It's not visible on the asds on the summary pages that day, but if you look at the spectrogram, it shows up about 16:00 UTC. It's clearly there on the asds for the next day.
Digging a bit deeper, it's on the HEPI and ST0 L4Cs as well, first attached plot. Worrying this might be like the HAM3 peak, I check the HAM2,3,4 & 5 HEPI L4Cs, and HAM3 HEPI doesn't show the ISIs 1 hz peak (second plot) , so I think it's a problem with the HEPI on HAM5, not the ISI. The HAM5 peak doesn't seem stationary, when I looked at midnight last night the peak was small on the HEPI L4Cs, it was bigger a few hours ago, when Jenne and Chiara were trying PRCL to ISI offload, and now it's smaller again.
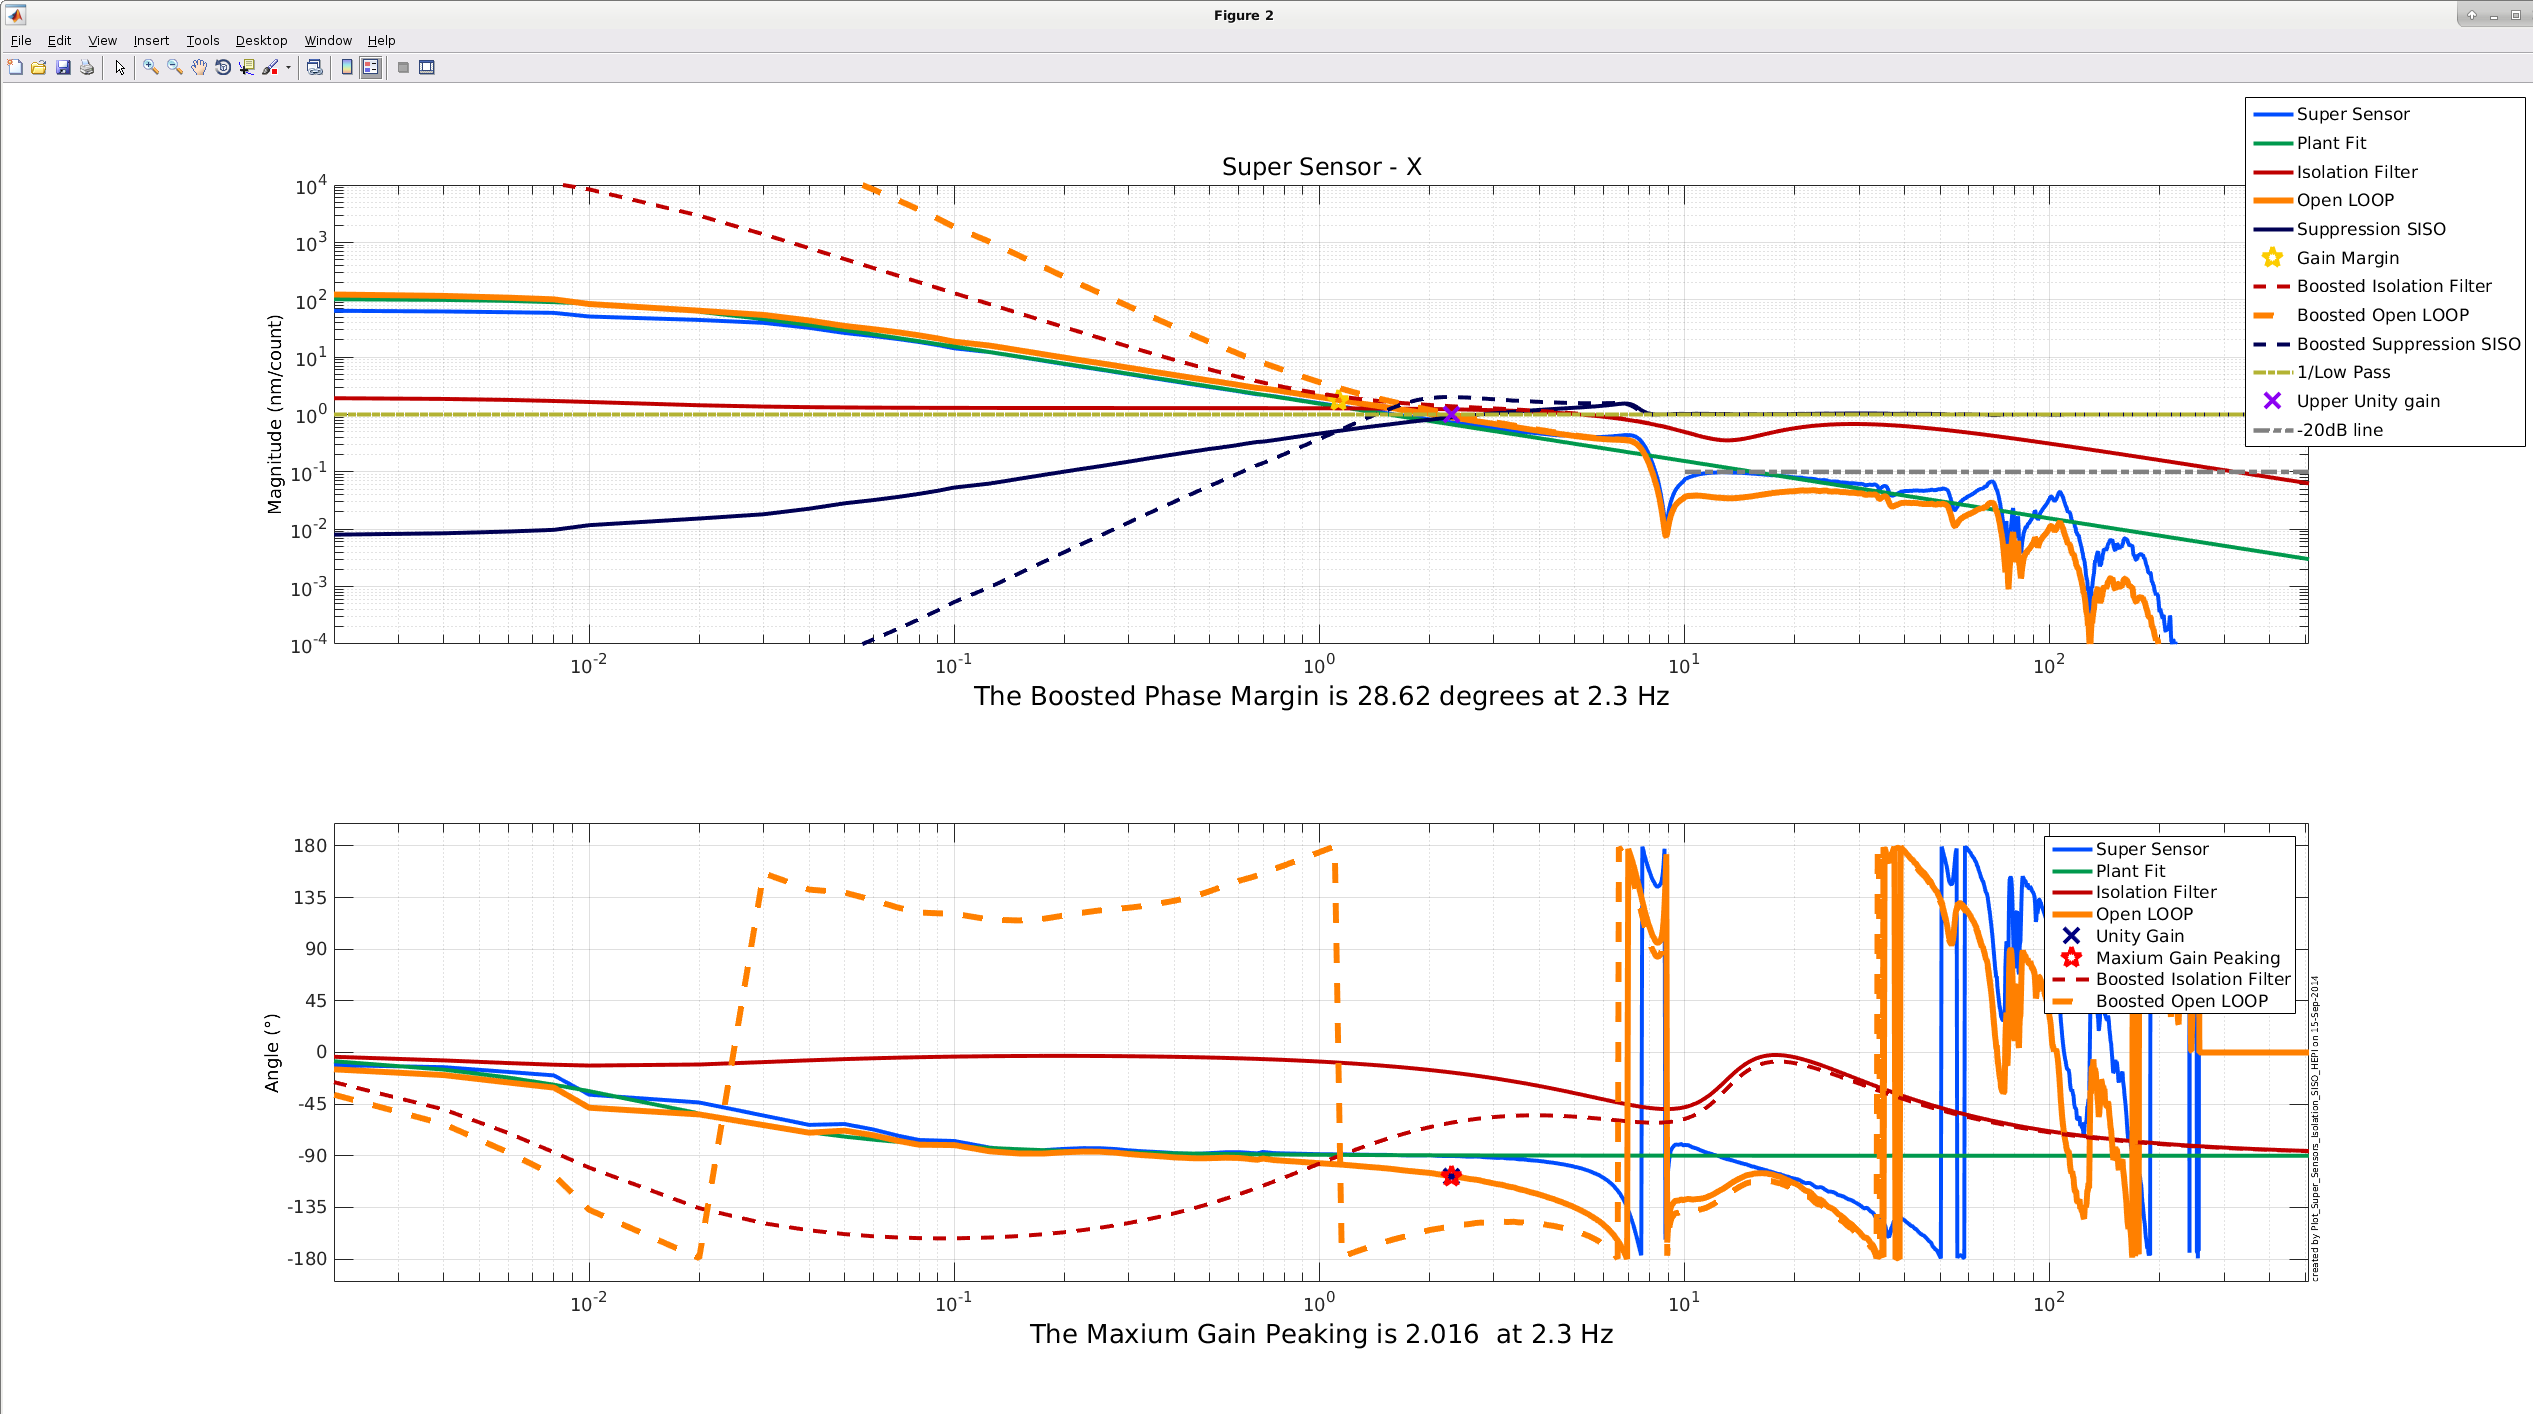
I worry that something has changed the HEPI plant some. The 3rd attached plot shows the design plot for the X loop, the orange is the calculated open loop gain, and there is a 180 degree phase crossing at about 1hz, where the HEPI has gain of about 3. If something has reduced the gain of the plant, that could make this loop close to unstable. Most of the other loops are like this.
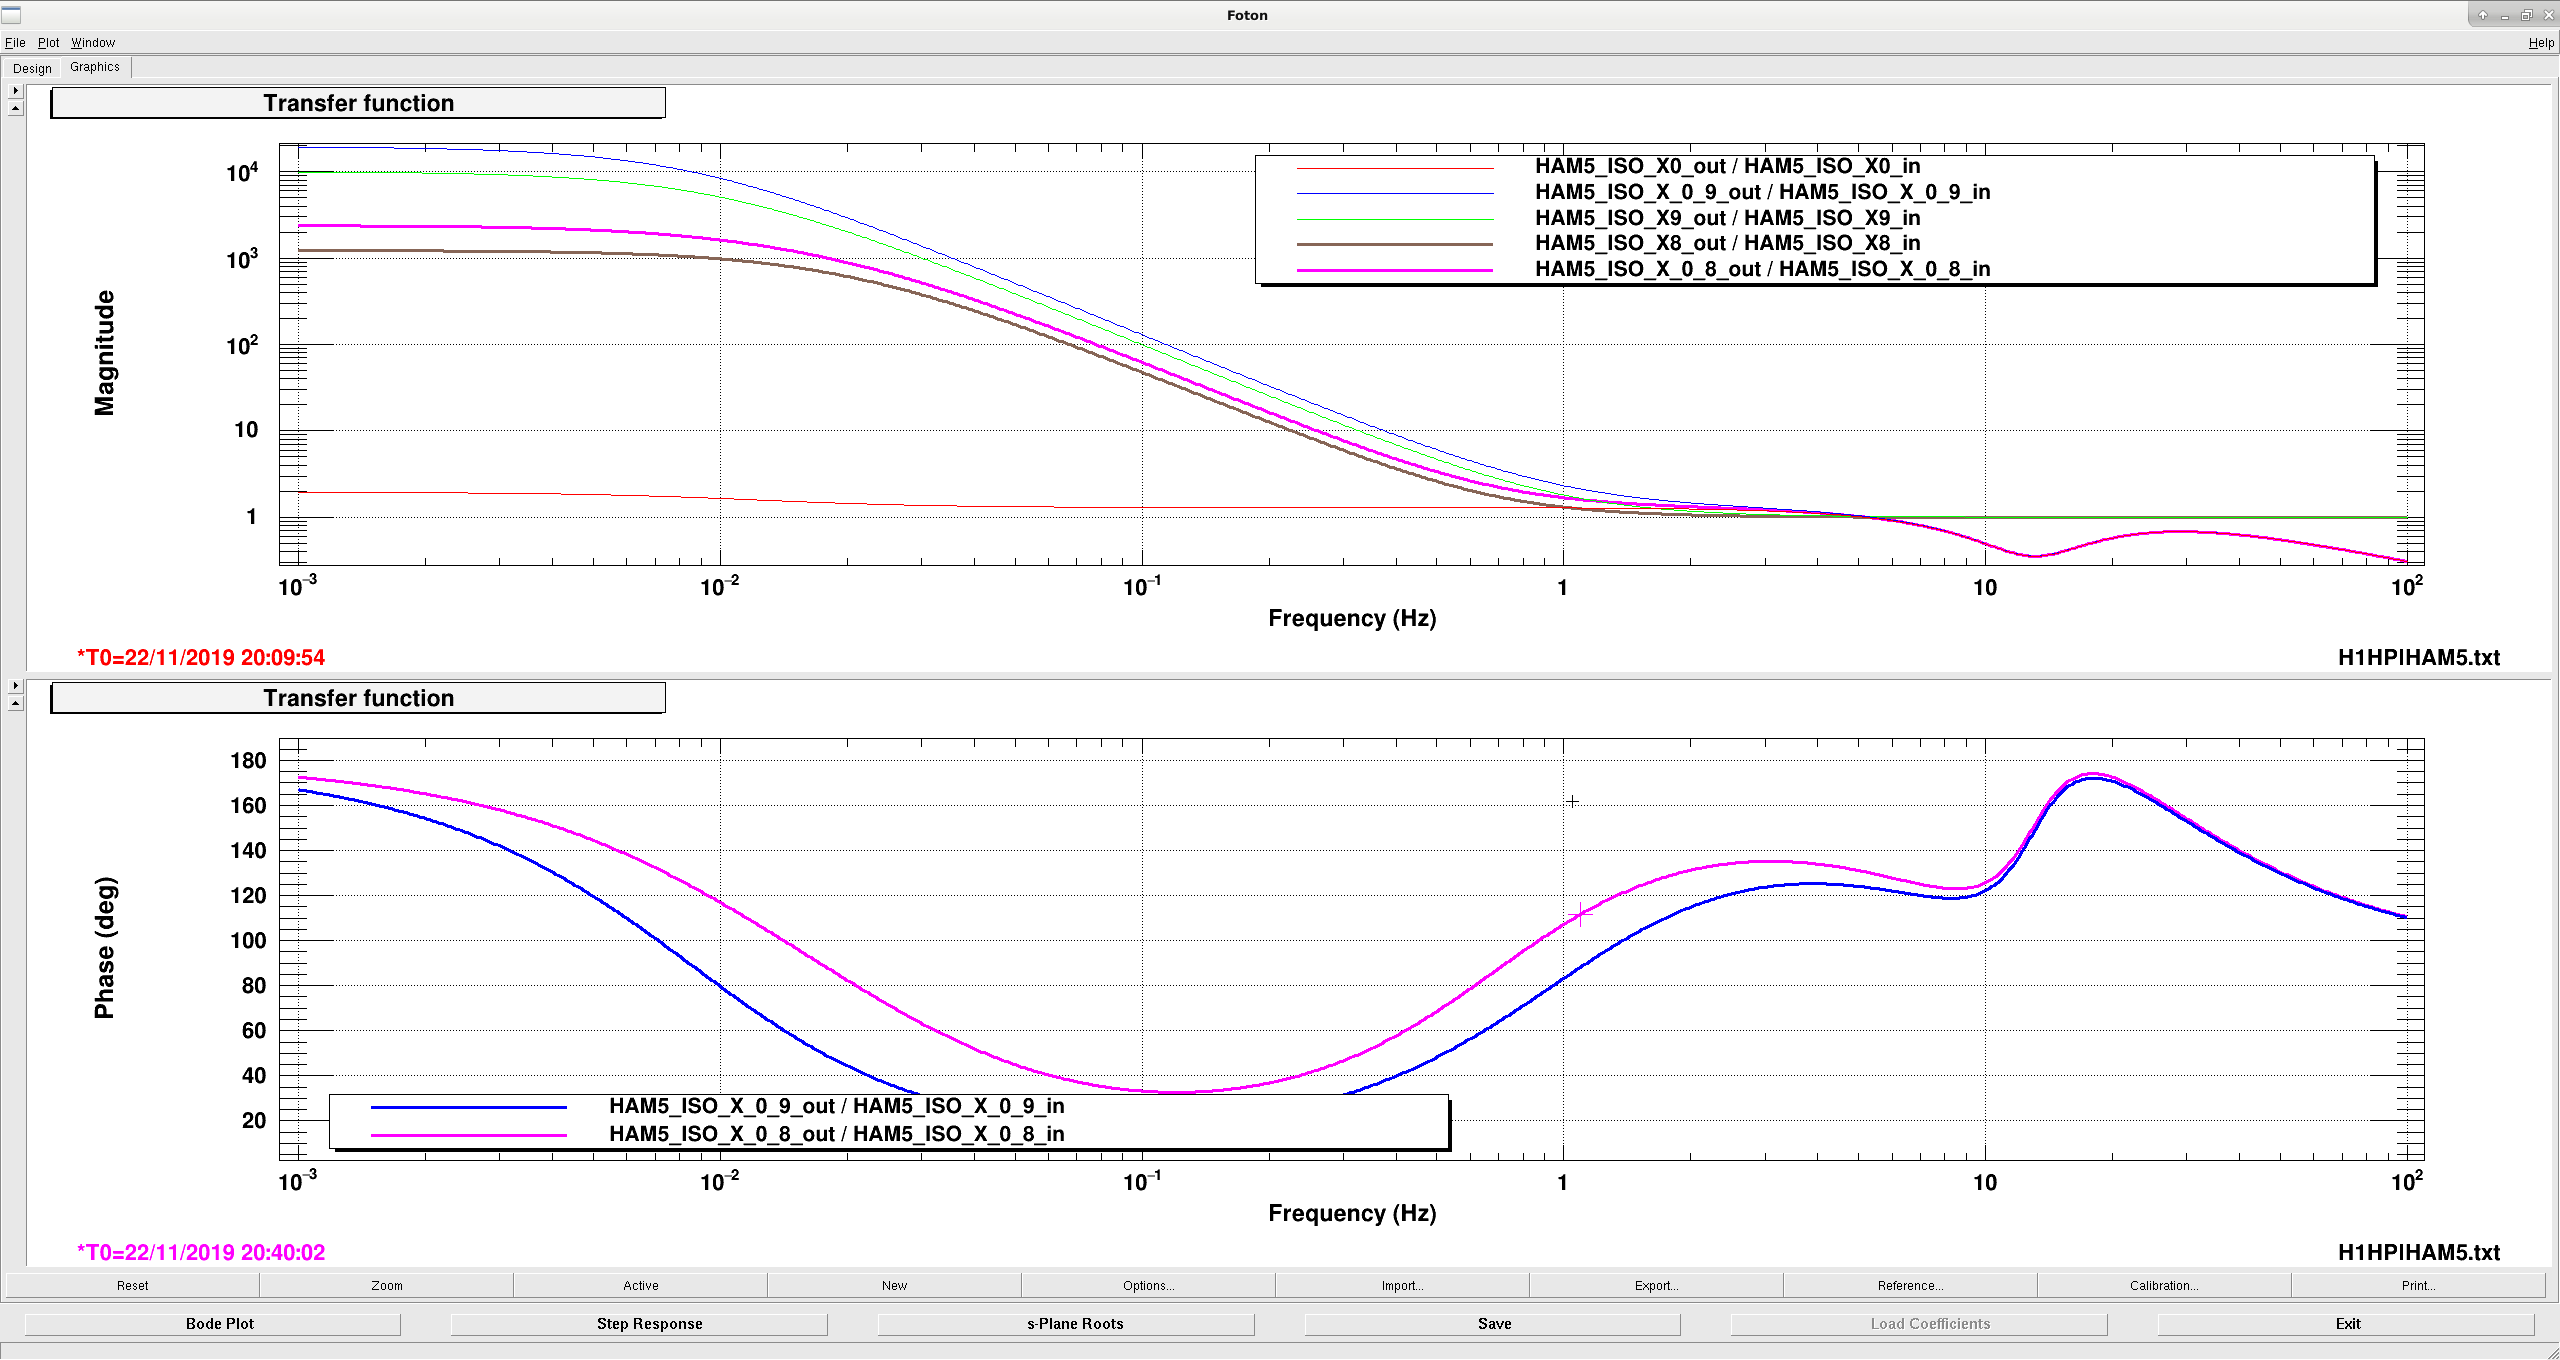
If loop stability is the problem, it would be relatively straightforward to modify the boosts to get more phase margin at 1hz. I played around a bit in foton, the boost is just a pair of poles at .01hz and a pair of zeros at 1 hz, and some small tweaks were enough to get back 20 degrees of phase at 1 hz. Fourth attached plot, the dark blue line is the current filter, the pink(?) line is with at tweak to the boost. I haven't installed this.
If a chance comes up, or during a maintenance day, I'd like to get some open loop measurements on HAM5 HEPI. It would also be good to look at doing some other tests like linearity, range of motion or...
For the operators:
If HAM5 HEPI trips, please give me a call. Likely whatever has happened to HEPI has gotten worse, and it won't be stable. I can either come in and try to patch it up, or talk through the filter modifications over the phone.
The line actually shows up about 19:00 utc on the 17th, pretty clear in the X spectrogram. There don't appear to have been any trips that day, but the ISI was taken down to damped, then reisolated. No alogs indicating model restarts, summary page doesn't show any trips at that time.
Operator Log from 16 October indicates HAM5 & 6 HEPIs were unlocked that day. Trends show the platform was not turned on until ~1900 on the 17th.
[Sudarshan, Sheila]
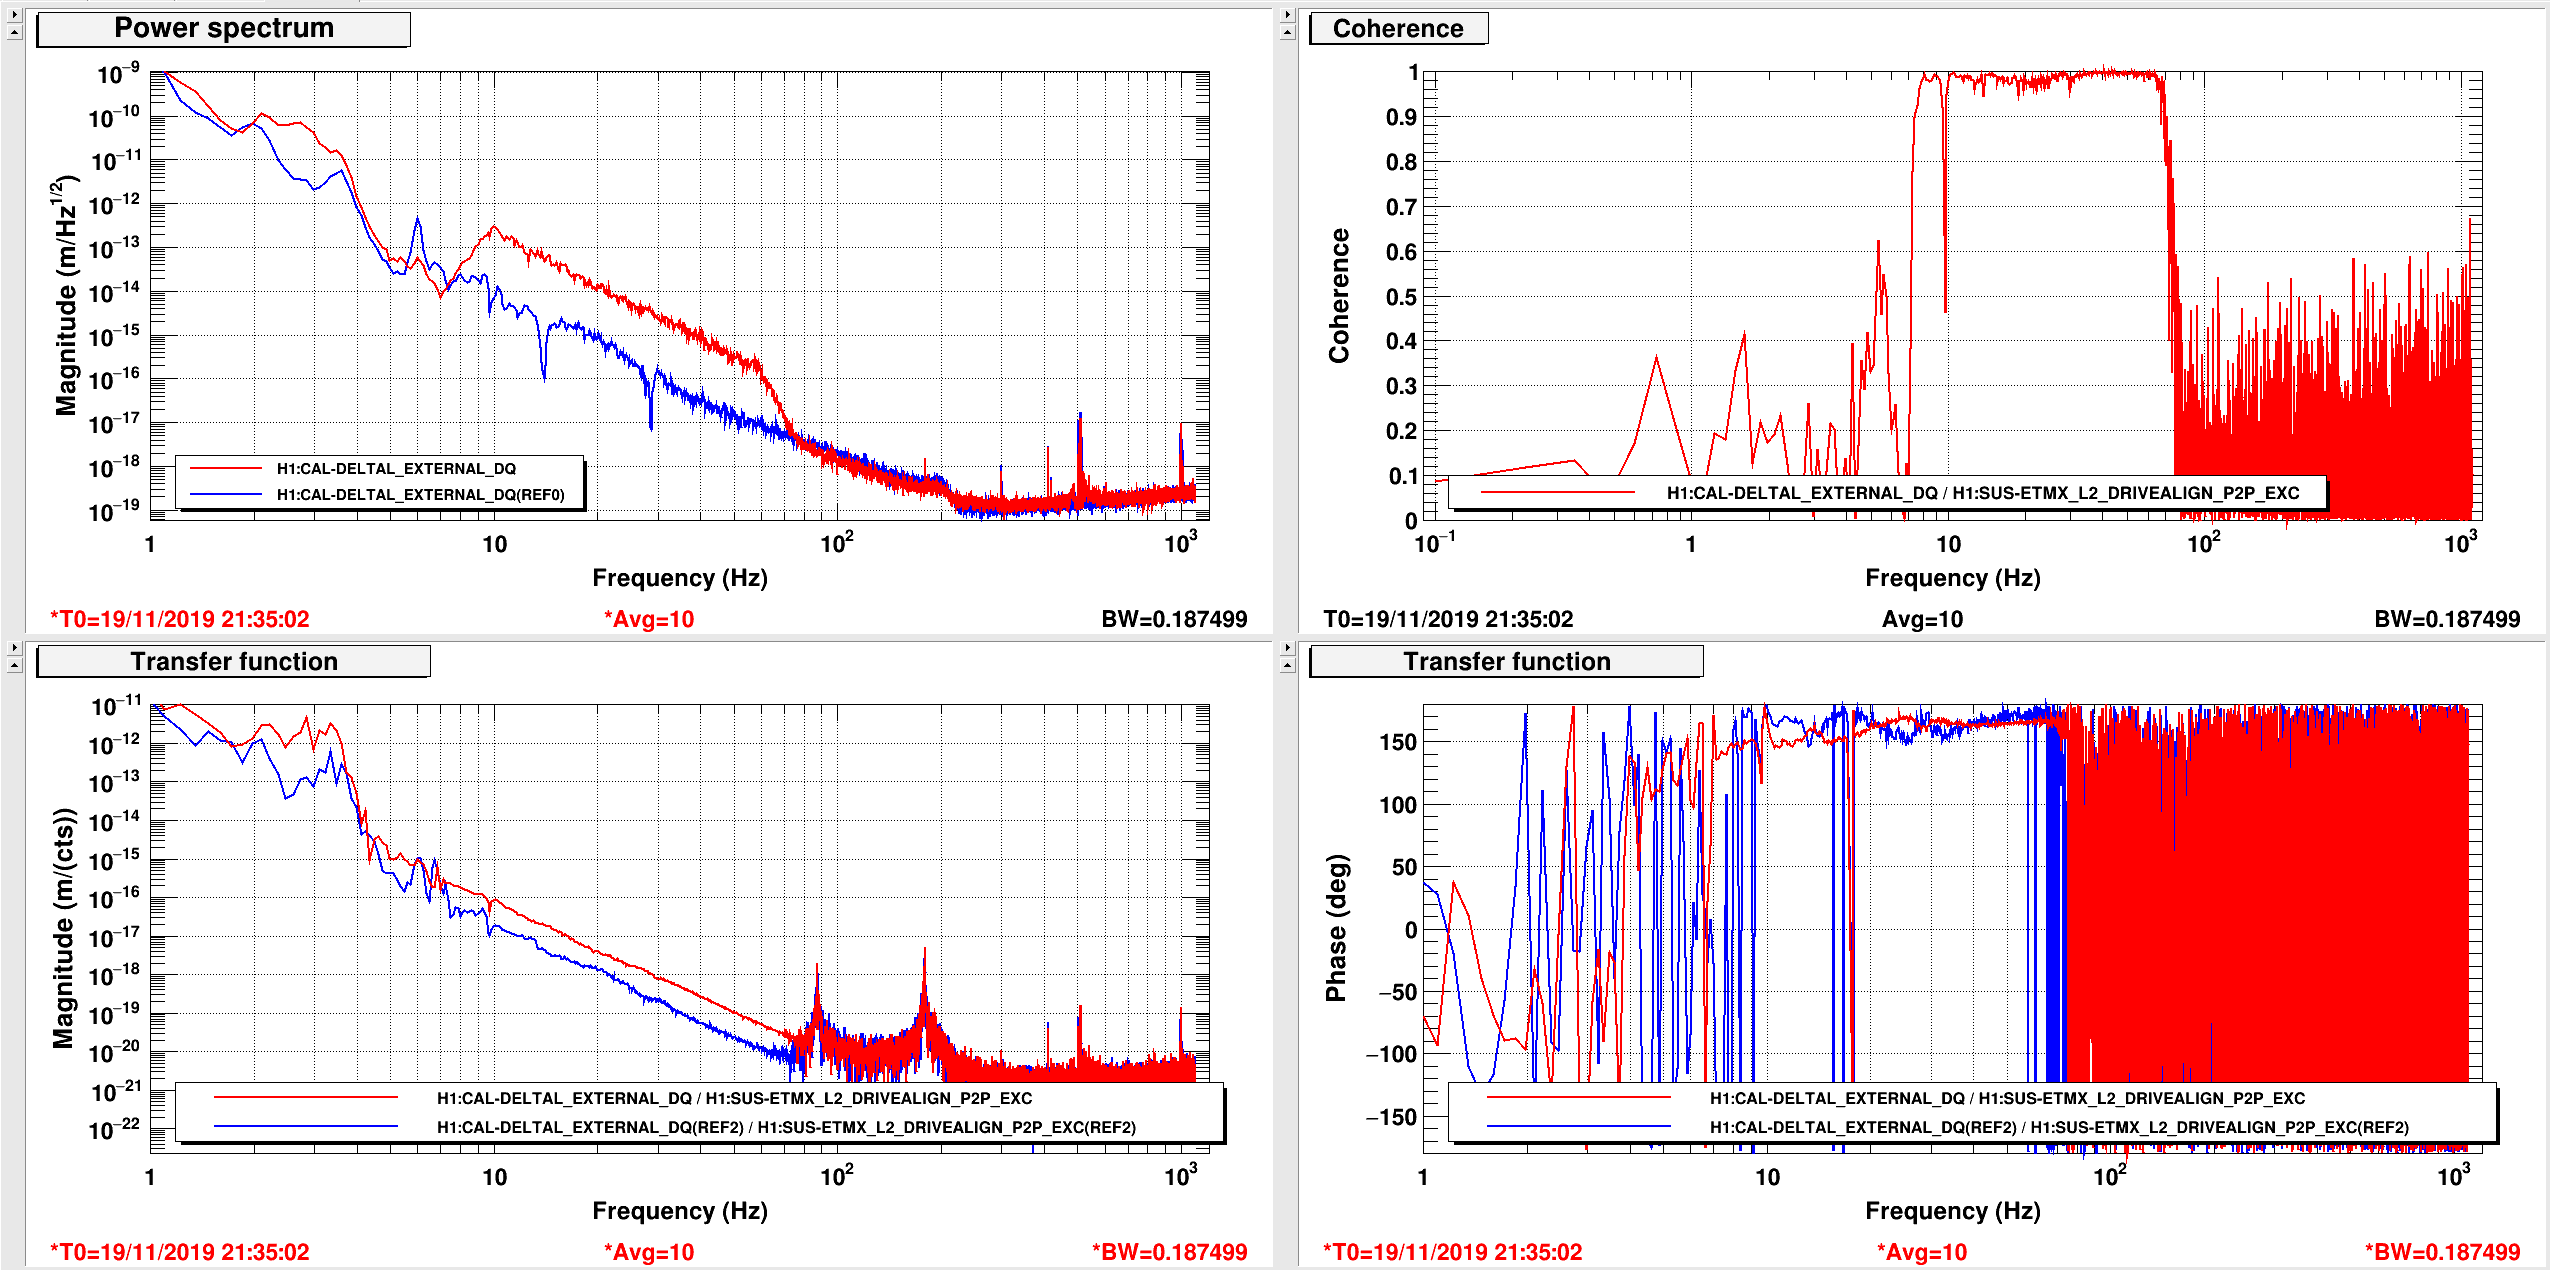
We made two transfer function measurements between the A2A L2 drive align filter and DARM with beam spot centered and beam spot moved at 2 watts input power. We drove only in Pitch. These measurments were done in an effort to understand the angle to length coupling of PUM stage. We will compare these measurements with the models to see how well they agree. The screenshot of the transfer function is attached below. Model comparison to follow soon.
[Sudarshan, Sheila, MattB]
The attached plot shows the comparison between the measurement, made above, and a model. The measurment seem to agree pretty well with the model in magnitude. There is some phase discrepancy, about 20 deg. at 20 Hz, between the measurement and the model. We don't yet understand why. P.S. The green shade on the plot is the frequency regime where the injections were made to make this measurement.