When taking DARM transfer functions at low frequency, one has to be careful to inject sine waves with low amplitude that don't break the lock or saturate the PCAL optical follower servo, while still having high enough amplitude to achieve coherence above the noise. These limitations have resulted in calibration TF sweep templates that take on the order of an hour to run. Broadband injections are fast, but often cause locklosses or PCAL saturations as gaussian noise causes strong DARM actuation in a sensitive part of the spectrum. One possible time-saver would be to inject multiple sine waves at once. In March Dan Brown and I wrote a class inISC_library.pycalledSineMultiple, which is anawg.Excitationclass which allows the user to define the amplitudes, frequencies, and phases of the sine waves. After running some test injections in the IMC, there is some under-the-hood phase optimization going on inawgandawgbasewhich automatically finds the optimal relative phases of the sine waves to minimize the "crest factor" equal to the ratio of the signal peak to rms. That is awesome. I ran a three sine wave injection at 4, 12, and 20 Hz simultaneously into IMC-L_EXC and measured the OLG. I then compared to a broadband injection. Seems to work. EDIT: I made some plots illustrating crest factor. The second pdf shows three sine waves with different phases. The third shows the crest factors vs phases for different frequencies. Seems that the 3 x the original frequency gives the lowest overall crest factor.
Jeff Kissel likes this. What's the coherence look like in this comparison between broadband and comb "multisine" excitation? I'm interested to hear more about the phase optimization. Smells like something similar to the Schroeder Phased combs that the seismic group uses. Thanks Dan and Craig!
WP8354 Dolphin EY Switch Replacement
Jonathan, Erik, Dave:
Summary: We have fixed the EY Dolphin problem. The short explanation is that with the later version of the Dolphin code running at LHO the 3rd adapter in h1cdsrfm (the one located at EY) is reinitialized, at which point its Dolphin switch port is unusable (either data only goes in one direction or the port is unavailable). By disabling and re-enabling the switch port normal operation is restored.
Some History: Following the IX Dolphin and long-range-dolphin upgrade of H1 in Sep 2018 we started seeing various types of glitching at a rate of about one a week. As part of the glitch investigation we upgraded H1 to the latest version of the Dolphin software (5.7.0) to facilitate support from Dolphin. After running for 10 months h1cdsrfm was rebooted (following a site power glitch) at which time its EY switch port (port 6) went into one-way-only mode. We moved it to port 4 and fixed the problem. One month later h1cdsrfm was again rebooted (following a h1boot1 crash) at which time its port (port 4) also went into one-way-only mode. We moved it to port 5 and fixed the problem.
This week: Thinking that perhaps the EY switch needs replacing, on Monday we installed a new IXS600 switch at EY and rebooted h1cdsrfm. Its port on the new switch was found to be not working. We put the original switch back in, connected h1cdsrfm to port 5 and found it was now not working. We replaced many hardware items at EY, the h1cdsrfm Dolphin card, its switch port, the cable. We discovered a problem when trying to install both of the spare Adnaco chassis (no link light) and we found that no matter which IXH611 card we put in the original Adnaco chassis it ran significantly hotter than EX (97C with chassis fan not running, 94C after we fixed the chassis fan, compare with 82C for EX).
Tuesday we looked at the logs and discovered that our version of Dolphin was reinitializing h1cdsrfm Adapter2, which was not happening at LLO, presumably due to the code version difference. We also found out that the spare Adnaco chassis most probably did not work because its DIP switch setting was not correct.
Adnaco DIP settings: For an Adnaco chassis to work at an endstation, it needs to be a Long Range version of the board (signified with a 'LR' label on the board itself). It also needs the DIP switch 3 to be set to the non-default setting of OFF, which then matches the DIP settings on the h1cdsrfm adapter PCIe card. The boards on both of our spare chasses had switch 3 switched to ON (the default position).
Today we went back to EY to complete the last hardware swap, install a spare Adnaco chassis with the DIP setting corrected. Inside this chassis we installed the original Dolphin IXH611 card as was in the system from Sep 2018 to Jul 2019.
Here are the details of today's investigation
0. in prep for a changed serial number of the card at EY, changed dishosts.conf and restarted dis_networkmgr
1. disable h1cdsrfm ports and power down computer in MSR
2. At EY, replace Adnaco chassis with the one described above.
3. Power up chassis, power up h1cdsrfm, Link Light!
4. But, same problem. dis_diag suggests EY dolphin is not connected to switch, but this is false as all LEDs are nominal.
5. Somewhat in desperation we moved to a different switch port (like what was done Jul, Aug even though the port failure mode is different). Disabled port 5, moved cdsrfm cable port 5->8
6. dis_diag now sees all nodes at EY. We're seeing a pattern.
7. To see if this persists following a h1cdsrfm reboot we disabled the ports and rebooted h1cdsrfm
8. BAD, we forgot to change ixnodetab to the new port, crashed all EY models
9. dis_diag now does not see EY nodes from port 8.
10. try the port swap one more time, disable port 8, enable port 5, move cable 8->5.
11 nodes are again seen. So disable/enable sequence is needed, but is a cable disconnect/reconnect needed?
12 to test this, disable h1cdsrfm ports (this is port 5 at EY), reboot h1cdsrfm
13 At this point EY nodes are not seen, so disable EY port 5 and then enable it, keeping the cable inserted
14 all nodes are now seen at EY. We have a work around.
15 Restart all the EY models before starting the cdsrfm code. BAD, accidentally restarted h1susex first.
16 after all models are running, started the long-range-dolphin code on h1cdsrfm, all IPC running again!
This work has been a learning experience with several positives take home messages:
New h1cdsrfm restart procedure: until we can fix the Dolphin reinitialization problem on Adapter 2, a disable/enable following reboot for the EY switch port permits IPC data to work correctly.
Spare Adnaco chassis: finding the DIP setting issue now means we our spare chassis can be used at the end station
Adnaco chassis running hot: the original EY chassis (board SN C8610323) was running cool in Jan 2019 (82C) and hot this week (94-97C). We need to investigate why this is before using this as a spare chassis.
👏🏾👏🏼👏👏🏻👏🏿 Wow. Excellent work, gents (and well-documented)! 👏🏾👏🏼👏👏🏻👏🏿
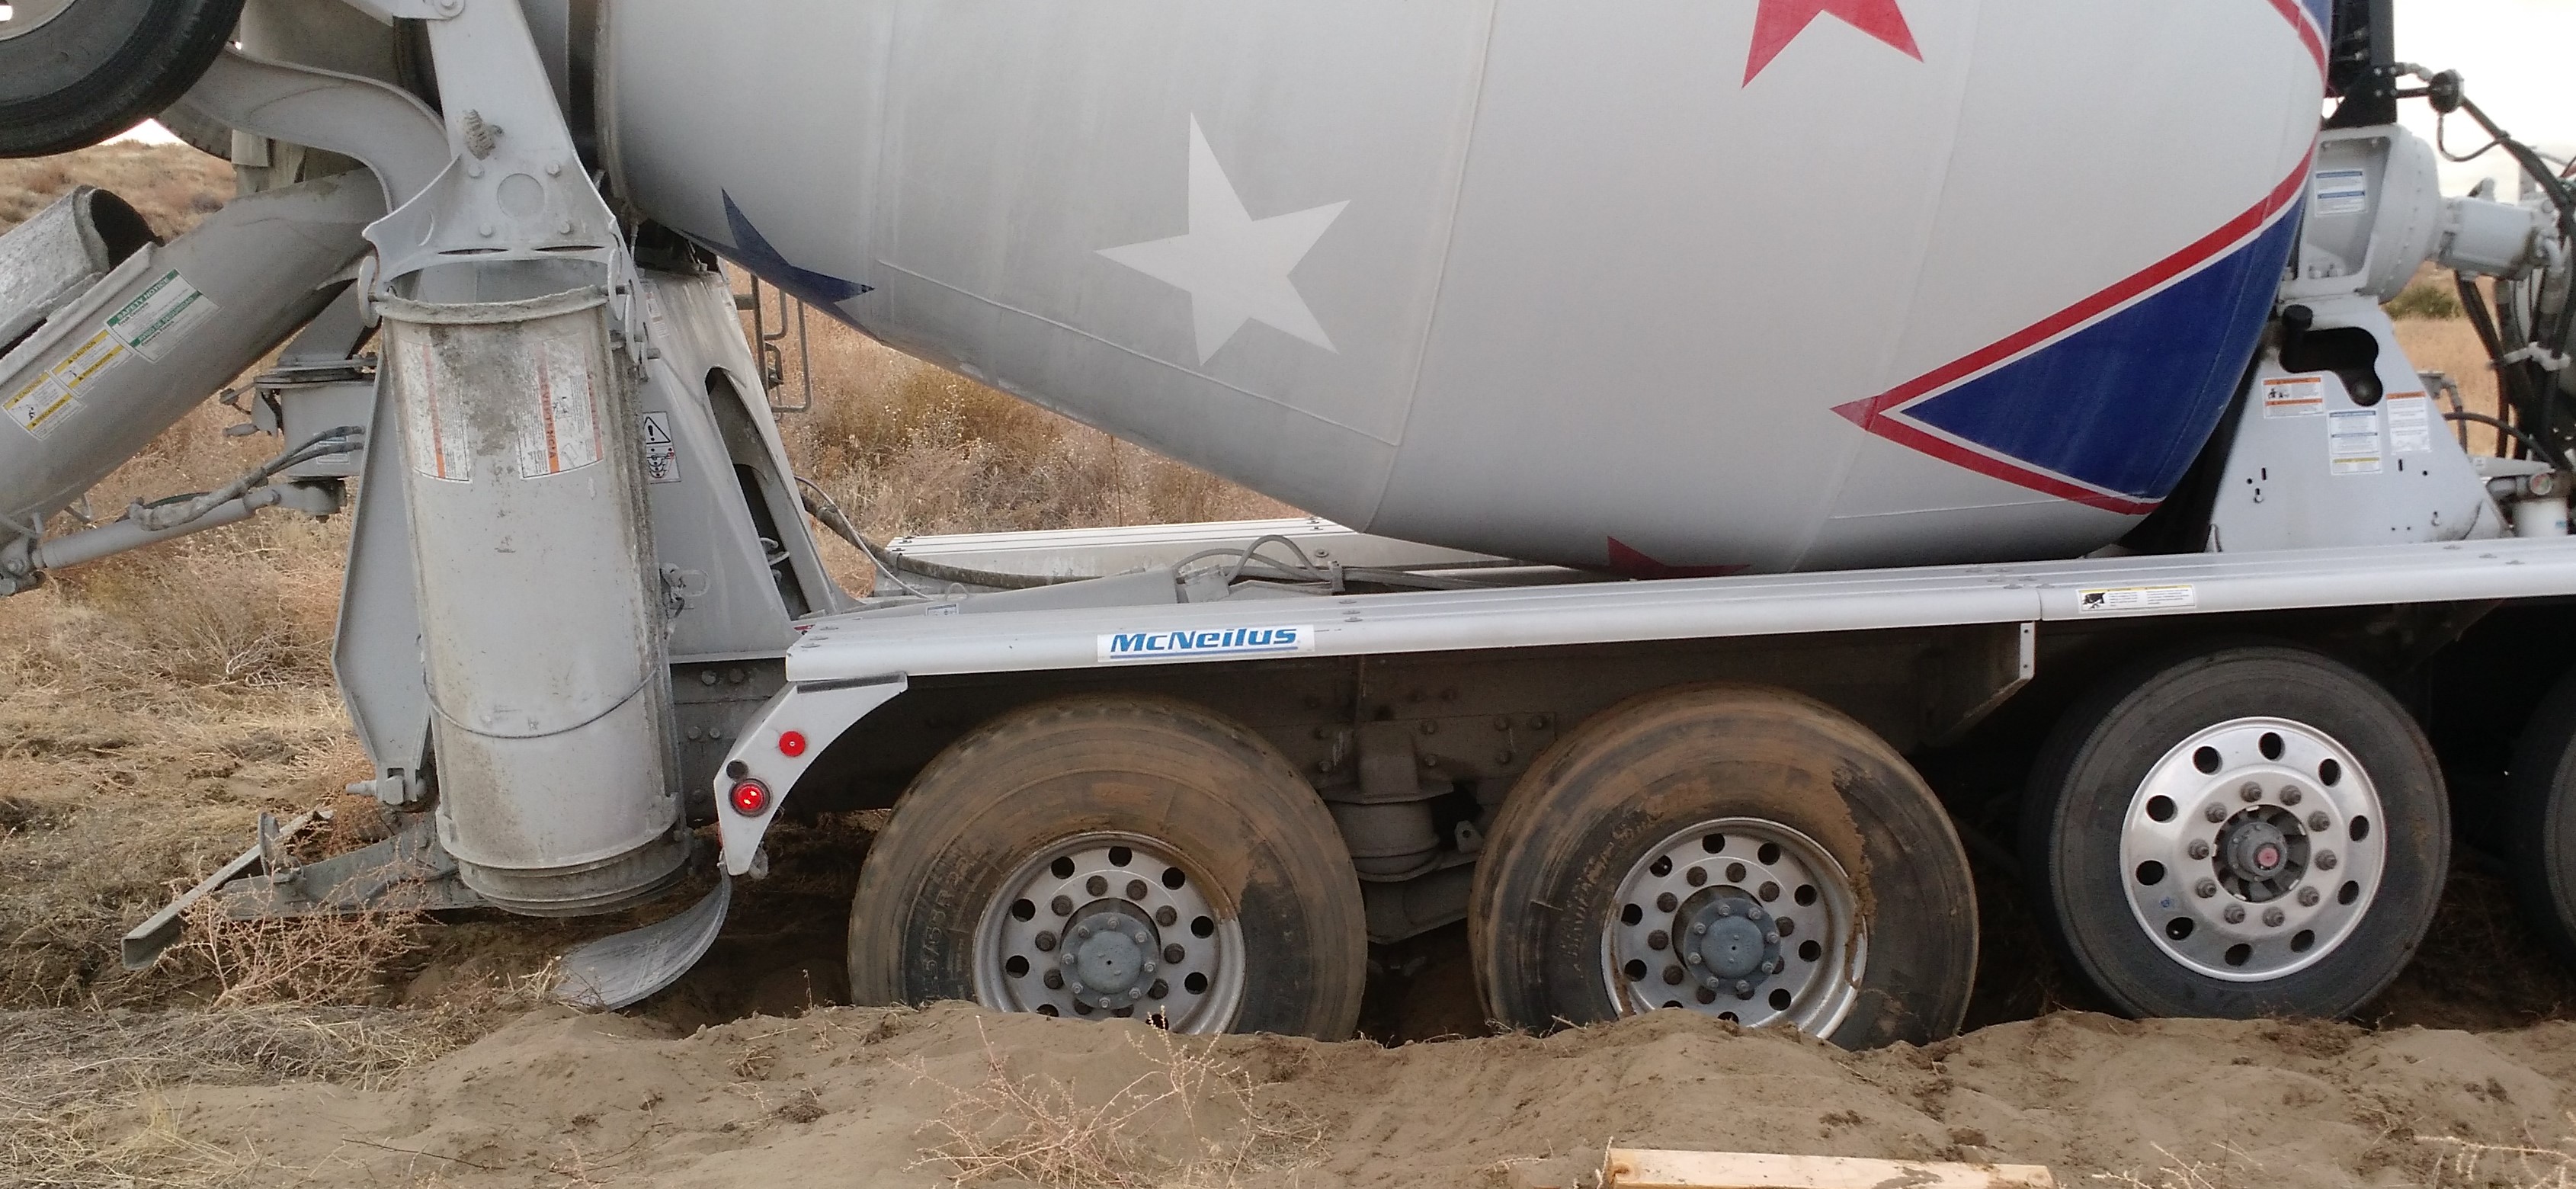
The cement delivery truck got stuck at the far end of the line before pouring anything. It was pulled out about 3 hours later.
The base of the hole will now be filled with large river rock (in November) and at least some if not all future cement will be pumped rather than dumped.
D. Sigg, M. Pirello
Installed the 2nd new AM-AOM Stabilization Servo for the CLF today. Some of the cables are very tight in front of this one. I had to briefly disconnect two squeezer demod cables to squeeze this chassis in. It might be a good idea to increase the lengths of these cables and dress them to allow for ease of maintenance.
S1900202 is in position for the CLF.
S1900203 is attached to the green pump laser.
J. Oberling, T. Sadecki
In perparation for surveying the position of the new NCal system at End-X, Travis and I placed new monuments for equipment setup. We placed 2 new floor monuments (IAM-EX-T6 and IAM-EX-T7) and added 1 new vertical height monument (BM#5). New monument coordinates:
D1100291 has been updated to -v7 to reflect these 2 new floor monuments; I have been unable to find a repository of EX height monuments on the DCC to document the new height monument, so this entry will suffice for now. This completes LHO WP 8426.
I'm in the process of modifying the code for the addition of the heater elements. It may be down for a day or so.
This is a brief report on NCal test demonstrations, with observations primarily from the perspective of operational safety.
Test operation was observed on two occasions and vibration levels were observed both subjectively and via crude measurements. The outcome is that Site Safety agrees with moving forward with operation in the end station, after successful completion of the Hazard Analysis
Timesh had recently made changes to the NCal apparatus, including a new coupling and care in alignment during re-assembly. In todays test, he gradually increased the rotation rate, allowing for observations at various rotational frequencies. Here is my subjective, qualitative account.
Photo of apparatus:
The rotor was slowly spun up to 10 Hz. I couldn’t detect any vibration with my hand on the table, but could detect some vibration with my hand on the boxed enclosure – far less than a DVD spinning in a laptop.
The rotor was then slowly spun up to 20 Hz. I could detect vibration with my hand on the table, and also significantly more on the boxed enclosure than at 10 Hz, but still somewhat less than a DVD spinning in a laptop.
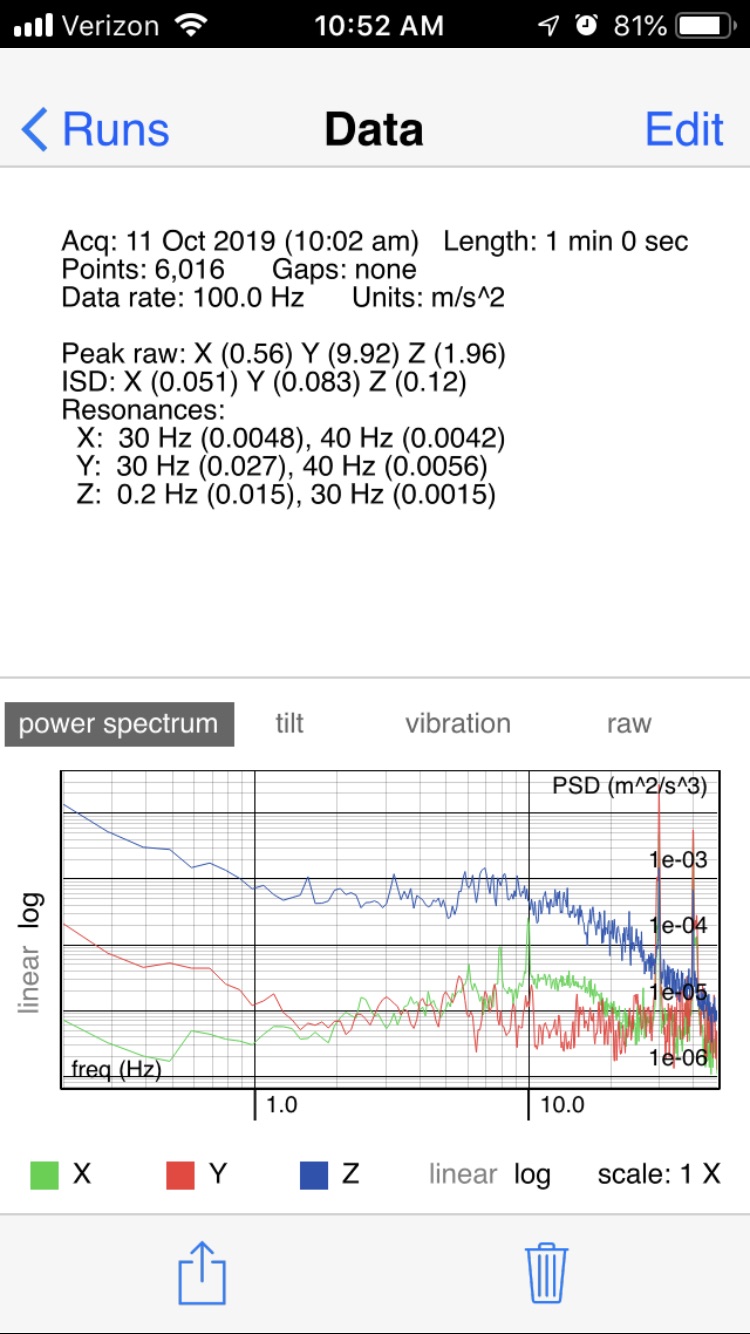
The rotor was then slowly spun up to 30 Hz. This felt about the same as at 20 Hz. Below is a power spectrum obtained while the apparatus was spinning at 30 Hz, using my VibSensor app (NOT calibrated, NOT NIST traceable), run time 1 minute, with unsheathed phone placed vertically on the front center of the enclosure, display facing towards the viewer in the photo above, and held in place by holding the phone sheath in contact with the top of the phone:
[see image attached]
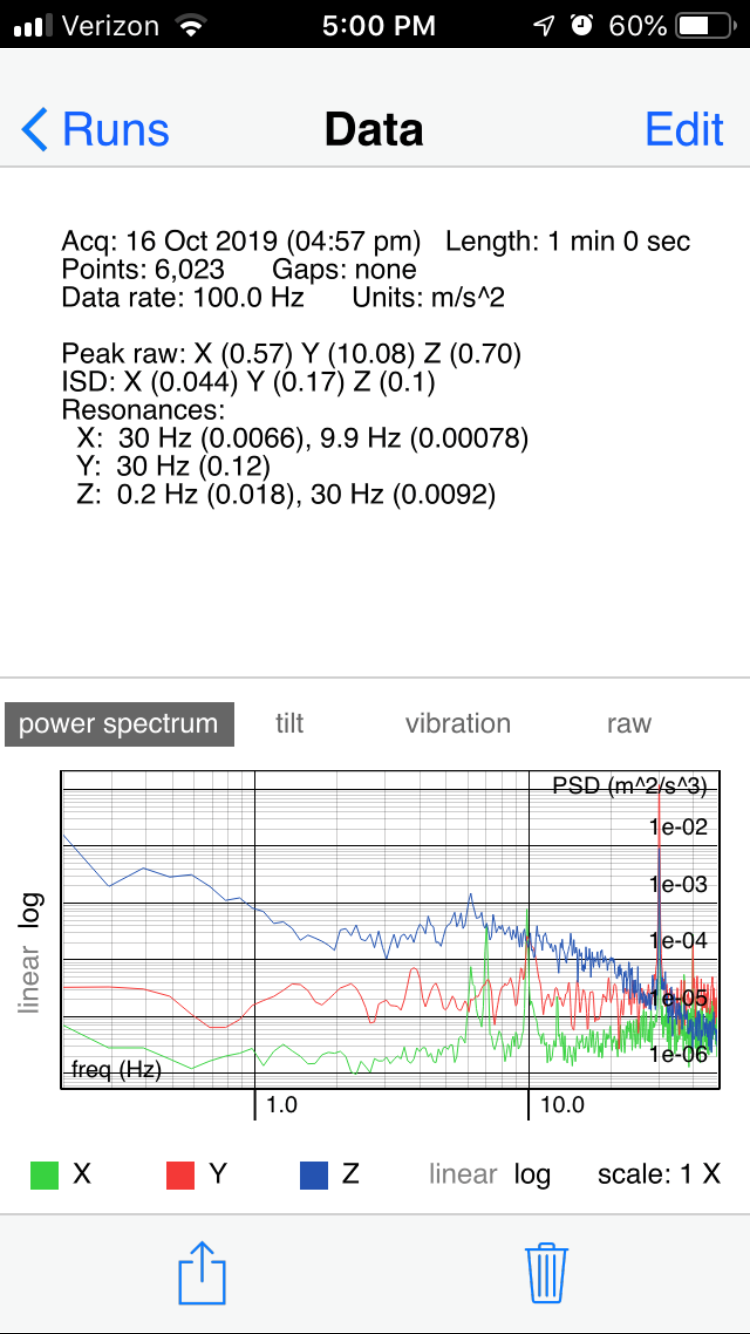
After further refinements to the apparatus, another observation was performed, this time at 30 Hz. Any differences using the “touch” test were too subtle to describe. Power spectra, taken as described above, is included below. From the plots, it appears that Z-direction vibration (the highest magnitude component of vibration) has been reduced slightly.
[see image attached]
WP 8382
All cabling for the BRS Heater installation have been pulled at EY. Will need help from SEI group for access to the BRS enclosure to finish 24V power and beckhoff network connections.
EY cabling complete.
Topped off Crystal Chiller with 140 mL. Diode Chiller OK. Filters look fine (slight yellow tint of Crystal filter [known item]).
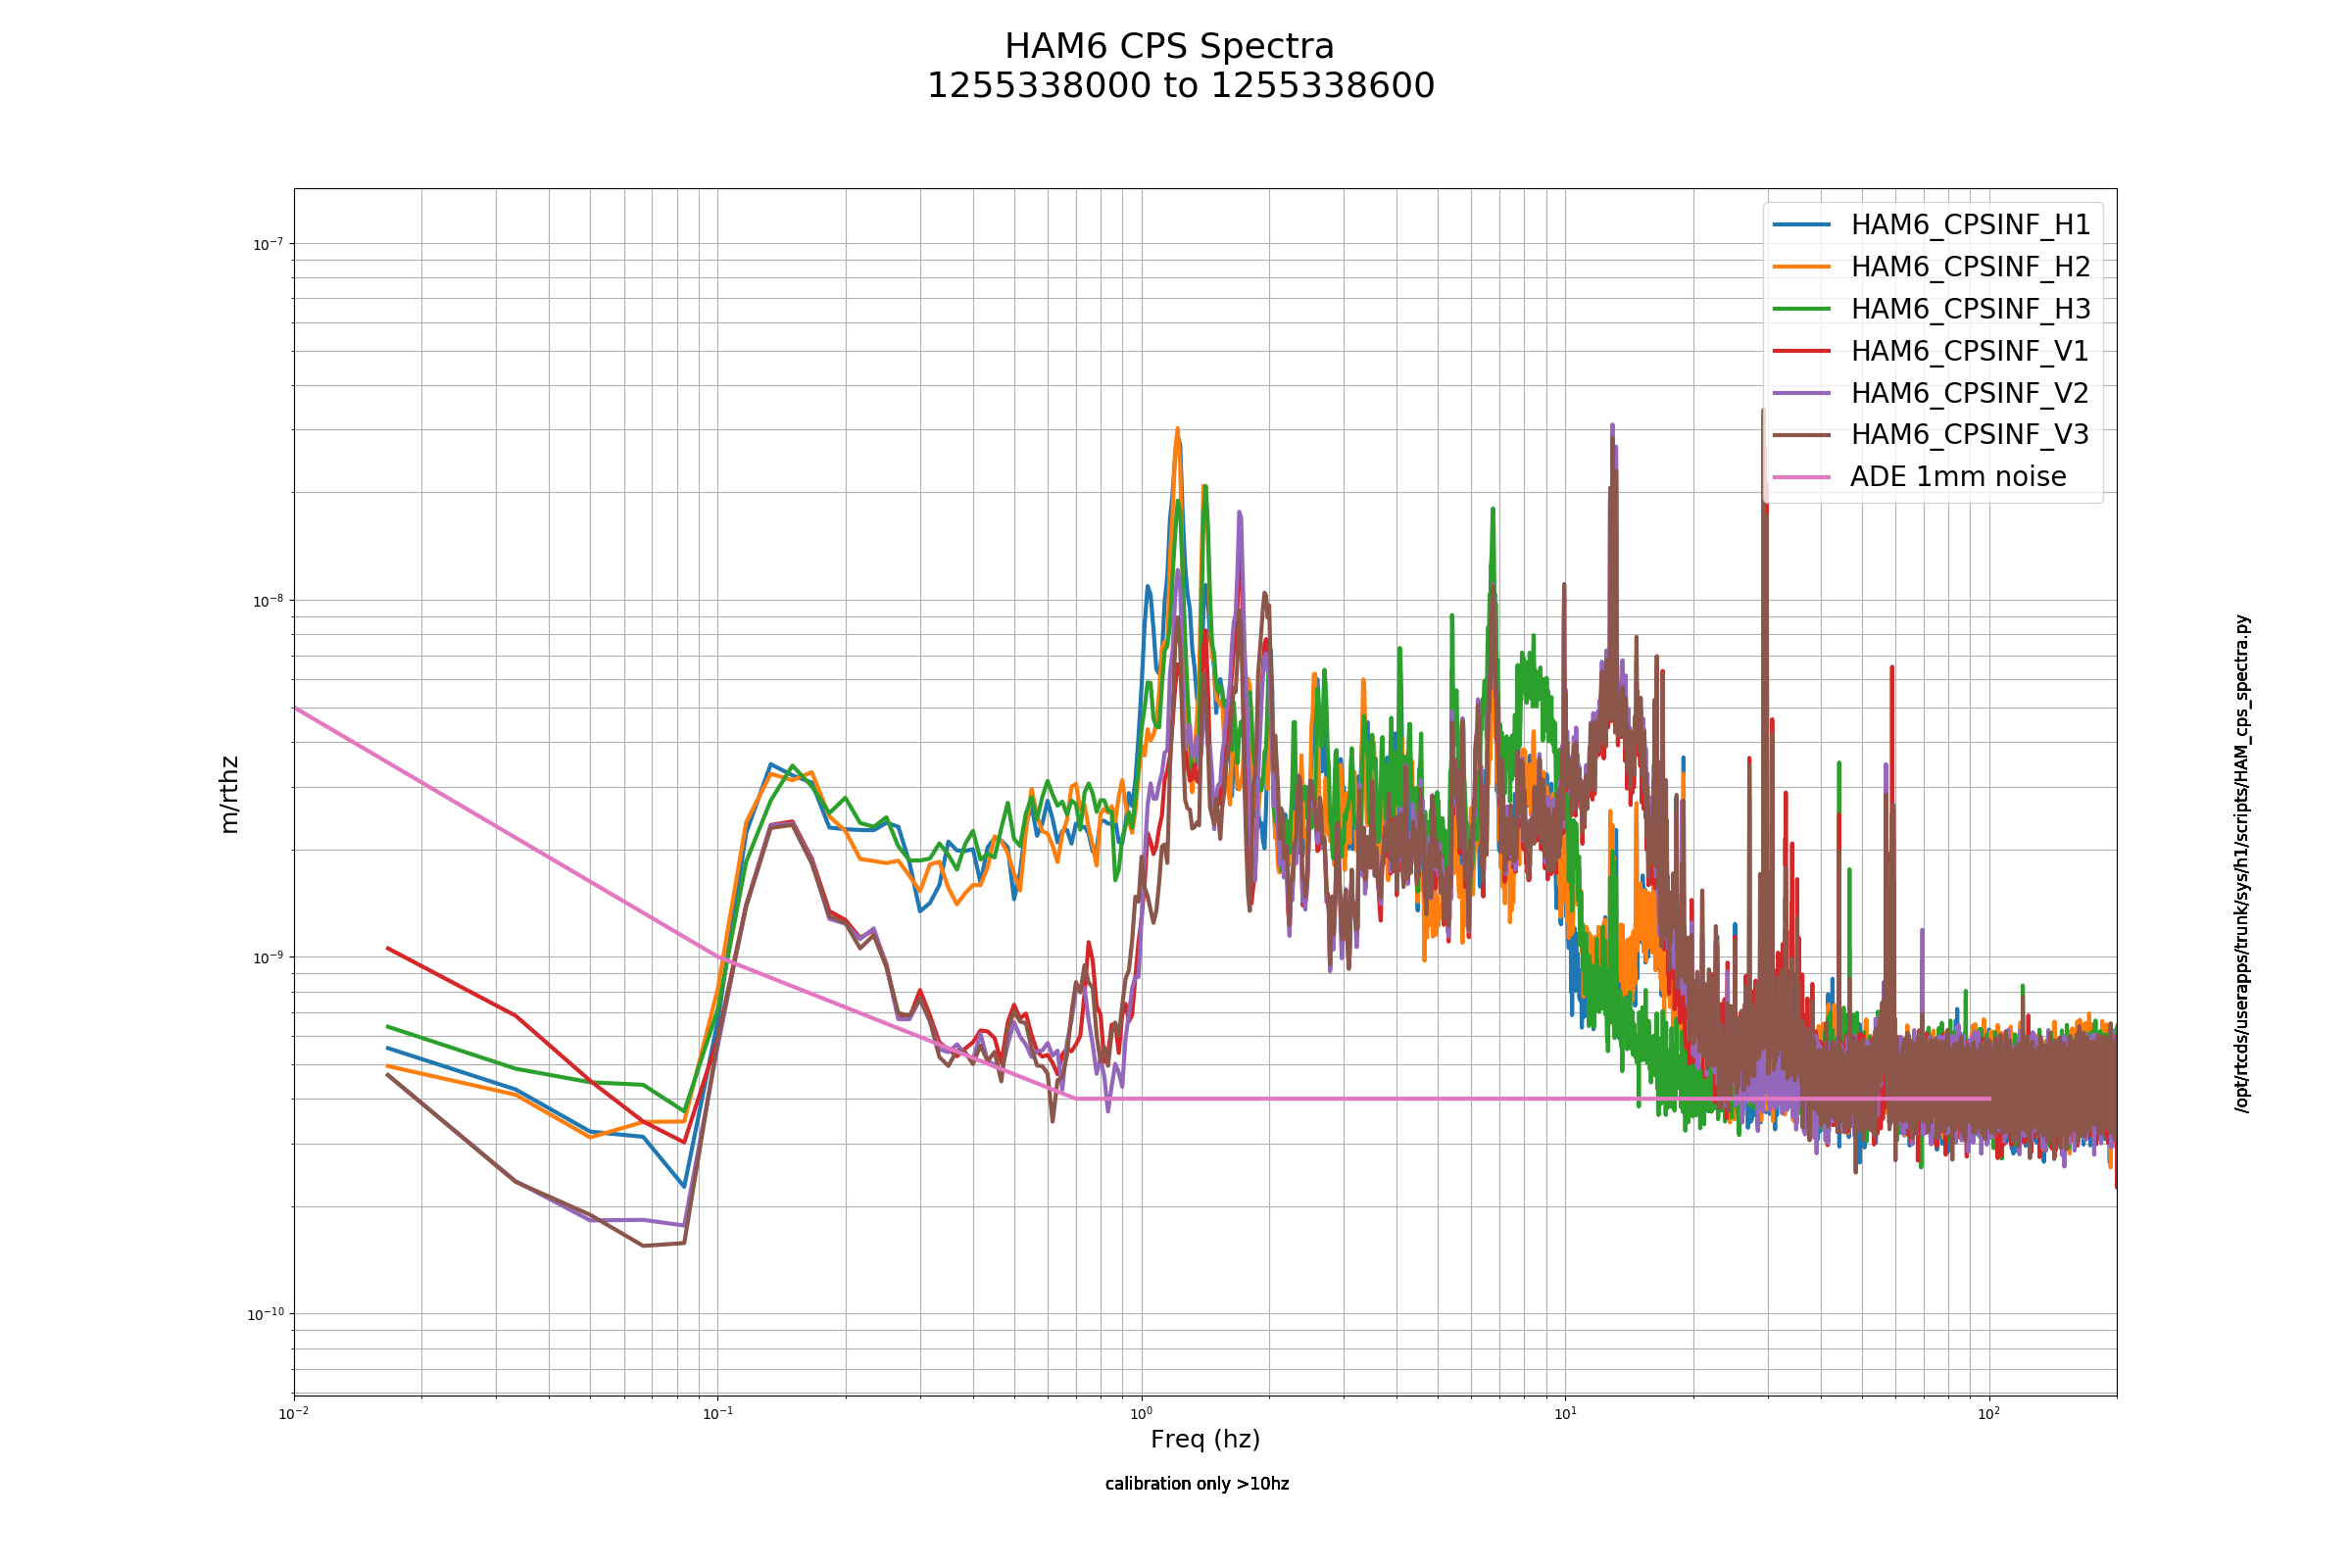
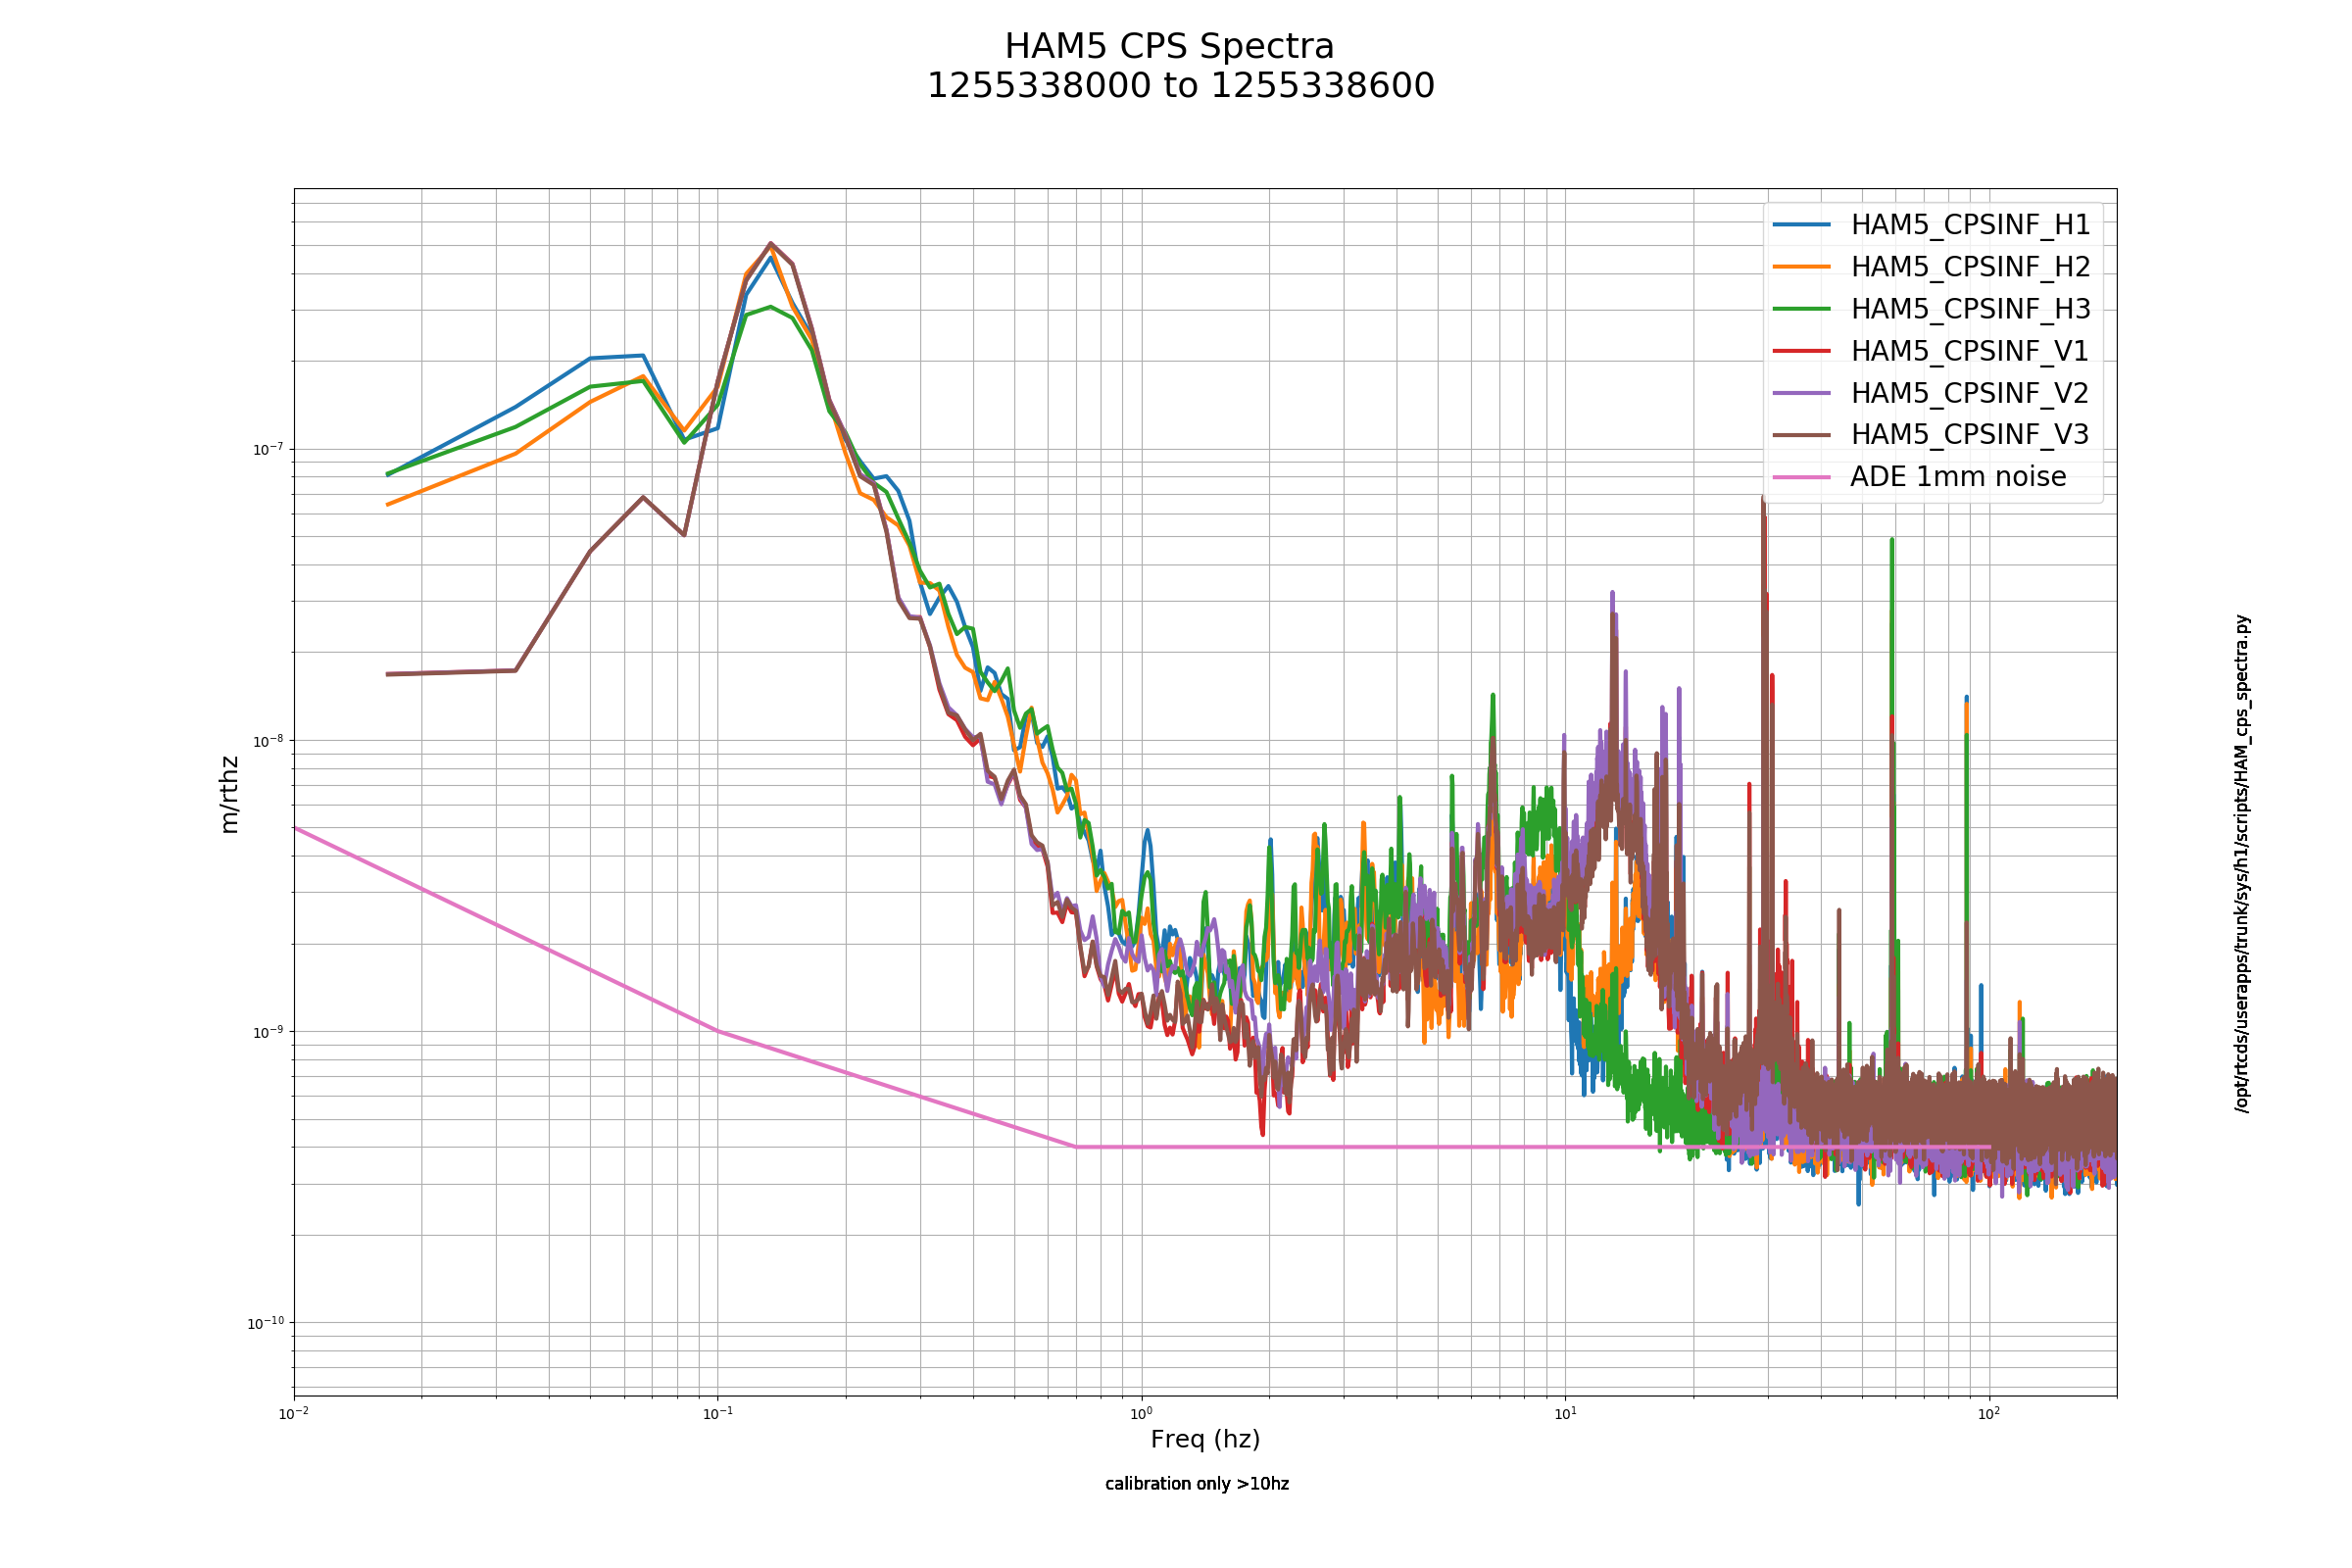
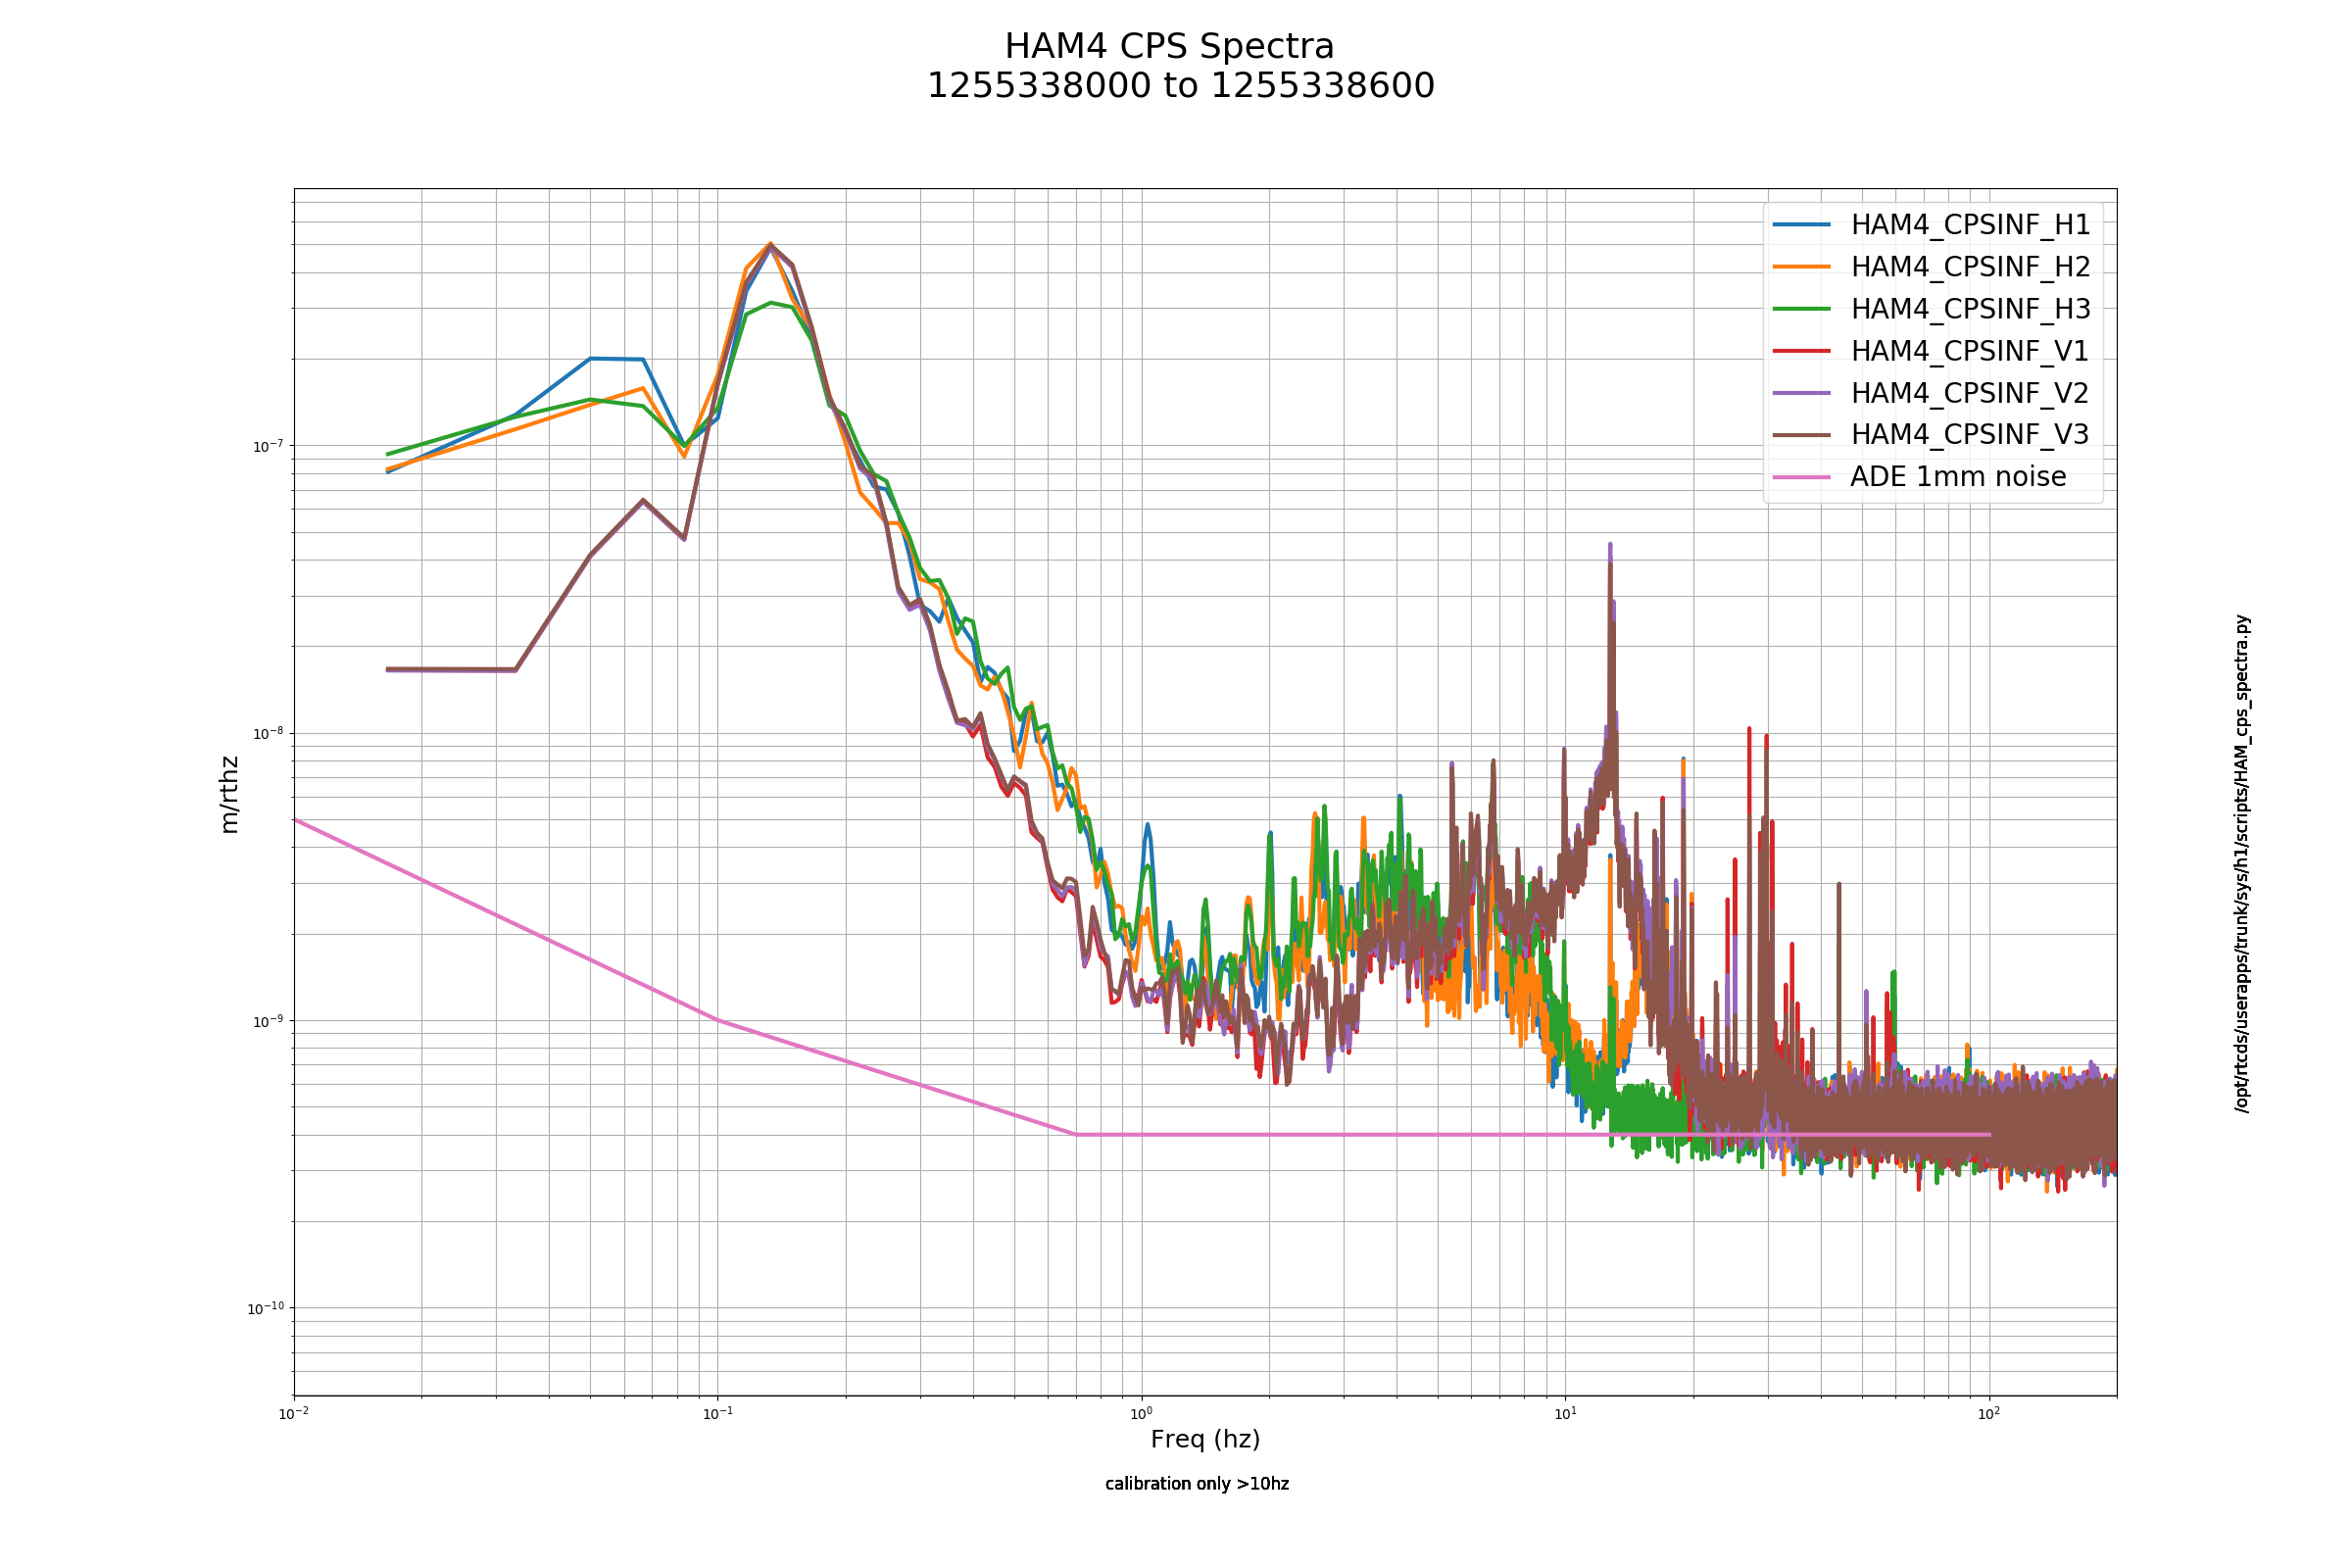
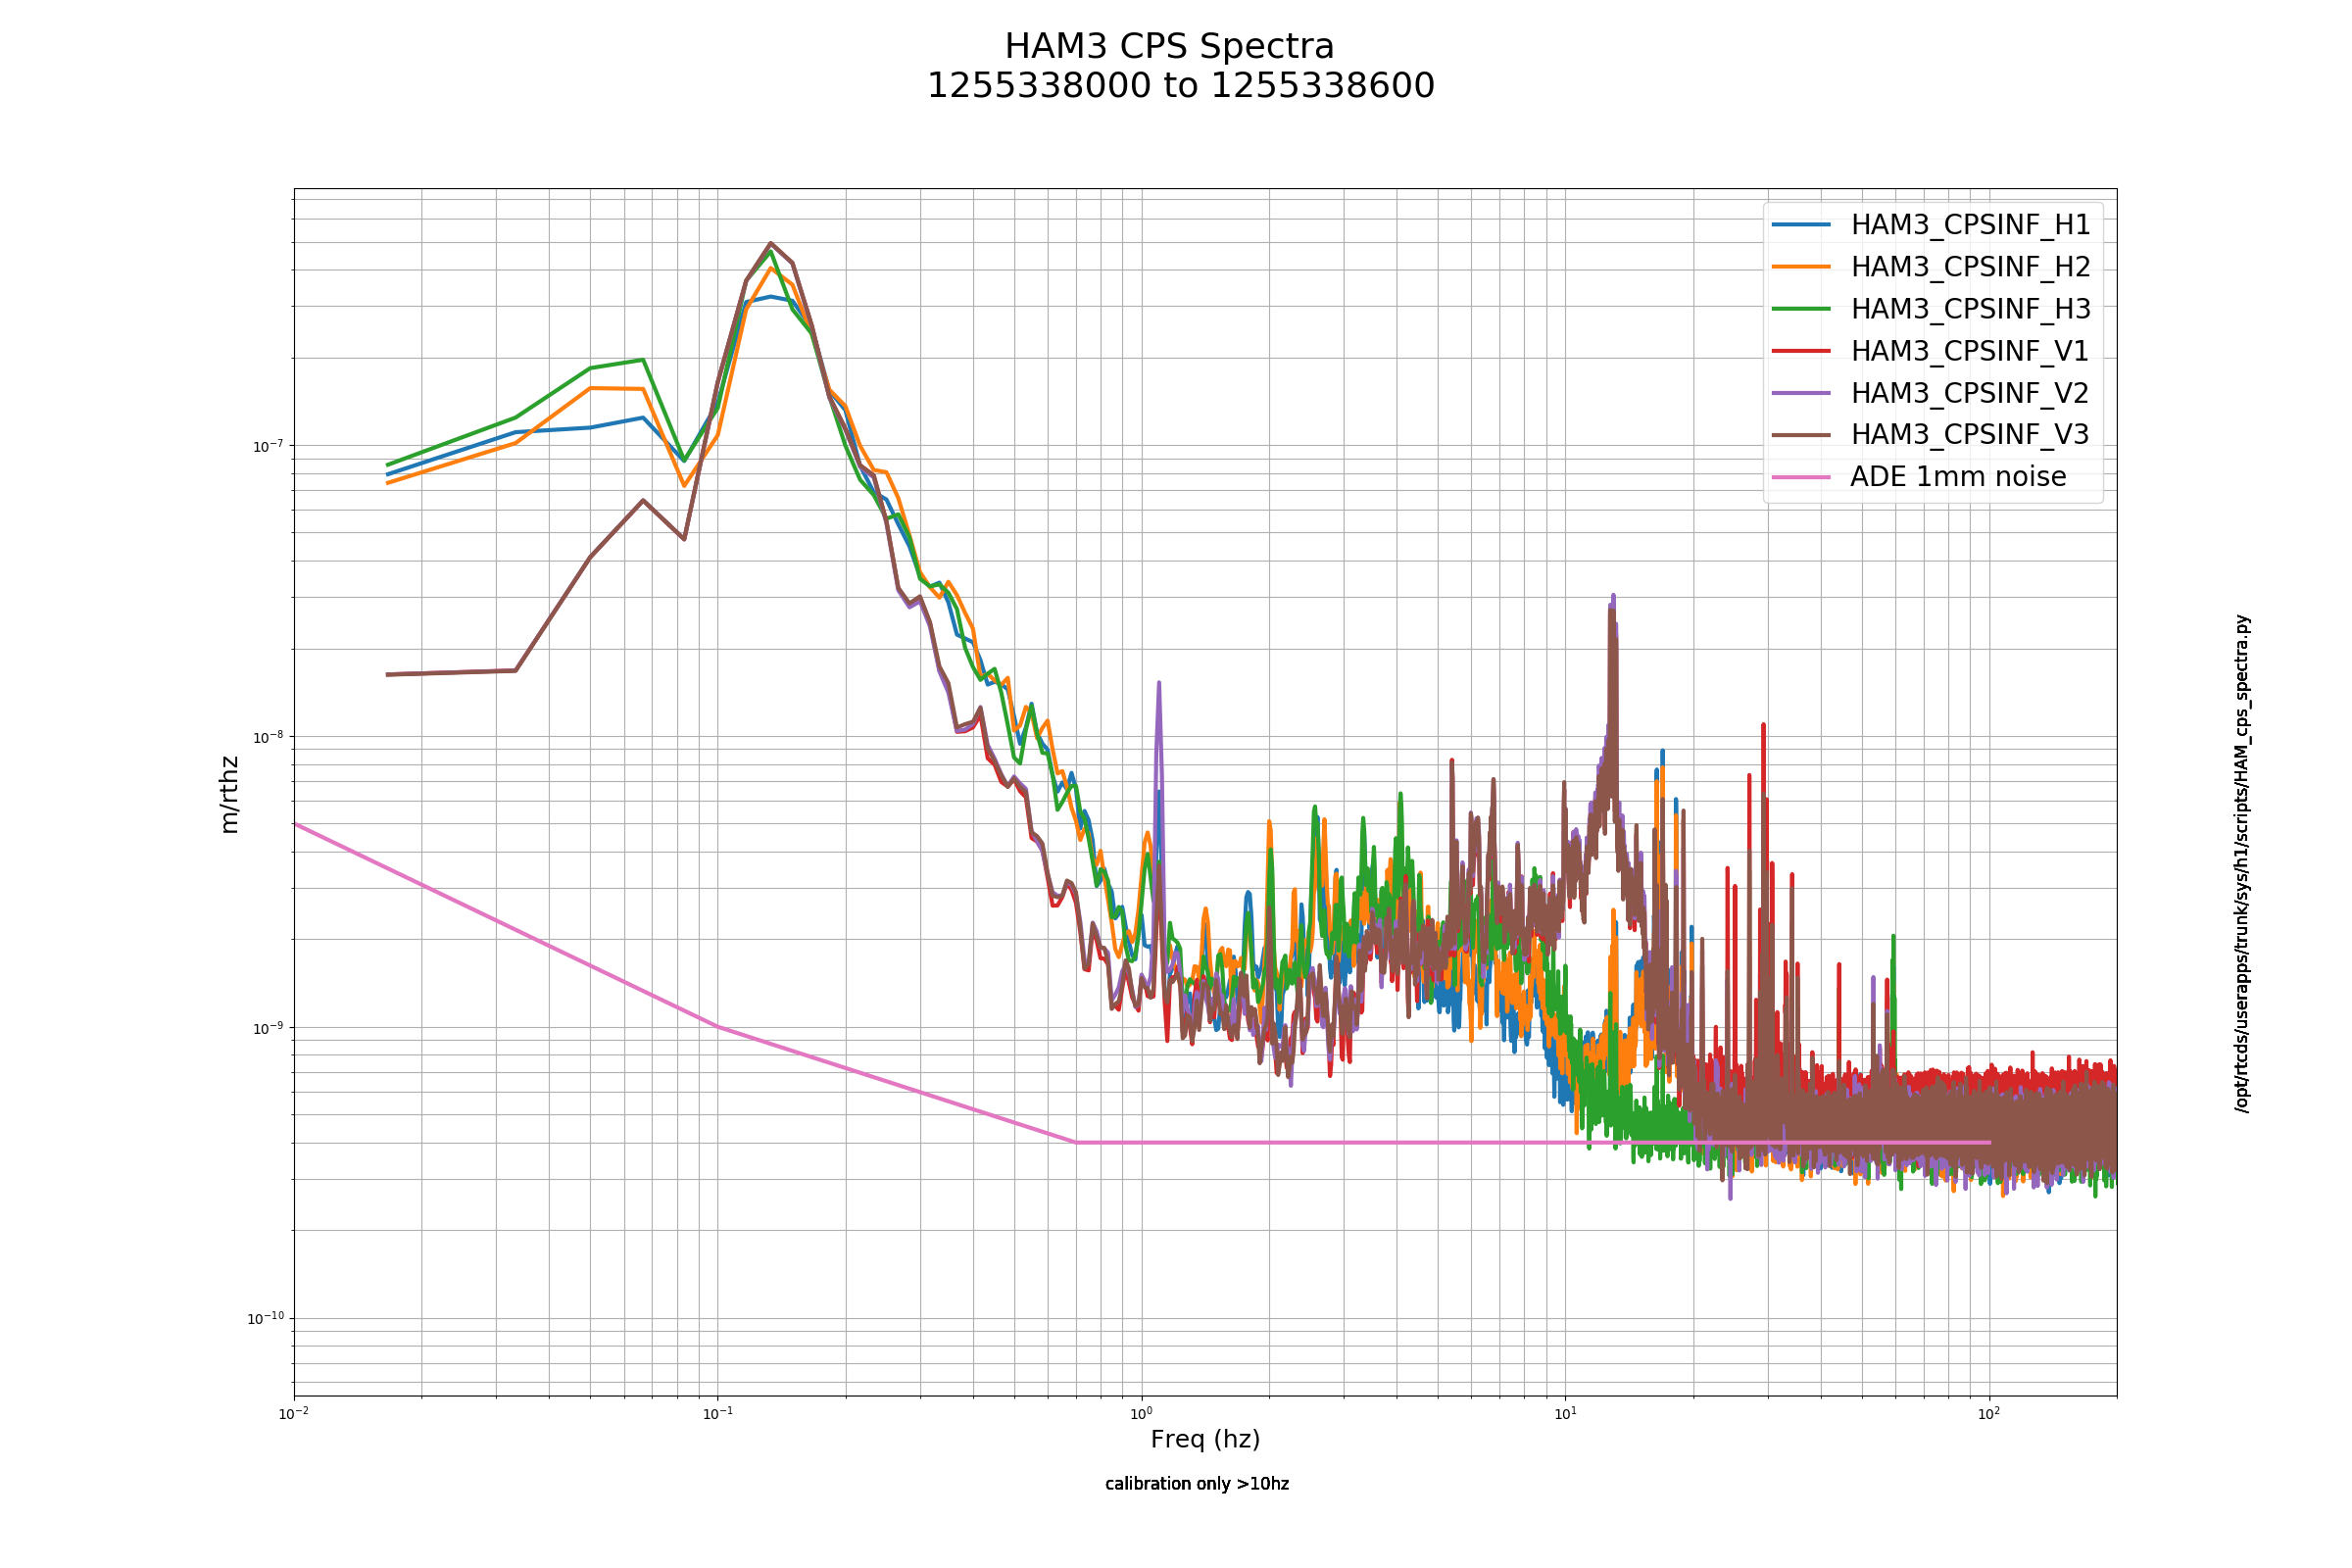
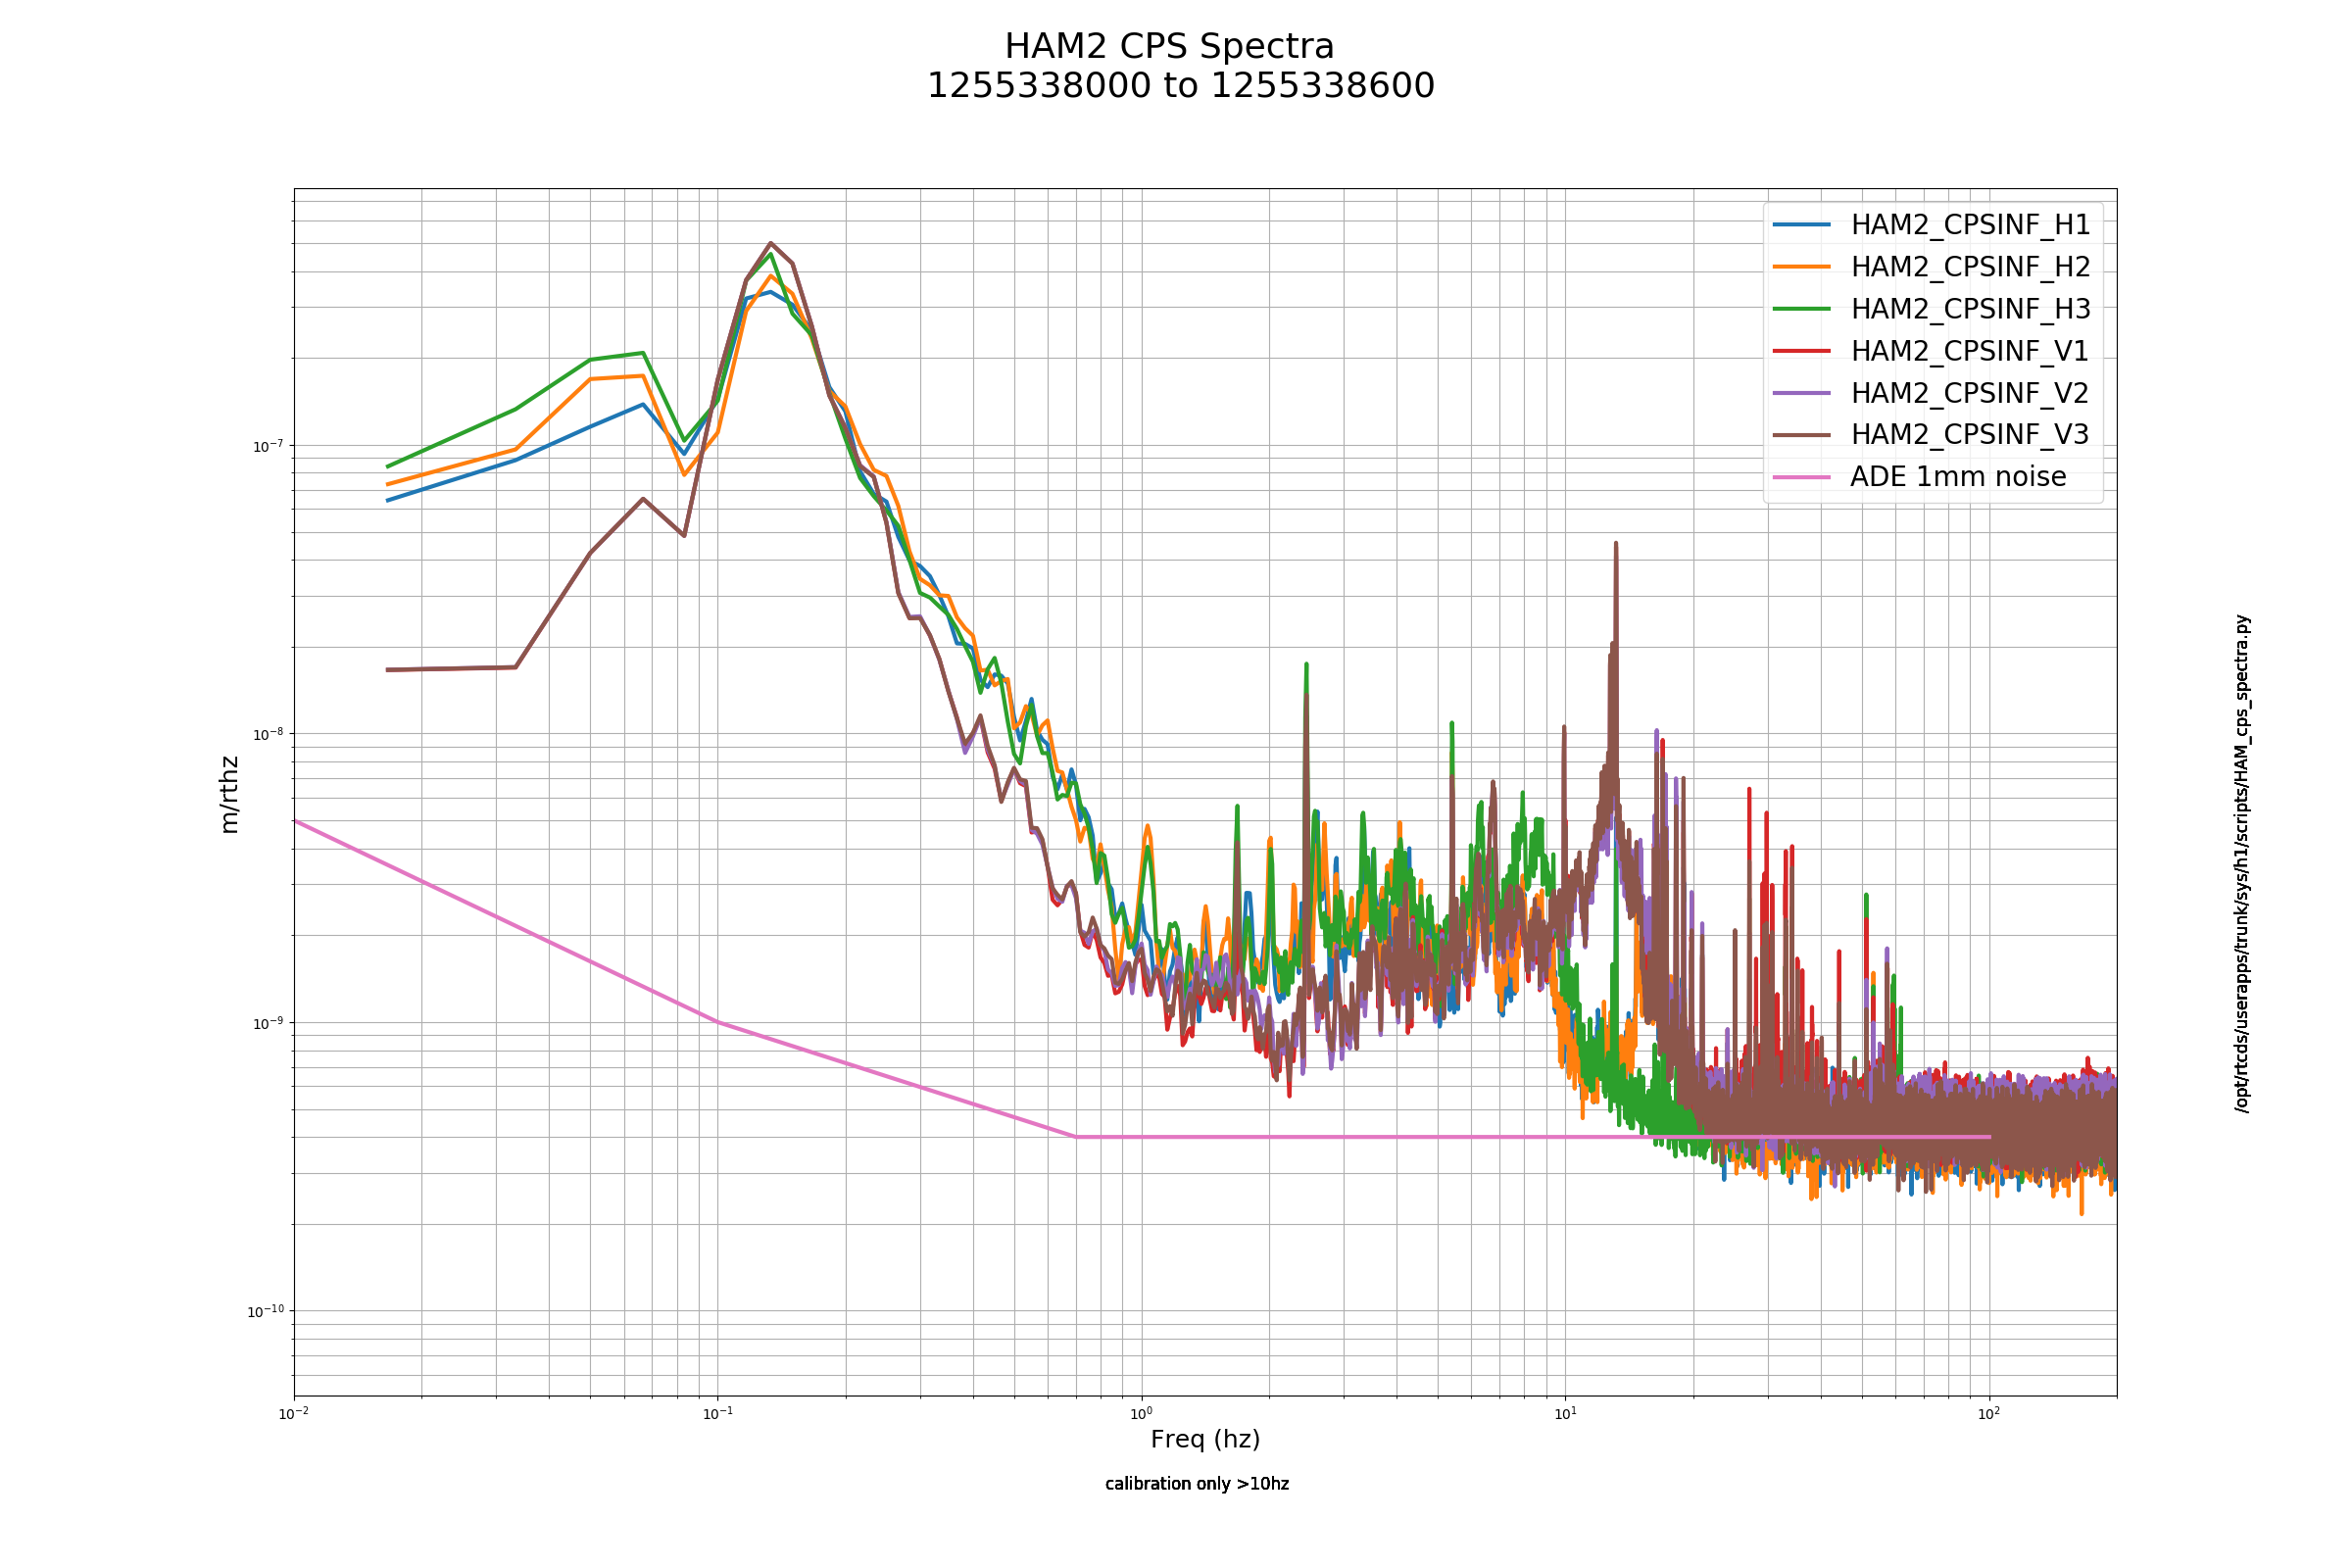
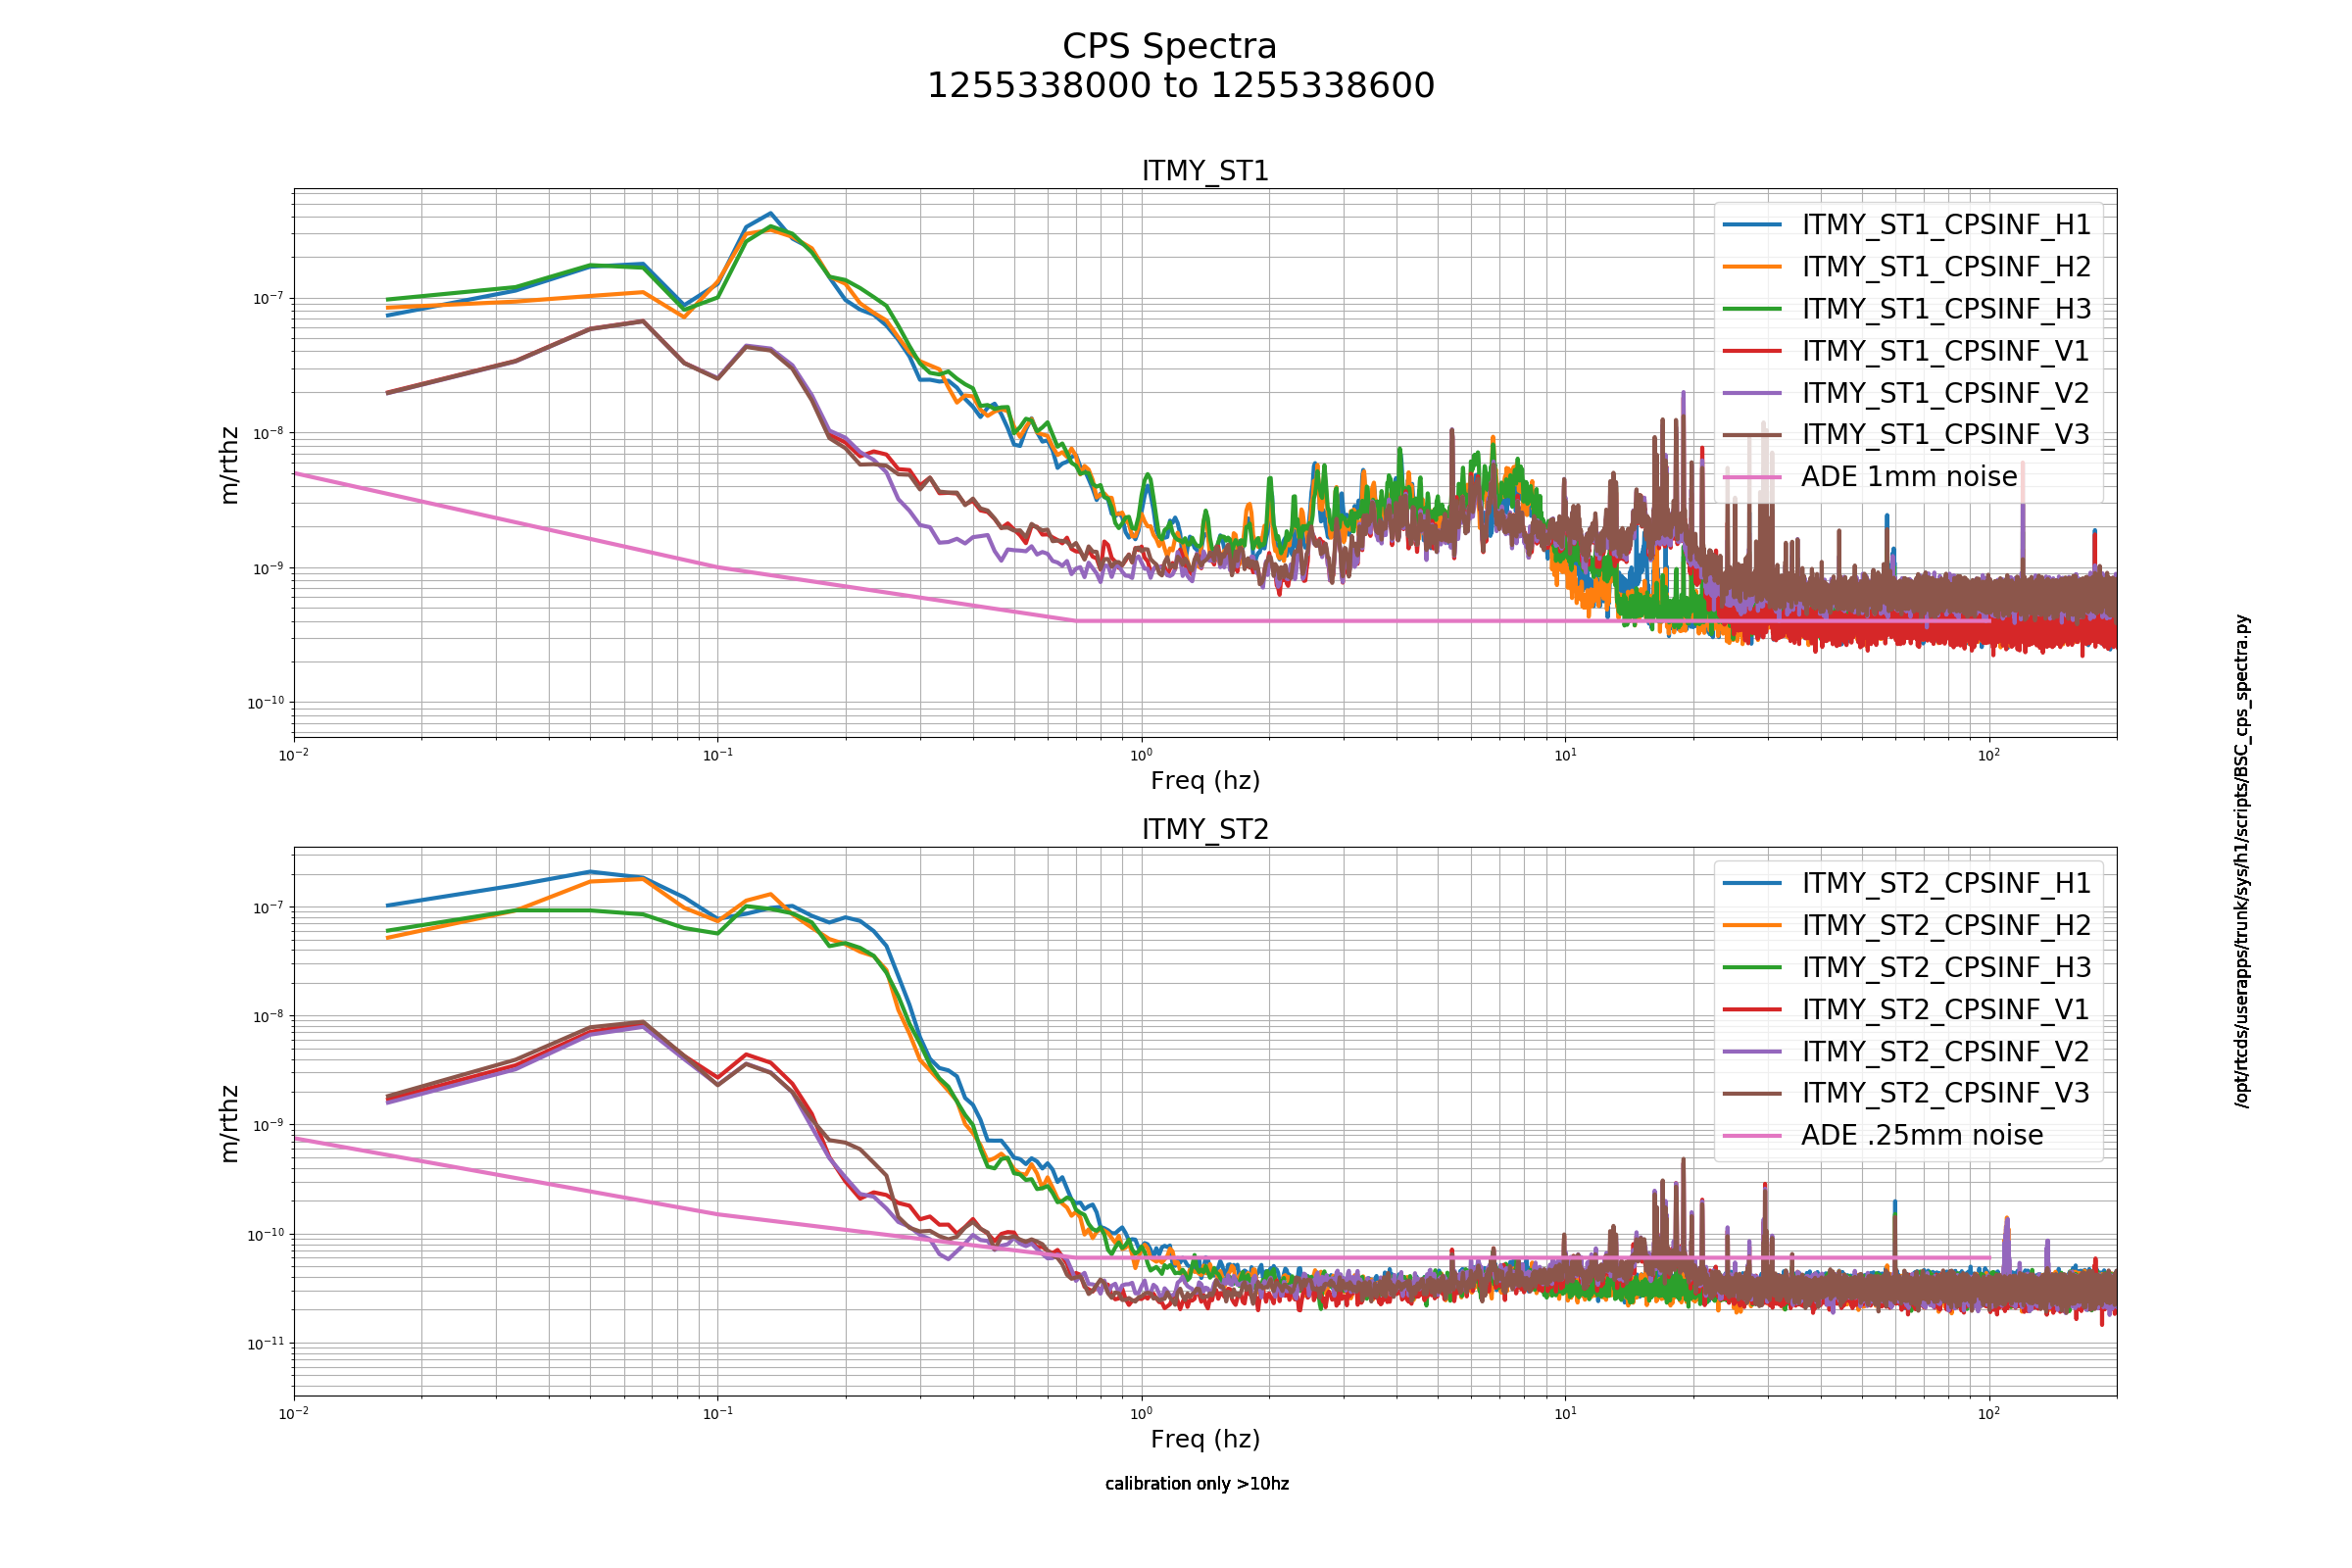
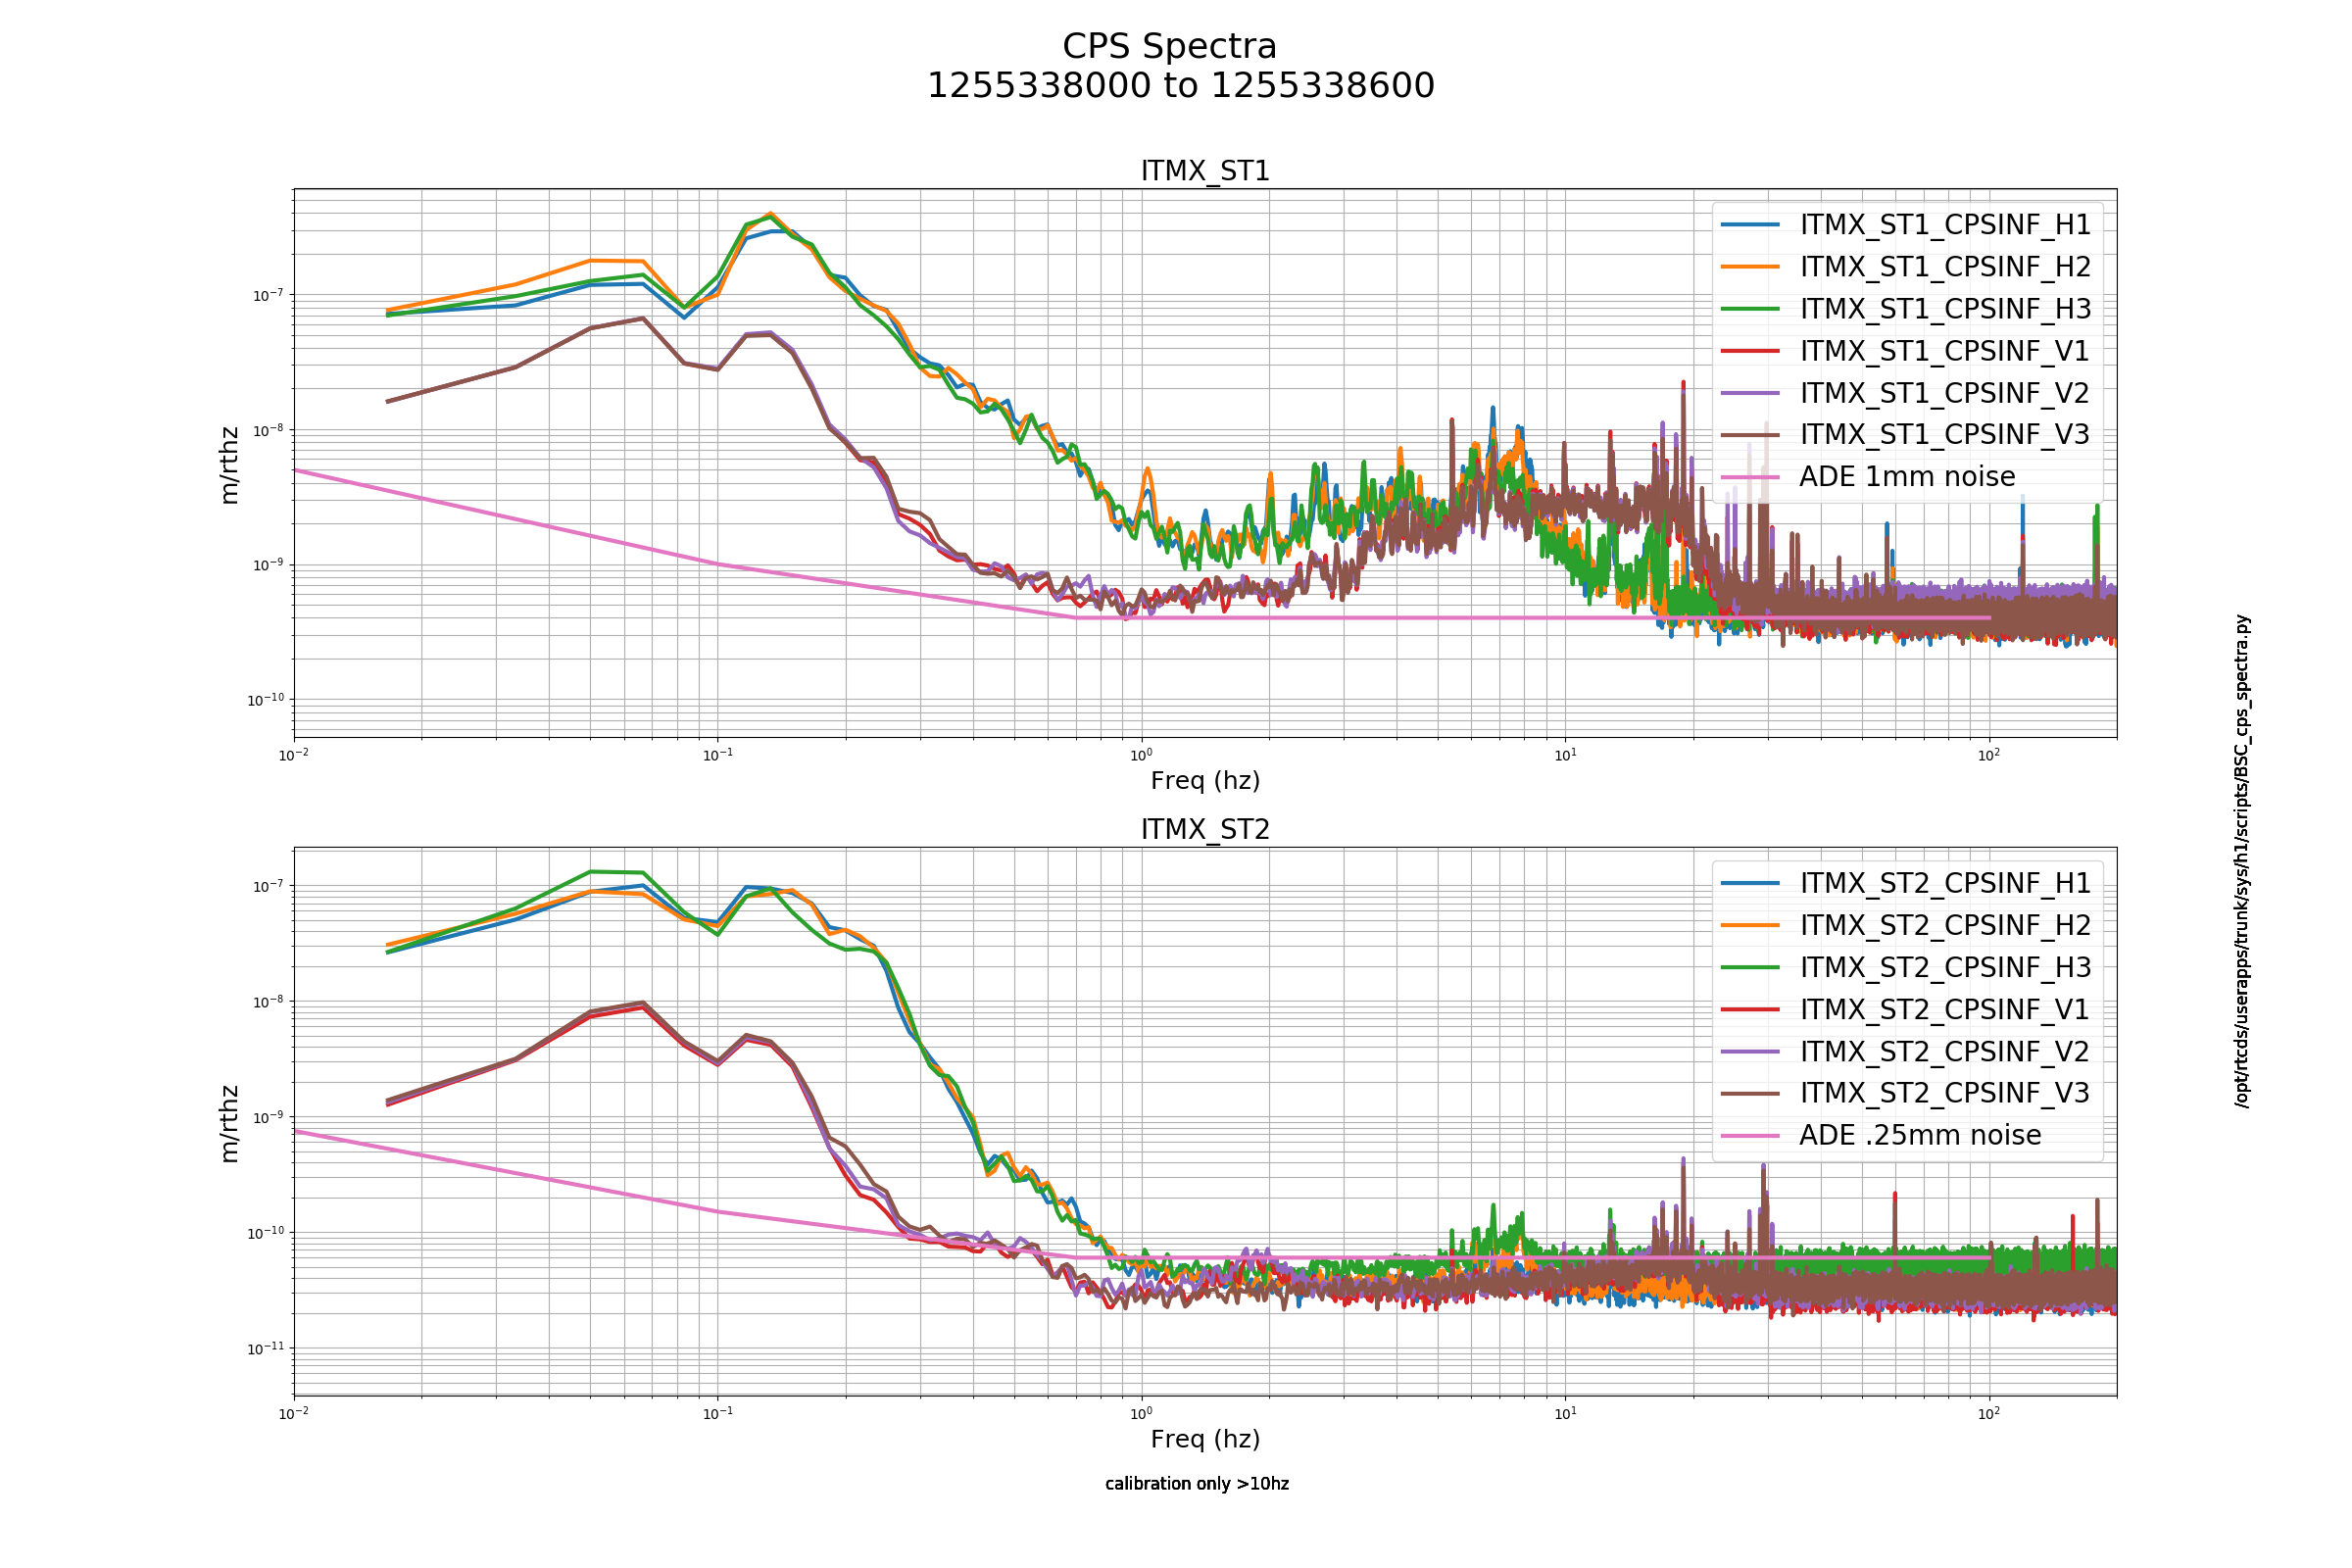
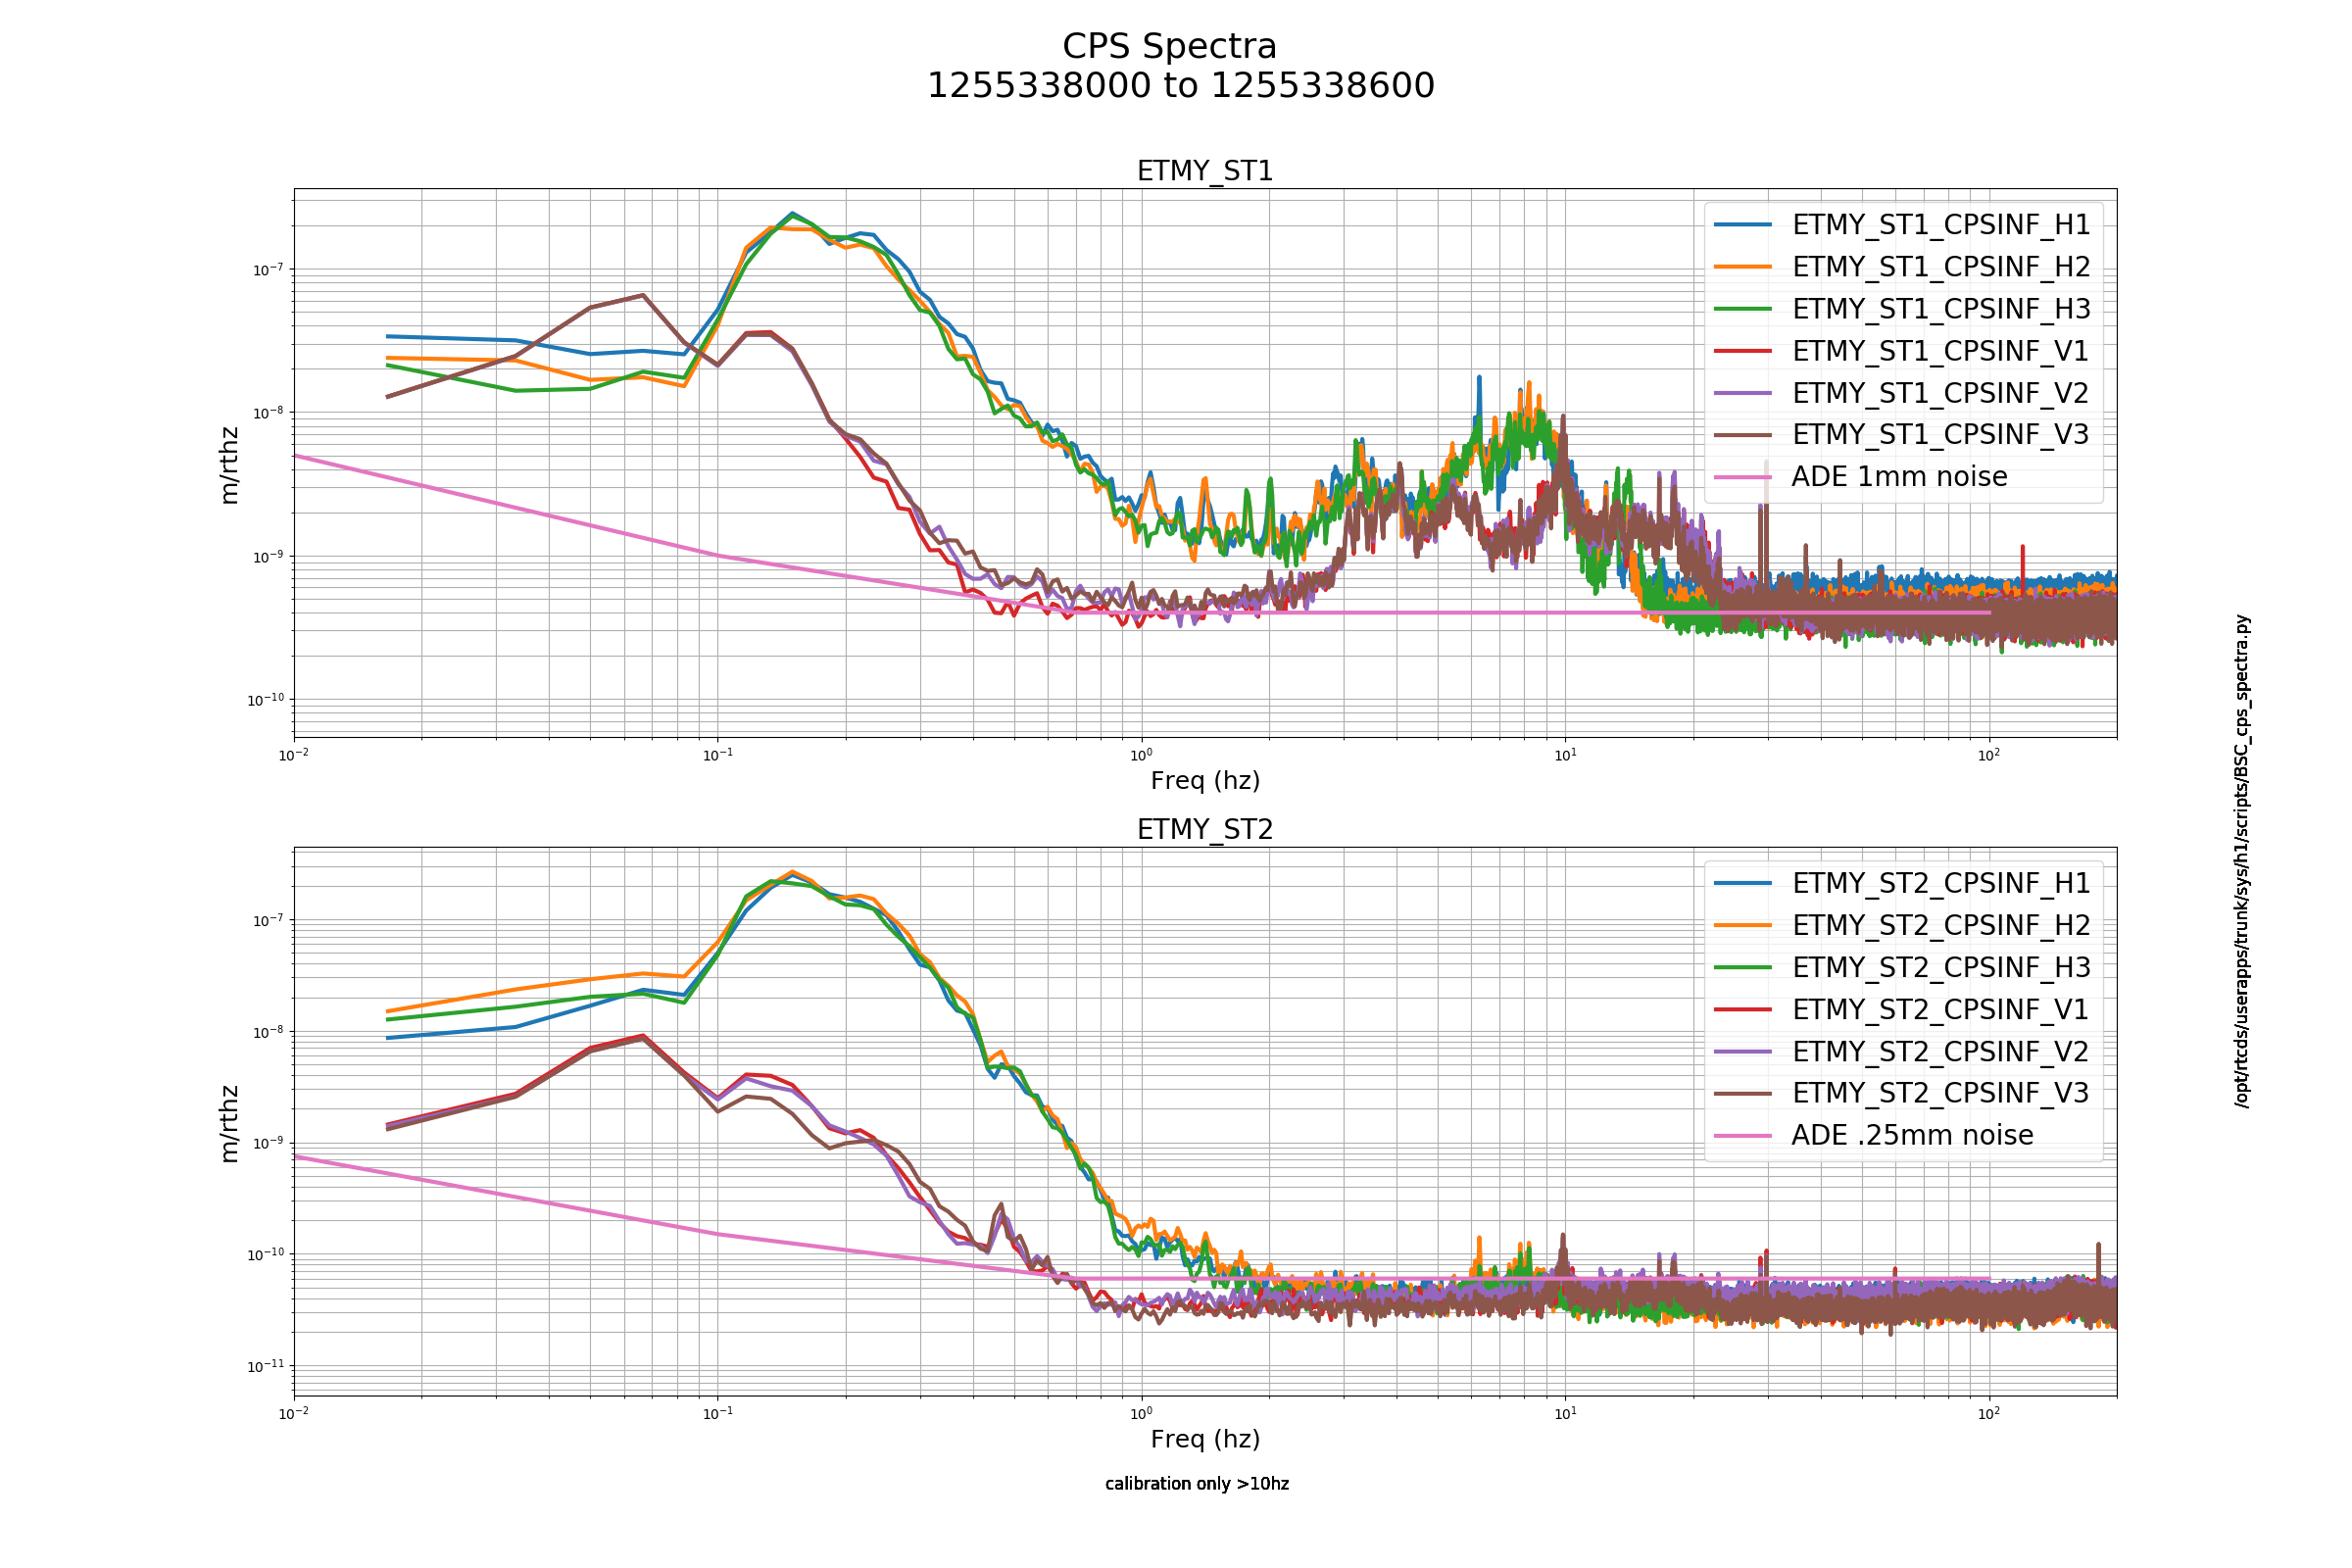
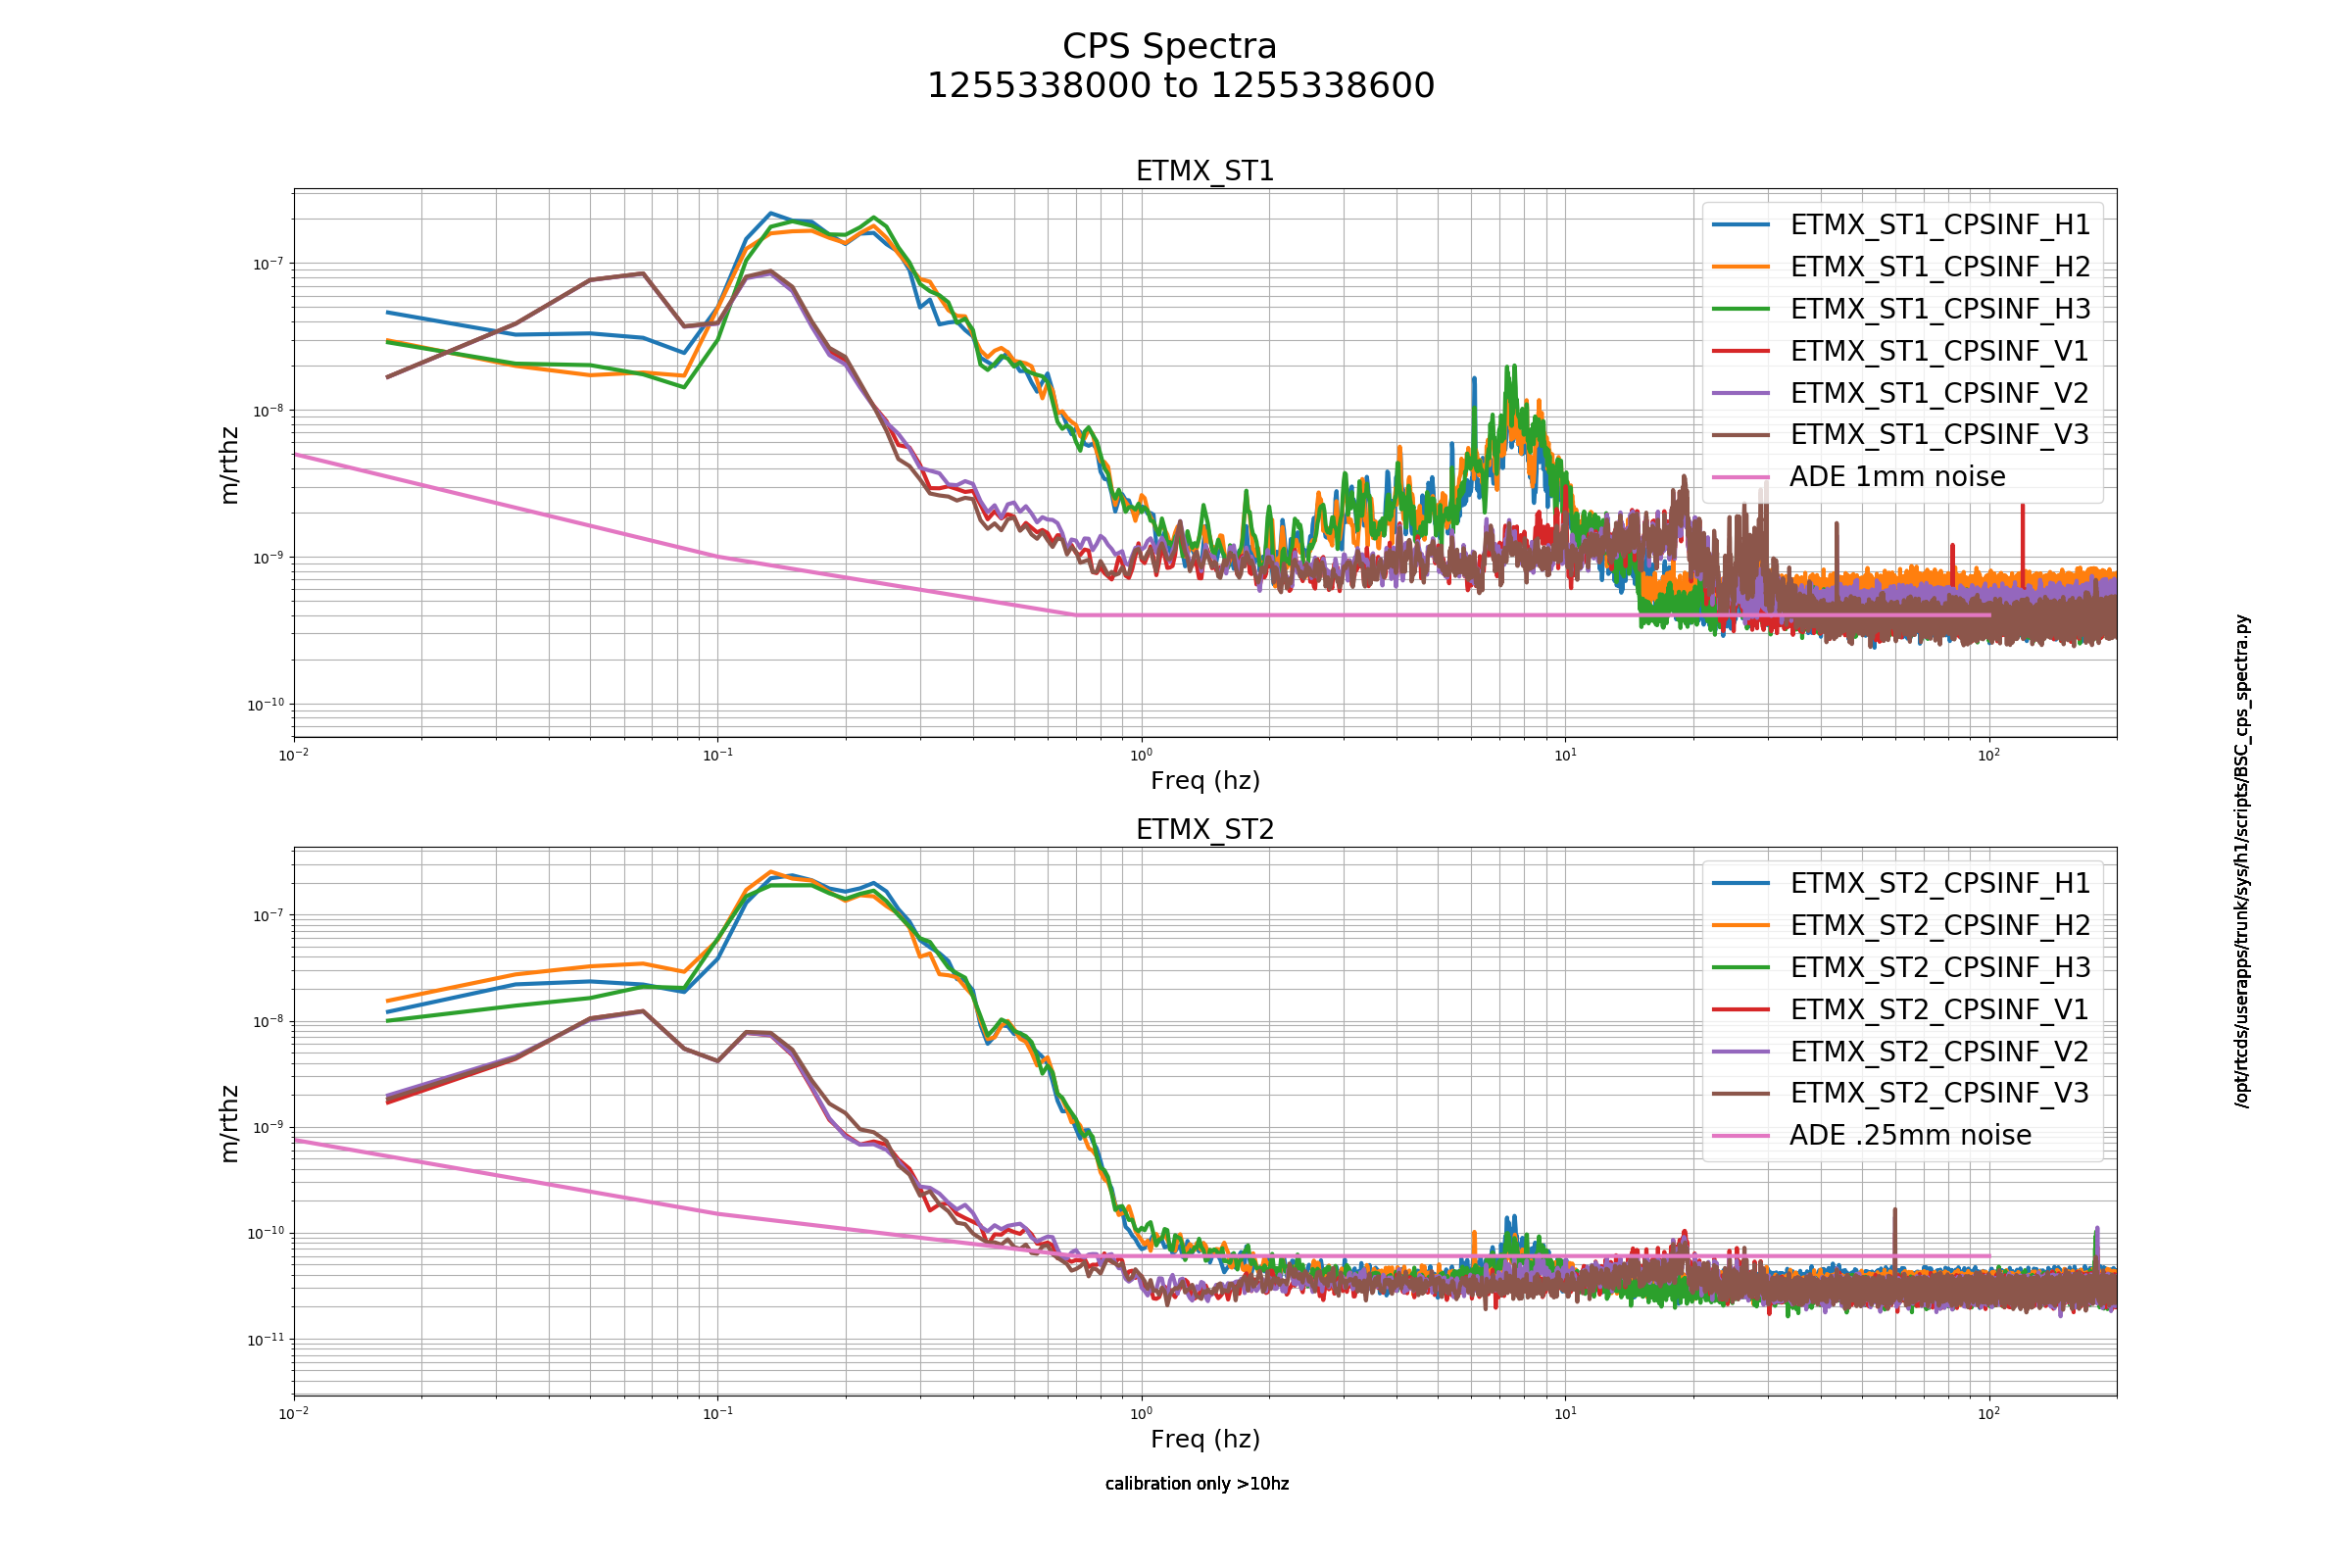
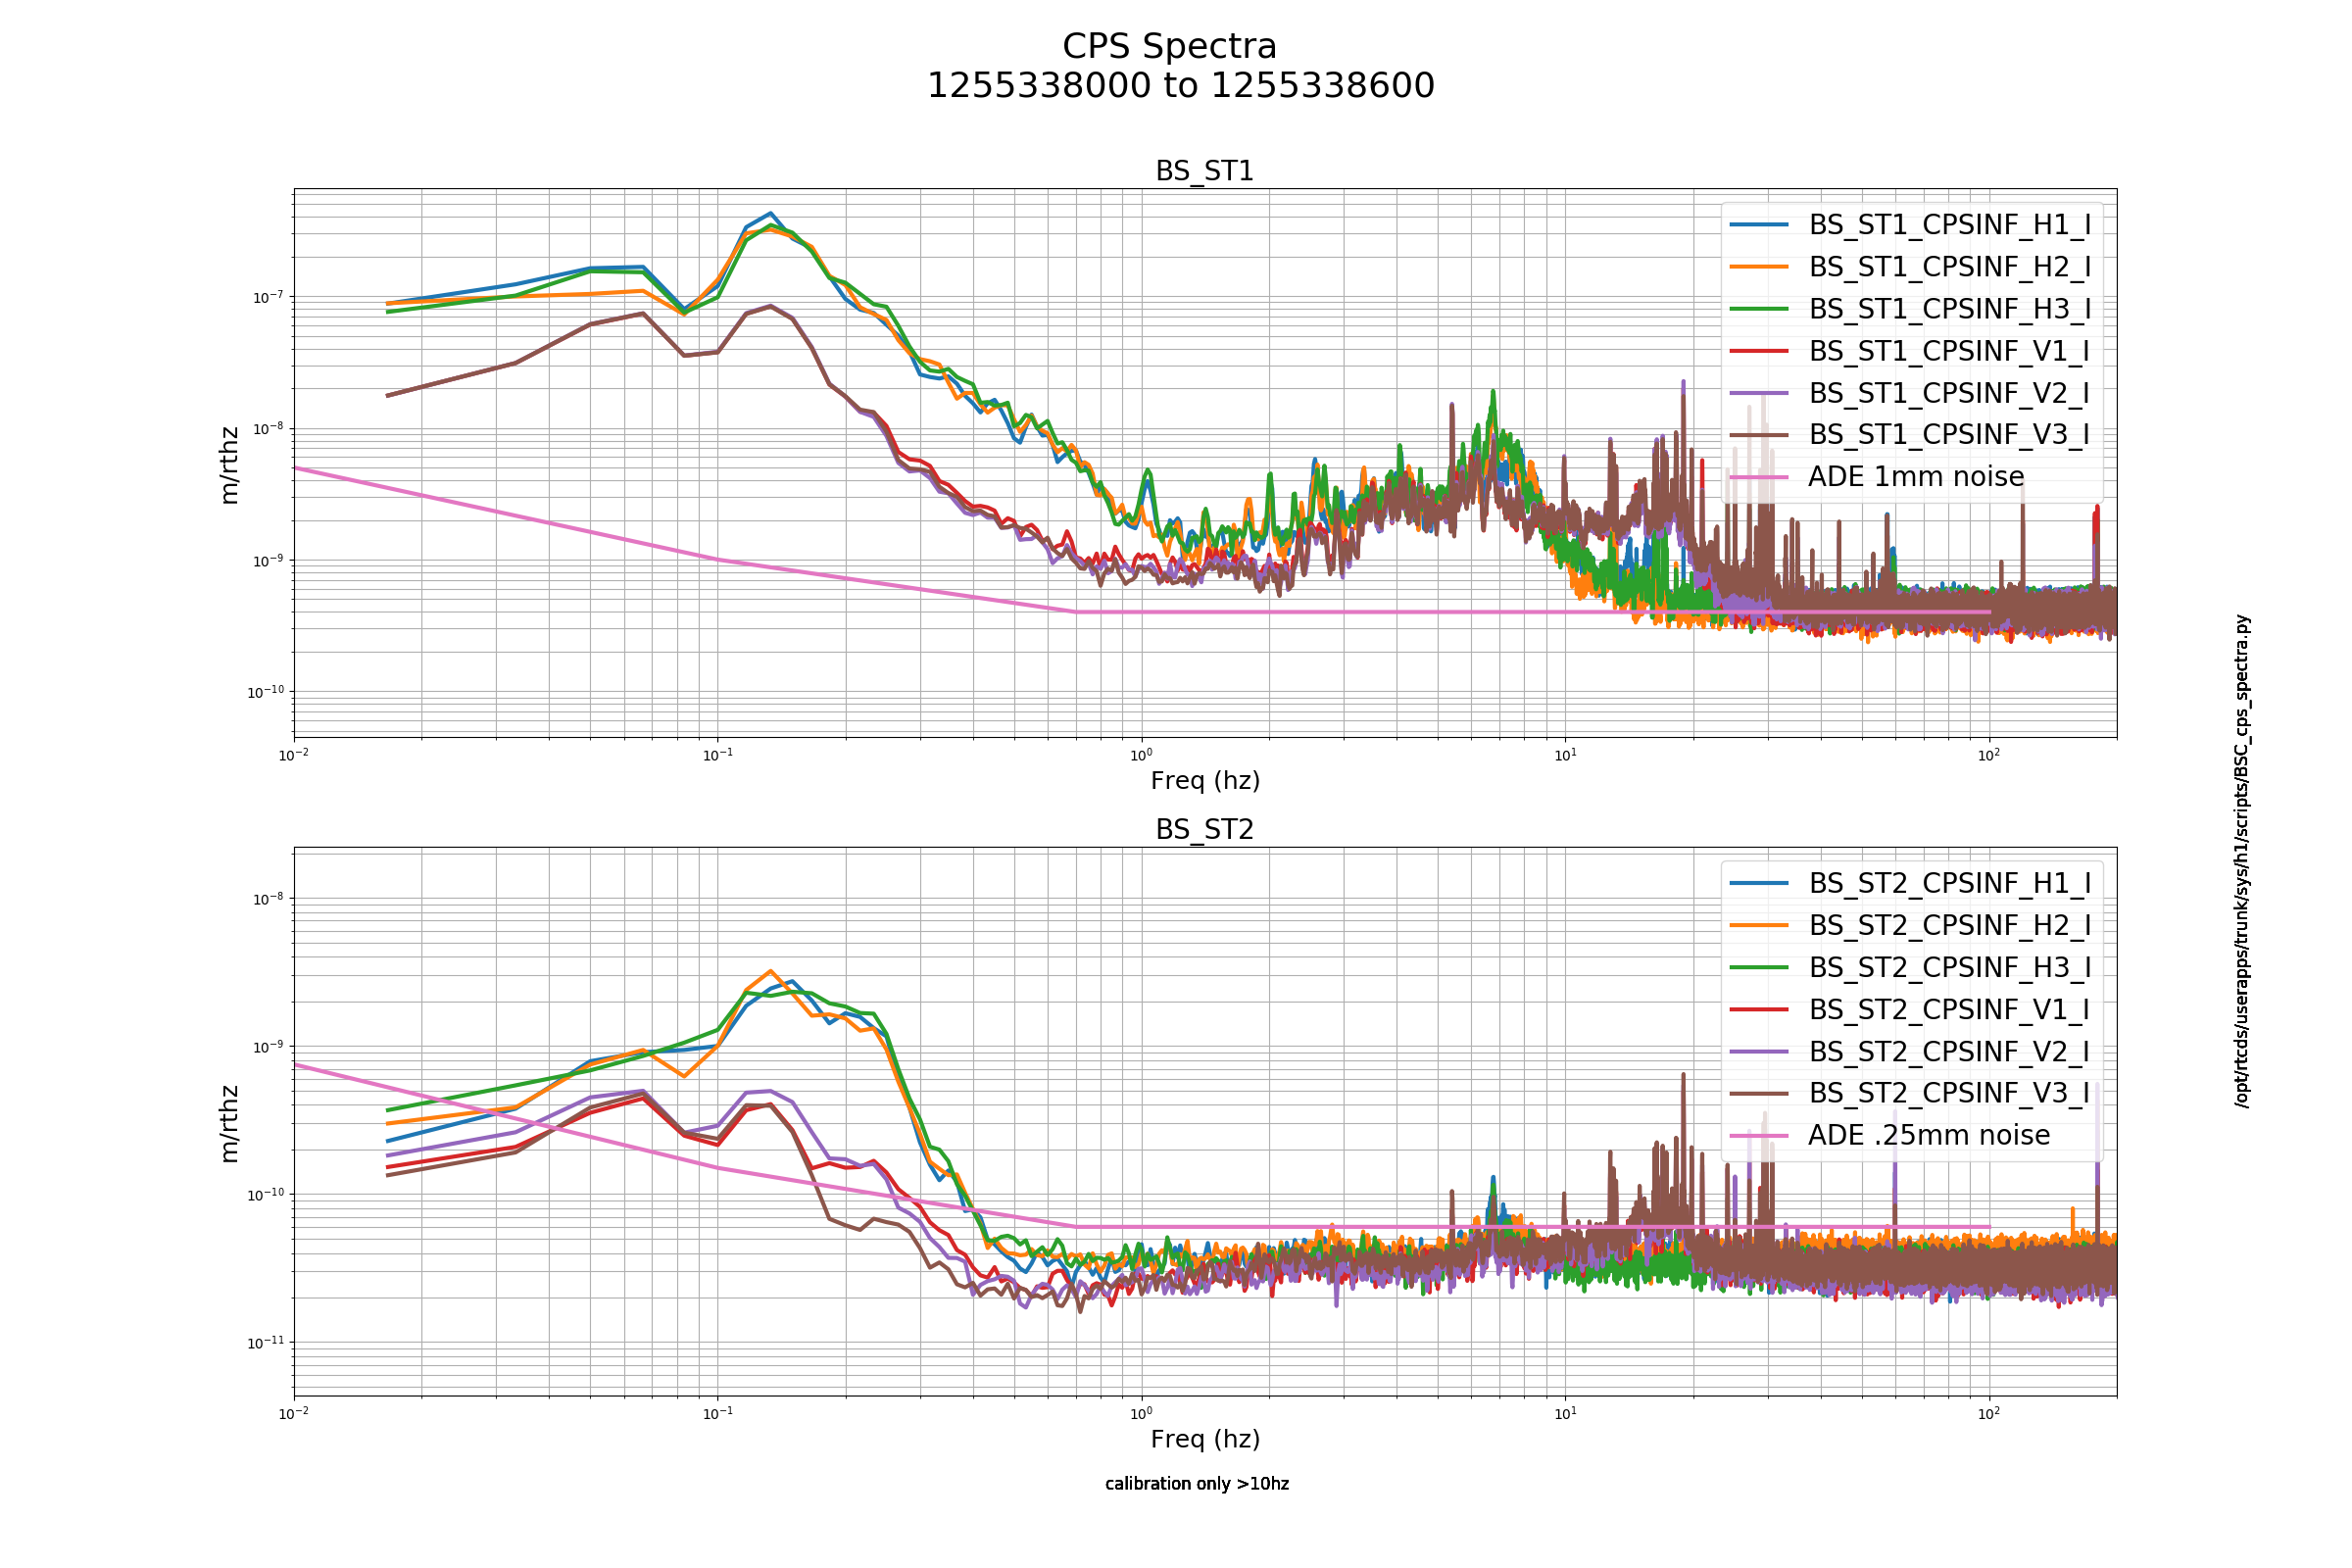
Attached are the ISI CPS BSC and HAM noise spectra.
Laser Status:
Front End Power is 32.6W (should be around 30 W)
70W Output Power is 69.76W
Front End Watch is GREEN
70W Watch is GREEN
PMC:
It has been locked 1 days, 21 hr 50 minutes (should be days/weeks)
Reflected power = 11.36Watts
Transmitted power = 53.0Watts
PowerSum = 64.36Watts.
FSS:
It has been locked for 0 days 0 hr and 29 min (should be days/weeks)
TPD[V] = 5.348V (min 0.9V)
ISS:
The diffracted power is around 2.2%
Last saturation event was 1 days 15 hours and 12 minutes ago (should be days/weeks)
Possible Issues: Given the post-vent recovery work, things look good.
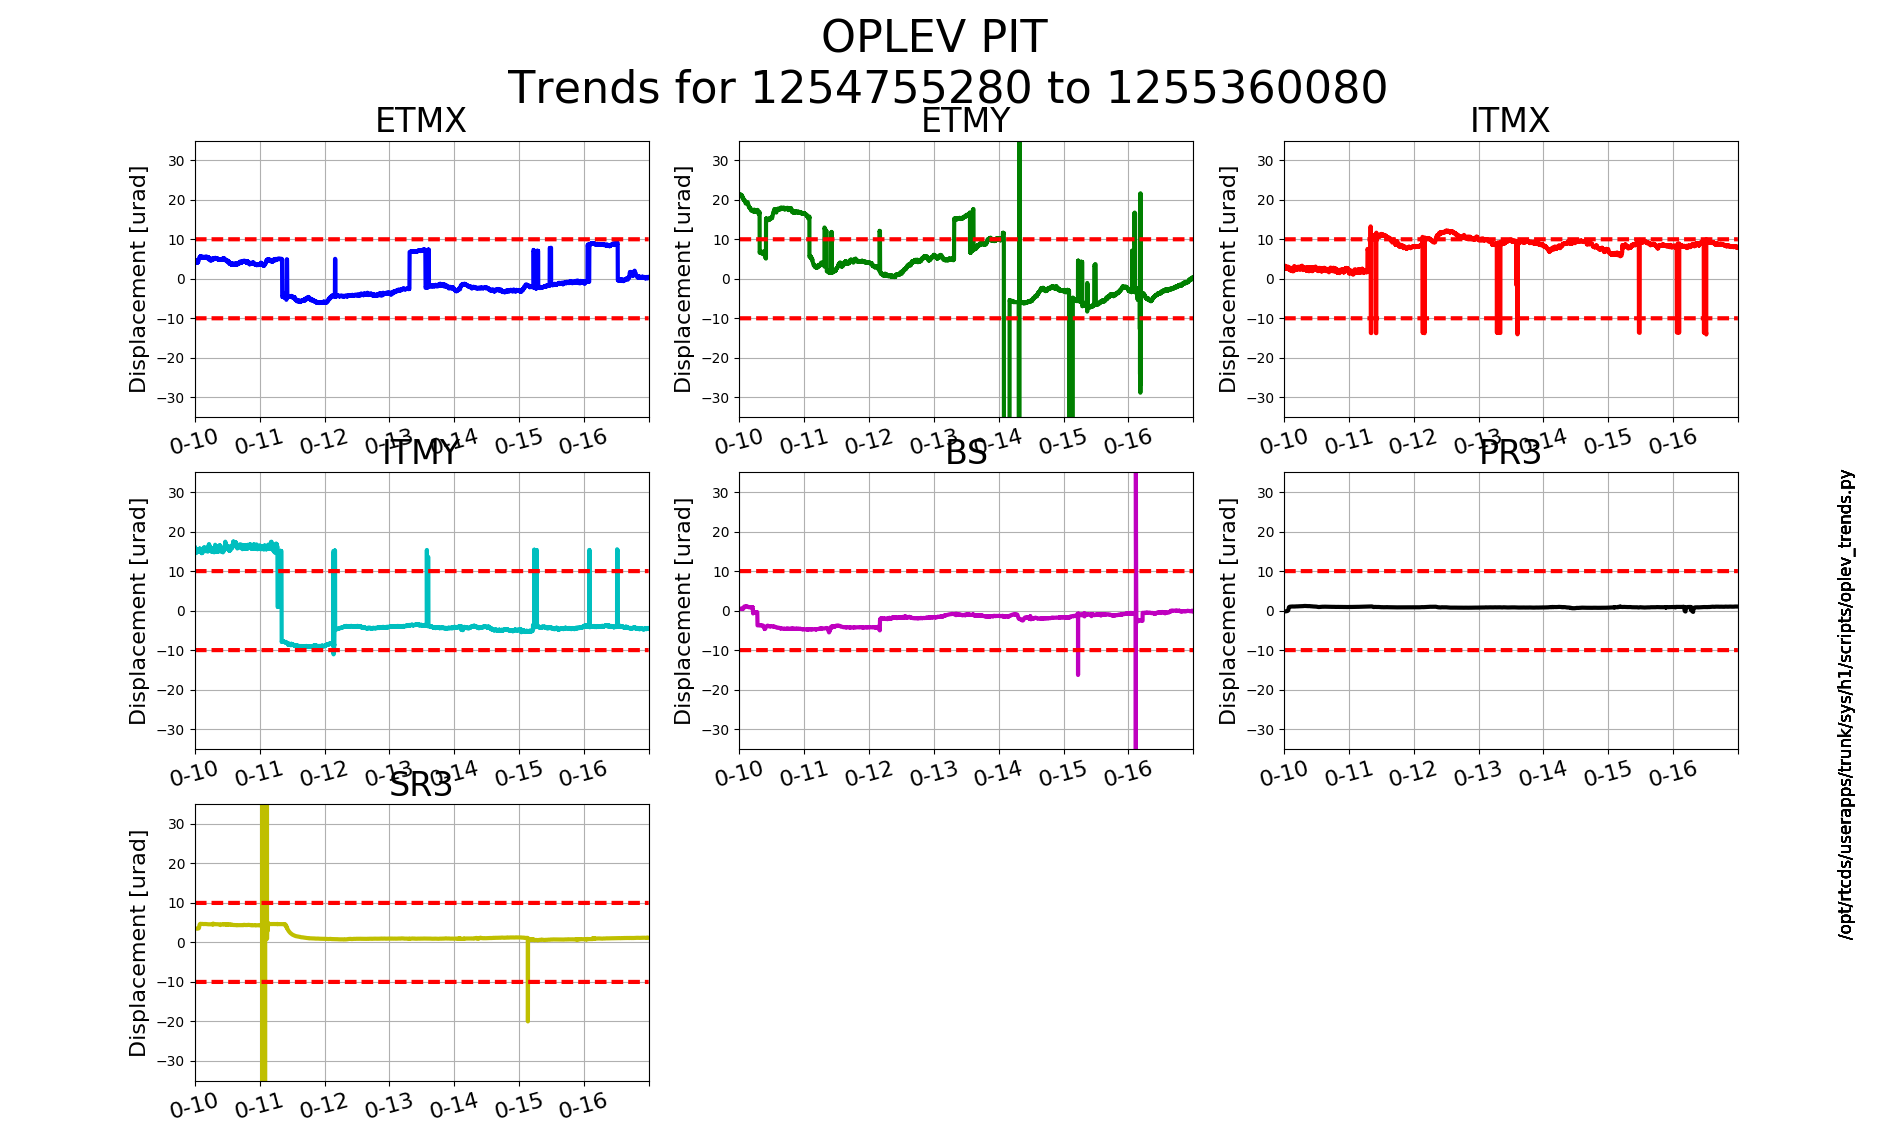
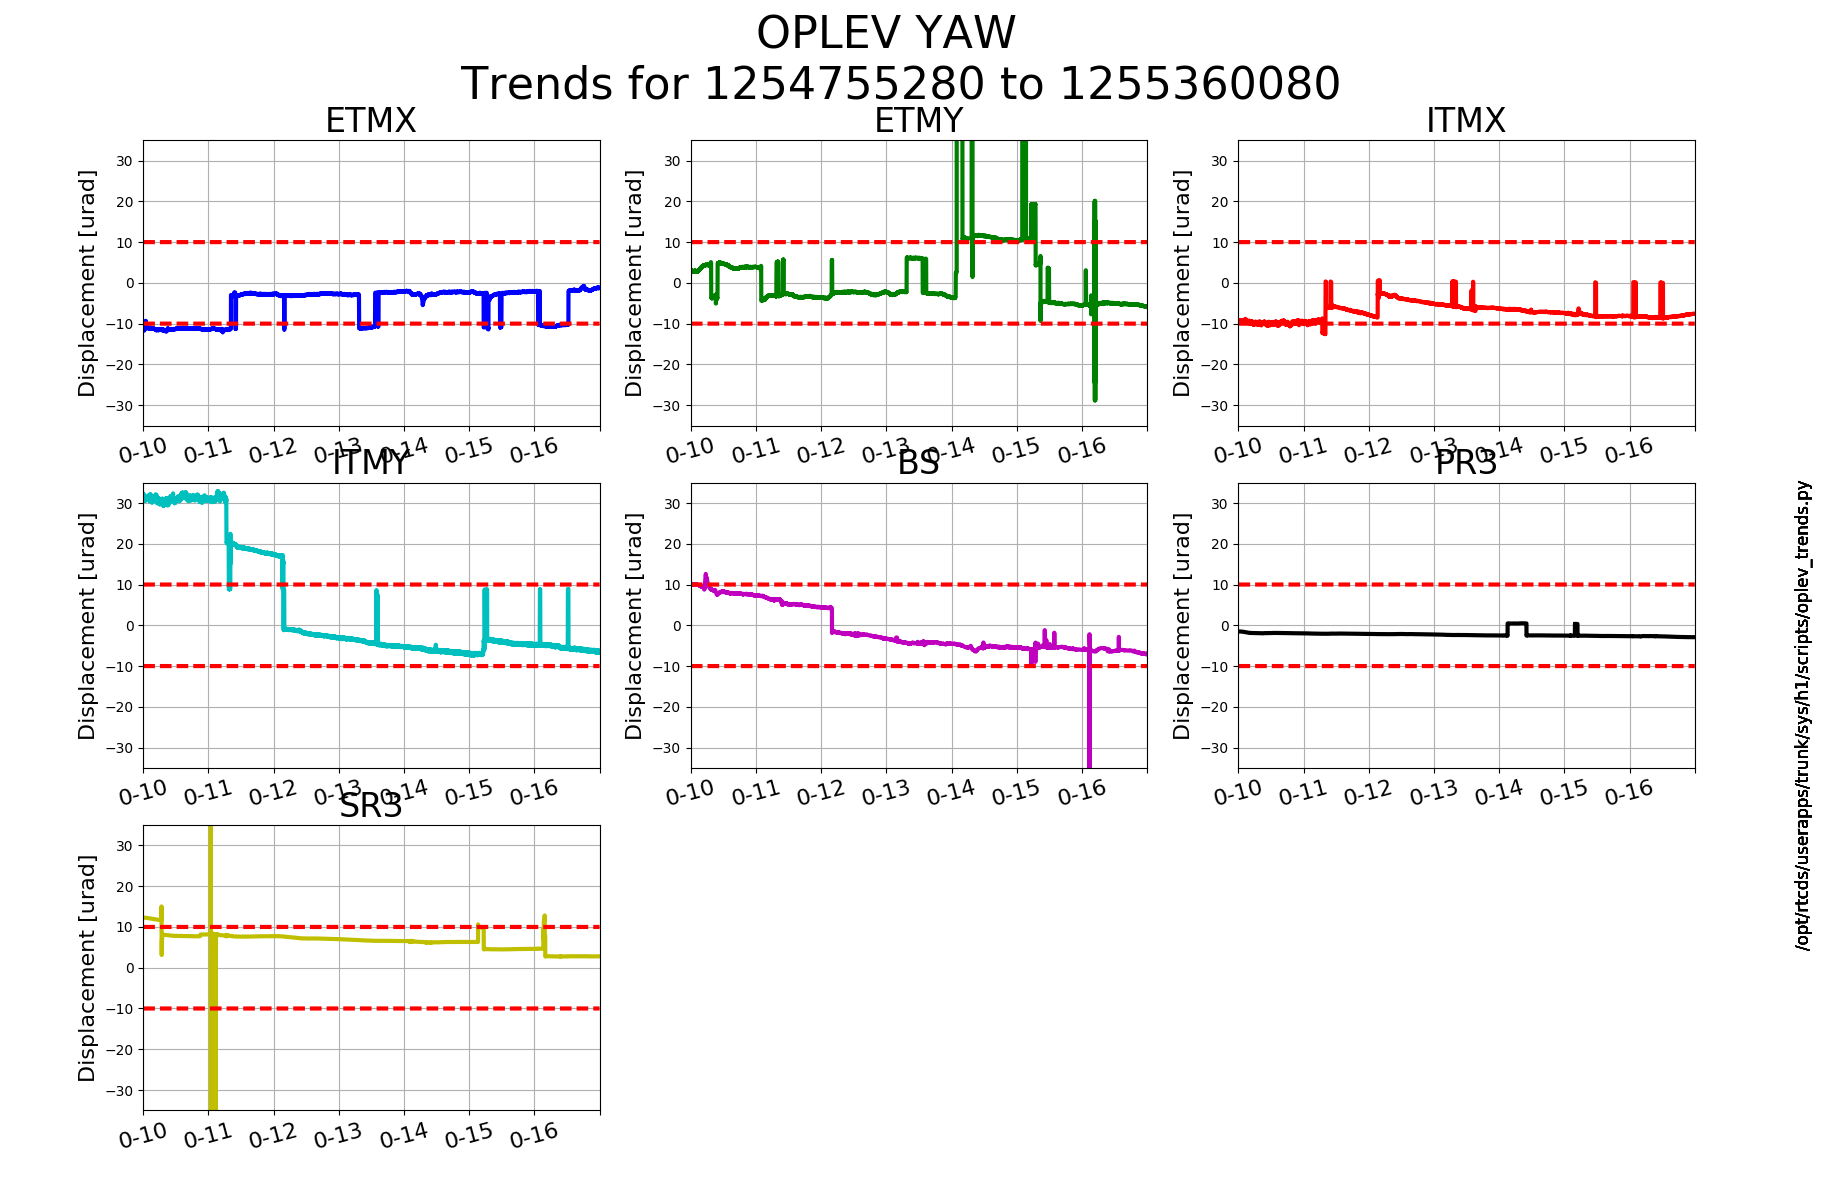
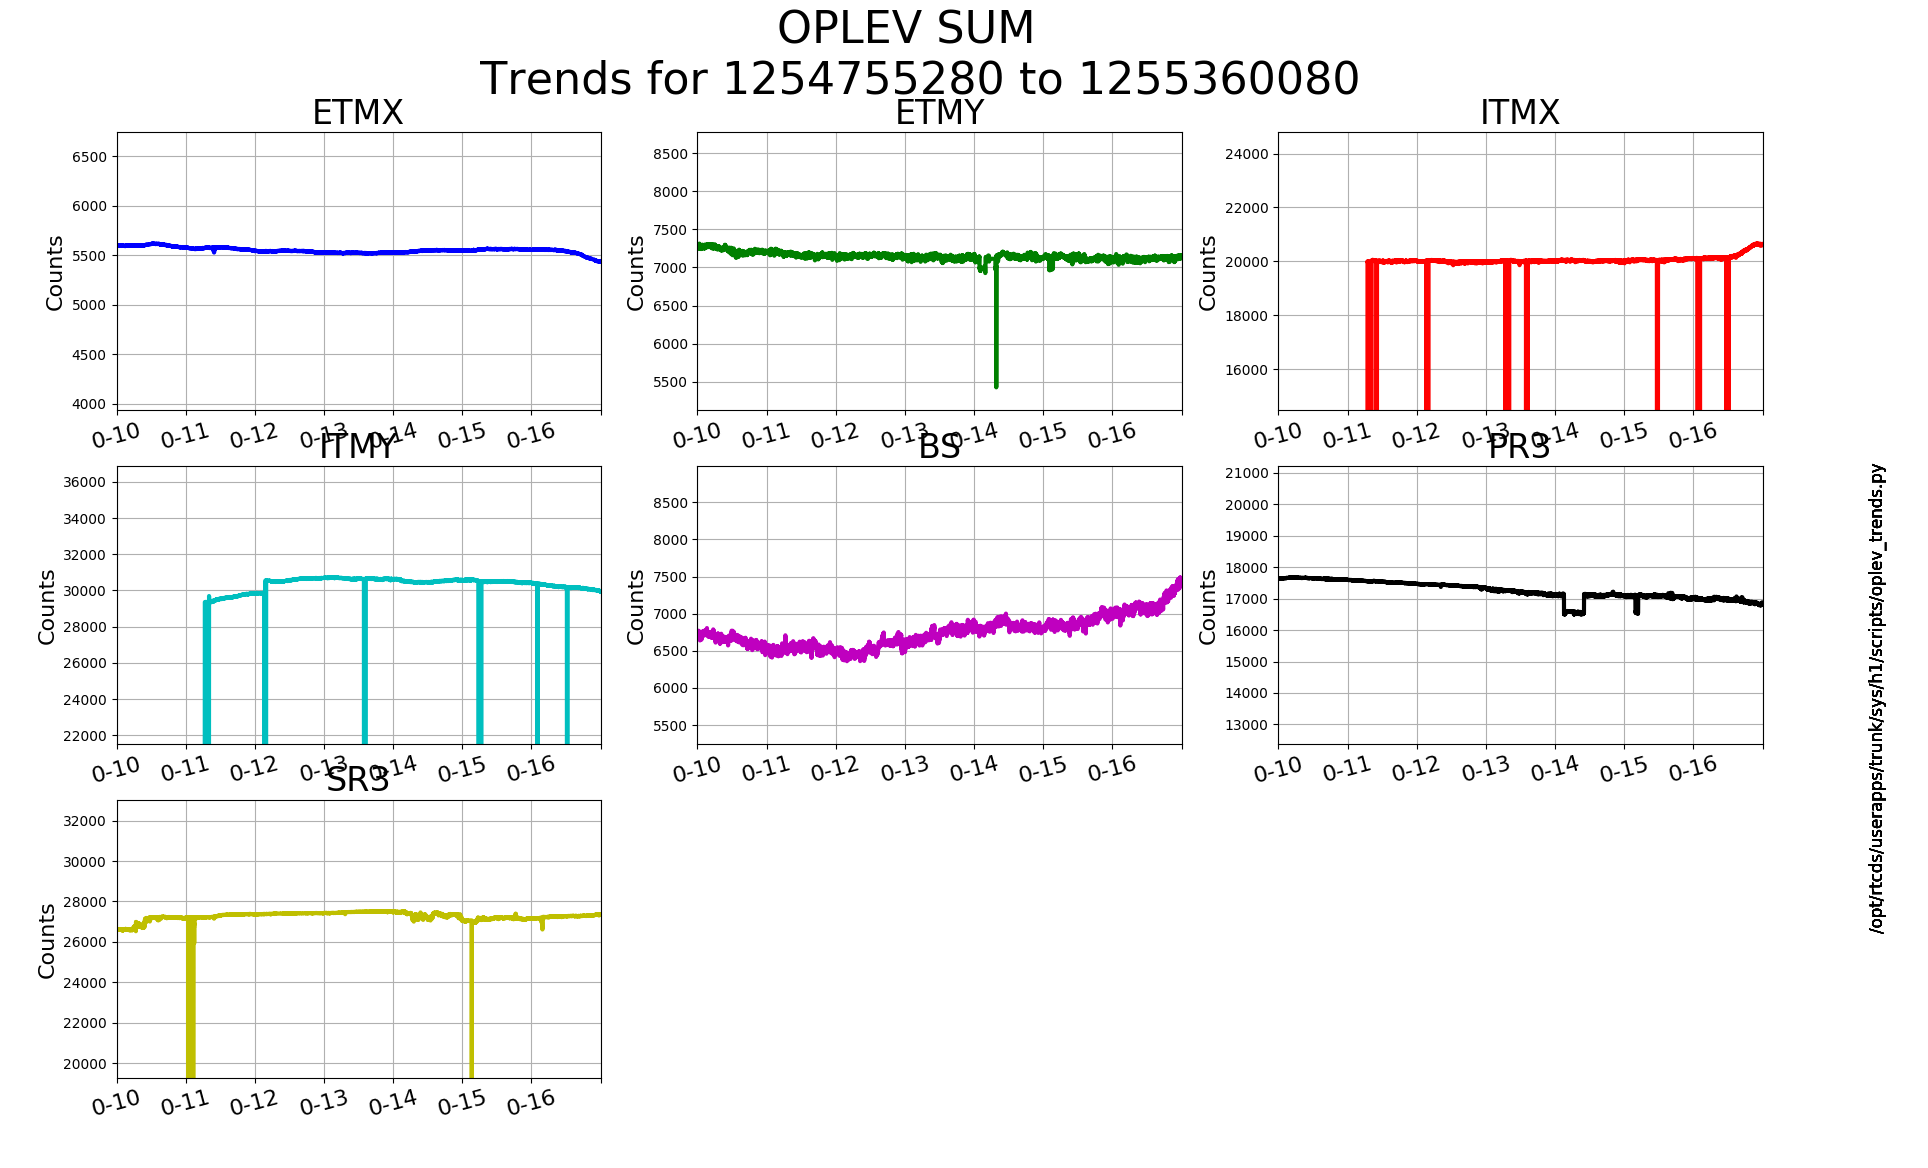
Attached are the plots for the 7 day OpLev trends. There are spikes for ETMY and the BS in pitch and spikes in ITMY, SR3, ETMY, and BS Yaw. Given the post-vent recovery work going on these may not be that informative. Closing FAMIS #11239
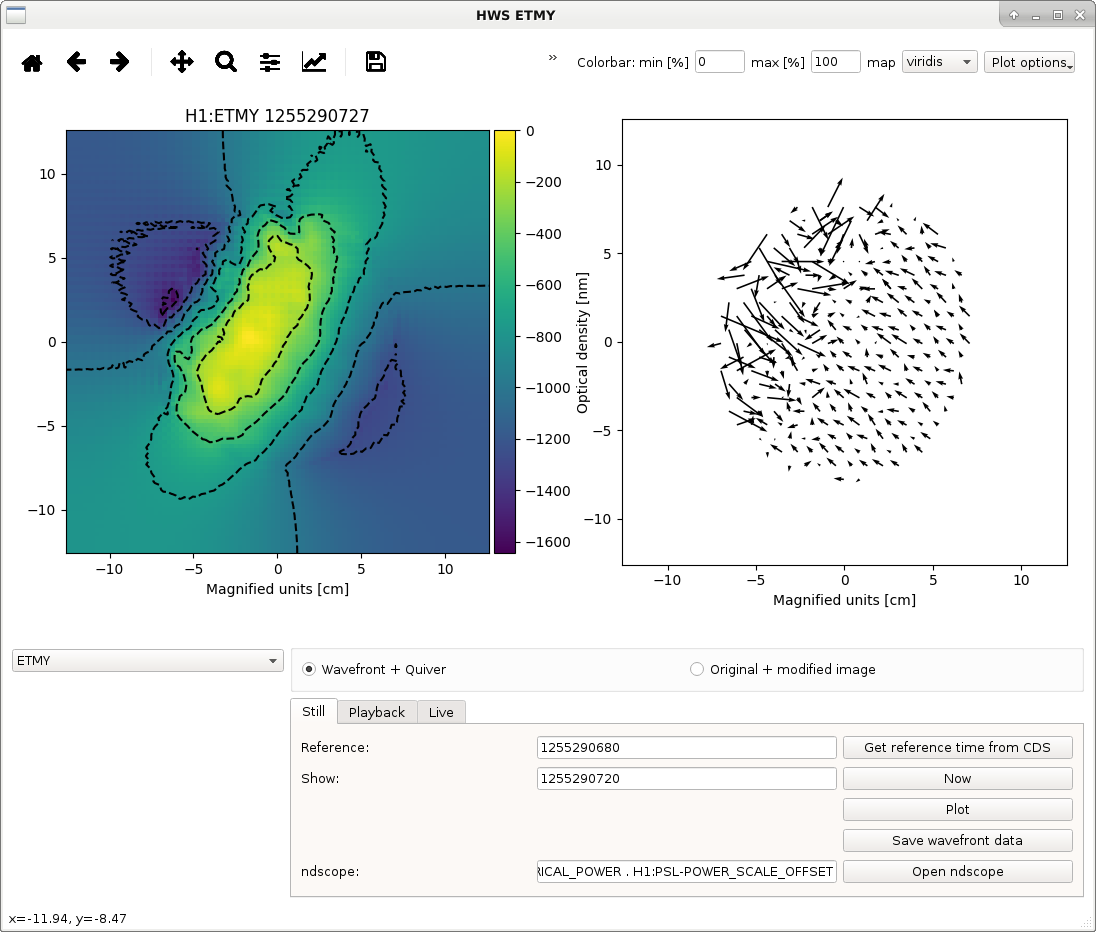
Here is the ETMY HWS wavefront during the YAW oscillation - when the ETMY was yawing at 5mHz with an amplitude of approximately 30urad.
The wavefront a lot of noise in the top left hand corner and there is also equal amounts of pitching and yawing registered on the HWS.

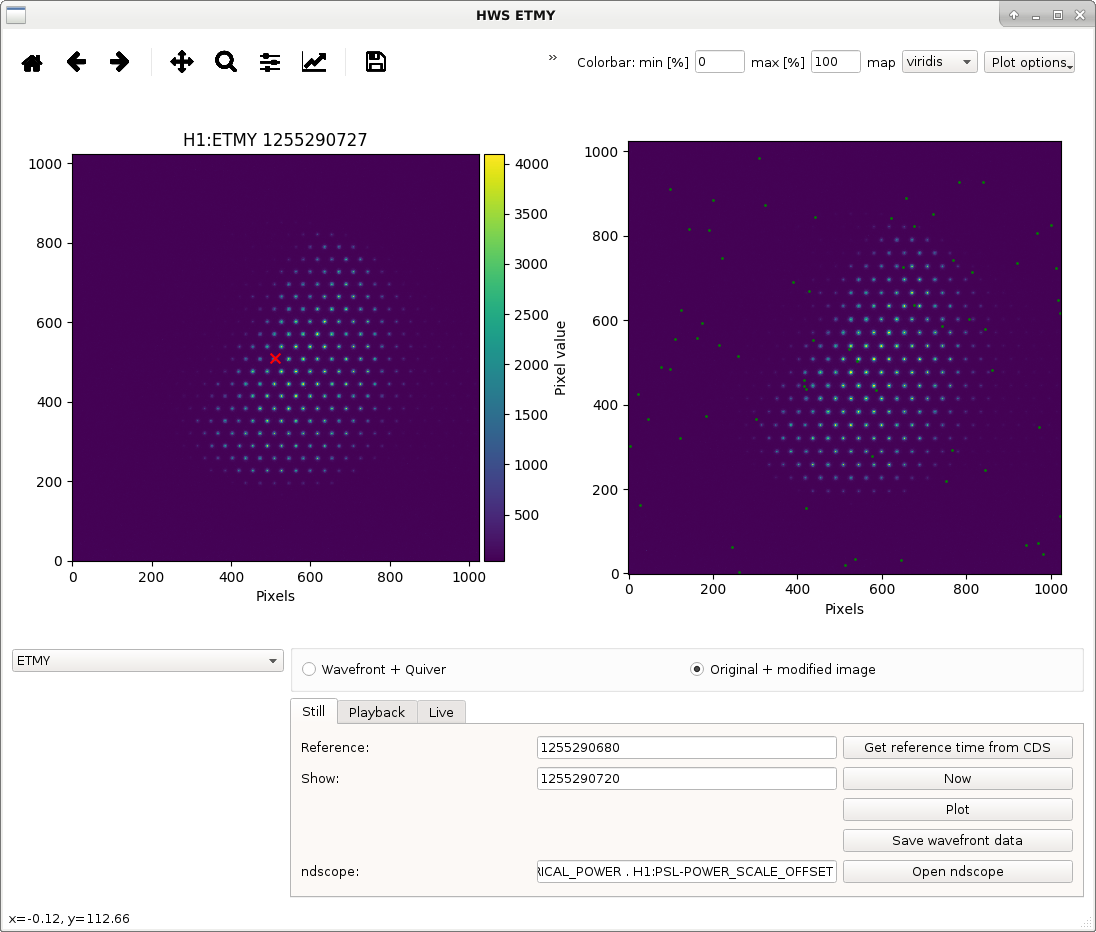
Looking at the raw data on the camera, we can see that the top left corner is cut off in the measurement.

Cao, Dan
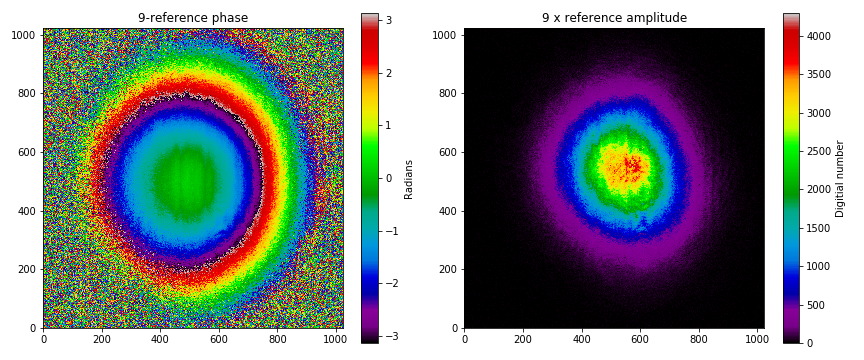
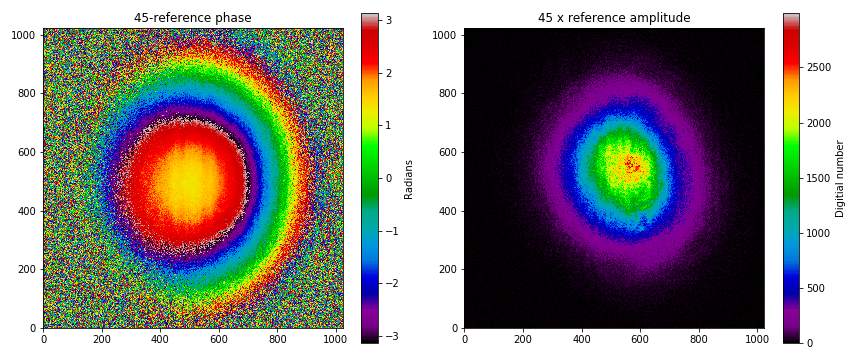
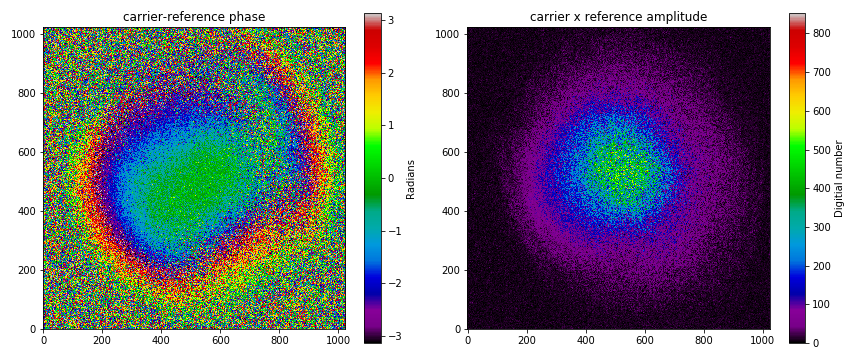
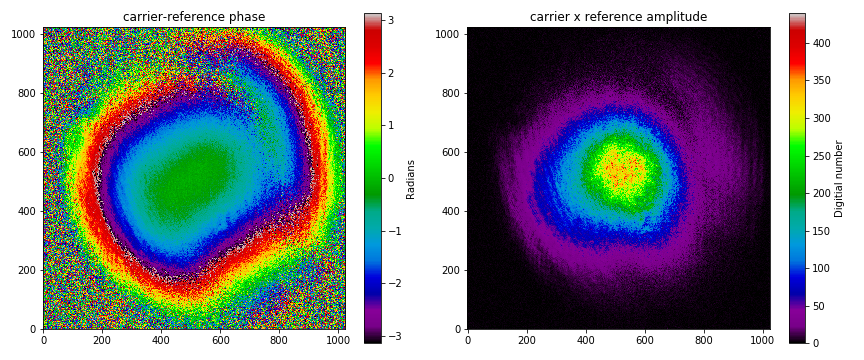
One of the useful features of a phase camera is its ability to selectively image different frequency components in an optical field. So today we worked on getting the phase camera hardware+software imaging the carrier, 9, and 45 MHz sidebands. Attached are single shots of each as an example of what the phase camera can output.
From the 9 and 45 images we have a clean round wavefront and both are looking reasonably gaussian in amplitude, as they are both resonant in DRMI. The carrier however is anti-resonant so there's worse SNR and the beam is not as clean. Averaging over 30 shots we can bring out some more detail and we can clearly see the beam has some higher order mode content relative to the sidebands. You'll notice in the 9 and 45 images that there are some broad vertical line features, this is an artifact of the rolling shutter on the Andor Zyla camera we are using and they typically average out over multiple frames. The cause is from changes in amplitude or phase in the IFO or reference beams which vary as each column on CMOS sensor is read out.
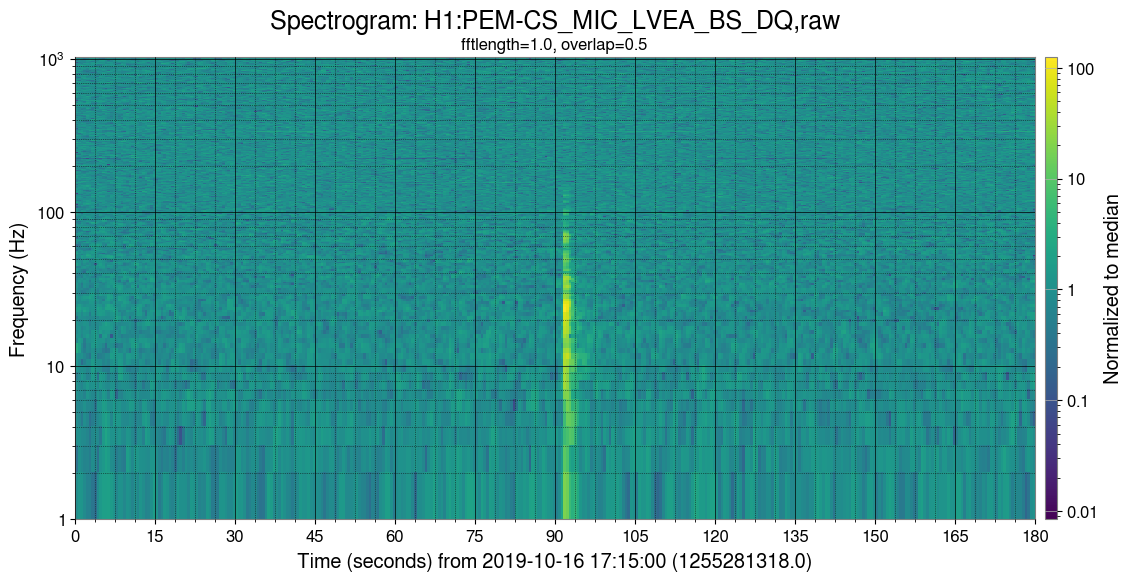
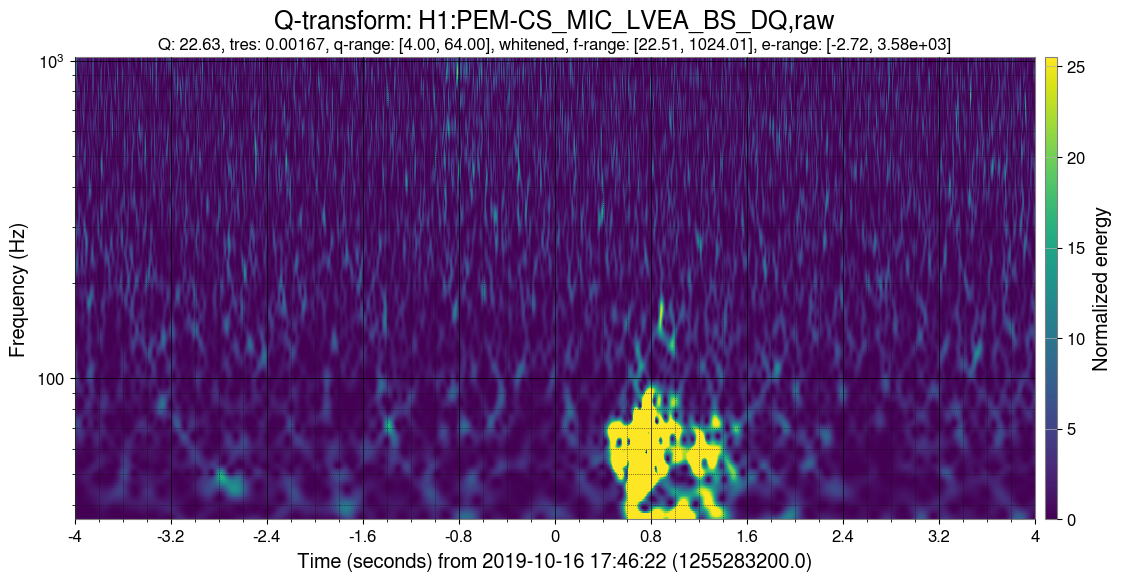
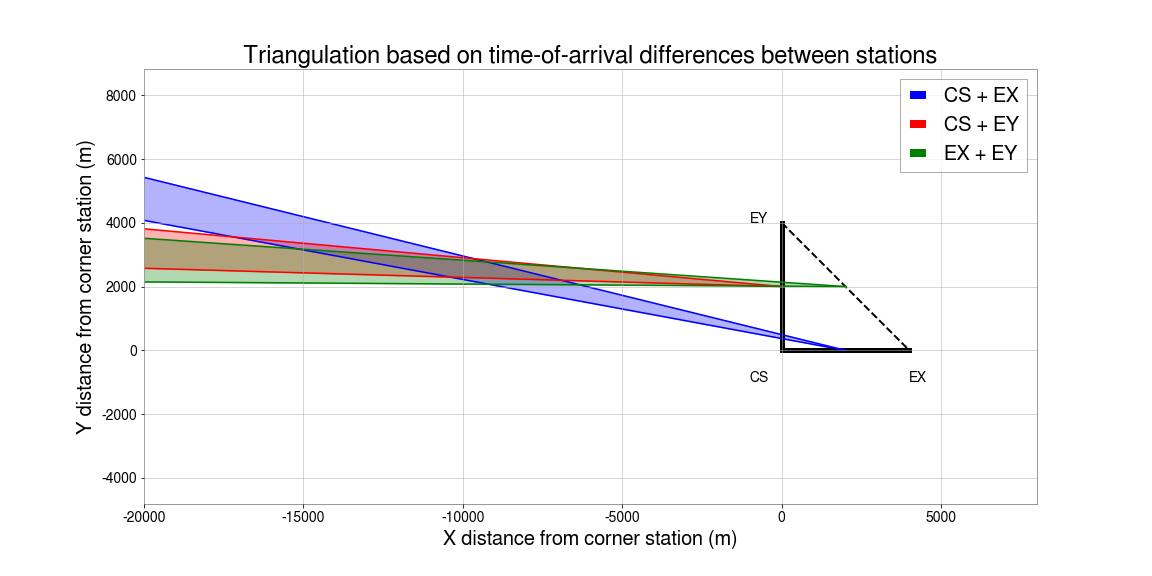
A few loud banging sounds were reported coming from a distance this morning (52509). The events are clearly observed by microphones at 10-50 Hz at every end station (example spectrogram and q-scan attached). They each reached EY first, then CS (0.7s later), then EX (12.2s later), consistent with some people on site reporting that they seemed to be coming from the south. Triangulation using the relative arrival time differences between stations shows that the source of these noises may have been some 8-12km in the minus X direction relative to the corner station. This is the area just northwest of Hammer training center. The last figure shows the triangulation, which is based on the three loud events reported in Corey's log (EY arrival times of 16:15:48.2, 17:16:31.4, and 17:46:22.0 UTC) and shows shaded regions accounting for 0.1s error in delta_t.
Adding a note to list how many blasts observed by eye using NDSCOPE to look at microphones at LVEA & end stations. Oddly they occur close to every 30min during this period.
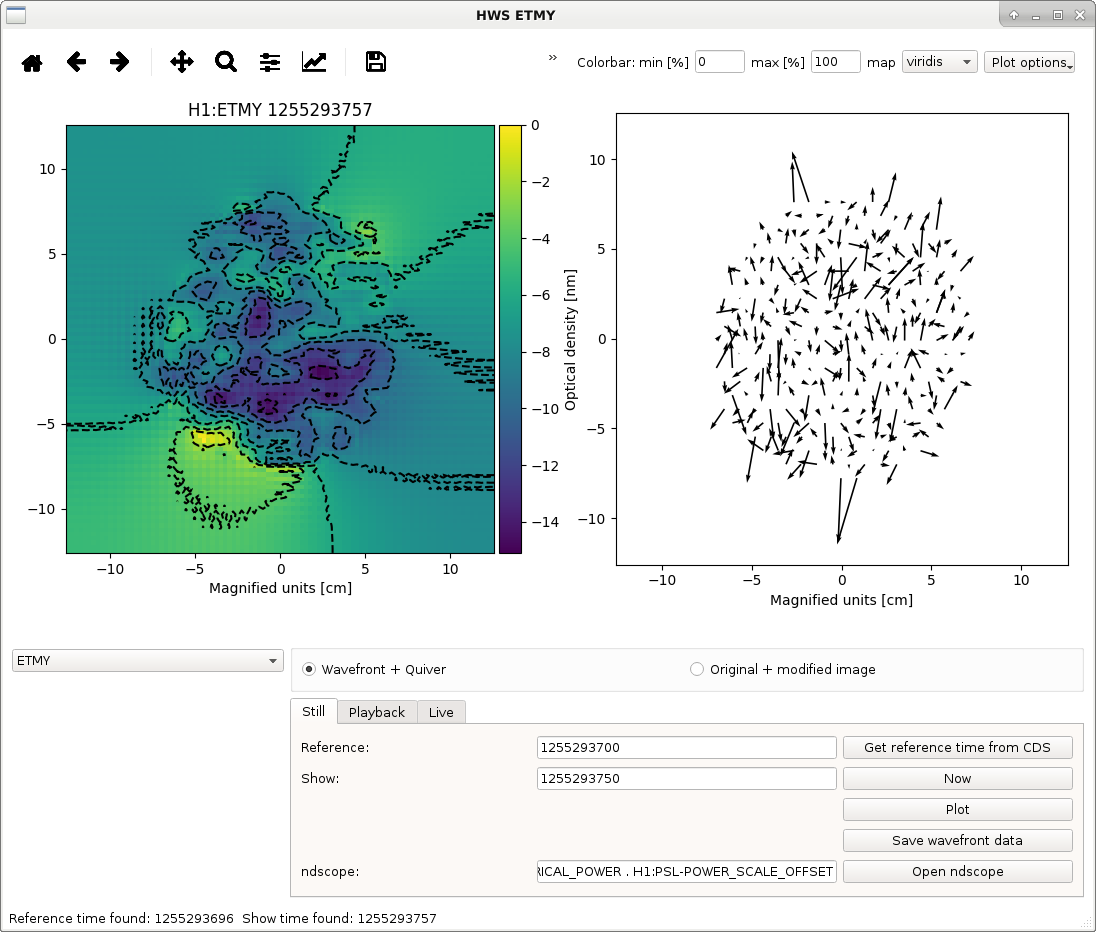
GPS = 1255291770: stepped ETMY RH power from 1W to 1.8W (increase of 0.5W per segment).
1255293450 - Ring heater set back to 0.8W total.
1255293700 - RH set to 4.8W total
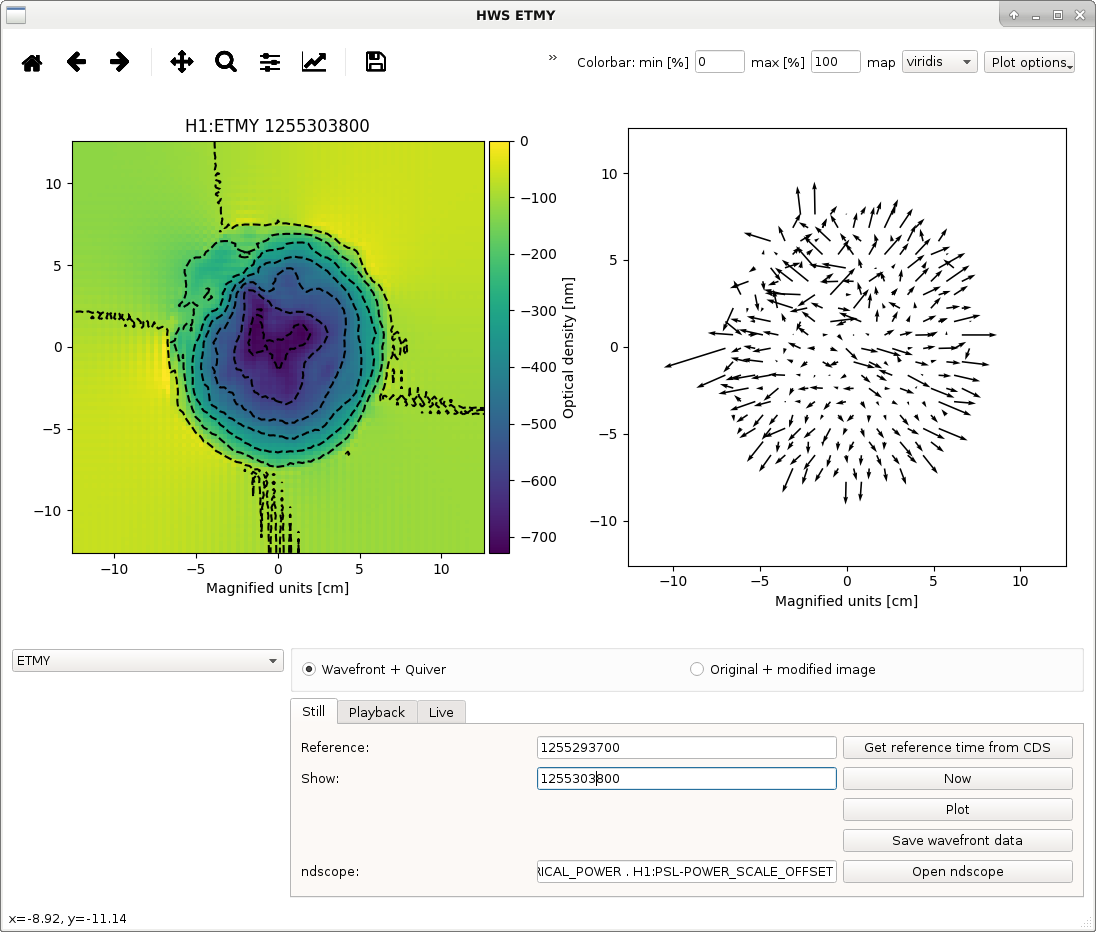
1255303800 - RH set to 0.8W again
Here are some measurements of the RH thermal lens. There is clearly a quadratic lens visible in the wavefront but there are regions of systematic spatial noise in the wavefront - particularly in the top left hand corner and in the center. We're going to attempt to clean these up by tweaking the alignment today.

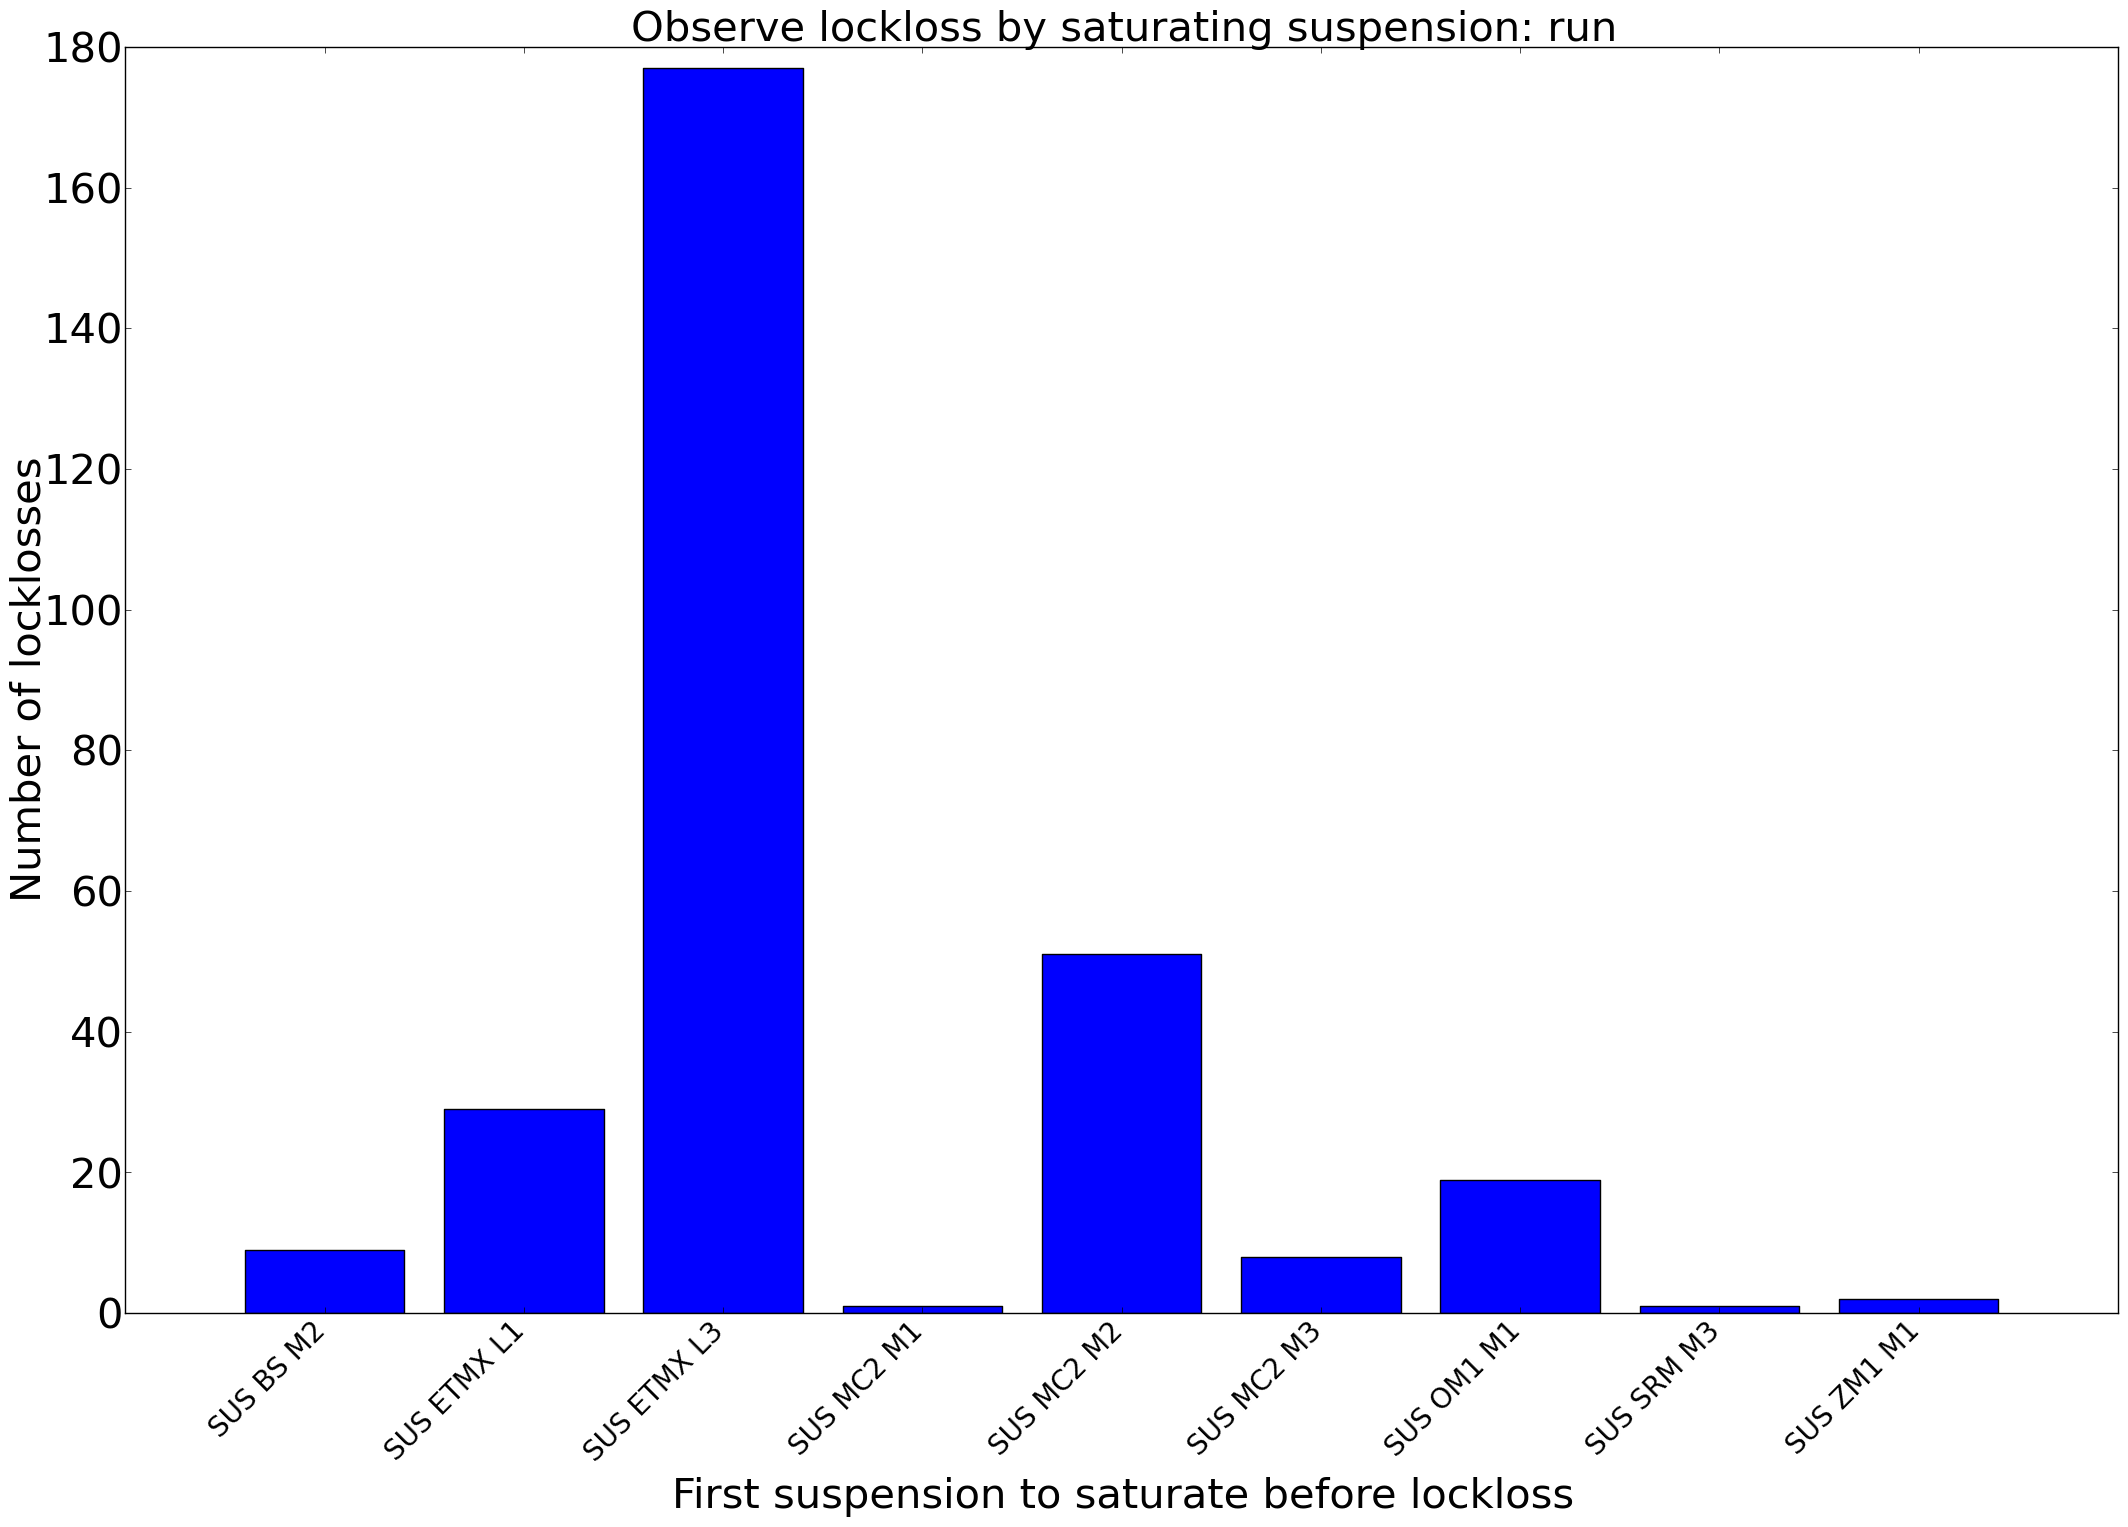
Using the data collected by the locklost website, I have created some histograms on the locklosses we've experienced durig O3, filtered for different lockloss states/additional factors. The plots are located on my public html, and have been created for three time spans before commissioning month started: one week before, one month before, and for the O3 run so far. They are separated as follows:
H1_duration_*.png: histogram of lock lengths where we were in Observe when lockloss occurred
H1_states_*.png: histogram of states from which we have lost lock
H1_*_sats_*.png: histogram of which suspensions saturated first, from our three most common lockloss states: LOCKING_ALS, ACQUIRE_DRMI_1F, and NLN (in Observing)
With a recent lockloss release/re-run on O3 measurements, these can be filtered further for high ground motion/wind and the other established lockloss tags that have been created. Attached are three plots for the O3 run.
The new tags are a really useful addition to the lockloss tool. Check them out here.
By clicking on this link I could within a few minutes search for all of the locklosses from nominal low noise (guardian state 600) from the start of O3 until now and see how many of them have various tags.
I'd also like to highlight that it is worth taking an extra look at some of the plots that Niko has added in his directory linked above. For example, but comparing the state from which we lost lock over the last month to the same plot for all of O3a, you can see that the locklosses that happen durring the ASC engagement states (430 and 435) became much more of a problem in the last month of the run, but there were fewer ALS locklosses (15 and 16). Focusing on the ASC locklosses will be helpfull because each of these costs us significant time.
Another interesting point that Sheila brought up that I'd like to explain a little better: "Why do did H1's O3A have almost a factor 2 more maintenance time than in O1 and O2?" She confirms her impression is from information on the time accounting tabs on the summary pages for O3A, O2 and O1. As always, we must take the accuracy of these percentages with a grain of salt, because they are human entered statuses, and the criteria for putting the observatory mode in one state vs. another depends on the human operator corps, and often the lines between categories are blurry. That caveat aside, looking into this a little deeper, recall that "Maintenance" is actually a concatenation of several categories: Calibration, Preventative, Maintenance, and Corrective maintenance. So here, I summarize the data for the three runs: O1 O2 O3 Commissioning 2.8 3.4 3.5 Maintenance 4.4 5.4 8.6 CALI 0.7 0.4 1.1 PREV 1.8 3.3 3.5 CORR 1.9 1.7 3.9 Planned Eng. 0.1 11.9 0.0 ^ Holiday break So the source of the extra maintenance is a factor of 2 more of both calibration time as well as corrective maintenance. The amount of time spent on corrective maintenance is unavoidable / uncontrollable, and the extra time spent on calibration is for two reasons: (1) ER14, the engineering run leading up to O3, was reduced from the 4 weeks (which we had prior to O1 and O2) to 2 weeks (which we sacrificed to spend more time commissioning), and (2) We had several new / confusing new problems with DARM loop that required "more investigation than usual:" (a) the systematic error in the ETMX PUM which we now know resulted from unwanted L2A2L coupling as a result of using IFO spot positions that were "far" away from the optics' geometric center of rotation (because we had point absorbers, which newly started grossly impacting the IFO's control system after we increased both the laser power and the power recycling gain) (b) As a result (we think) of off-center spot positions, and mode mis-match between the arms and the signal recycling cavity, we had compounding effects of a drastically detuned SRC response in the sensing function AND left over impacts of parasitic L2A2L coupling. Seems to all add up, and not actually that we've taken that much longer for "preventative maintenance" [what operators have been coached to put the observatory mode in during maintenance Tuesdays].
Attached is power point with images that show were we have IR light where we should not, fringes where we should have beams, and IR light artifacts where we never have had them before.
Since putting in the new PMC, the IO path has had 2 optic changes, both successfully installed and the input pointing restored.
The beam through the EOM and through the entire IOpath has degraded over time, see my FRS 11631 about the clipping on the output of the EOM in the IO path. The attachment shows that the beam shape at IMC_IN has gotten worse.
Given that I've never had IR artifacts, and fringes where there should be beams, and I have watched the alighnment degrade, I can only conclude that aliging the IO path is needed to correct these issues.
updated document in alog with beam proiles, alog 52499