With the HAM6 doors now on and pump down ongoing ground loop checks were redone this afternoon. No new issues to report. Same issues as documented in alog 52349.
After Richard turned on the squeezer high voltage I went to the LVEA and did a few characterization measurements on the squeezer.
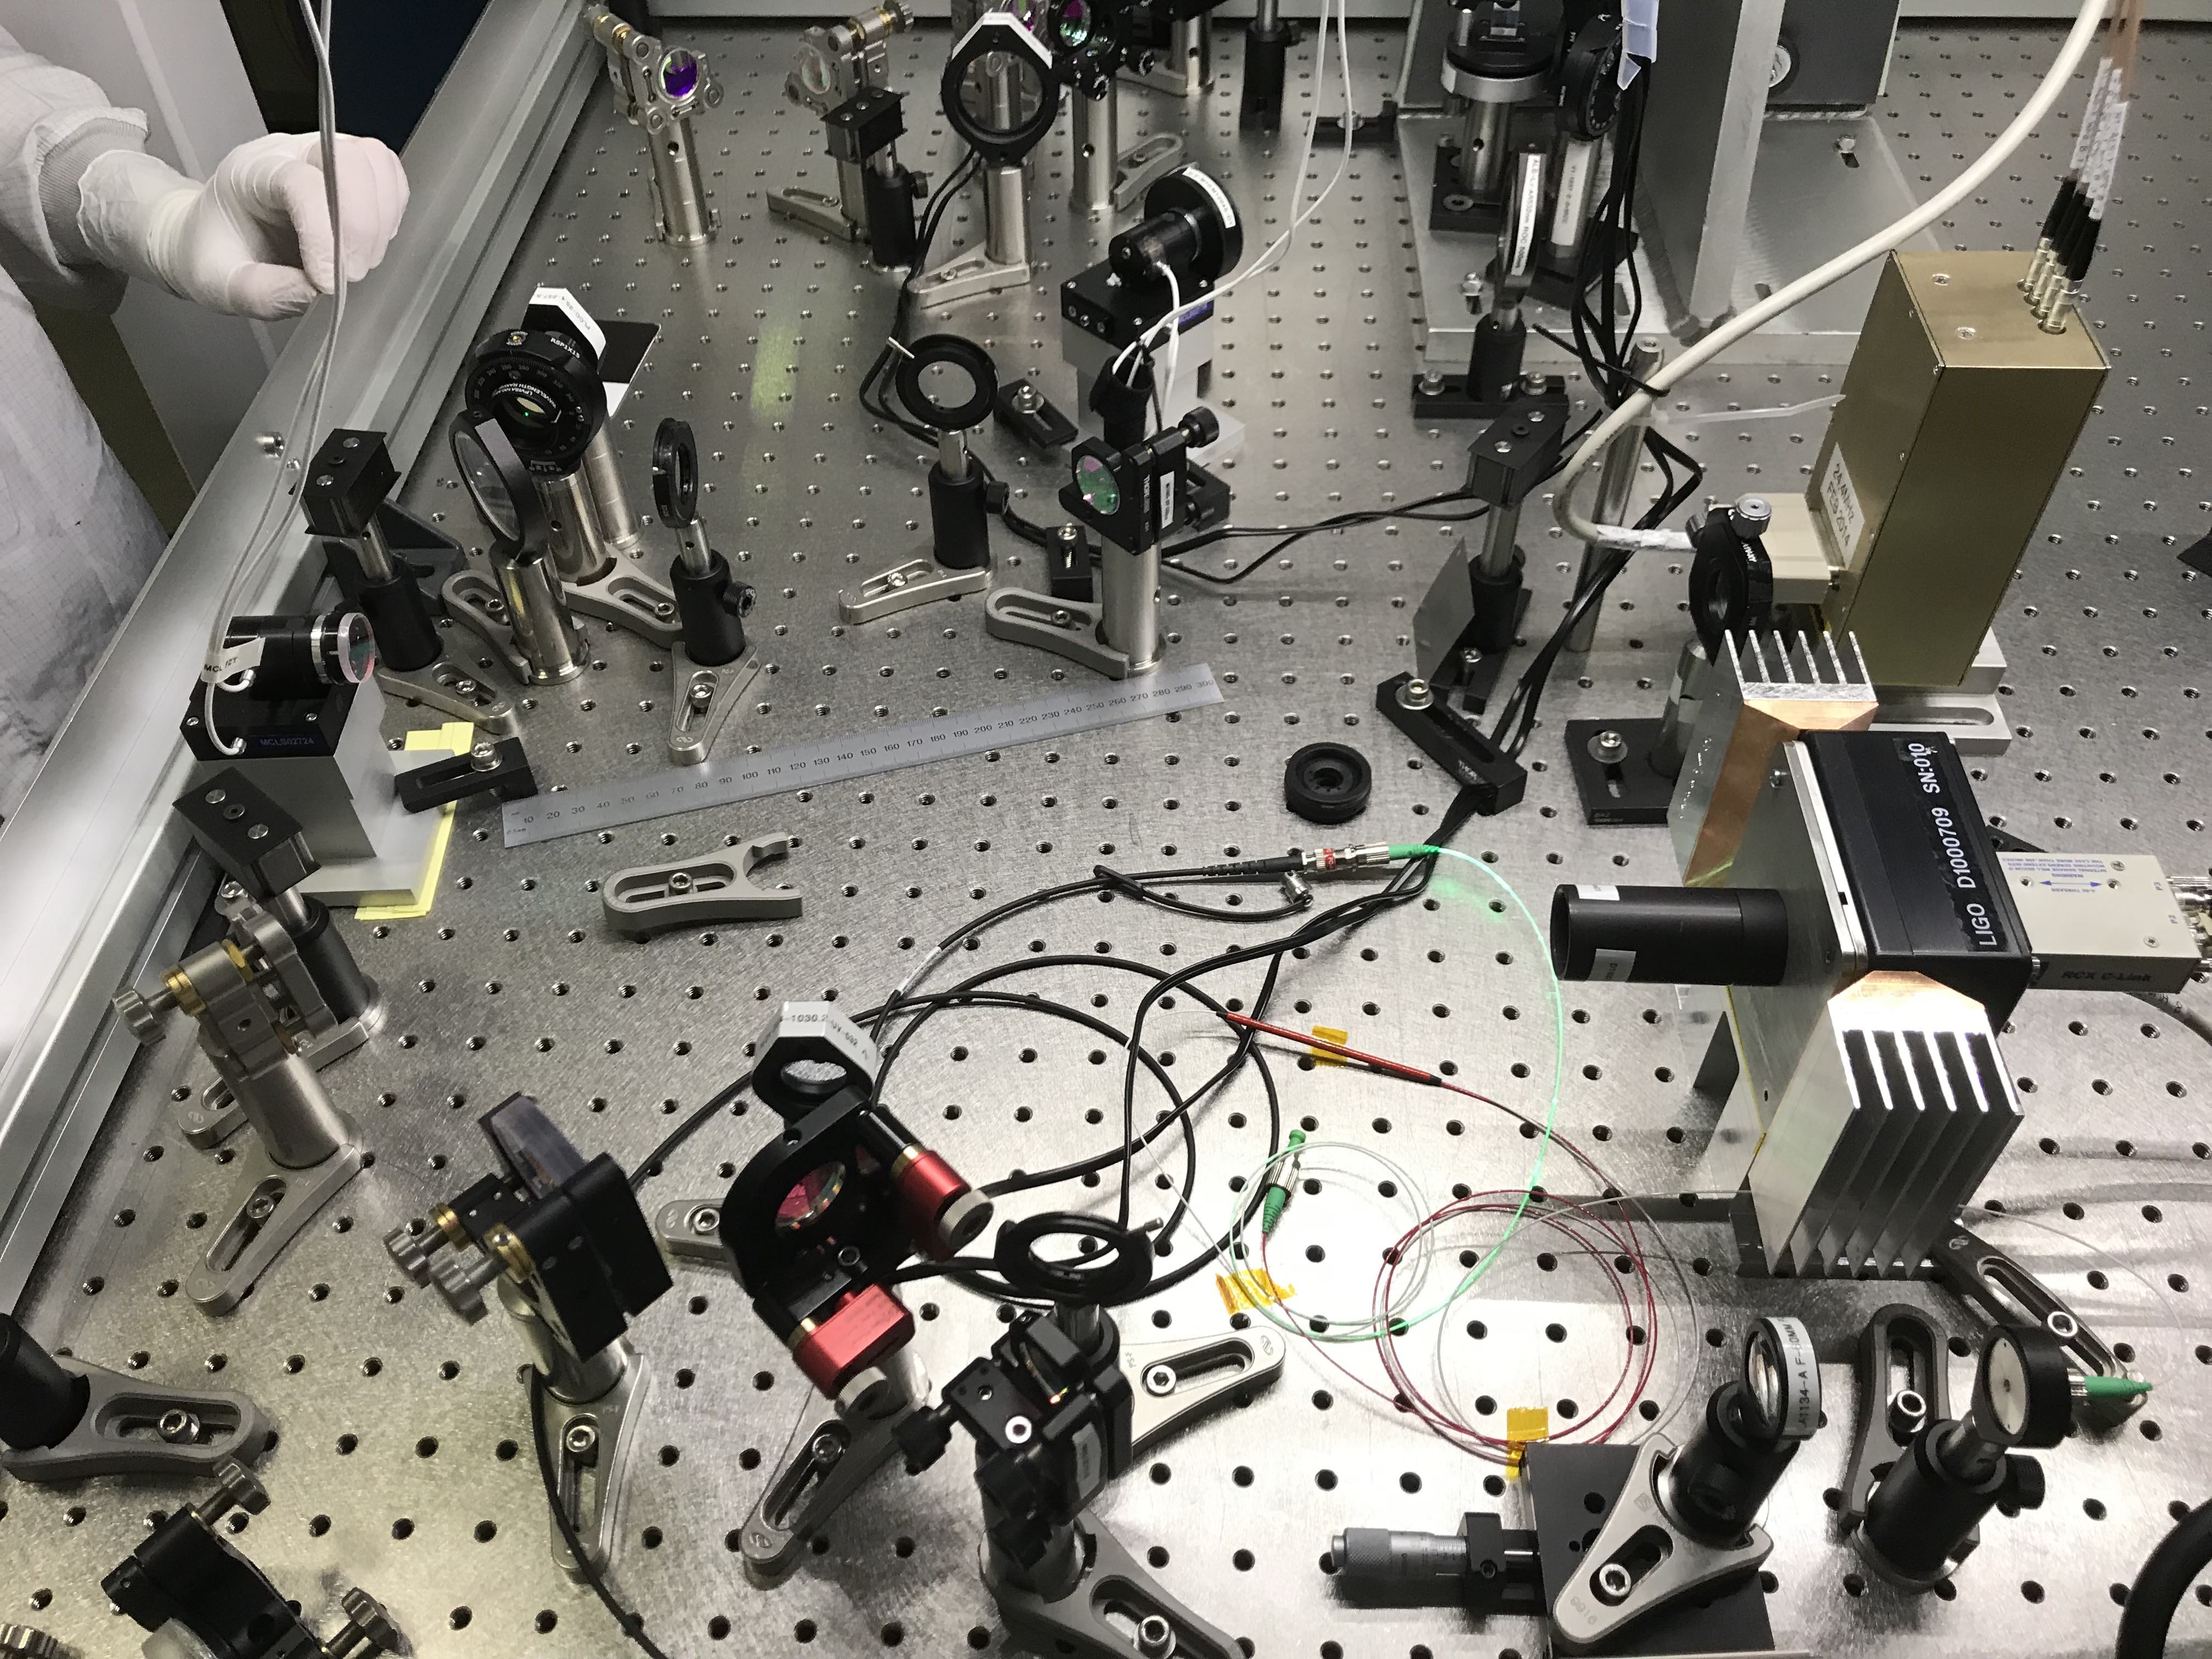
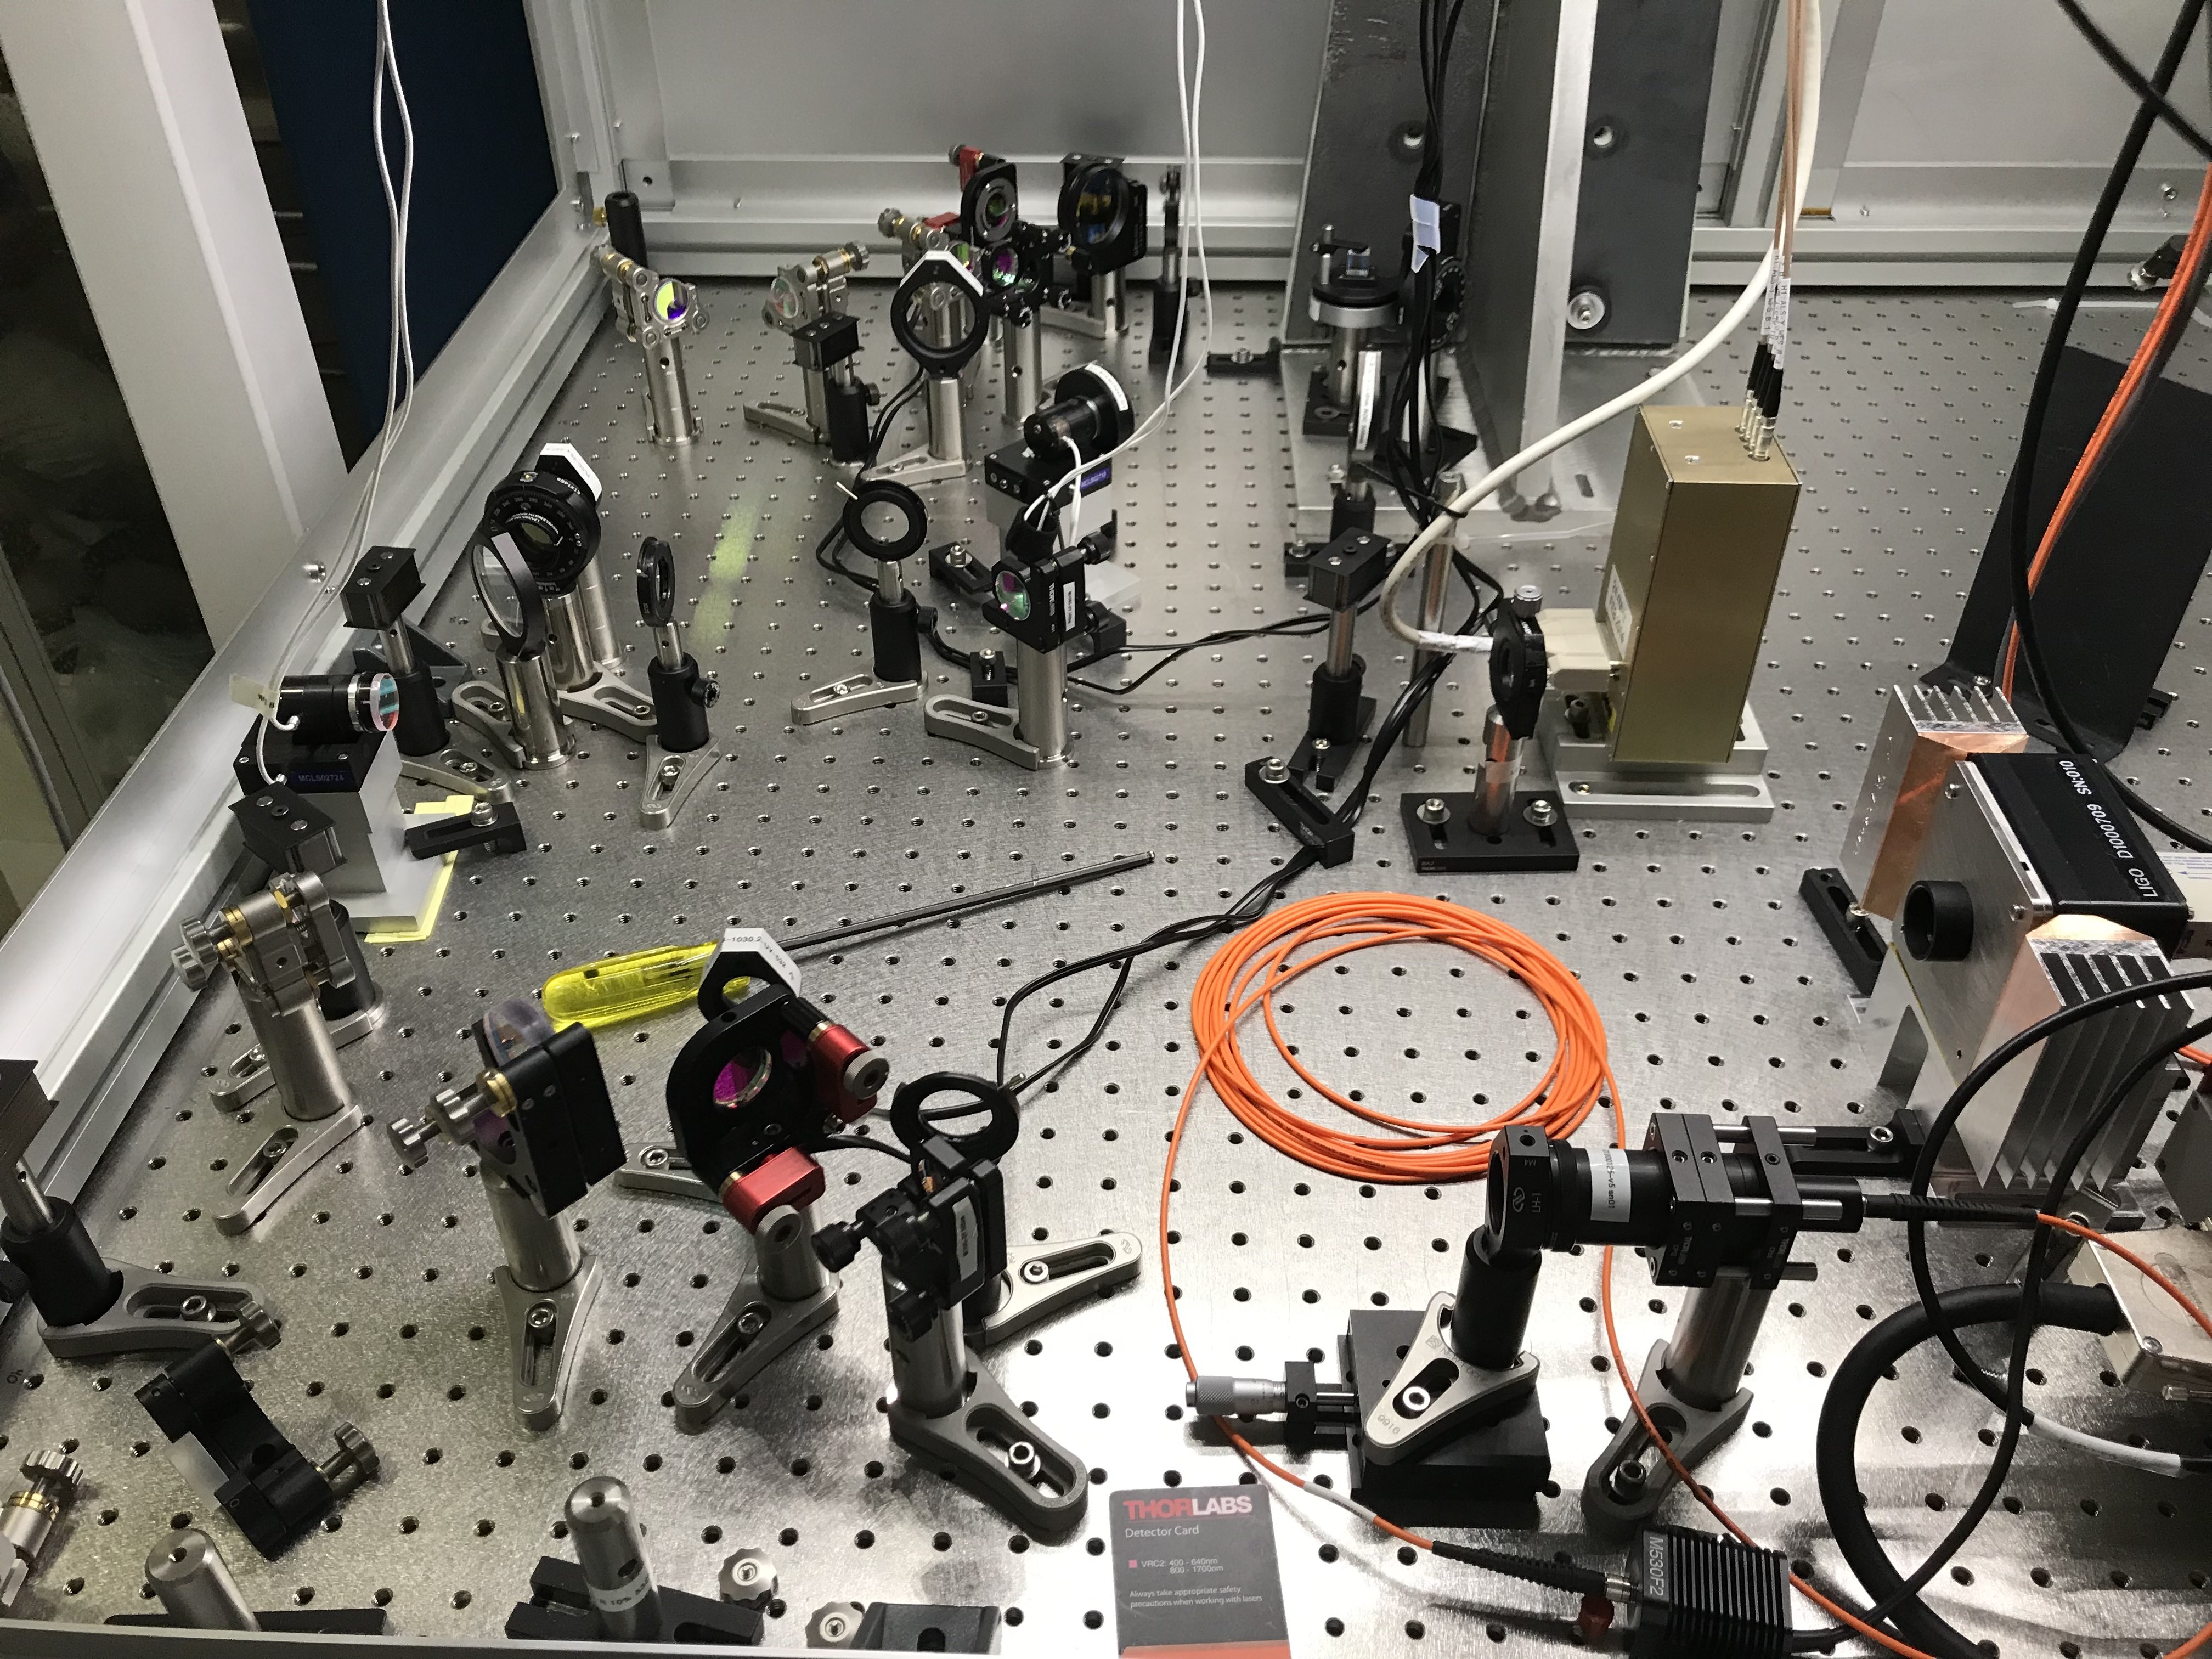
New laser source installed and aligned with 60mm focal length collimating lens. Output beam looks single mode. ETMY imaged onto HWS and magnification calibrated to 22.8x using 4 measurements in three different techniques.
We started work this morning with the 75mm focal length lens installed and the return beam from ETMY nominally imaged onto the HWS. (We deadreckoned the imaging by adjusting the pitch of the ETMY, looking at how much the aperture in the HWS image moved vertically and how sharp the image looked and then adjusting the longitudinal location of the HWS to maximize sharpness and minimize motion in response to an ETMY pitch - the HWS moved approximately 170mm closer to the laser mirror in the system).
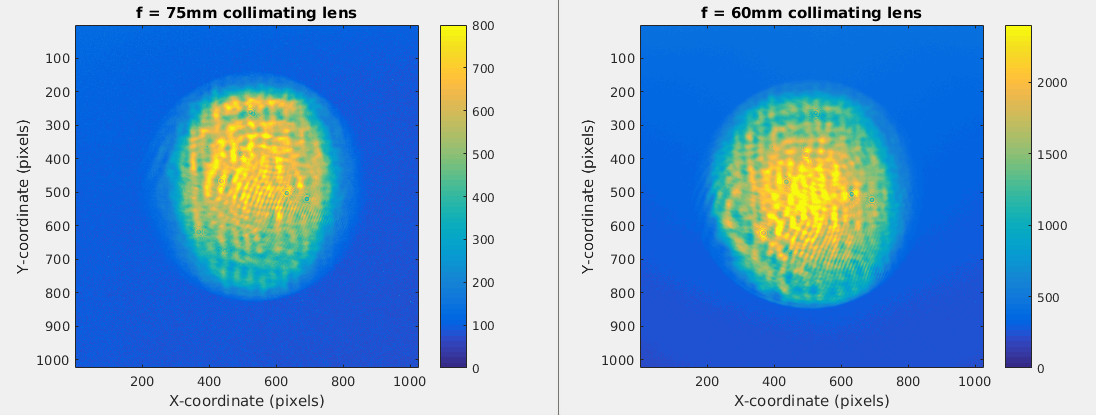
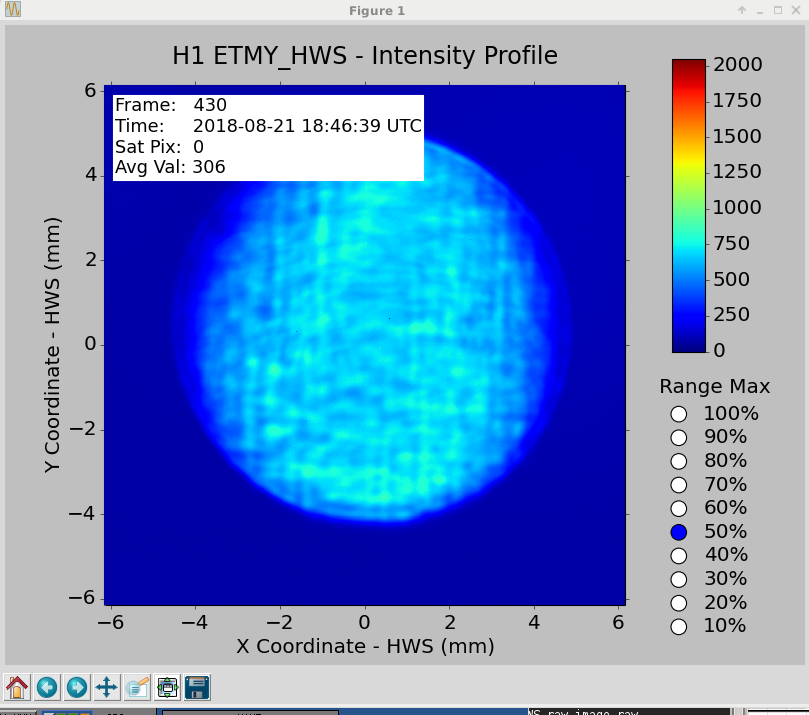
This is the ETMY HWS return beam with the 75mm focal length lens.
I felt like there was still a lot of clipping so I wanted to try a smaller beam using a shorter focal length lens to collimate the source.
We installed the 60mm focal length lens to collimate the HWS source laser.
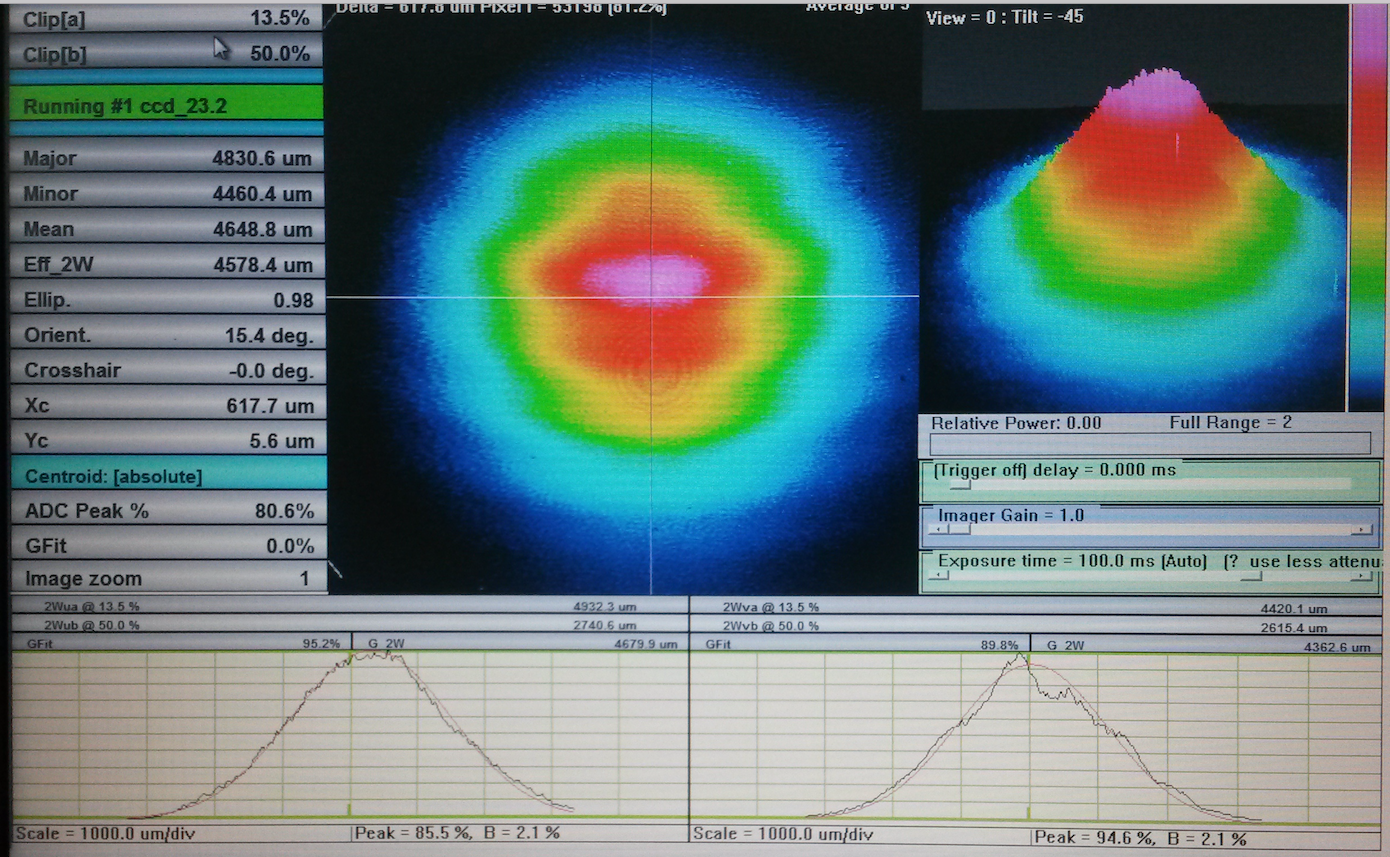
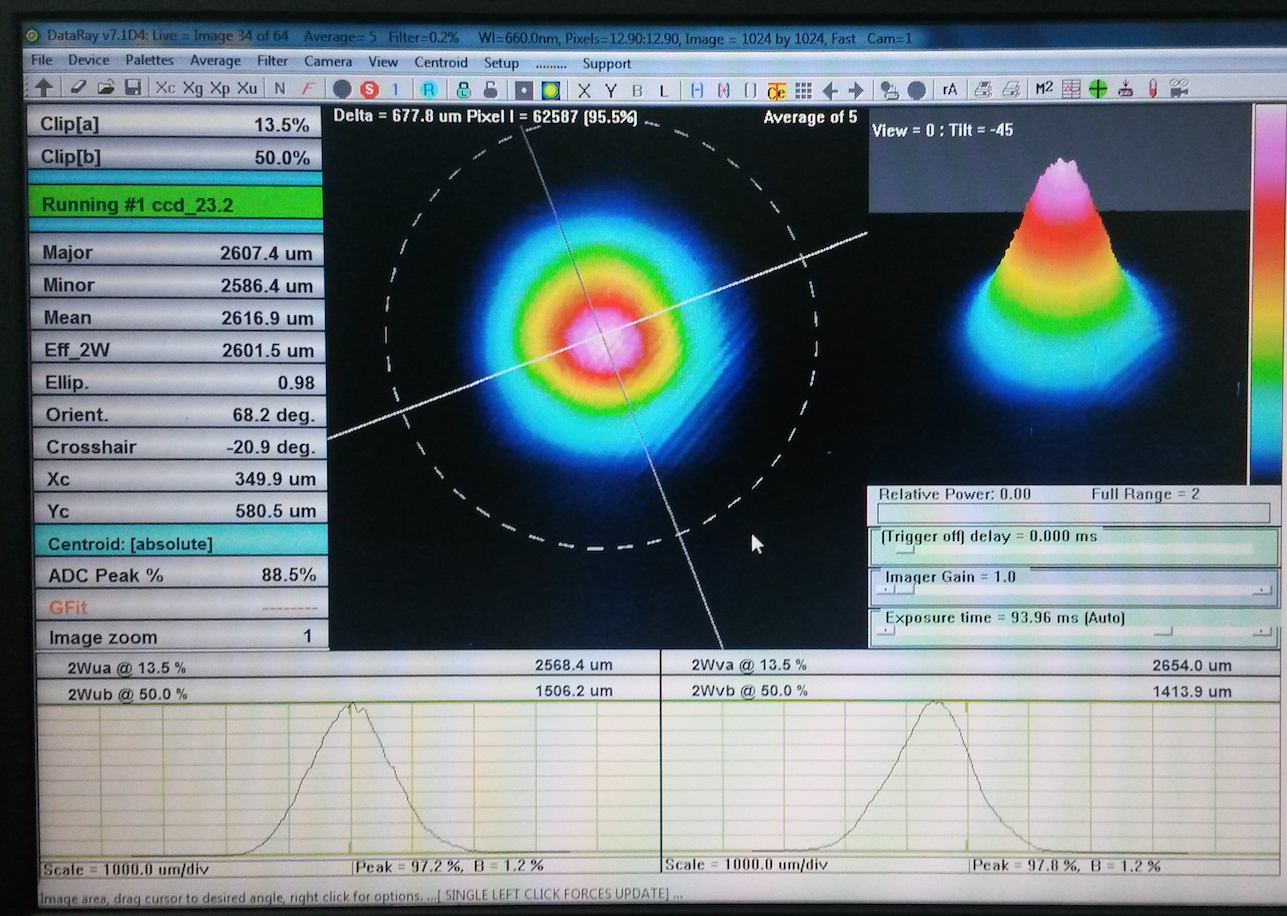
1. Firstly, we sent the output beam into the beam scan and adjusted the relative positions of the fiber output and the collimating lens to get the Gaussian intensity distribution centered in the aperture of the lens - as shown below.

2. Next we adjusted the longitudinal position of the collimating lens until the beam was focussed to a point approximately 40mm past the lens L3 (we were aiming for 90mm past that lens but deemed this to be close enough). This was evaluated by measuring the beam size with the BeamScan at two different locations along the optical axis and projecting out where the focal point would be.
3. Next we aligned the beam through the output system making sure it was centered on all the mirrors.
4. Lastly, we adjusted the final mirrors so the beam went through the center of the iris that was mounted on the telescope.
5. We turned on the HWS (sans Hartmann plate) and saw a clipped return beam on it. We adjusted the output mirror to improve the return beam and remove the clipping. We used the sharp edges of the beam as a guide to center the intensity on the optic.
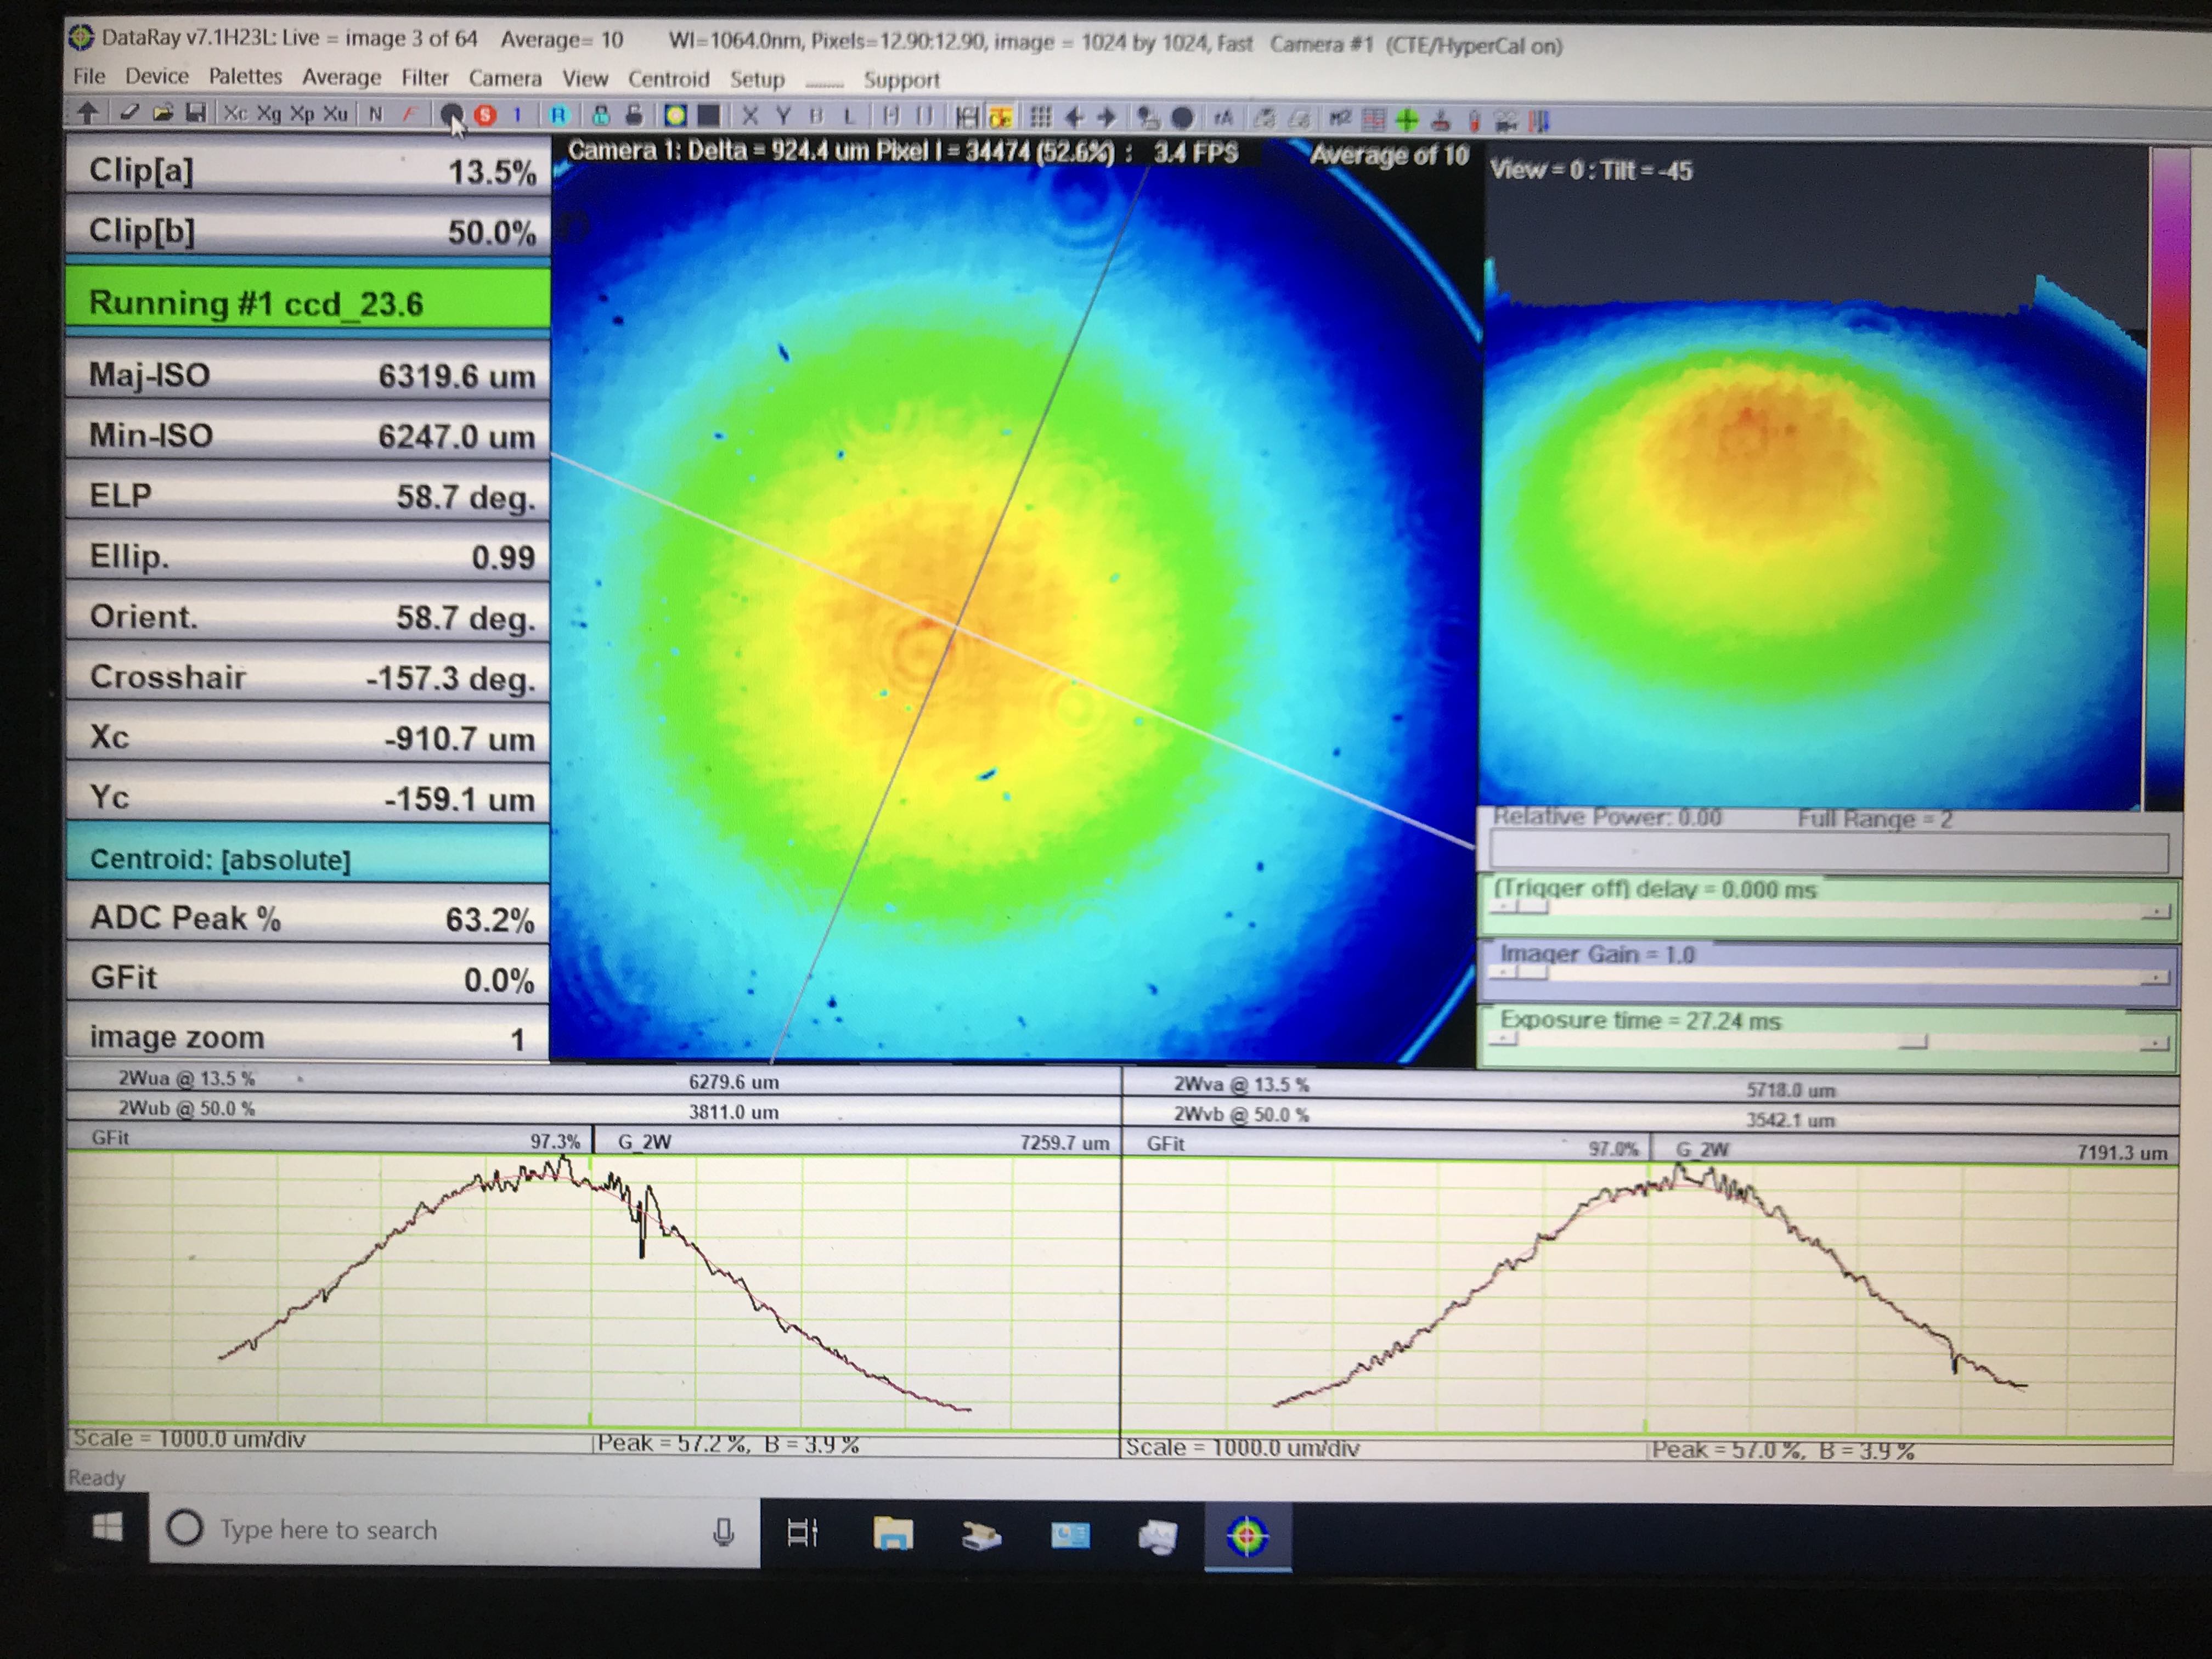
6. The 60mm focal length lens return beam is shown below. We deemed this to be the best return beam yet.

The old ETMY HWS beam with the LED is shown here for reference.

We moved the HWS along the optical axis, pitched ETMY up by a 20 microradians and measured the displacement on the CCD of the top edge of the HWS return beam.
Average of 4 measurements = 22.8x
Method 1: (use the shadow of the SSTL BAFFLE PLATE)
Method 2: (nominal distances between optics)
| Parameter | Value |
| ETM to TMS primary [T1000717] | 1.429m |
| TMS primary ROC | 4.0m |
| Primary to Second | 1.9026m |
| TMS secondary ROC | -0.2m |
| Secondary to lower periscope mirror [T1000717] | 3.744m |
| LPM to Lens 1 [aLOG 52500] | 0.591m |
| Lens 1 FL [T1000717] | 2.2361m |
| Lens 1 to Lens 2 [aLOG 52500] | 0.610m |
| Lens 2 focal length [T1000717] | 2.2361m |
| Lens 2 to Lens 3 | 1.096m |
| Lens 3 to M6 [aLOG 52500] | 0.326m |
| M6 to HWS (measured today) | 0.472m |
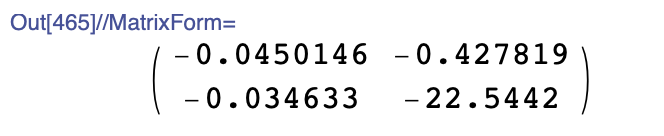
ABCD Matrix:

The nominal ABCD matrix suggests that we're offset from the image plane by 18mm. The magnification is 1/0.0450146 = 22.2x
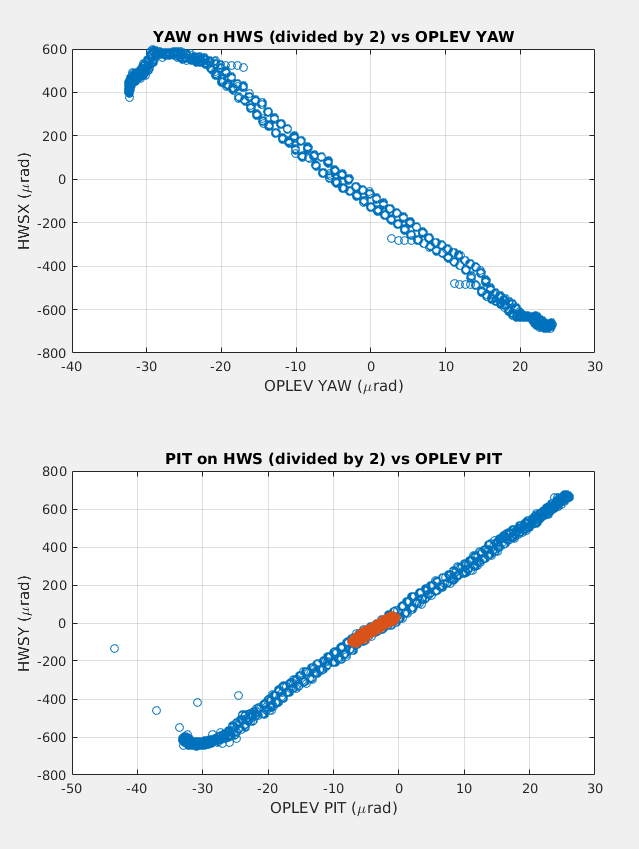
Method 3: Ratio of OPLEV PIT/YAW to HWS PIT/YAW when injection is added.
We added PIT and YAW excitations at different times into the ETMY SUS. We plotted the resulting HWS and OP LEV measurements of PITCH and YAW. The HWS measurements have been divided by the nominal magnification (H1:TCS-ETMY_HWS_MAGNIFICATION = 20.5) to reference them back to the plane of the HWS and divided by another factor of 2 to account for the fact that the OP LEV measures AOI and the HWS measures 2x AOI.
We fit for the linear sections in the attached plots. Depending on the ranges, the slopes ranged between 21.1 and 24.5, with an average of 22.8

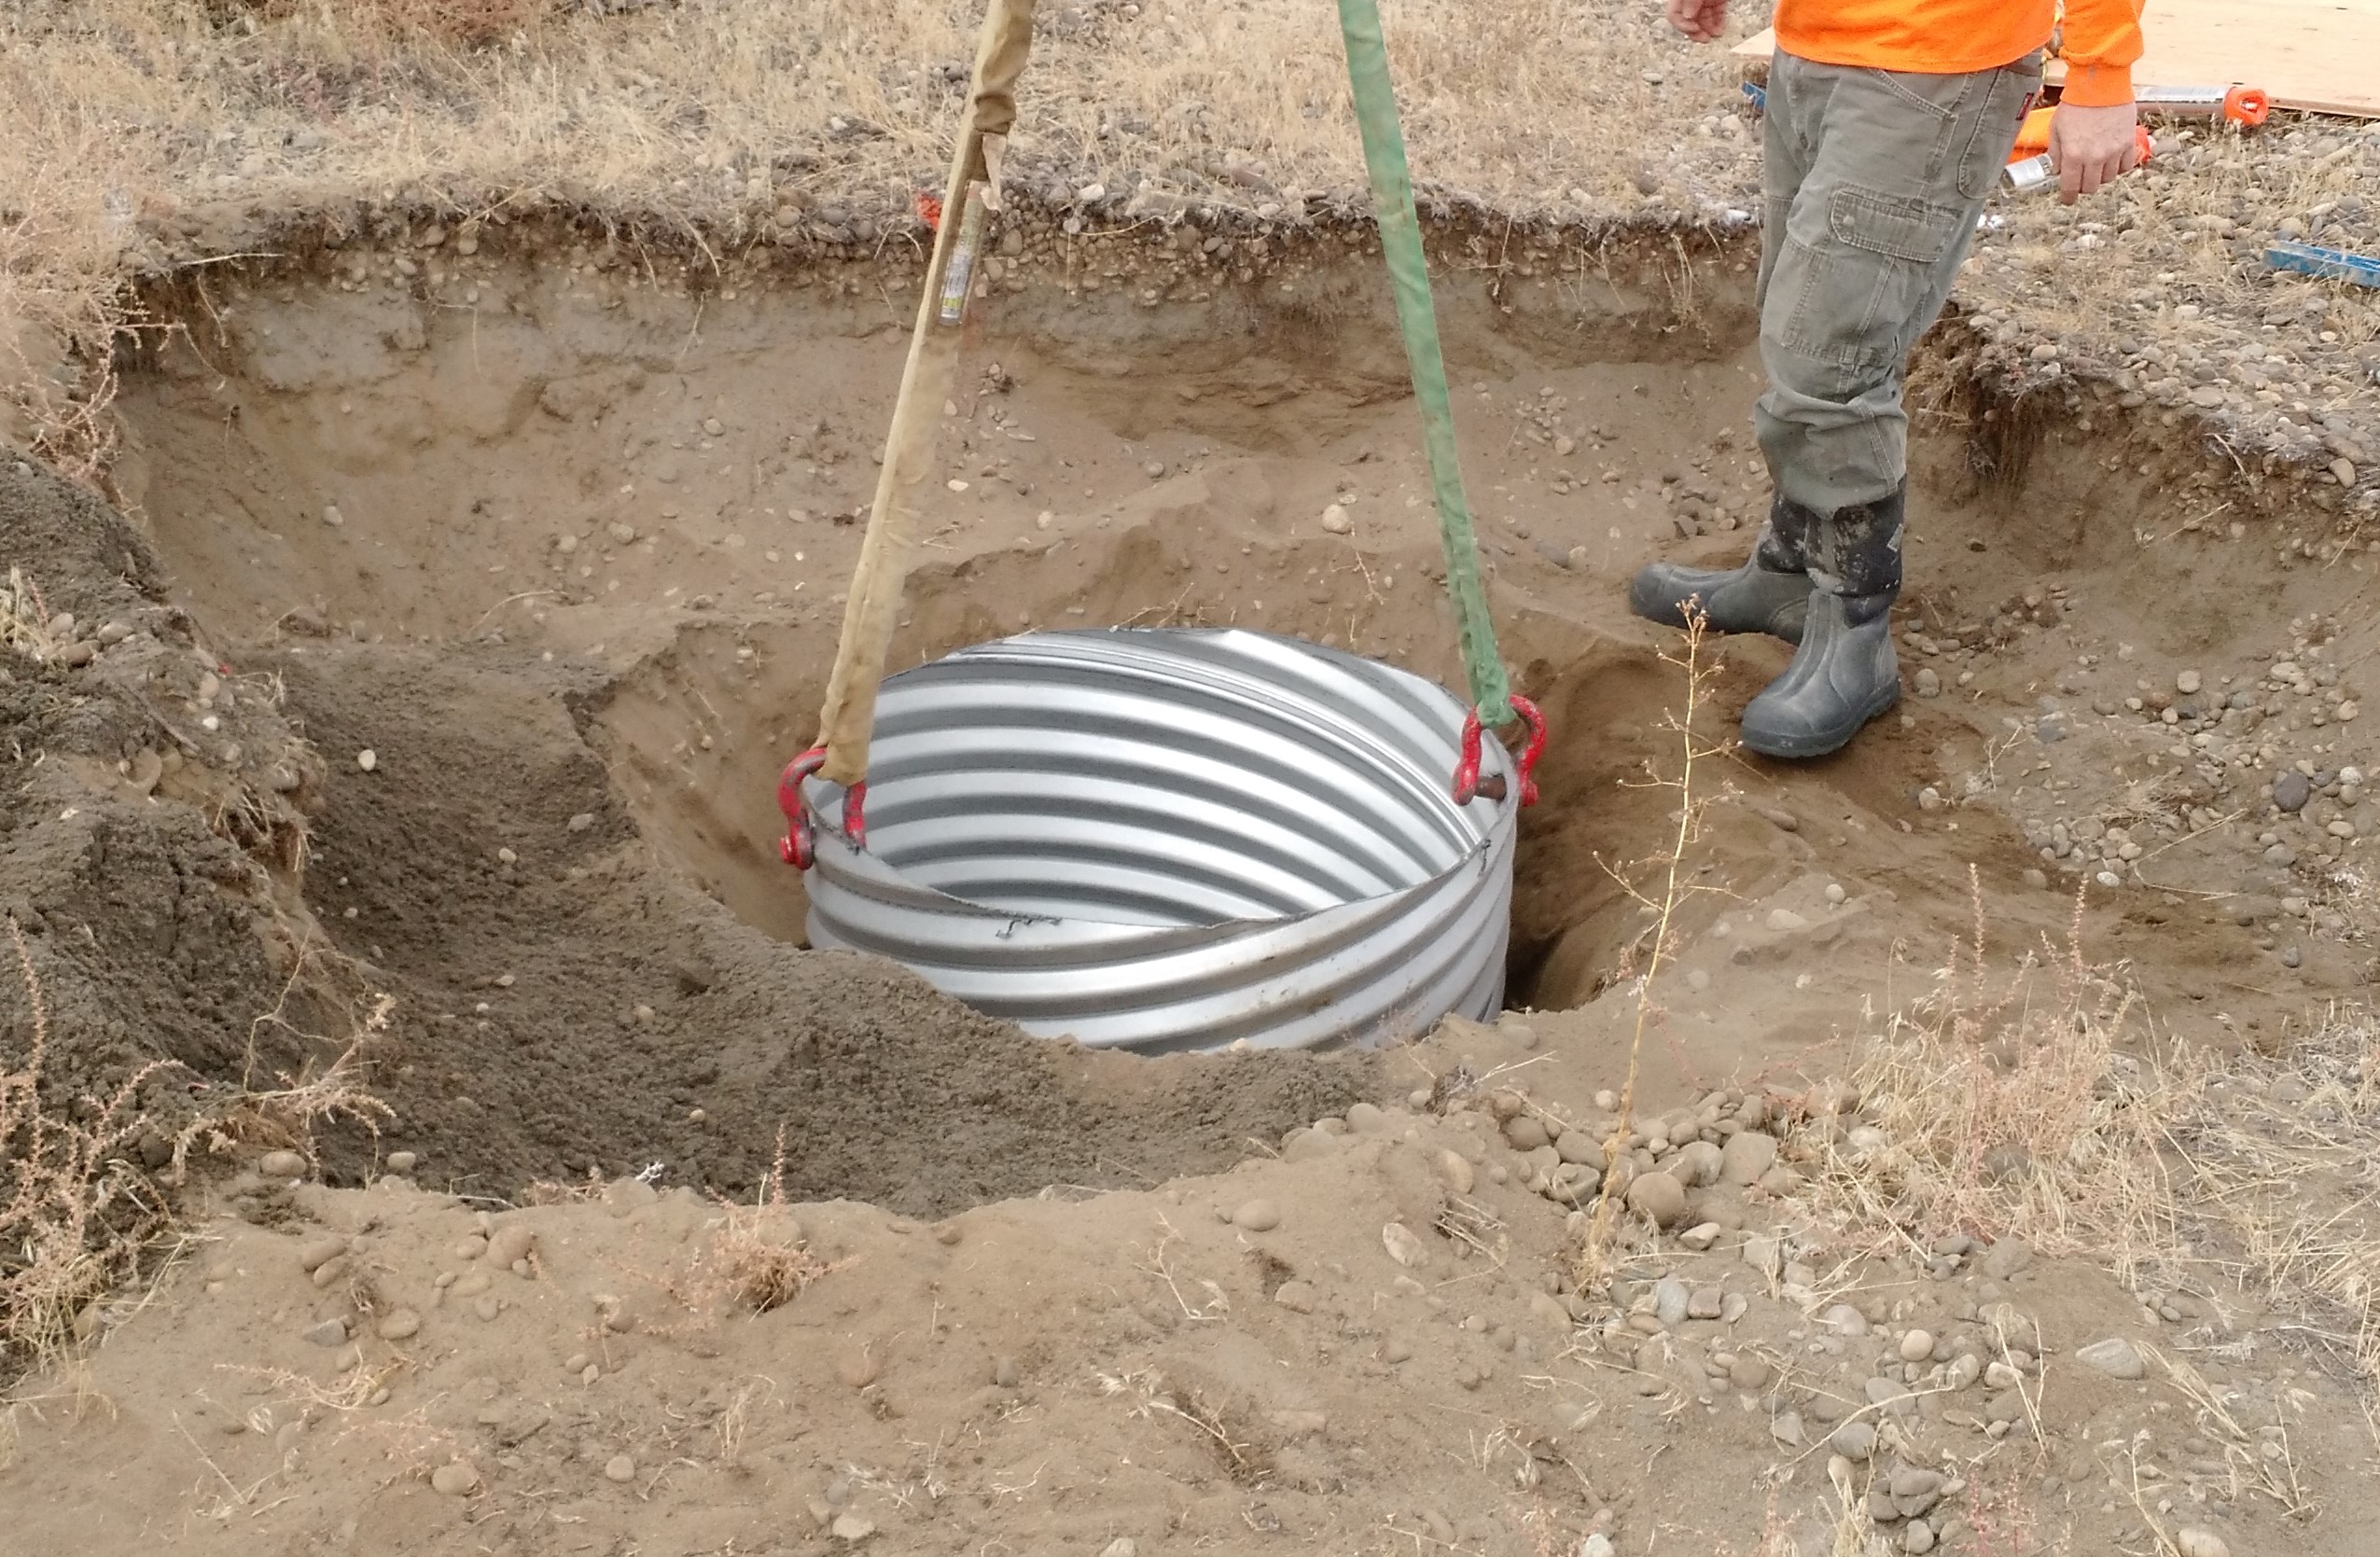
All the drilling and casing placement is complete. Photo shows last casing at EndY. Tomorrow, Thursday, concrete delivering will arrive on-site ~10:30 to pour a 12" thick plug, foot, shoe, in the bottom of the casing upon which the pole will sit. And that will be it for this phase of the wind fence.
Covered Control Room DAY shift from 8:30-10:30am PDT (15:30-17:30utc)while Jeff had off-shift work to attend to.
LOG: (times in UTC)
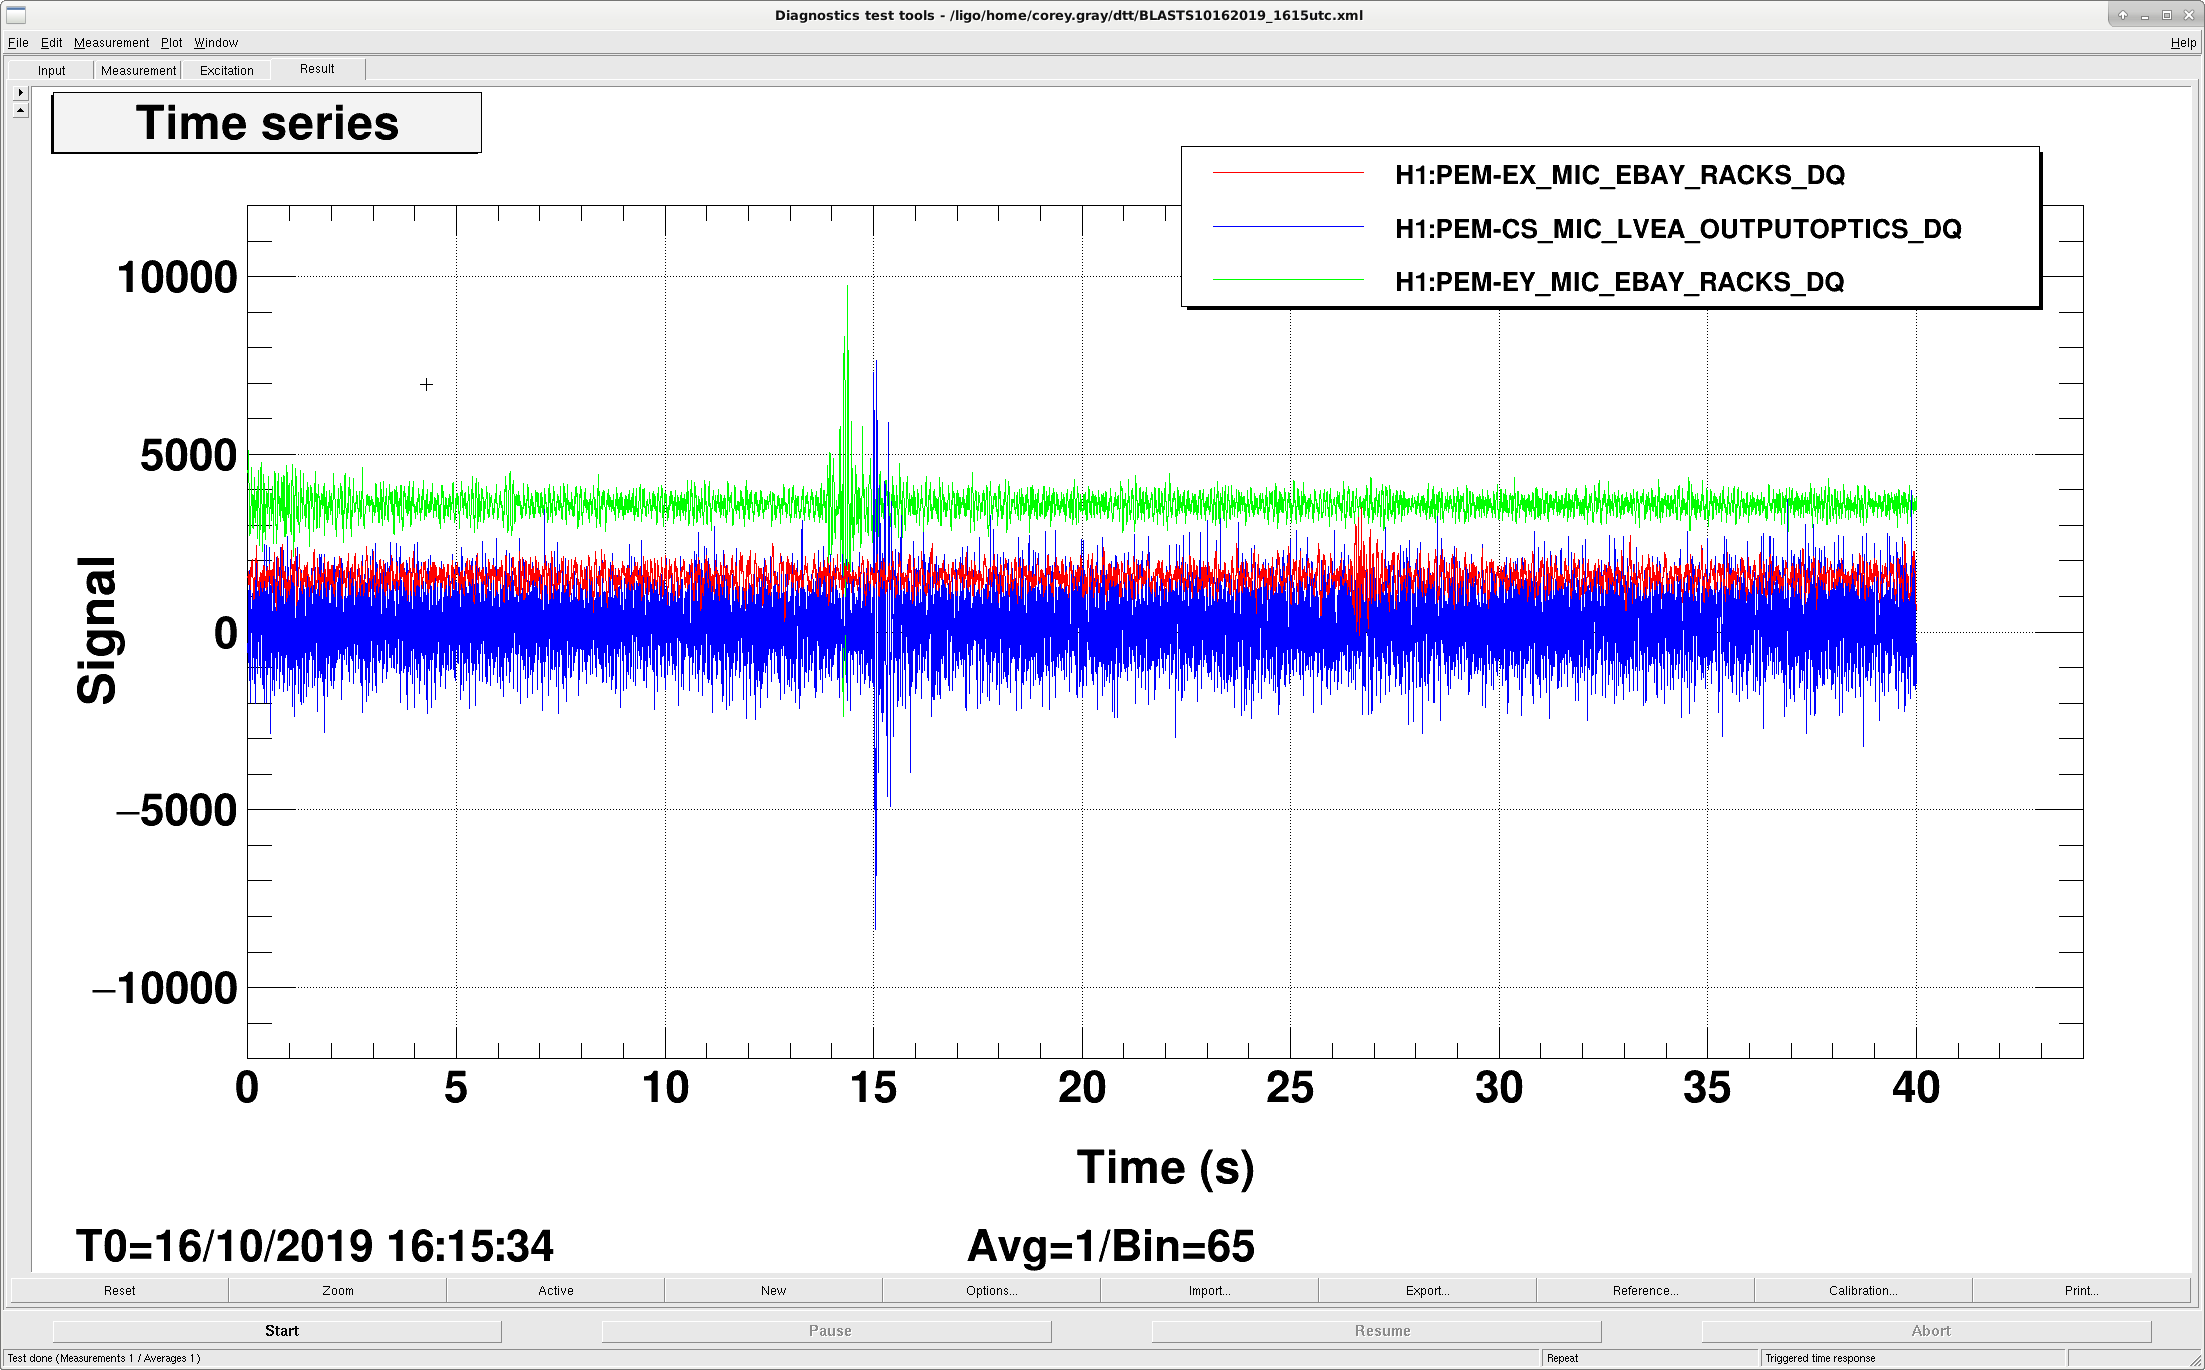
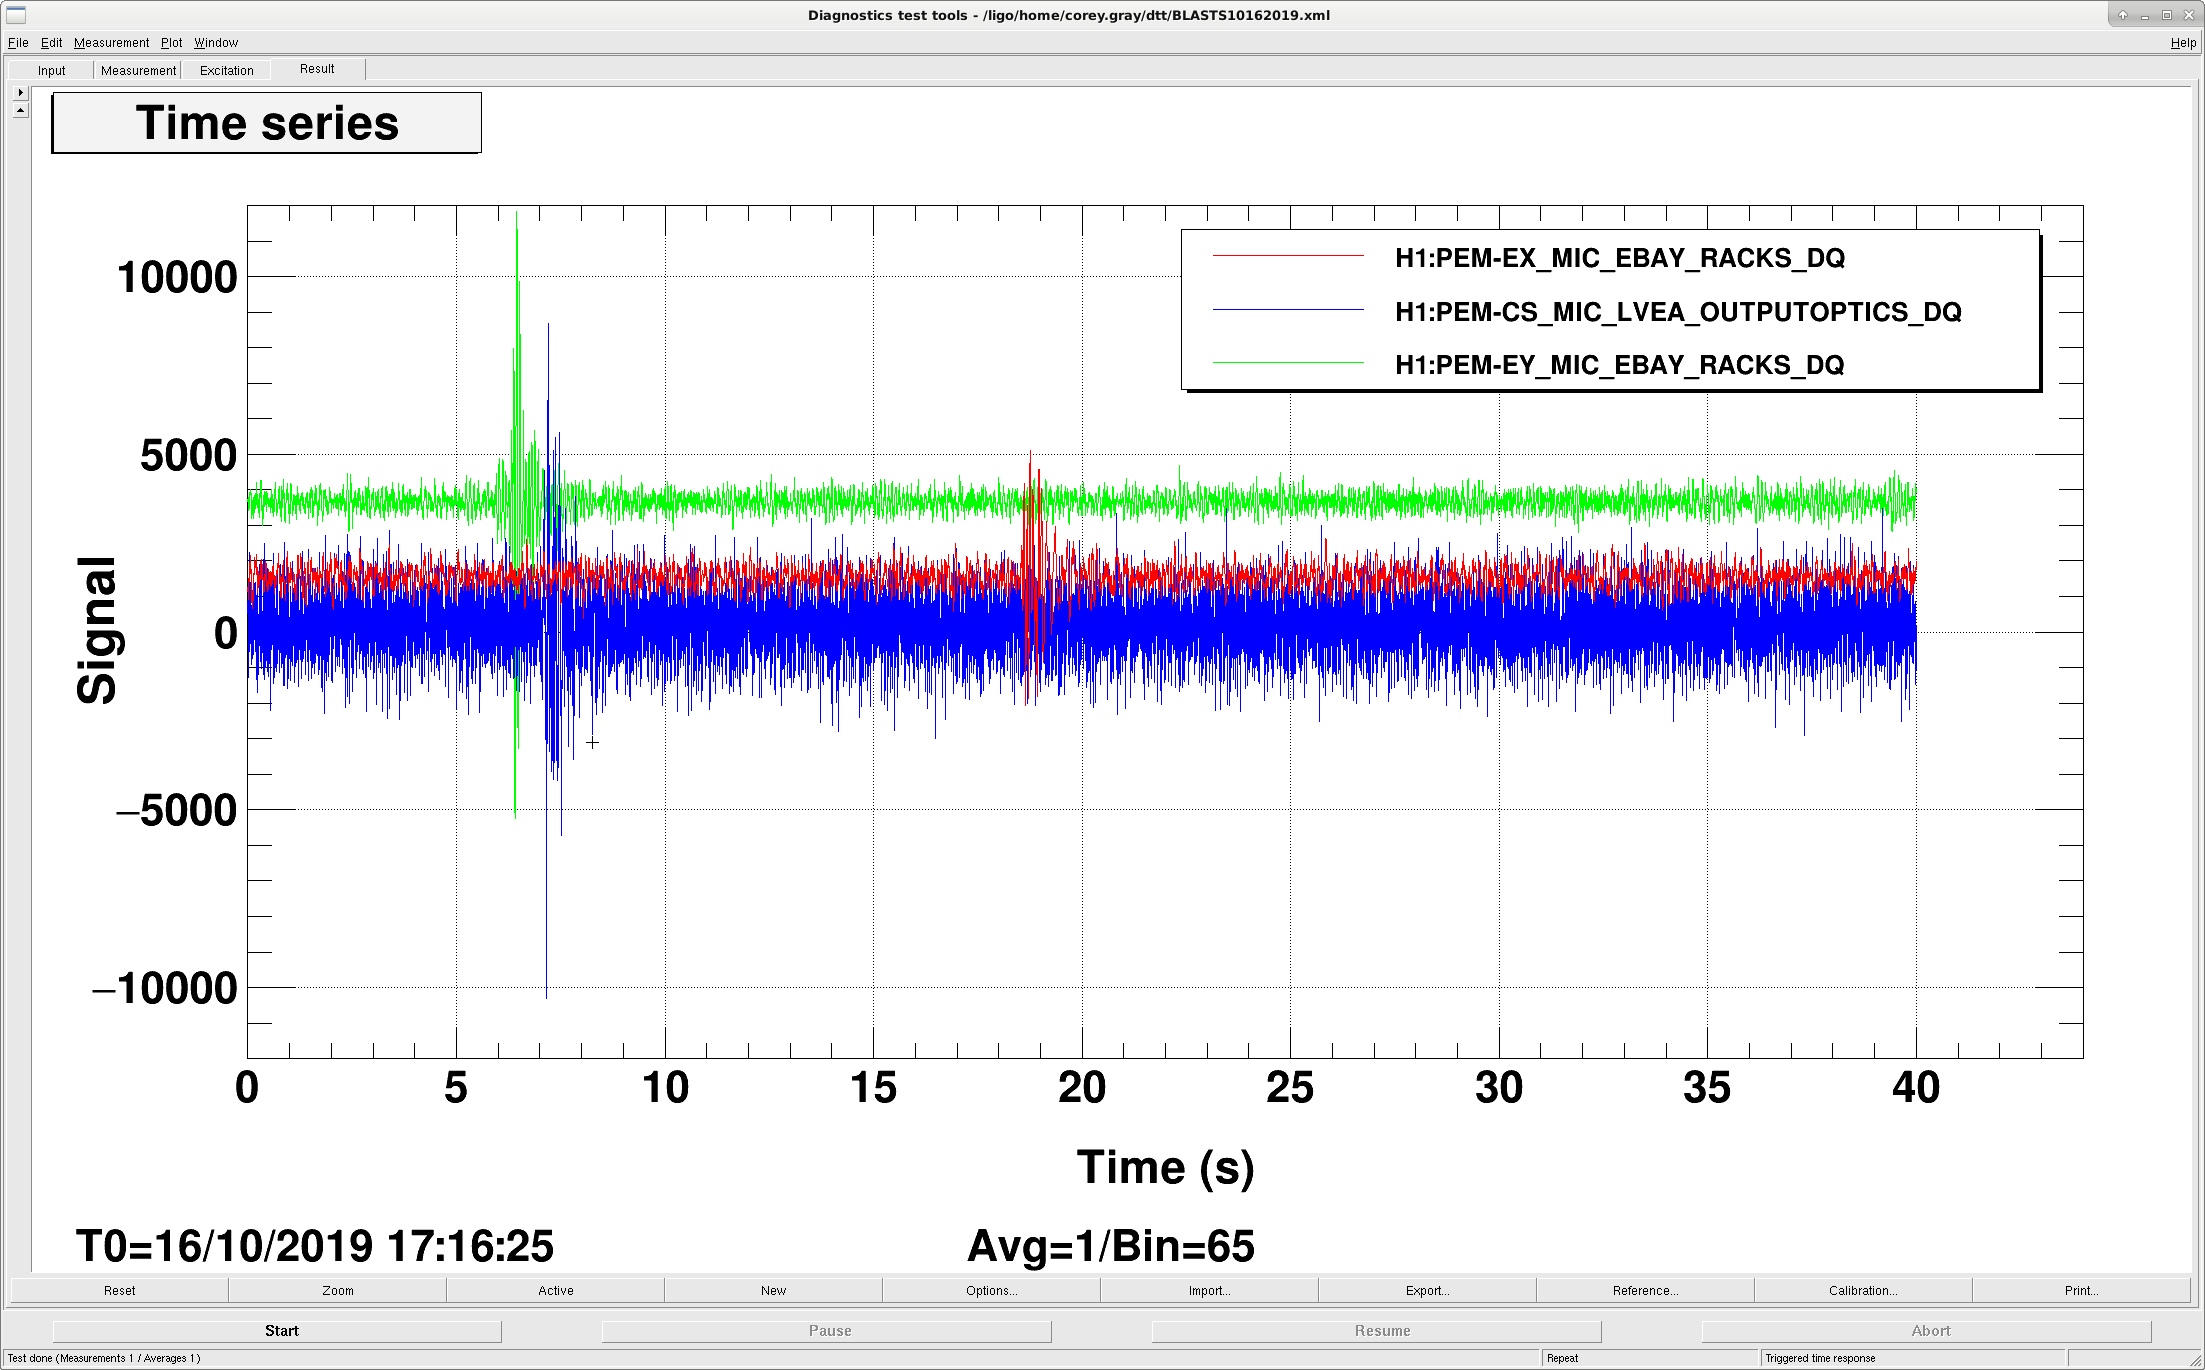
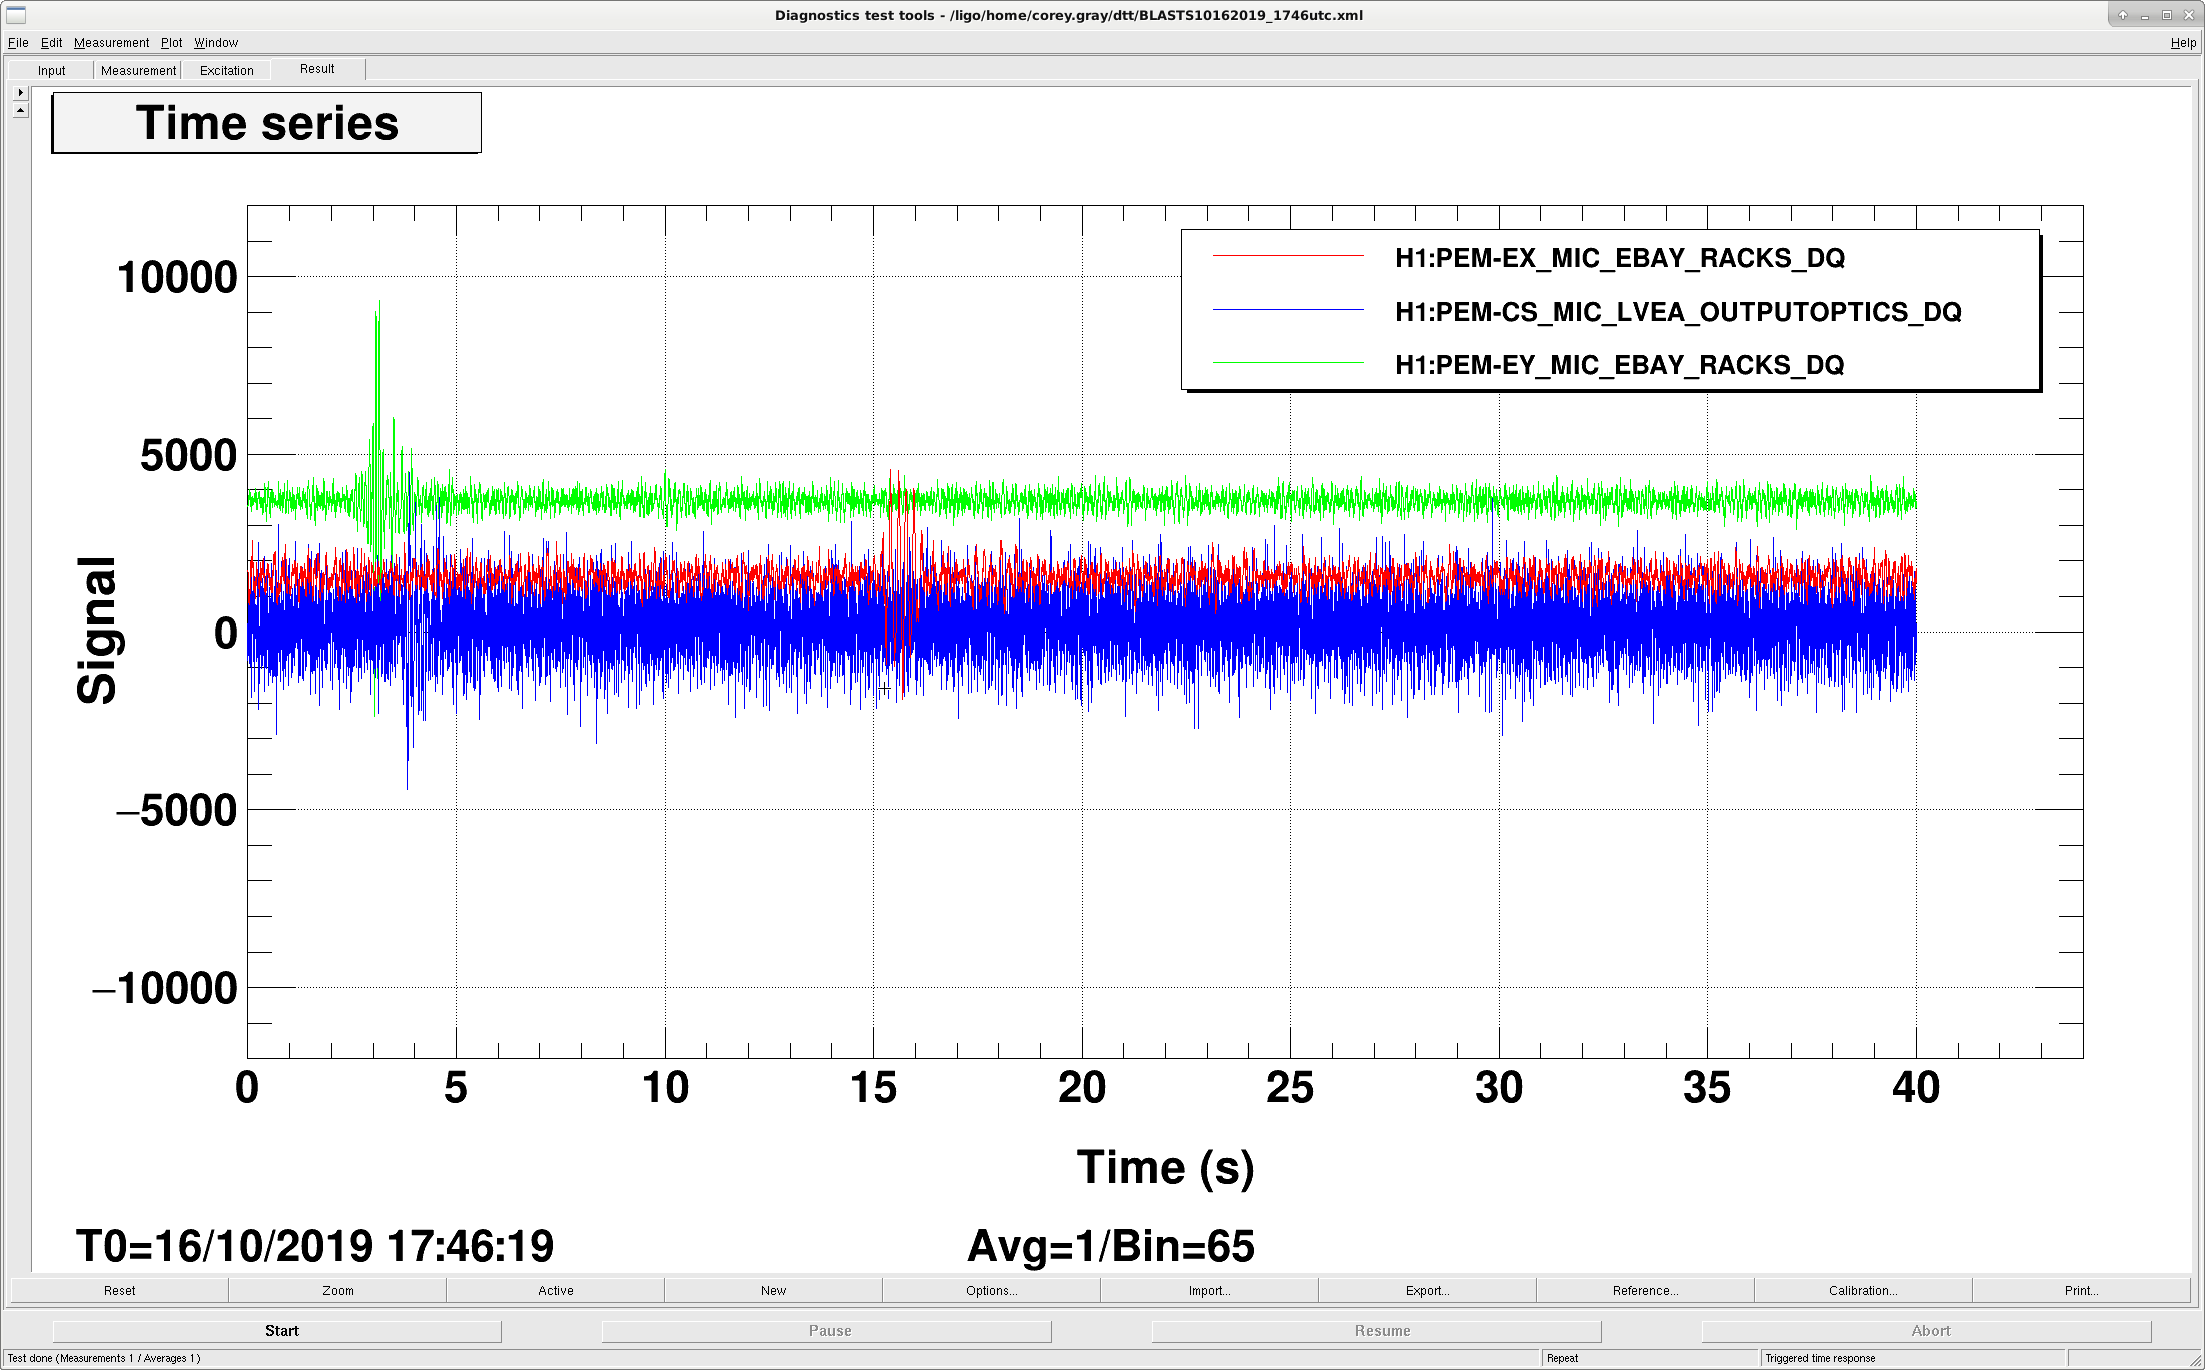
Philippe (chatted with him to see what he found out) will post a more thorough entry about today's seismic blasts, but wanted to post plots of microphones during (3) of the events we heard in the Control Room:
(channels are a little shuffled because I used which mic channels looked best for each event)
GPS = 1255291770: stepped ETMY RH power from 1W to 1.8W (increase of 0.5W per segment).
1255293450 - Ring heater set back to 0.8W total.
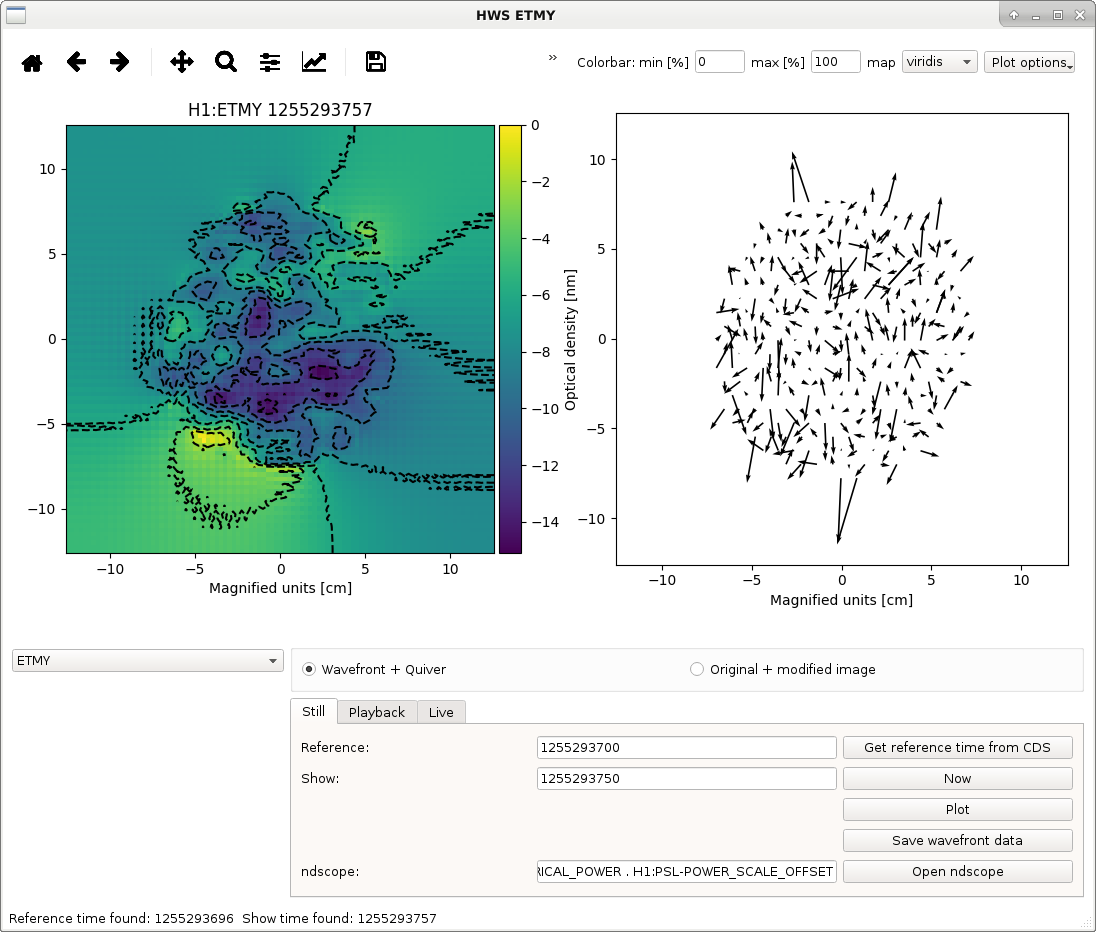
1255293700 - RH set to 4.8W total
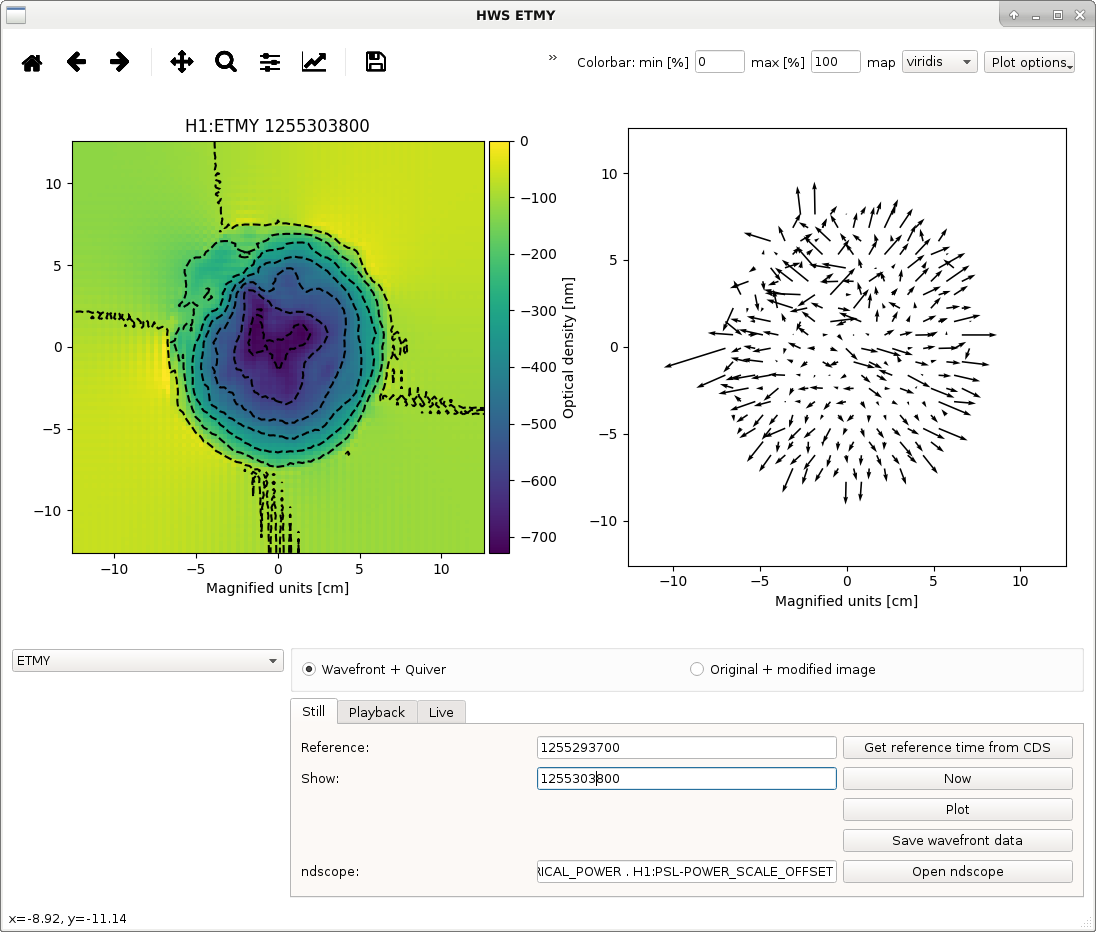
1255303800 - RH set to 0.8W again
Here are some measurements of the RH thermal lens. There is clearly a quadratic lens visible in the wavefront but there are regions of systematic spatial noise in the wavefront - particularly in the top left hand corner and in the center. We're going to attempt to clean these up by tweaking the alignment today.

Using the data collected by the locklost website, I have created some histograms on the locklosses we've experienced durig O3, filtered for different lockloss states/additional factors. The plots are located on my public html, and have been created for three time spans before commissioning month started: one week before, one month before, and for the O3 run so far. They are separated as follows:
H1_duration_*.png: histogram of lock lengths where we were in Observe when lockloss occurred
H1_states_*.png: histogram of states from which we have lost lock
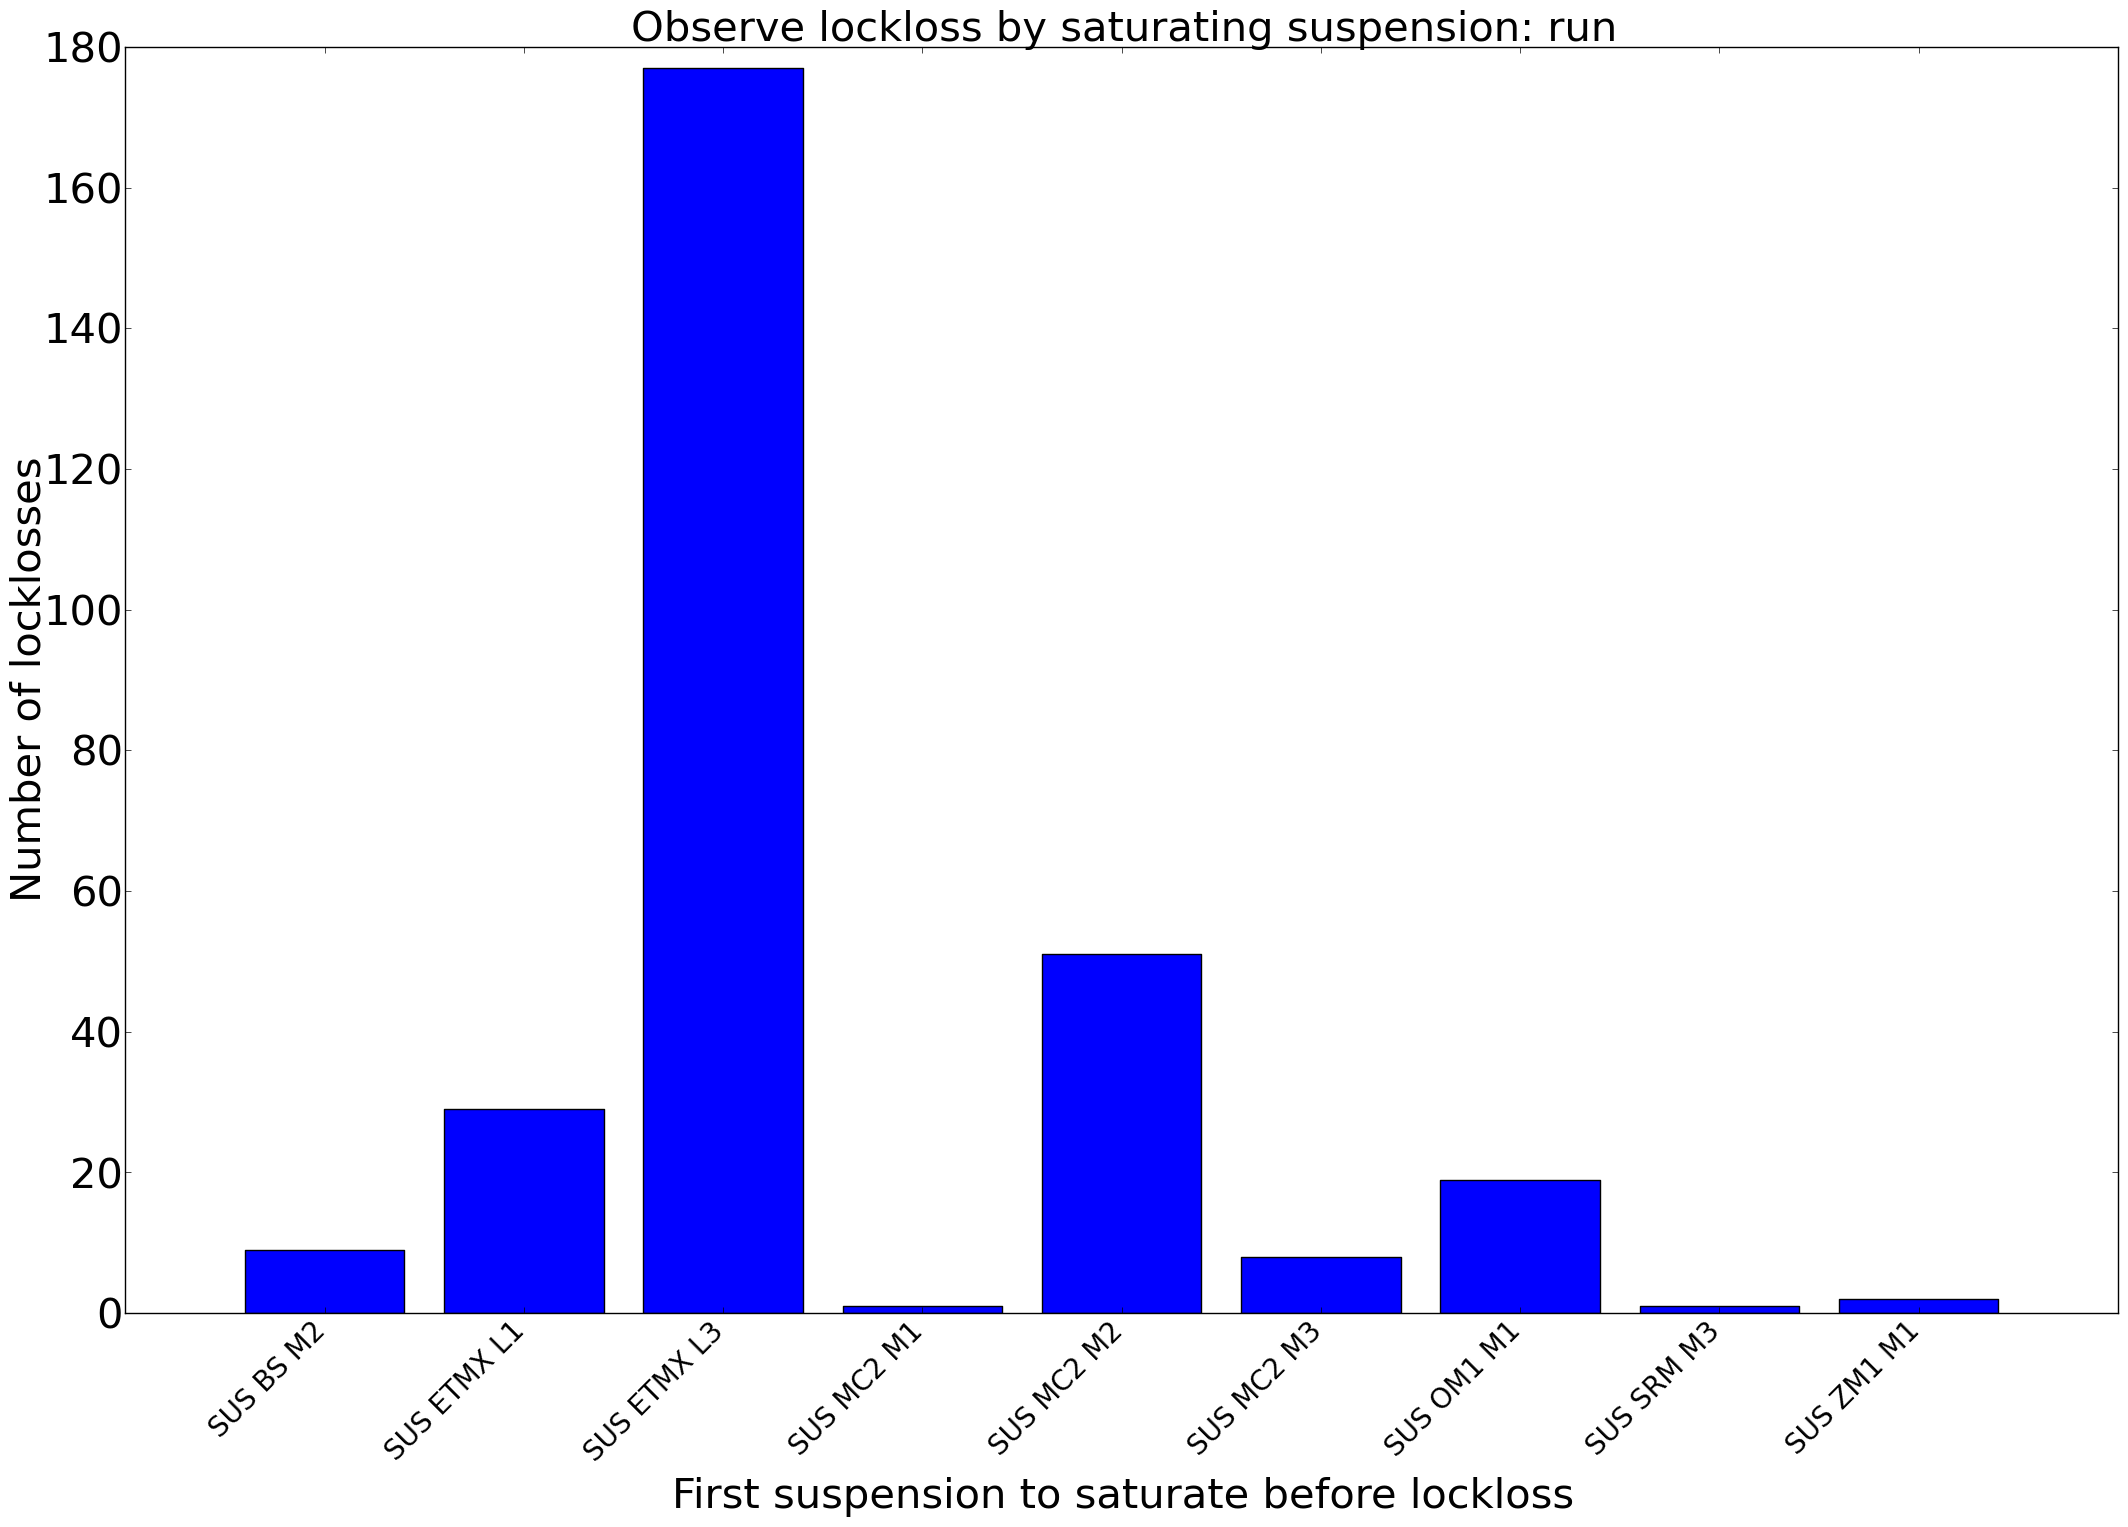
H1_*_sats_*.png: histogram of which suspensions saturated first, from our three most common lockloss states: LOCKING_ALS, ACQUIRE_DRMI_1F, and NLN (in Observing)
With a recent lockloss release/re-run on O3 measurements, these can be filtered further for high ground motion/wind and the other established lockloss tags that have been created. Attached are three plots for the O3 run.
The new tags are a really useful addition to the lockloss tool. Check them out here.
By clicking on this link I could within a few minutes search for all of the locklosses from nominal low noise (guardian state 600) from the start of O3 until now and see how many of them have various tags.
I'd also like to highlight that it is worth taking an extra look at some of the plots that Niko has added in his directory linked above. For example, but comparing the state from which we lost lock over the last month to the same plot for all of O3a, you can see that the locklosses that happen durring the ASC engagement states (430 and 435) became much more of a problem in the last month of the run, but there were fewer ALS locklosses (15 and 16). Focusing on the ASC locklosses will be helpfull because each of these costs us significant time.
Another interesting point that Sheila brought up that I'd like to explain a little better: "Why do did H1's O3A have almost a factor 2 more maintenance time than in O1 and O2?" She confirms her impression is from information on the time accounting tabs on the summary pages for O3A, O2 and O1. As always, we must take the accuracy of these percentages with a grain of salt, because they are human entered statuses, and the criteria for putting the observatory mode in one state vs. another depends on the human operator corps, and often the lines between categories are blurry. That caveat aside, looking into this a little deeper, recall that "Maintenance" is actually a concatenation of several categories: Calibration, Preventative, Maintenance, and Corrective maintenance. So here, I summarize the data for the three runs: O1 O2 O3 Commissioning 2.8 3.4 3.5 Maintenance 4.4 5.4 8.6 CALI 0.7 0.4 1.1 PREV 1.8 3.3 3.5 CORR 1.9 1.7 3.9 Planned Eng. 0.1 11.9 0.0 ^ Holiday break So the source of the extra maintenance is a factor of 2 more of both calibration time as well as corrective maintenance. The amount of time spent on corrective maintenance is unavoidable / uncontrollable, and the extra time spent on calibration is for two reasons: (1) ER14, the engineering run leading up to O3, was reduced from the 4 weeks (which we had prior to O1 and O2) to 2 weeks (which we sacrificed to spend more time commissioning), and (2) We had several new / confusing new problems with DARM loop that required "more investigation than usual:" (a) the systematic error in the ETMX PUM which we now know resulted from unwanted L2A2L coupling as a result of using IFO spot positions that were "far" away from the optics' geometric center of rotation (because we had point absorbers, which newly started grossly impacting the IFO's control system after we increased both the laser power and the power recycling gain) (b) As a result (we think) of off-center spot positions, and mode mis-match between the arms and the signal recycling cavity, we had compounding effects of a drastically detuned SRC response in the sensing function AND left over impacts of parasitic L2A2L coupling. Seems to all add up, and not actually that we've taken that much longer for "preventative maintenance" [what operators have been coached to put the observatory mode in during maintenance Tuesdays].
[Dripta, Niko]
Dripta and I went to EY to perform an end station calibration after the beam alignment/BS adjustment that happened the day before (see alog 52454). The results show changes between the inner and outer beams that one would expect when the power imbalance is reduced, but the collective ratios are all in line with previous measurements.
Beam alignment on the Rx integrating sphere aperture is the same as after it was adjusted the day before (will post new alignment pictures once they're sent to me).
Corey transitioned the LVEA to Laser Hazard
Yesterday, 15 Oct 2019, I added beam tubes to IO GigE1 and IO GigE2, in order to shield their sensors from room lights. Typically when the PSL is in Commissioning and the lights are on in the enclosure both of these cameras are completely saturaded by the room lights, even when only one light switch is on, and two light switches are off. The new beam tubes improved the camera performance, enough that both beams were visible with only one light switch on. The GigE camera mounts are very secure, so I don't anticipate that either camera shifted in position or angle, but because the beam tubes are attached to the front of the cameras, there is a possibility that the weight had a small effect on the alignment. There is limitted space for a beam tube on GigE3, and the beam remains visible even with all three light switches on, so there was no physical change to this camera, however, in order to get a beam profile for the IMC_IN beam, the Bottom Periscope Transmitted Beam, the steering mirror to GigE3 was adjusted for the beam scan and then adjusted back for the camera, so the location of the beam spot on GigE3 changed.
Images attached show GigE1 and GigE2 with their new beam tubes.
- Cheryl, Ethan, Jason
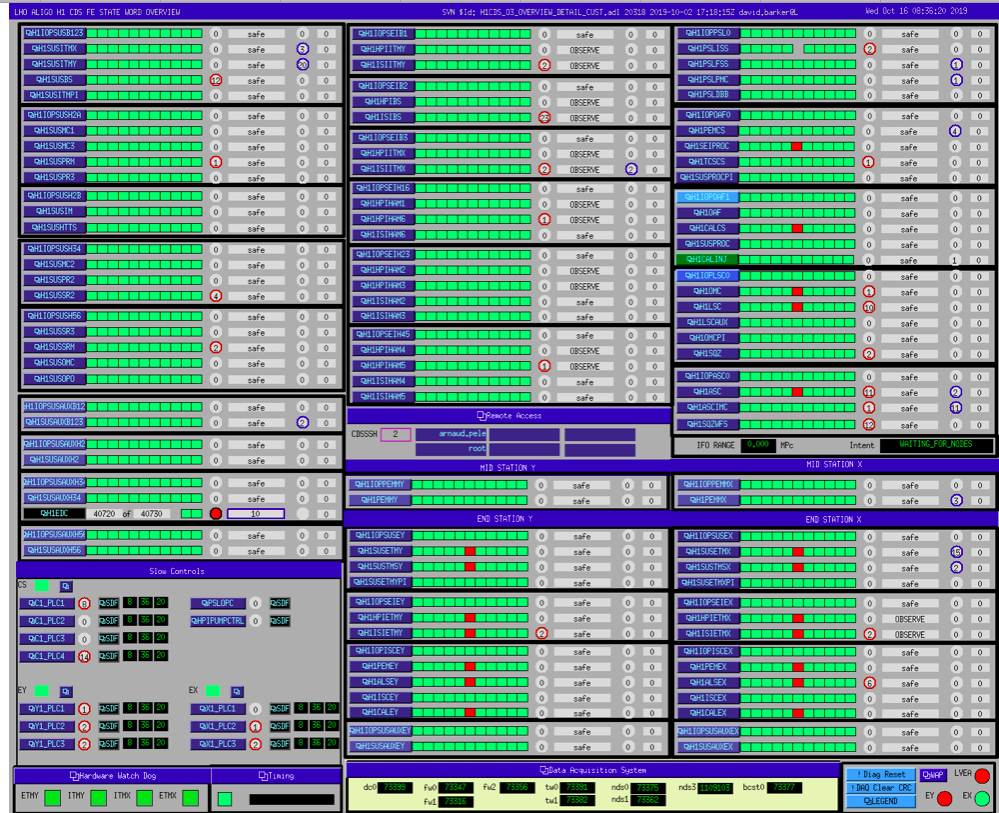
Current status of the CDS is:
The long-range-dolphin EY problem is being investigated. While this system is down, various models are showing IPC errors. Also, because the long-range EPICS IOC is not running, h1edc is reporting 10 disconnected channels.
h1iopsusauxb123 had an ADC error at 04:18 PDT this morning. This was a transient glitch, and the IOP resynced itself to the ADC data stream. I have cleared the latched STATE_WORD bit. This is the second SUS-AUX issue we have seen in the past three days which was not caused by CER activity.
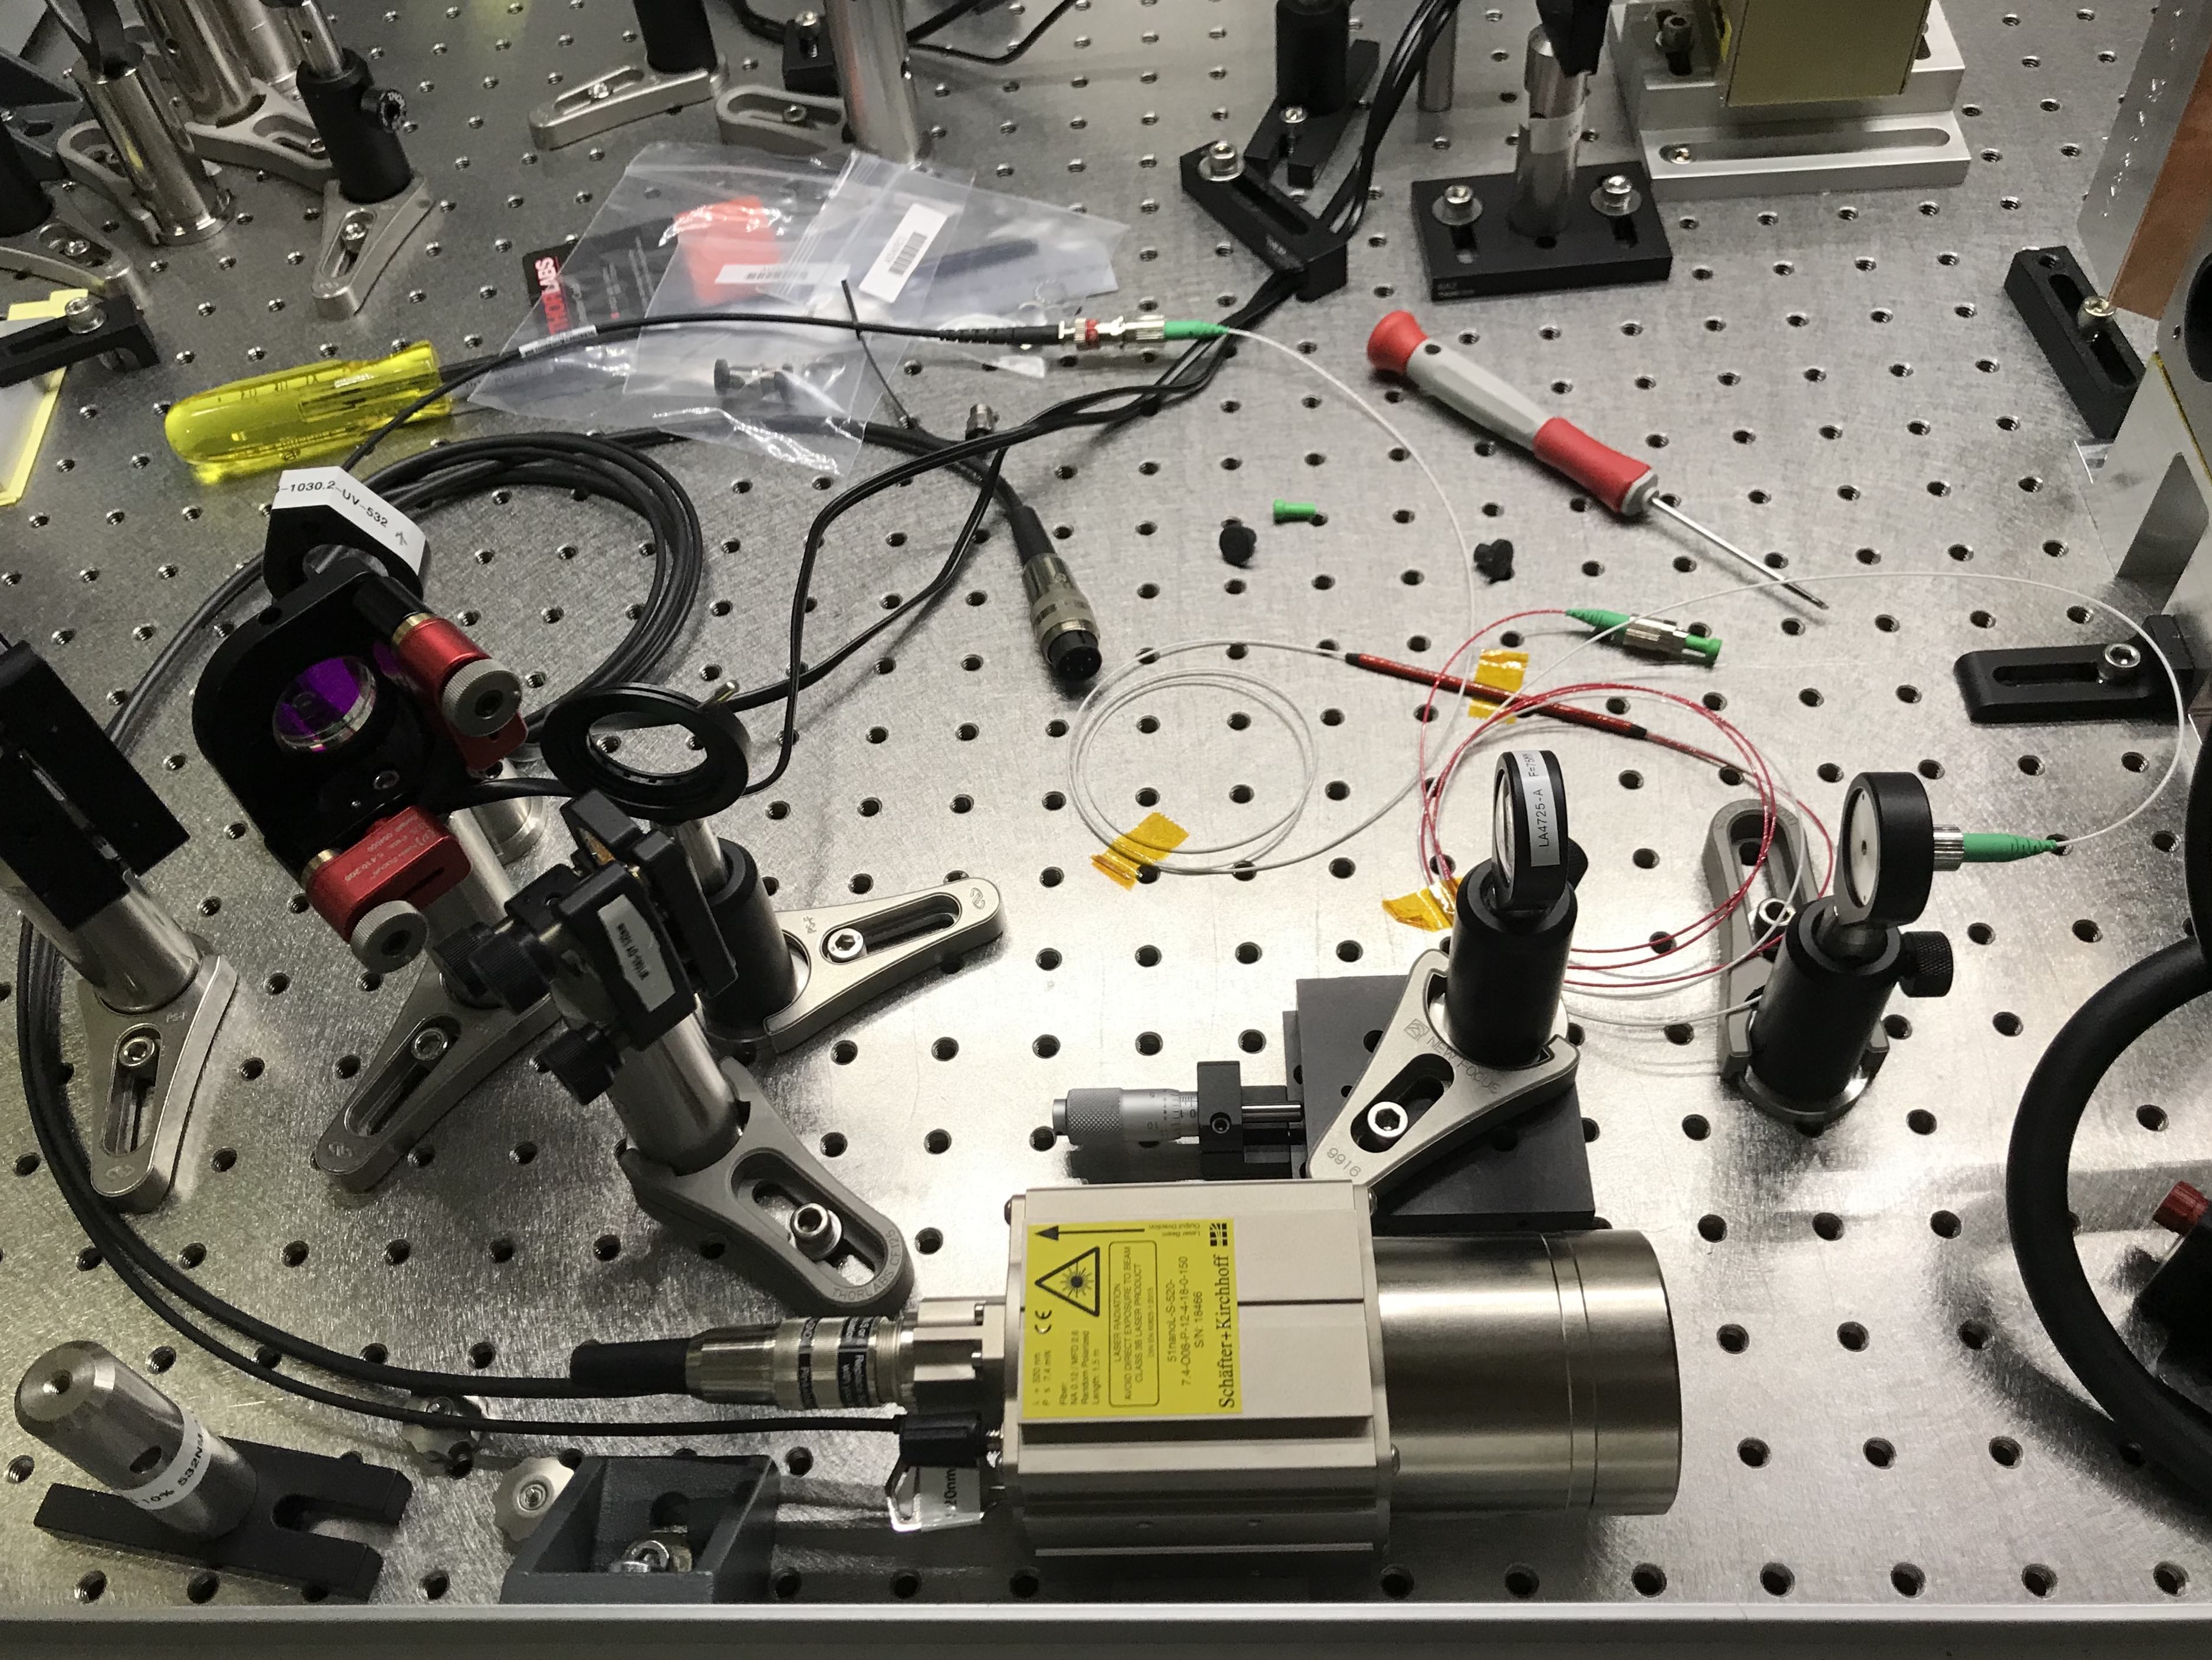
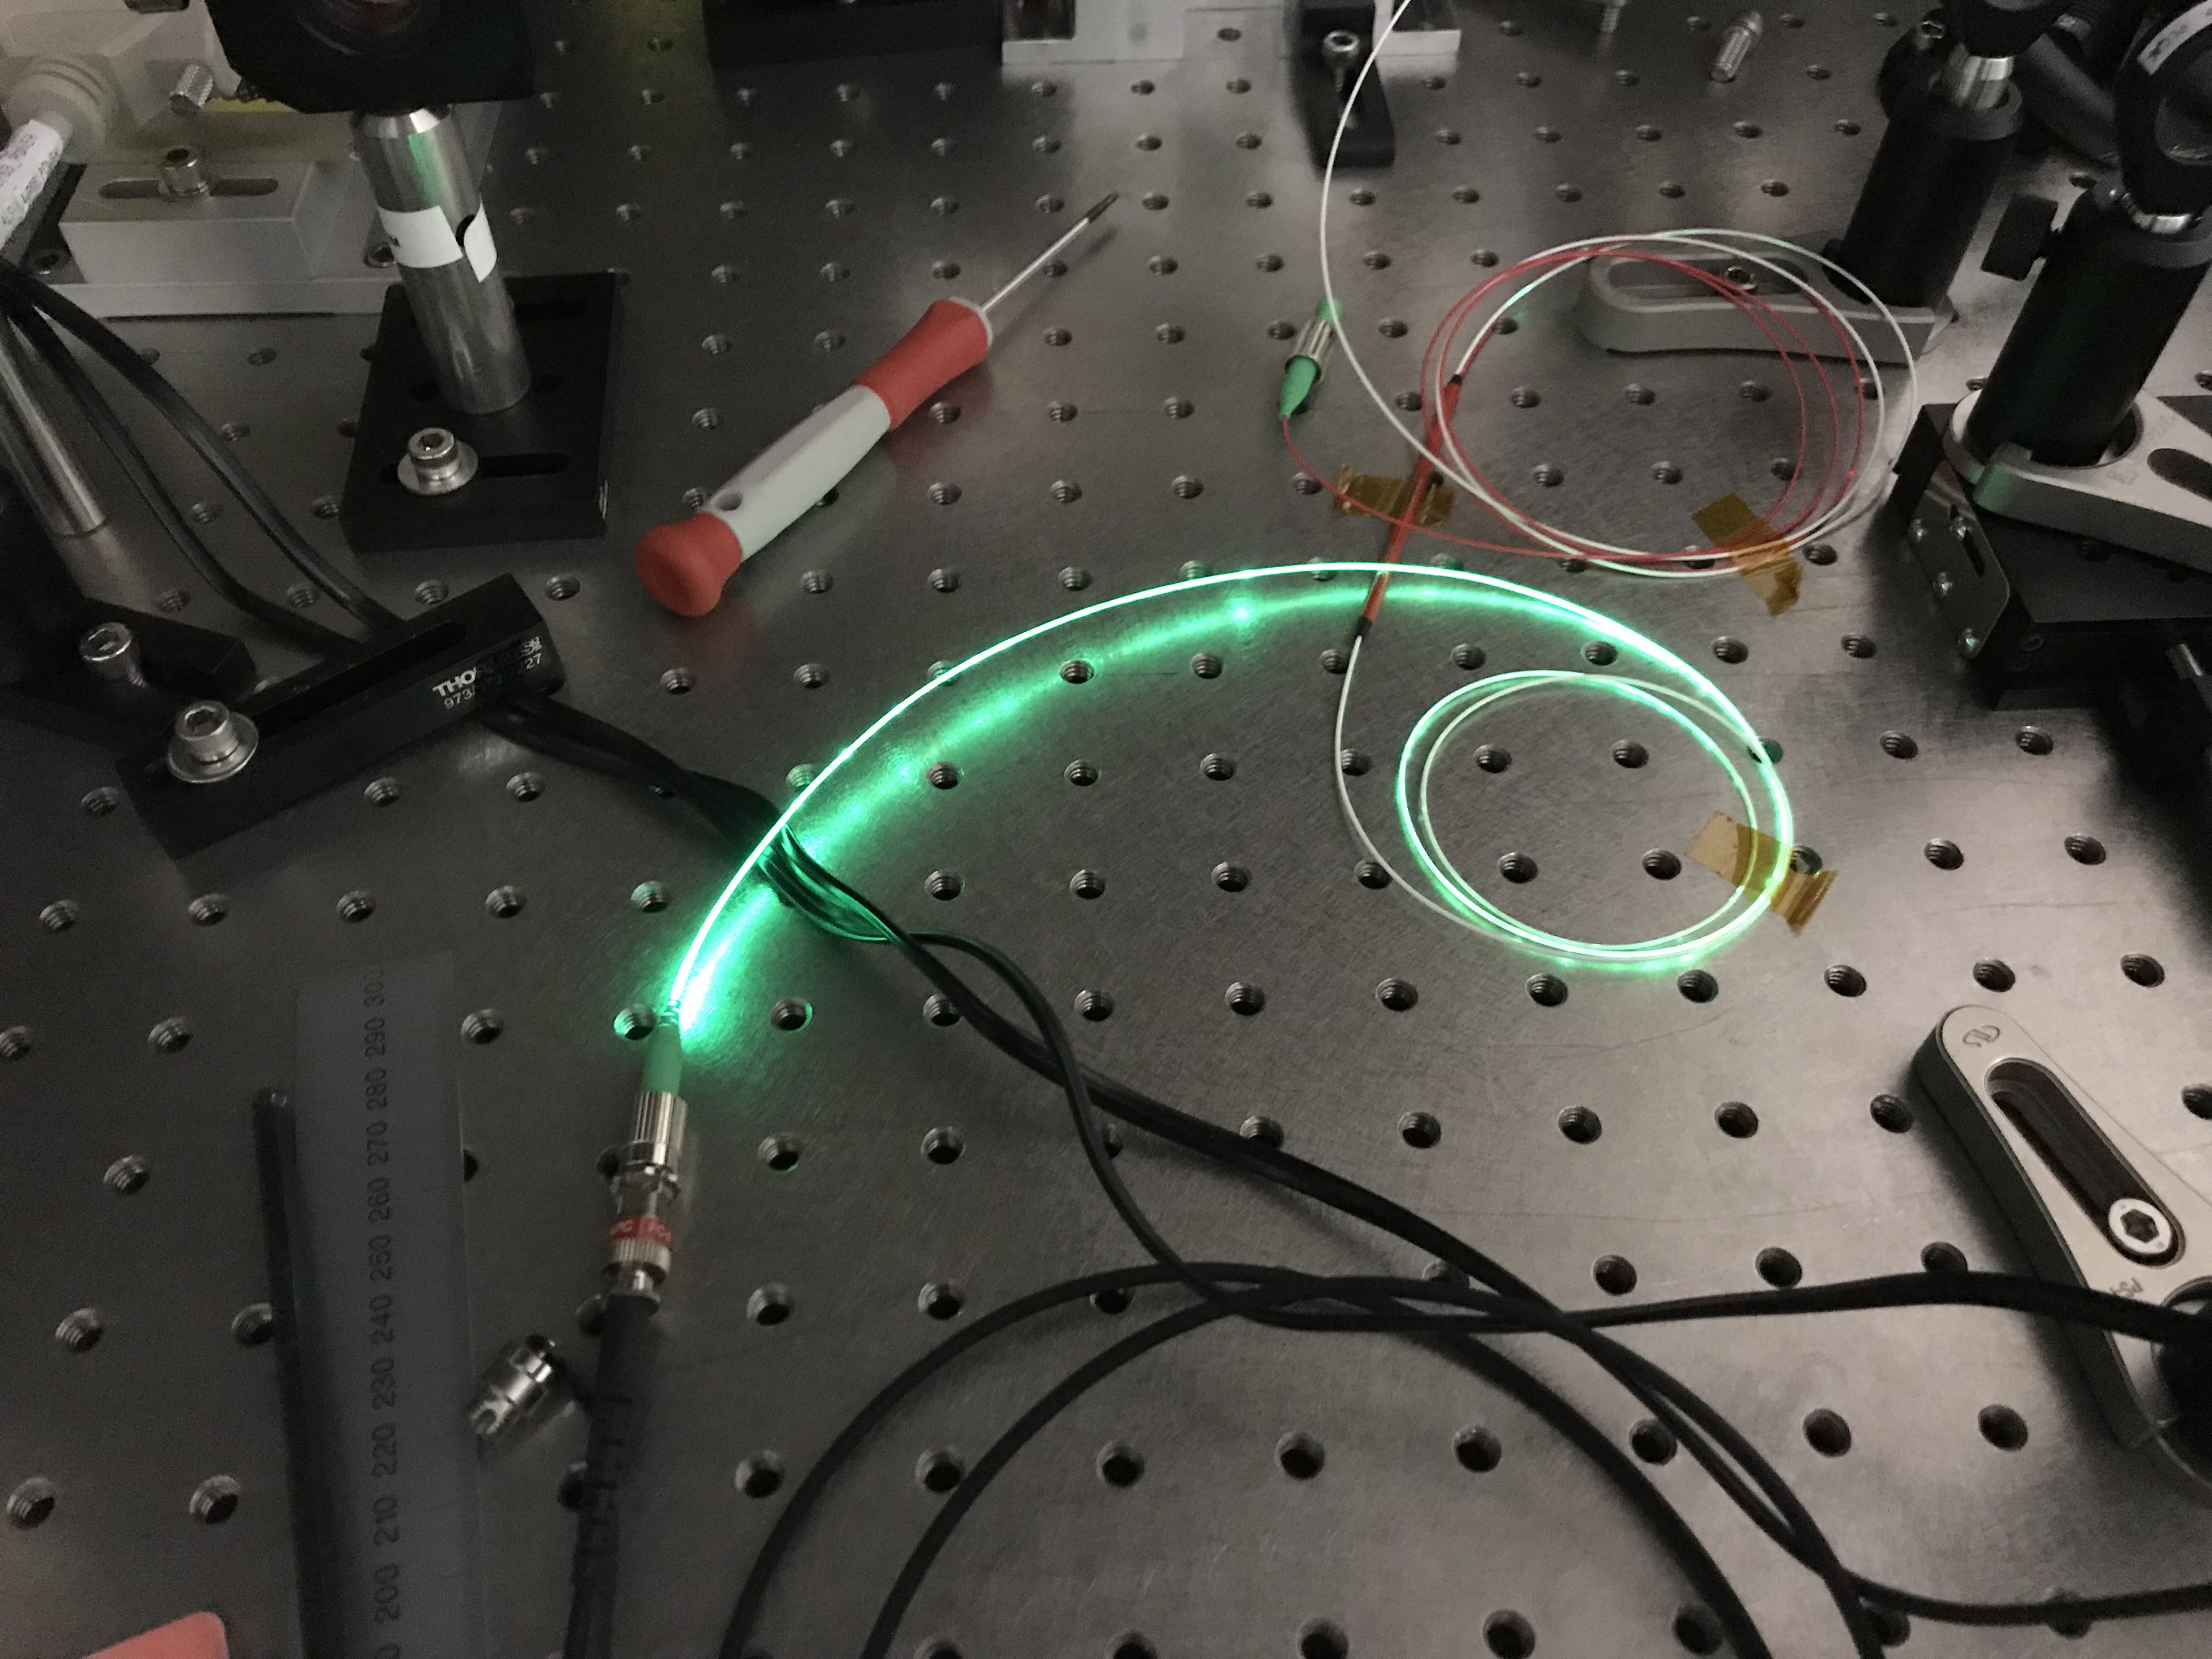
Converted 51nanoL to Class3R by injecting it directly into fiber-coupled splitter. Output power of each port is 0.17mW due to excess insertion loss from FC/PC coupler instead of FC/APC coupler. Expected output power from each port is 2.5mW at 520nm.
1118 - At ETMY, getting set up on go onto ALS/HWS table. ALS laser is OFF. Using T1900654 as guide for work. On table with fan on.
1123 – ETM HWS MEDM screens have reverted to old versions with no control of LED light source.
1132 – Adjusting the launch irises to be centered on the existing HWS beam
1136 – Lens 1 (closest to ETMY): PLCX-50.8-1030.2
Lens2: PLCX-25.4-1030.2
Lens3: PLCC-25.4-257.5
1137 – Distances between optics
LPMtoPBS: 305mm
PBStoM1: 65mm
M1AtoM1B: 113mm
M1BtoM1C: 25mm
M1CtoL1: 83mm
L1toL2: 610mm
L2toM2: 38mm
M2toM3: 67mm
M3toM4: 662mm
M4toM5: 68mm
M5toL3: 261mm
L3toM6: 323mm + 3mm BS
M6toHWS: 629mm
1149 – Summary
LPM to L1: target: 570, measured: 591
L1 to L2: target 610, actual 610
L2 to L3: target 1079, actual: 1096
L3 to HWS: target 903, actual 955
1153 – Removed existing LED source and existing unlabled lens (which looks to be about 120mm focal length)
1207 – Added and labeled new f=75mm collimating lens
1227 – Laser on table and 50/50 coupler installed. Final version should be off-table and in a box that converts it to 3R with a single mode fiber output coupler.
1251 – Laser going through optics. Gets elliptical if collimating lens is twisted.
1303 – Got return beam from ETM. Still need to collimate outgoing beam and image correctly.
----
1519 – Back at ETMY. Going to measure beam profile and beam convergence.
Distance from source to lens L3
TOTAL = 863mm
Adjusting beam from source to converge at a point 91mm past the lens L3
Using beam scan
1544 – Cleaned up beam on BeamScan to be centered in aperture
Looks single mode
Measurement 1: translation stage = 2.62 units
W1 = 6.8mm, z1 = 327
W2 = 5.5mm, z2 = 505
Delta = 7”
Puts focus 395mm past L3
Measurement 2: TS = 3.00units
W1 = 6.79, z1 = 327
W2 = 4.45, z2 = 505
Puts focus -20mm past L3
Suggests going to 2.90 units
Measurement 3 = 2.88units
W2 = 4.82
W1 = 6.86
Puts focus 58mm past L3
USING this
1603 – now adjusting the aligment so it’s centered on the optics
Looks quite large going through the iris on the periscope
1618 – got return beam on HWS
Nominal solution for HWS imaging of test mass (based on measured distances between lenses this is an estimate of how much we need to move the HWS along the optical axis, DZ, to image the ETM onto the HWS)
DZ nominal for HWS = -176mm, approximately 7”
Still a lot of noise on return beam. Adding a 2" beam tube (snout) onto the HWS cut down on a lot of ambient light coupling into the HWS.
Did basic test of imaging by looking at shadow of AERM move as we pitched the ETM. Try to do proper imaging tomorrow.
IO Path images updated with layout and optic identification, added beam profile locations.