TITLE: 09/17 Owl Shift: 07:00-15:00 UTC (00:00-08:00 PST), all times posted in UTC
STATE of H1: Preventive Maintenance
INCOMING OPERATOR: Patrick
SHIFT SUMMARY: locked most of the shift, lockloss at 14:28UTC due to EQ, Maintenance started early
LOG:
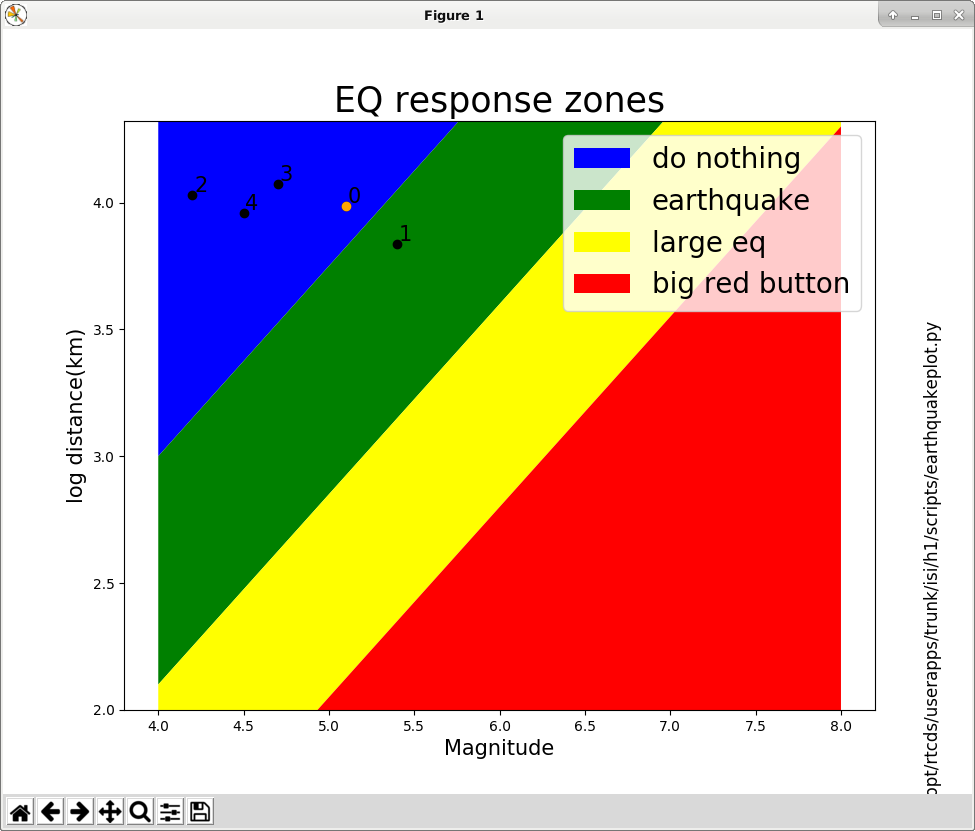
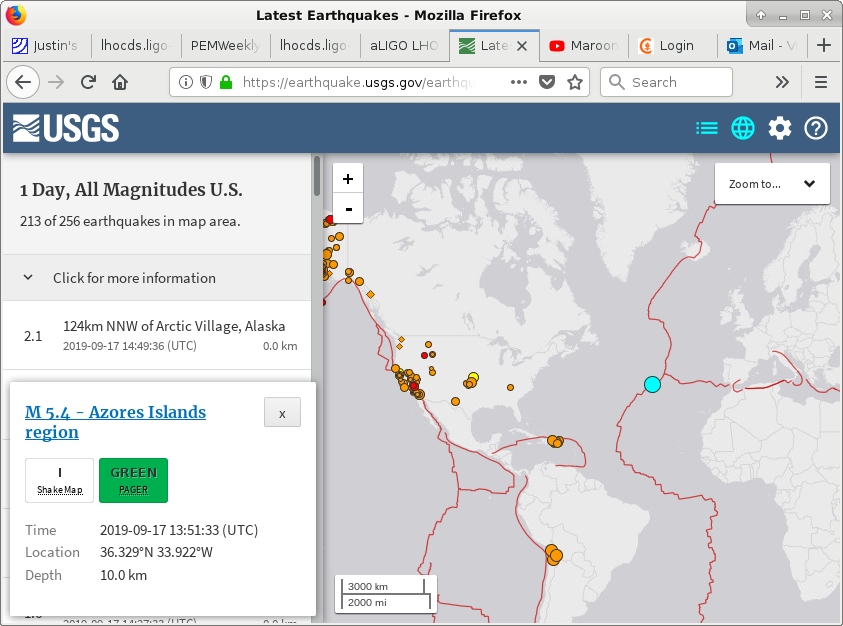
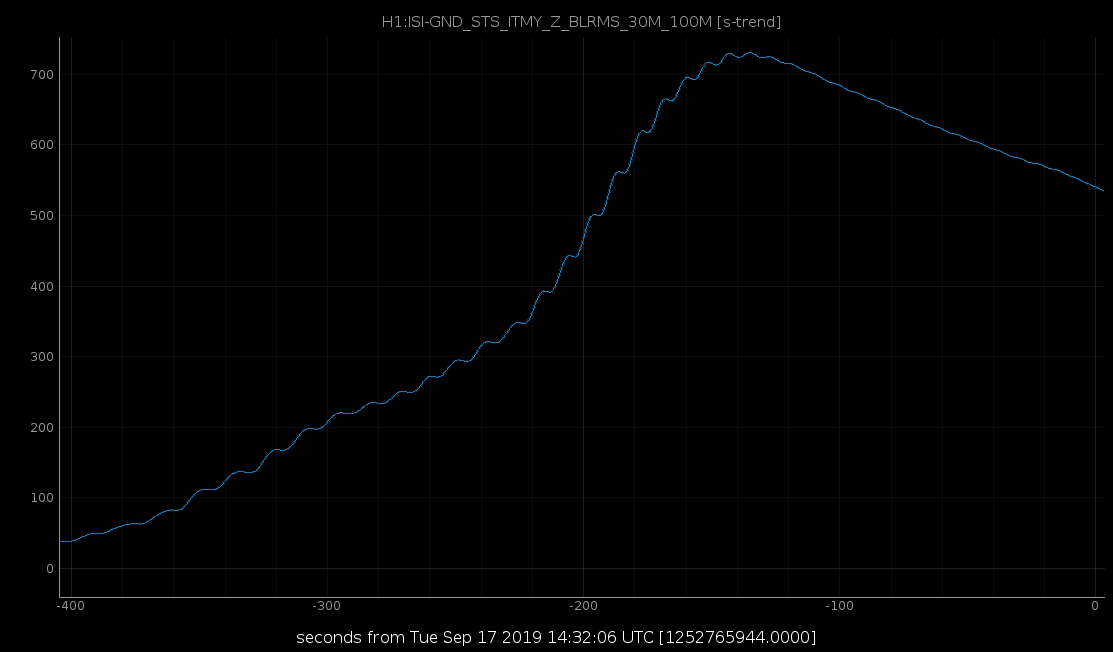
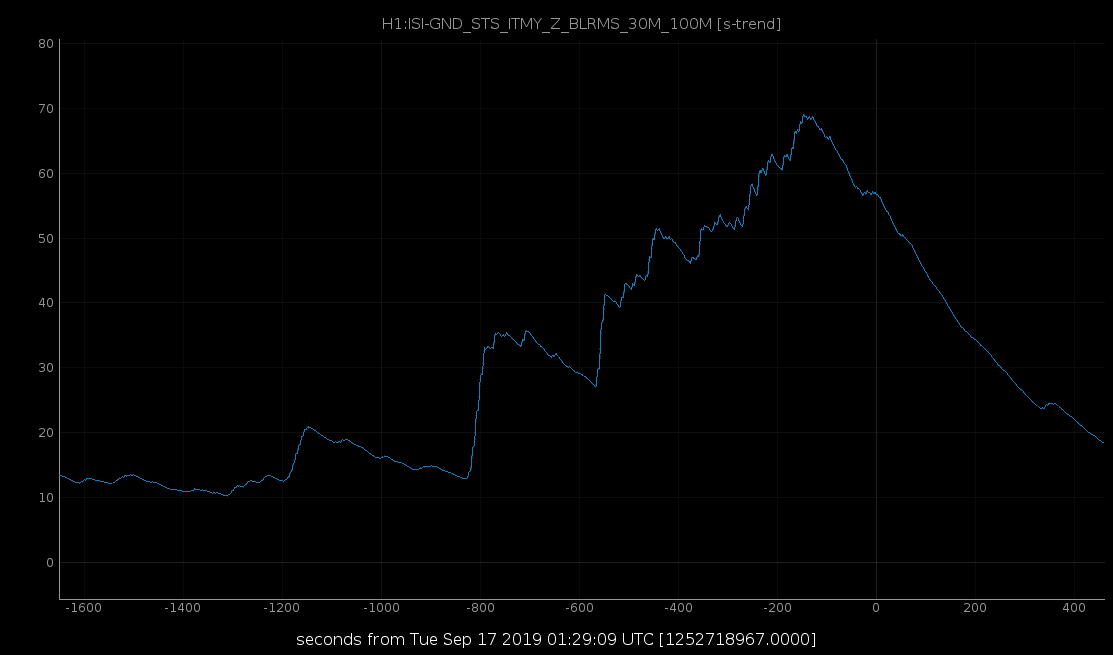
Maintenance started early, after a M5.4 EQ from the middle of the Atlantic knocked H1 out of lock.
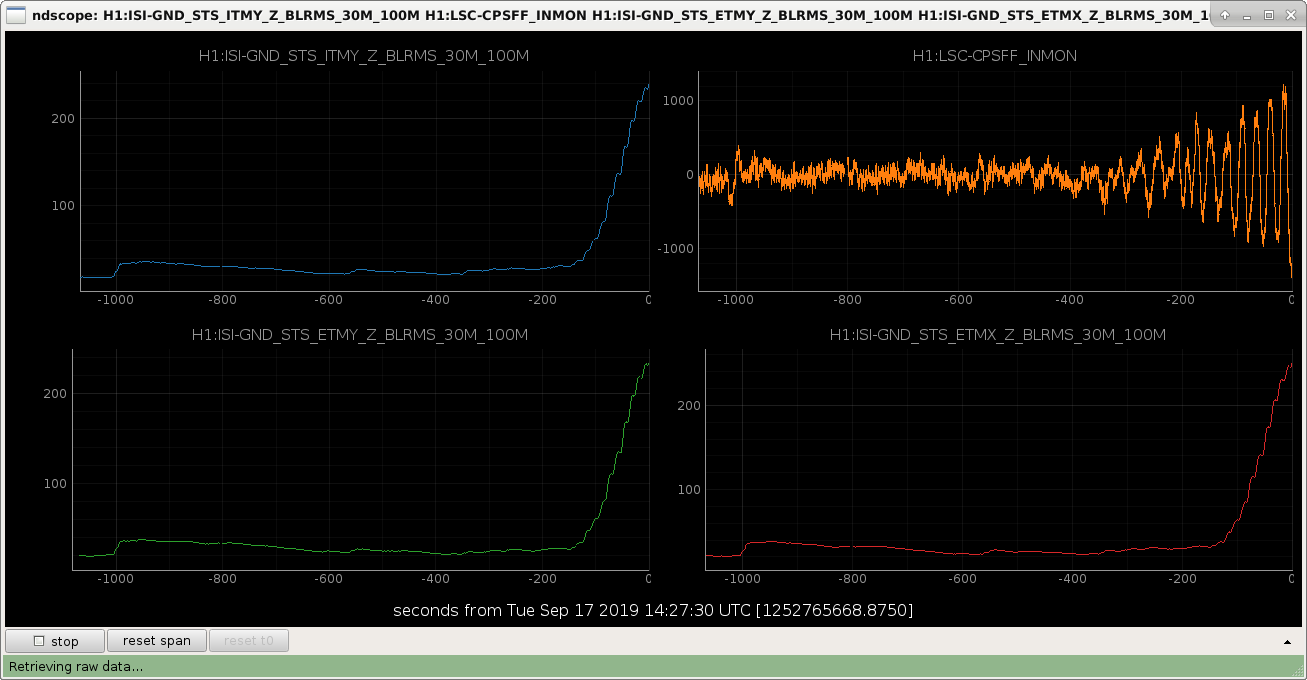
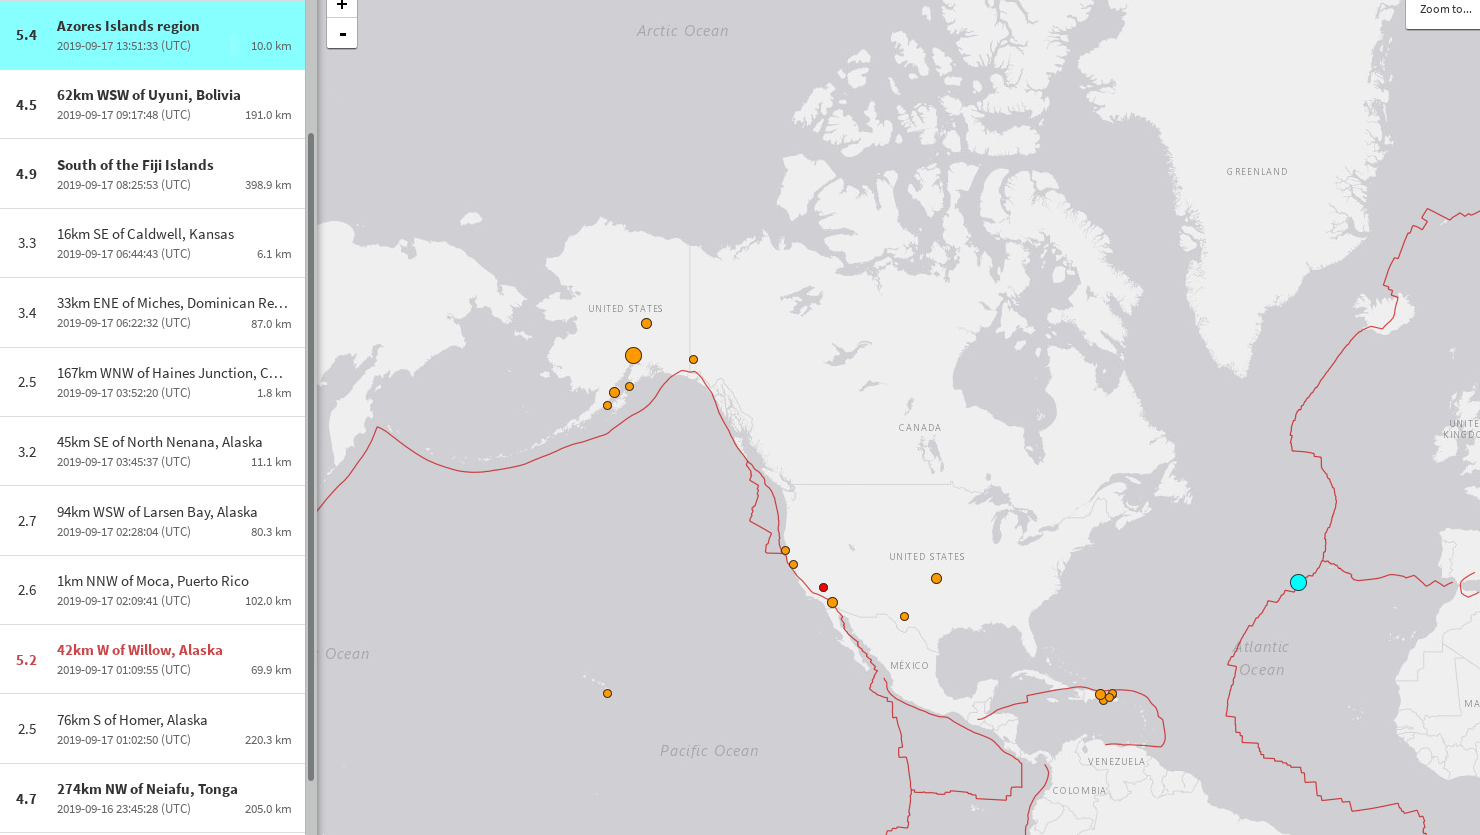
Interestingly, we lost lock from a 5.4 in the mid-Atlantic around ~14:00 UTC while barely seeing a 5.2 in Alaska at around 01:00 UTC.
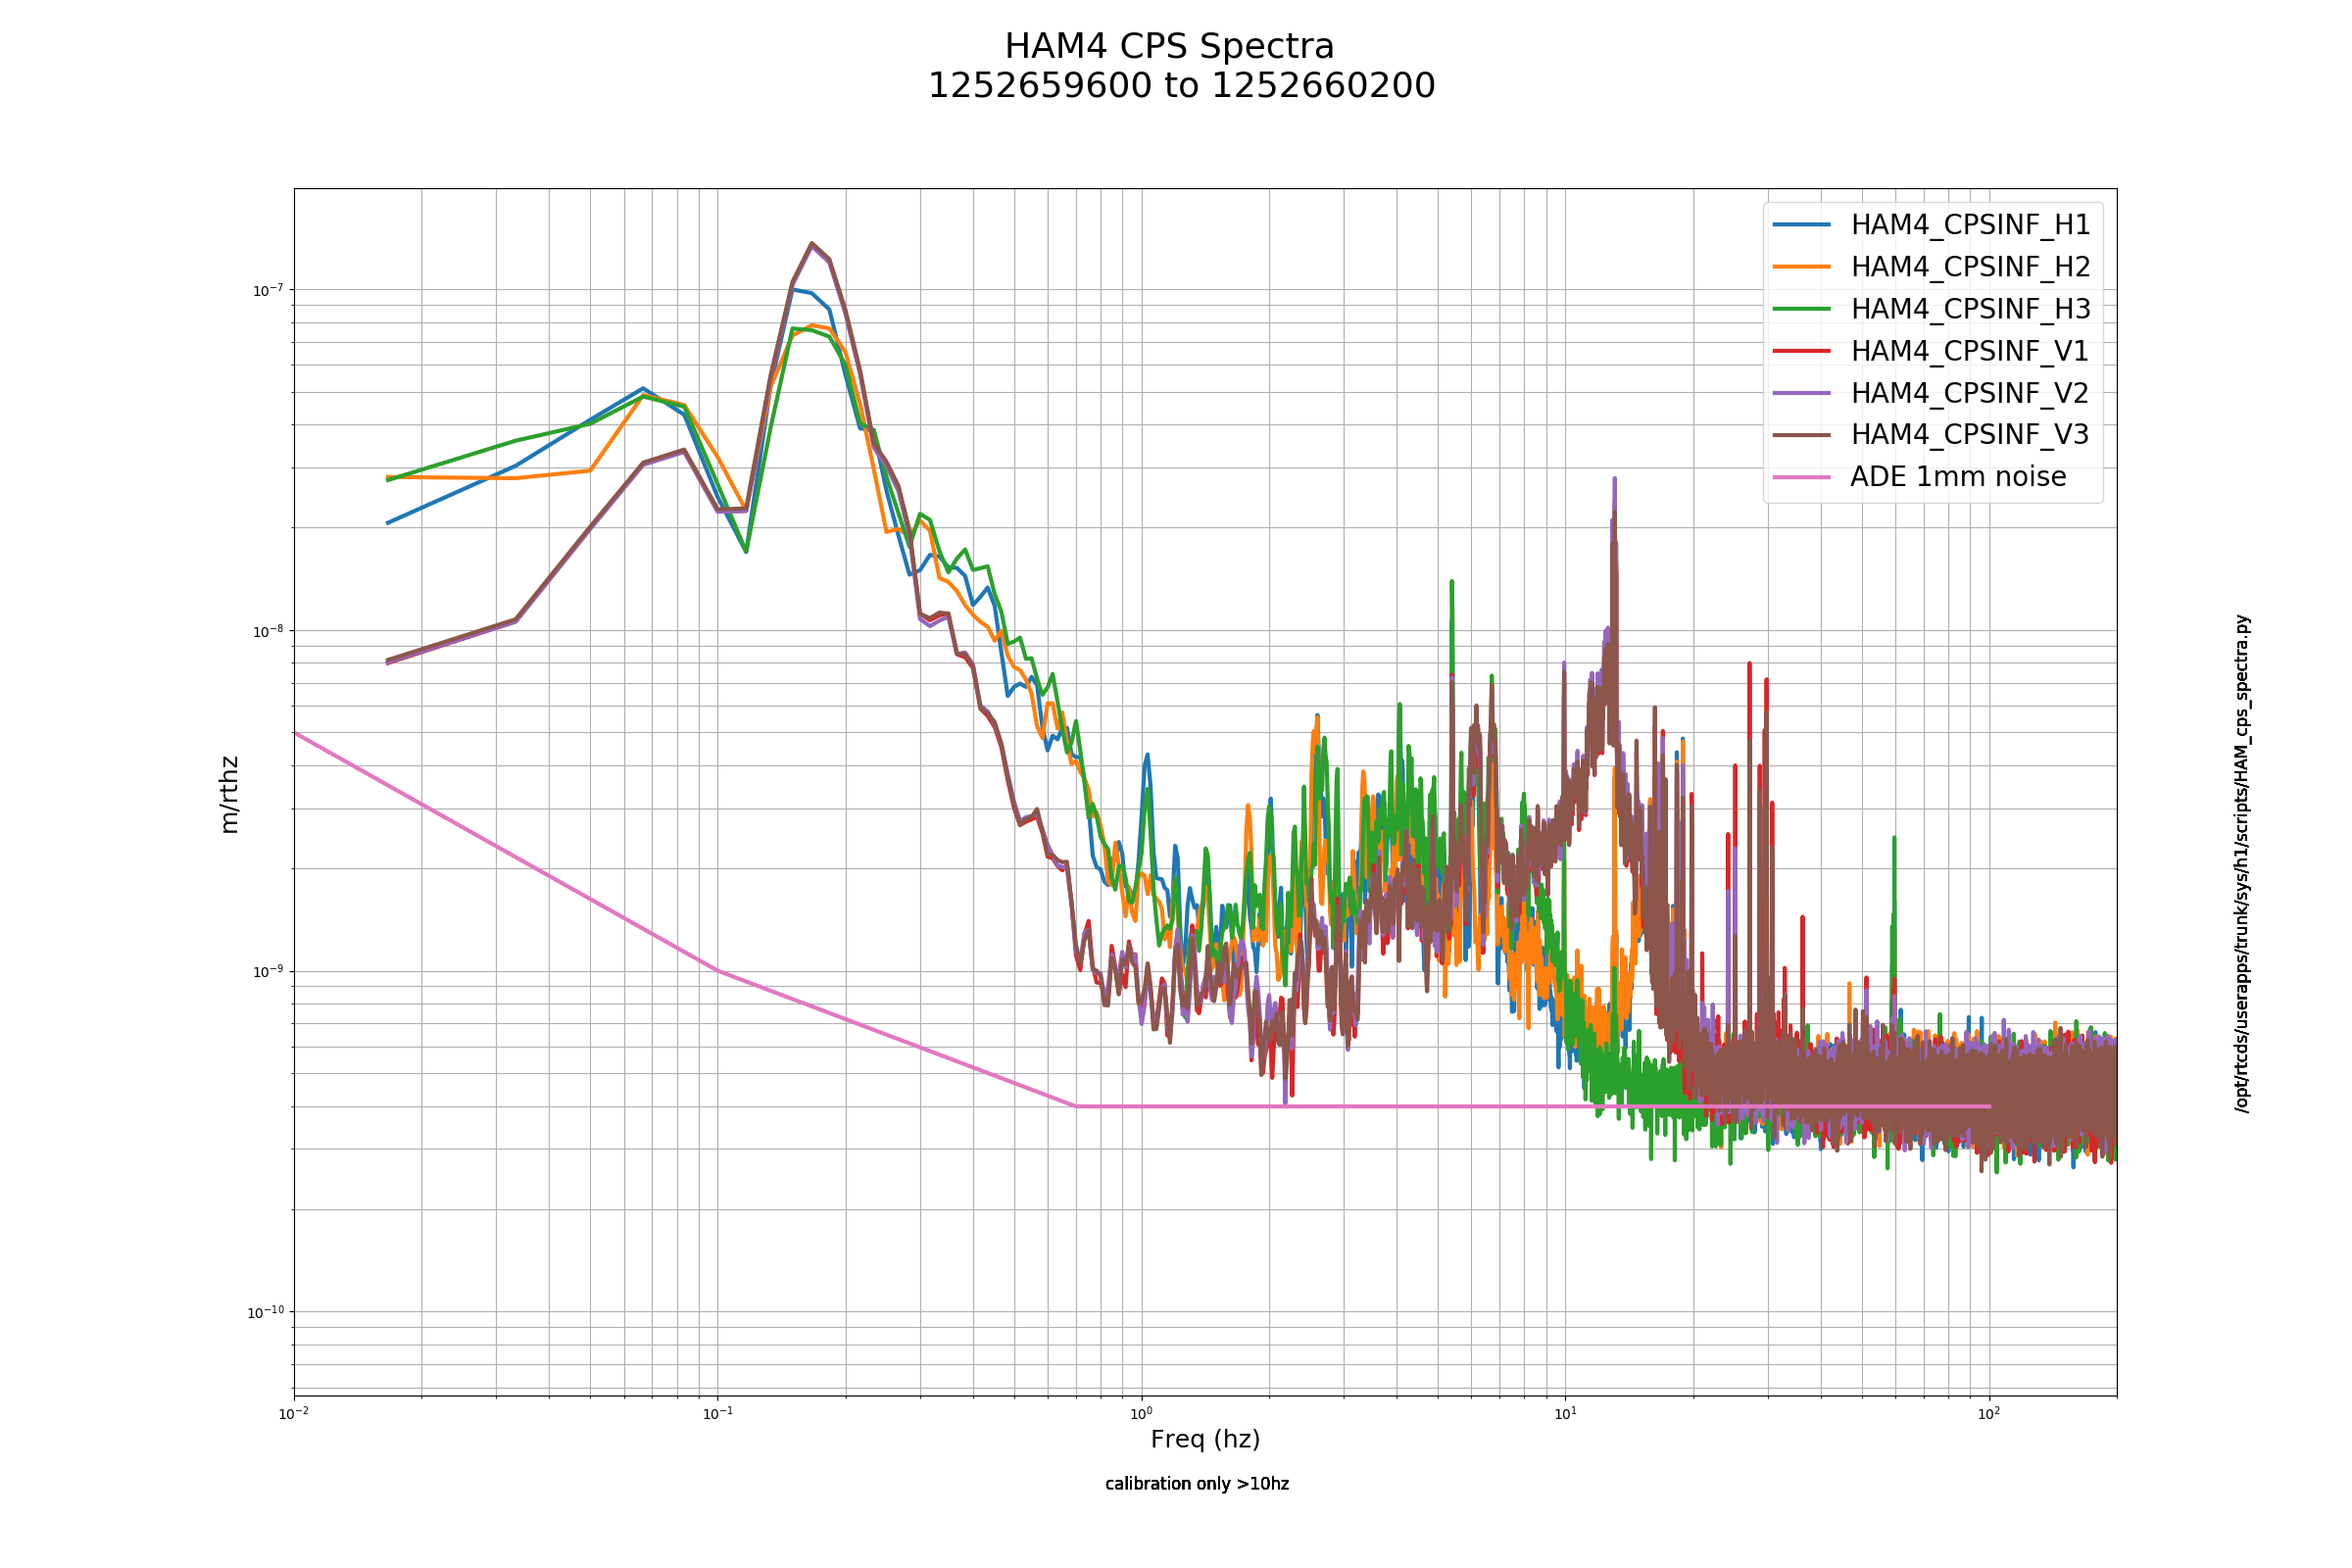
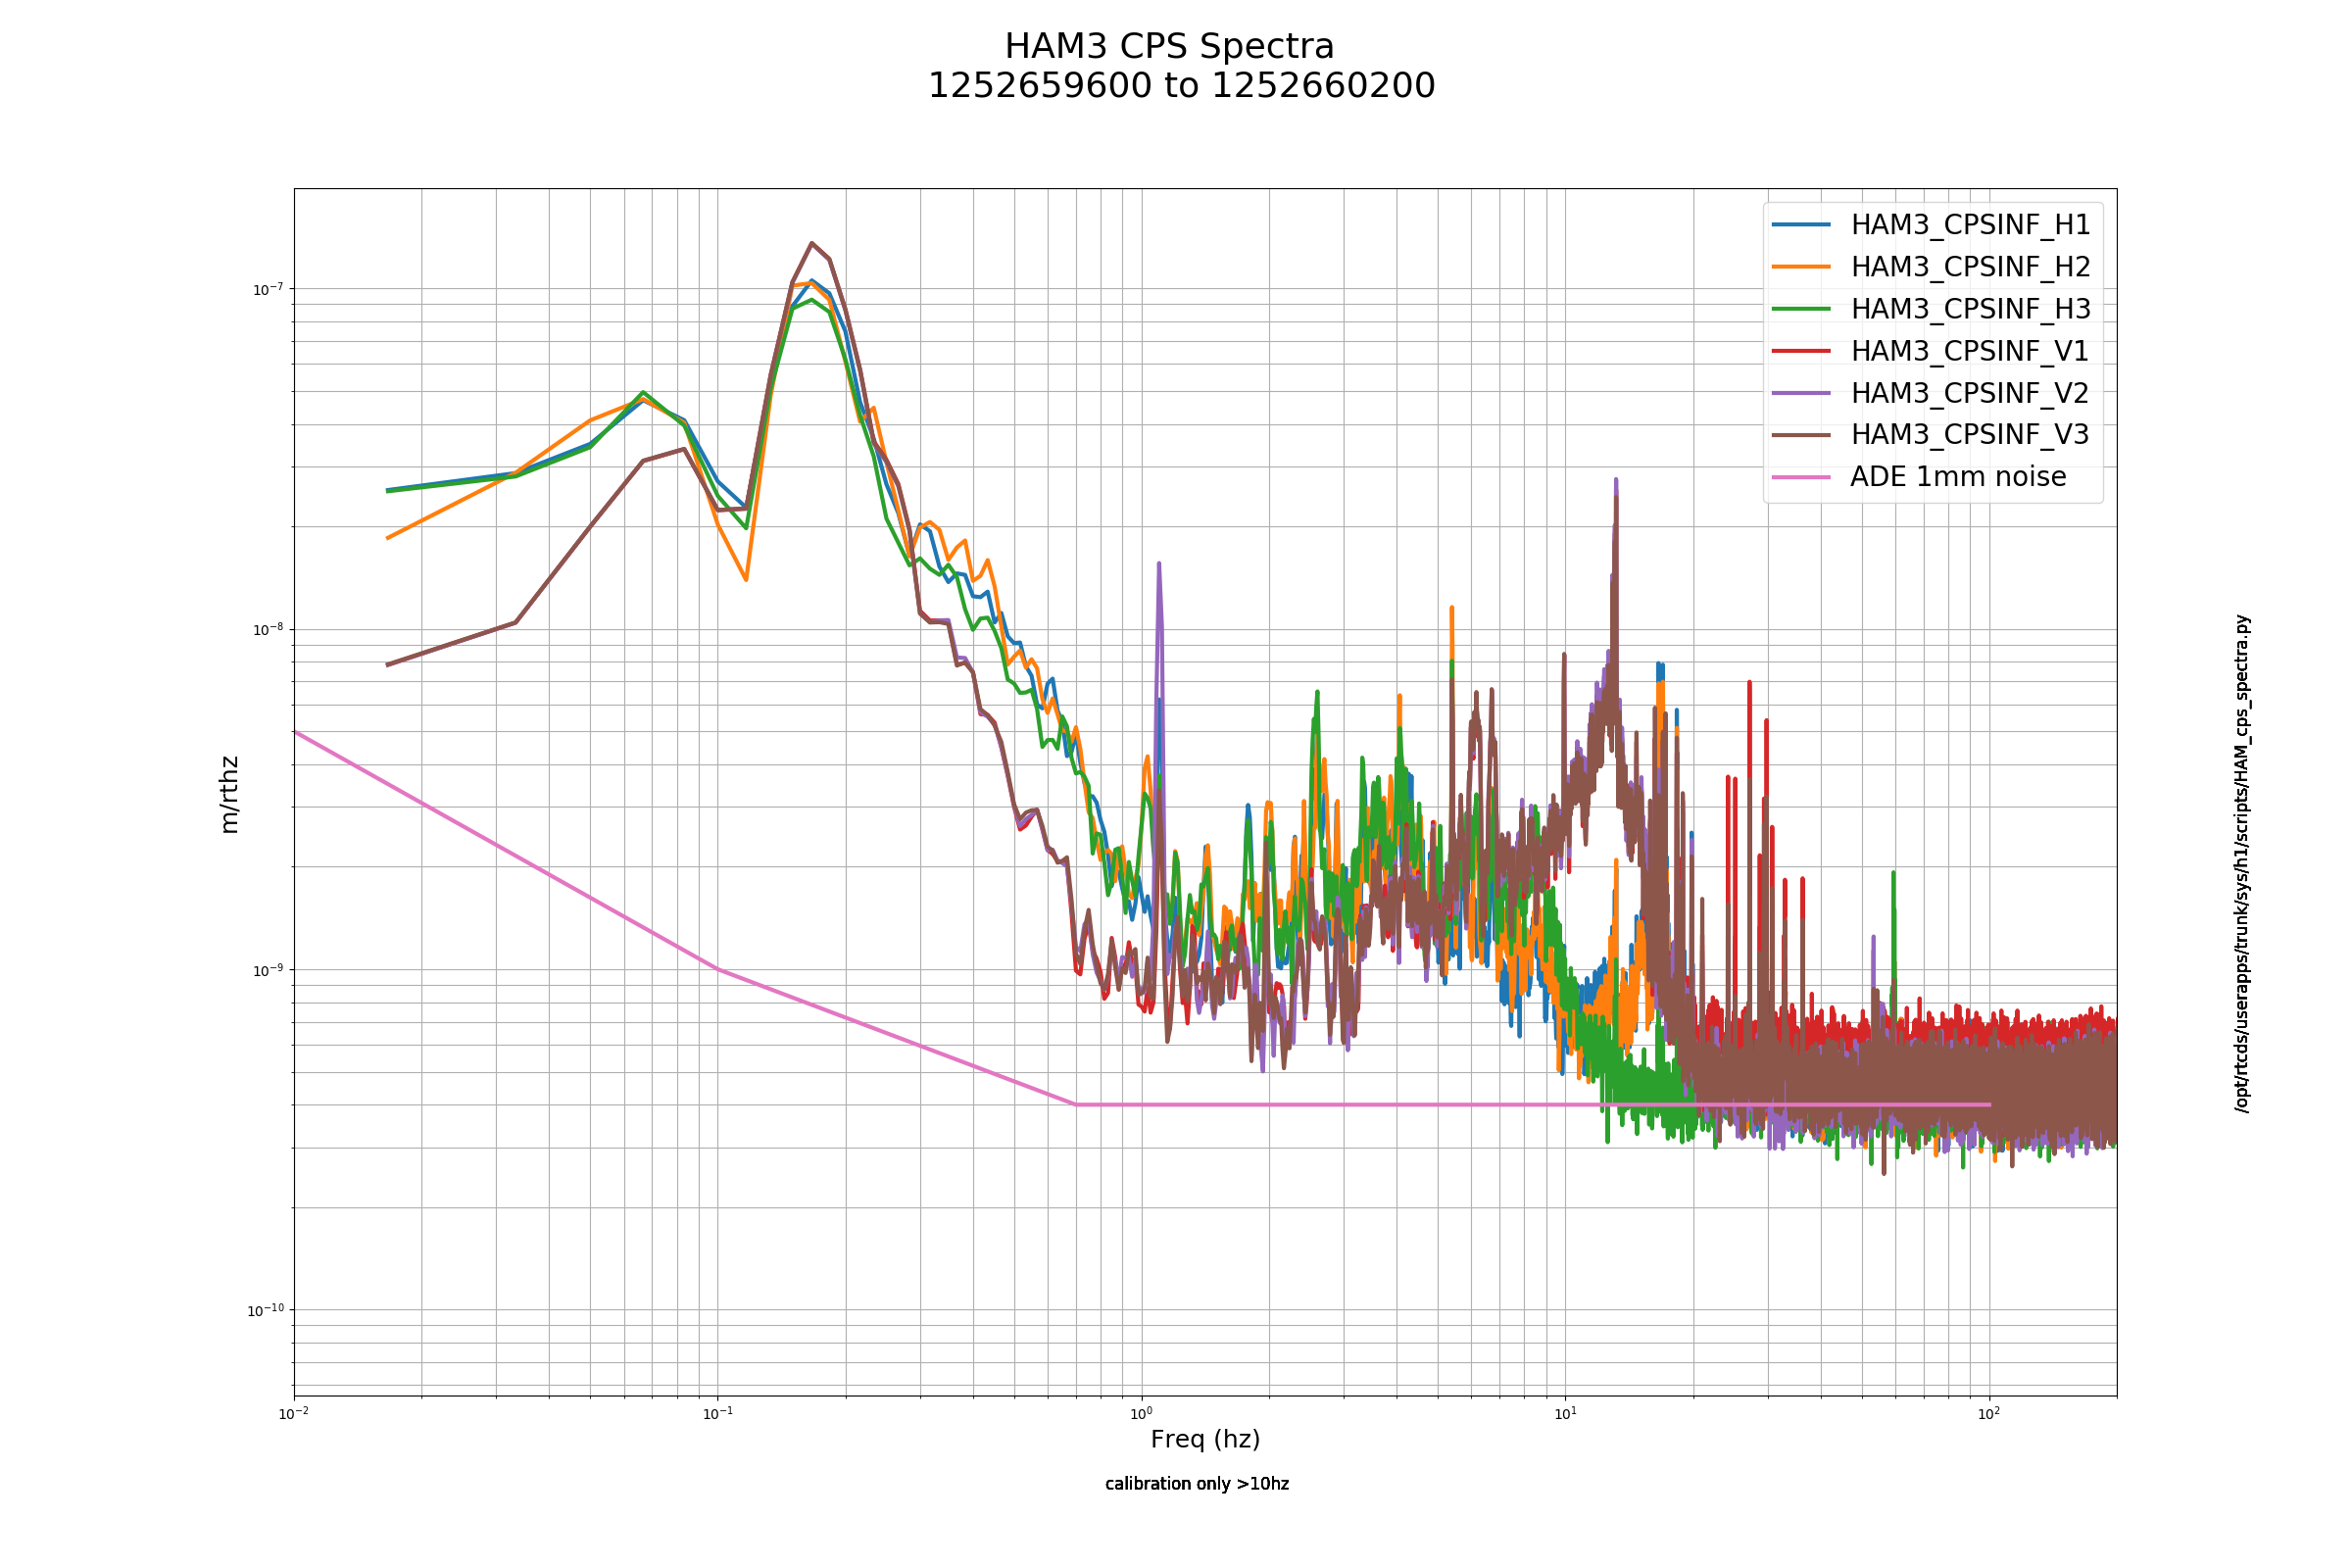
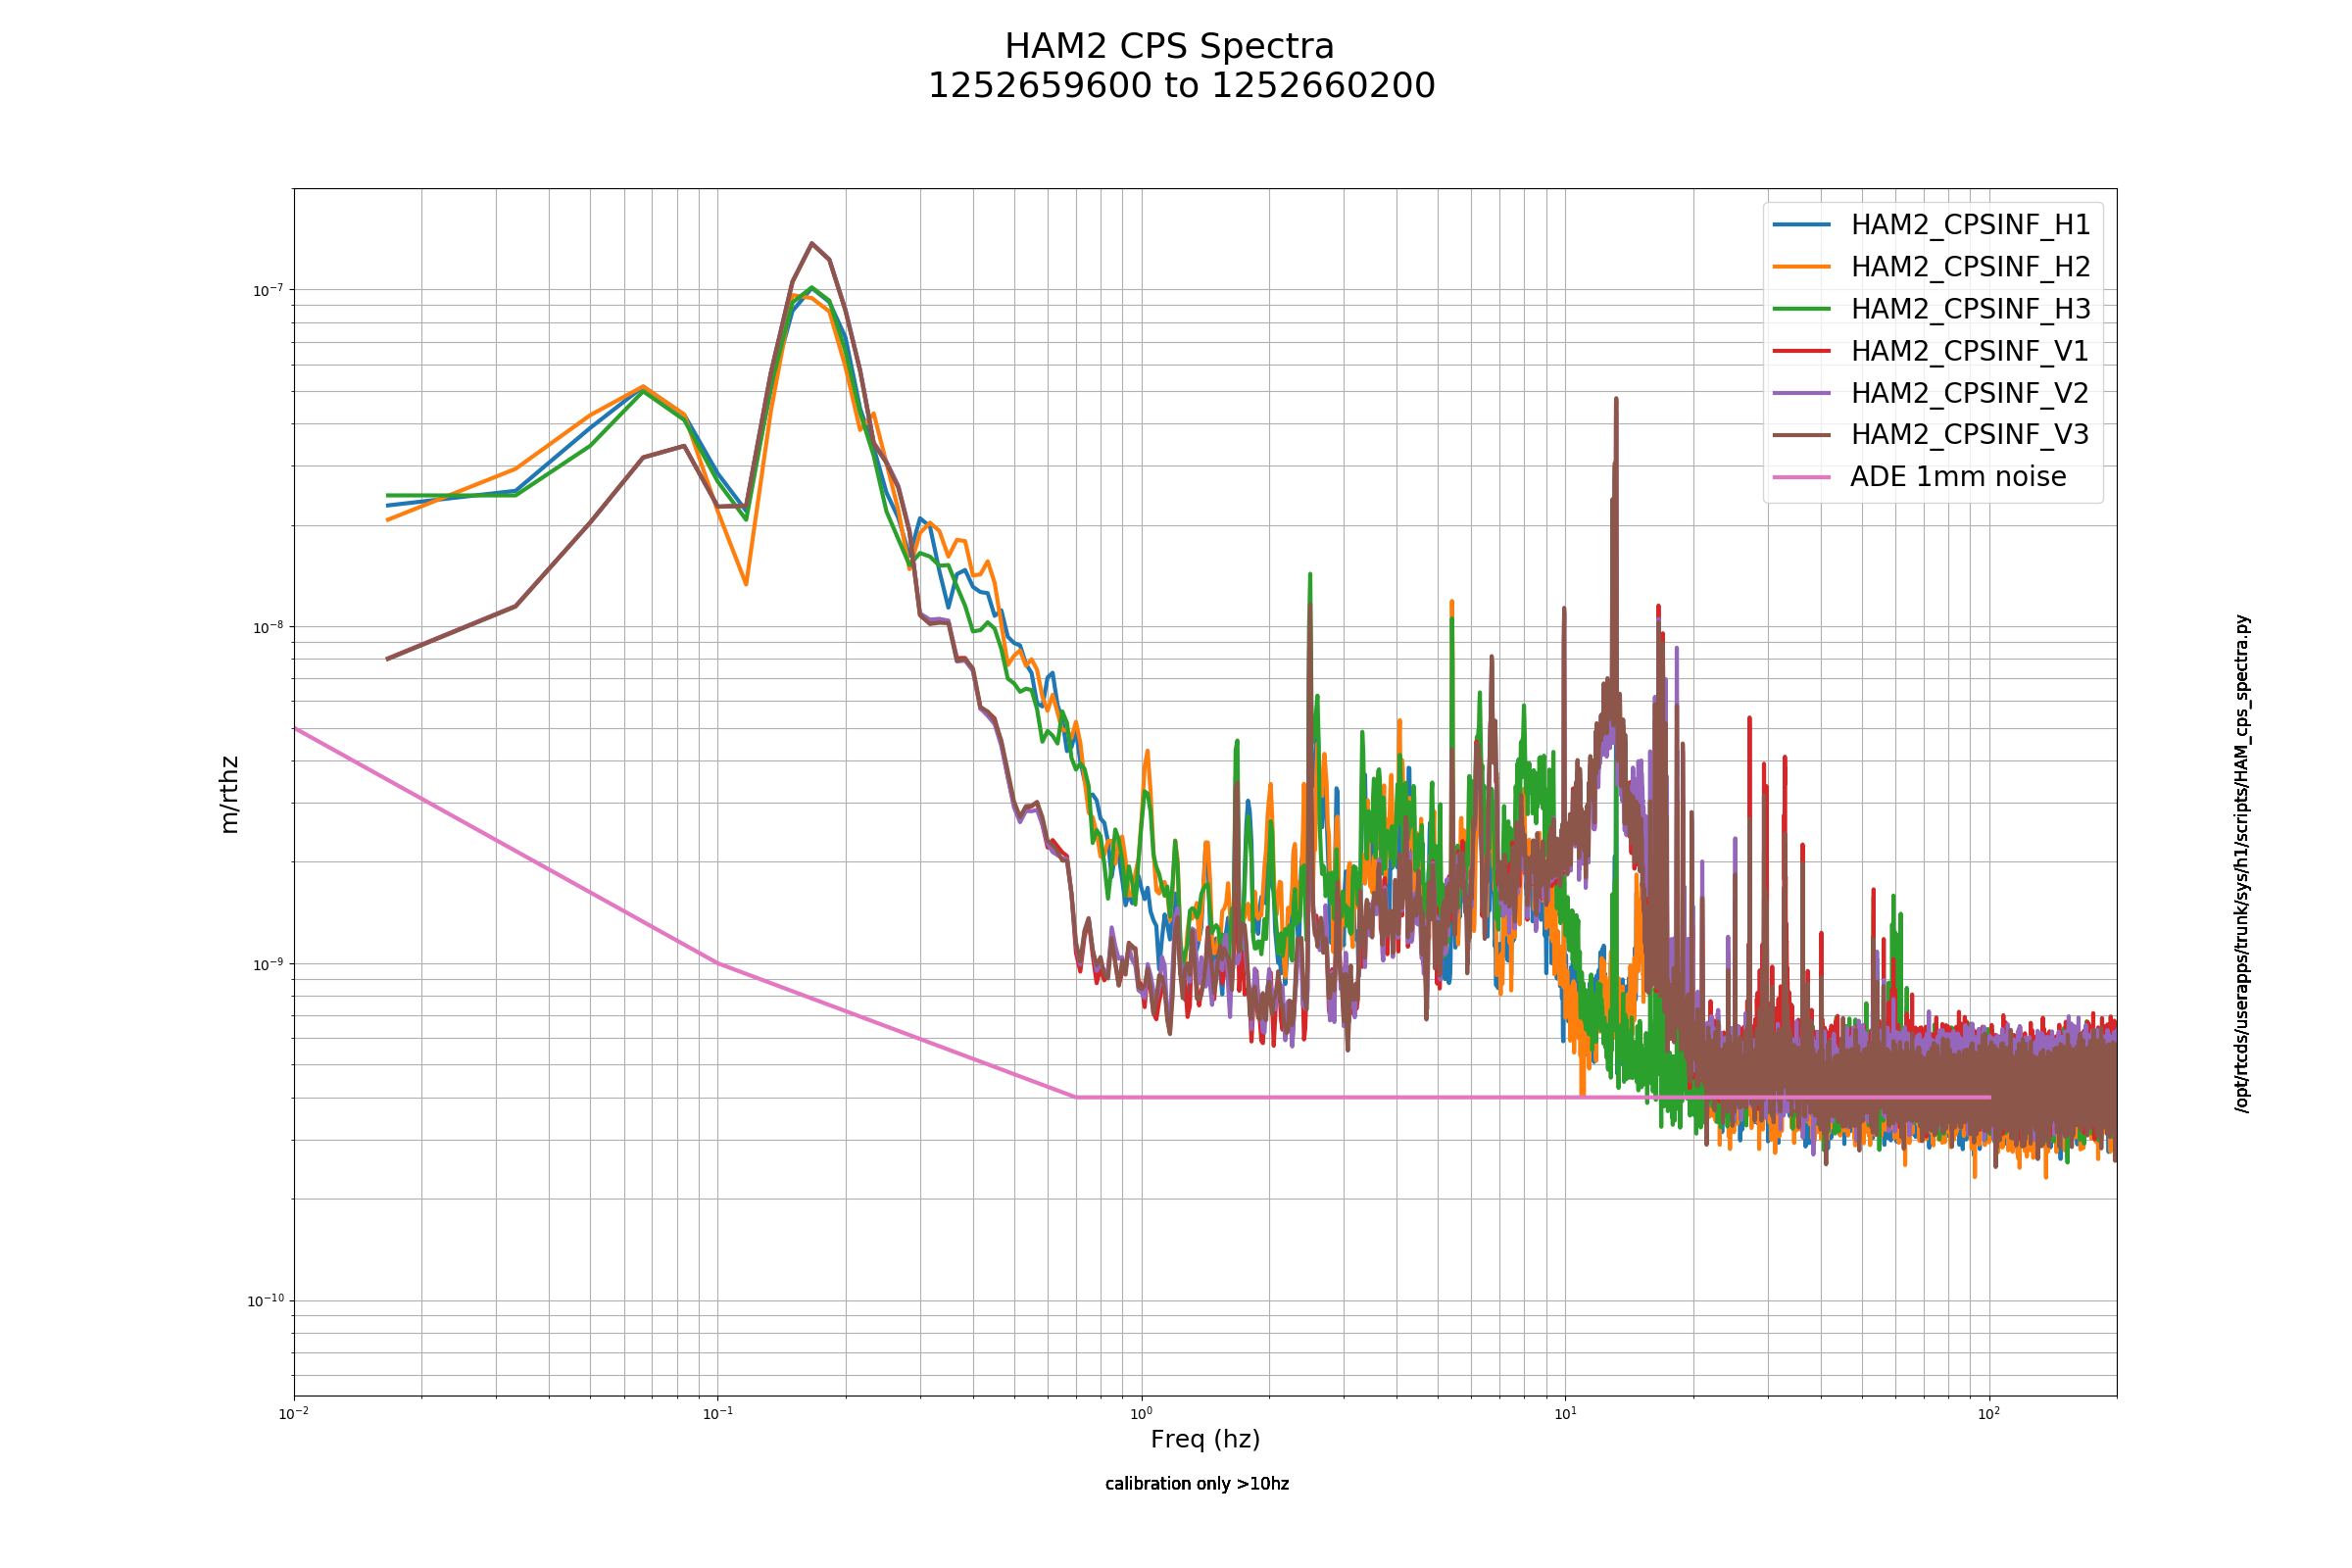
First attachment is USGS EQ map, second is ground motion during mid-Atlantic EQ, third is ground motion during Alaskan EQ
Ops Shift Transition: 09/17/2019, Day Shift 15:00 – 23:00 (08:00-16:00) - UTC (PT)
State of H1: Tuesday Maintenance
Intent Bit: Commissioning
Weather: 0-20 mph wind
Primary 0.03 – 0.1Hz: 0.1 um/s, receding after EQ
Secondary 0.1 – 0.3Hz: 0.1 um/s
Outgoing Operator: Cheryl
Quick Summary: LVEA unlocked from 5.4 mid-Atlantic EQ, leaving unlocked for start of maintenance.
TITLE: 09/17 Owl Shift: 07:00-15:00 UTC (00:00-08:00 PST), all times posted in UTC
STATE of H1: Observing at 112Mpc
OUTGOING OPERATOR: Ed
CURRENT ENVIRONMENT:
SEI_CONF state: WINDY
Wind: 10mph Gusts, 8mph 5min avg
Primary useism: 0.01 μm/s
Secondary useism: 0.18 μm/s
QUICK SUMMARY:
TITLE: 09/17 Eve Shift: 23:00-07:00 UTC (16:00-00:00 PST), all times posted in UTC
STATE of H1: Lock Acquisition
INCOMING OPERATOR: Cheryl
SHIFT SUMMARY:
Shift went well until lockloss. The Log below is the current state.
LOG:
5:37 SR2 saturation - lockloss
5:39 Re-locking attempt -1
6:16 Re-locking attempt - 2
6:28 Re-locking attempt - 3
6:49 Re-Locking attempt - 4
J. Kissel I picked up another set of full-band sensing function measurements to add to the collection that supports the newest configuration of the DARM loop and the corresponding model parameter set (see 51784 and 51782). Of course, even though we believe we've mitigated the detuned part of the low-frequency sensing function response with the addition of the requested digital SRCL offset, there's no reason to believe it will become time-independent, and thus we continue to regularly measure with a ~weekly cadence to ensure we see what's happening comparing uncorrelated nominal-low-noise segments. While these full-frequency-band sweeps provide a complete-picture snapshot, they don't provide the entire story. We are still tracking the time-dependence of the low-frequency end of the sensing function continuously with calibration lines, and indeed: the summary page report for the time-dependent correction factors (TDCFs) shows that beginnings of nominal low noise segments show that the response -- computed by the ~17 Hz calibration line and cast as a detuned spring frequency squared, f_s^2 (maybe errantly, maybe not) -- does indeed evolve with time. The values are typically, and repeatably, dropping from +35 to -5 Hz^2, indicating (if it is the detuning that's changing) that we're transitioning from an anti-spring to a pro-spring over the first ~1 hour of arriving at the nominal-low-noise (see 2019-09-13 2019-09-15 2019-09-16 examples from the bottom right most plot of the TDCF summary page). Perhaps one bit of comfort is that -- while we're in these thermalization periods -- an anti-spring (like we had during O1 & O2), does not have a high-Q-like response, and doesn't impact the phase nearly as much as a pro-spring (like we had in mid-O3 during and after the spot-move mishap). All this being said, I think we're fine with our current uncertainty budget tactics -- MCMC fitting the data only above 20 Hz, using a model parameter set informed by the MAP of that fit (and forcing the detuned spring to be non-existent; consistent with the MCMC fit), and treating this low frequency response as an unknown systematic error with associated uncertainty. Supporting plots attached are (in attachment order): (1) the comparison between all data sets that we claim to be represented by the 2019-09-09 model parameter set (uncorrected for time-dependence), (2) The MCMC corner plot of last 4 data sets that have not been processed until now (3) The Comparison between those same measurements' MCMC fit and the respective data for that day. The raw data for these plots live in /ligo/svncommon/CalSVN/aligocalibration/trunk/Runs/O3/H1/Measurements/FullIFOSensingTFs/ 2019-09-09_H1_PreModelChange_DARM_OLGTF_LF_SS_5to1100Hz_15min.xml (Forgot to save PreModelChange PCAL TF in chaos of the model change, but I did export and commit the data, e.g. 2019-09-09_H1_PreModelChange_PCAL2DARMTF_LF_SS_A_PCALYRX_B_DARMIN1_tf.txt) 2019-09-09_H1_PostModelChange_PCALY2DARMTF_LF_SS_5t1100Hz_10min.xml 2019-09-09_H1_PostModelChange_DARM_OLGTF_LF_SS_5to1100Hz_15min.xml 2019-09-16_H1_DARM_OLGTF_LF_SS_5to1100Hz_15min.xml # Today's measurements 2019-09-16_H1_PCALY2DARMTF_LF_SS_5t1100Hz_10min.xml 2019-09-16_H1_PCALX2DARMTF_LF_SS_5t1100Hz_10min.xml # not yet processed
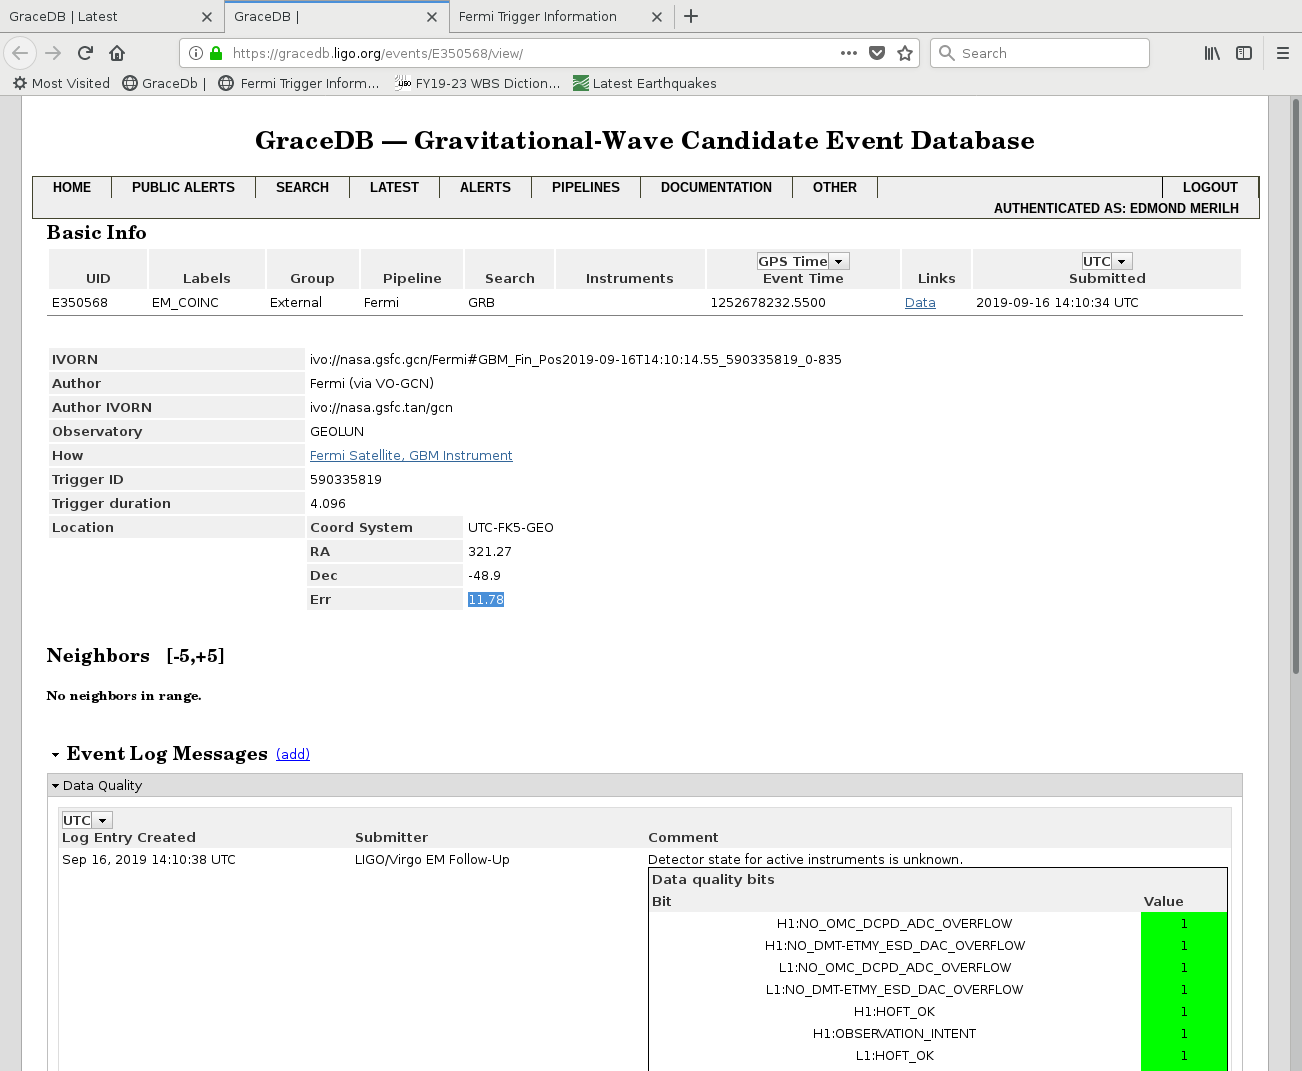
The Verbal Alert came through (E350568) but I don't see it showing up current on GraceDB as of 23:28UTC. However, looking down the list of past events I see it in the list labeled as EM_COINC. I don't see a stand down happening. Perhaps a glitch?
TITLE: 09/16 Eve Shift: 23:00-07:00 UTC (16:00-00:00 PST), all times posted in UTC
STATE of H1: Observing at 116Mpc
OUTGOING OPERATOR: Travis
CURRENT ENVIRONMENT:
SEI_CONF state: WINDY
Wind: 15mph Gusts, 11mph 5min avg
Primary useism: 0.03 μm/s
Secondary useism: 0.17 μm/s
QUICK SUMMARY:
TITLE: 09/16 Day Shift: 15:00-23:00 UTC (08:00-16:00 PST), all times posted in UTC
STATE of H1: Observing at 115Mpc
INCOMING OPERATOR: Ed
SHIFT SUMMARY: Locked for the entire shift.
LOG:
16:31 Ethan to optics lab, Karen to MY
17:27 Ethan out
18:09 Karen back
21:00 JeffK starting calibration measurements
21:38 Dave to EY looking at Dolphin switch
22:01 Dave back
22:33 Observing
In lieu of a full screen sharing service, I've written a simple script which captures a workstation's screen and posts the resulting png image to the CDS web page. The script can be ran either locally on the workstation, or remotely via an SSH session to the workstation. Note that if the script is ran remotely and the display has a screen saver operational, then that is the image which will be captured.
The script is called share_screen
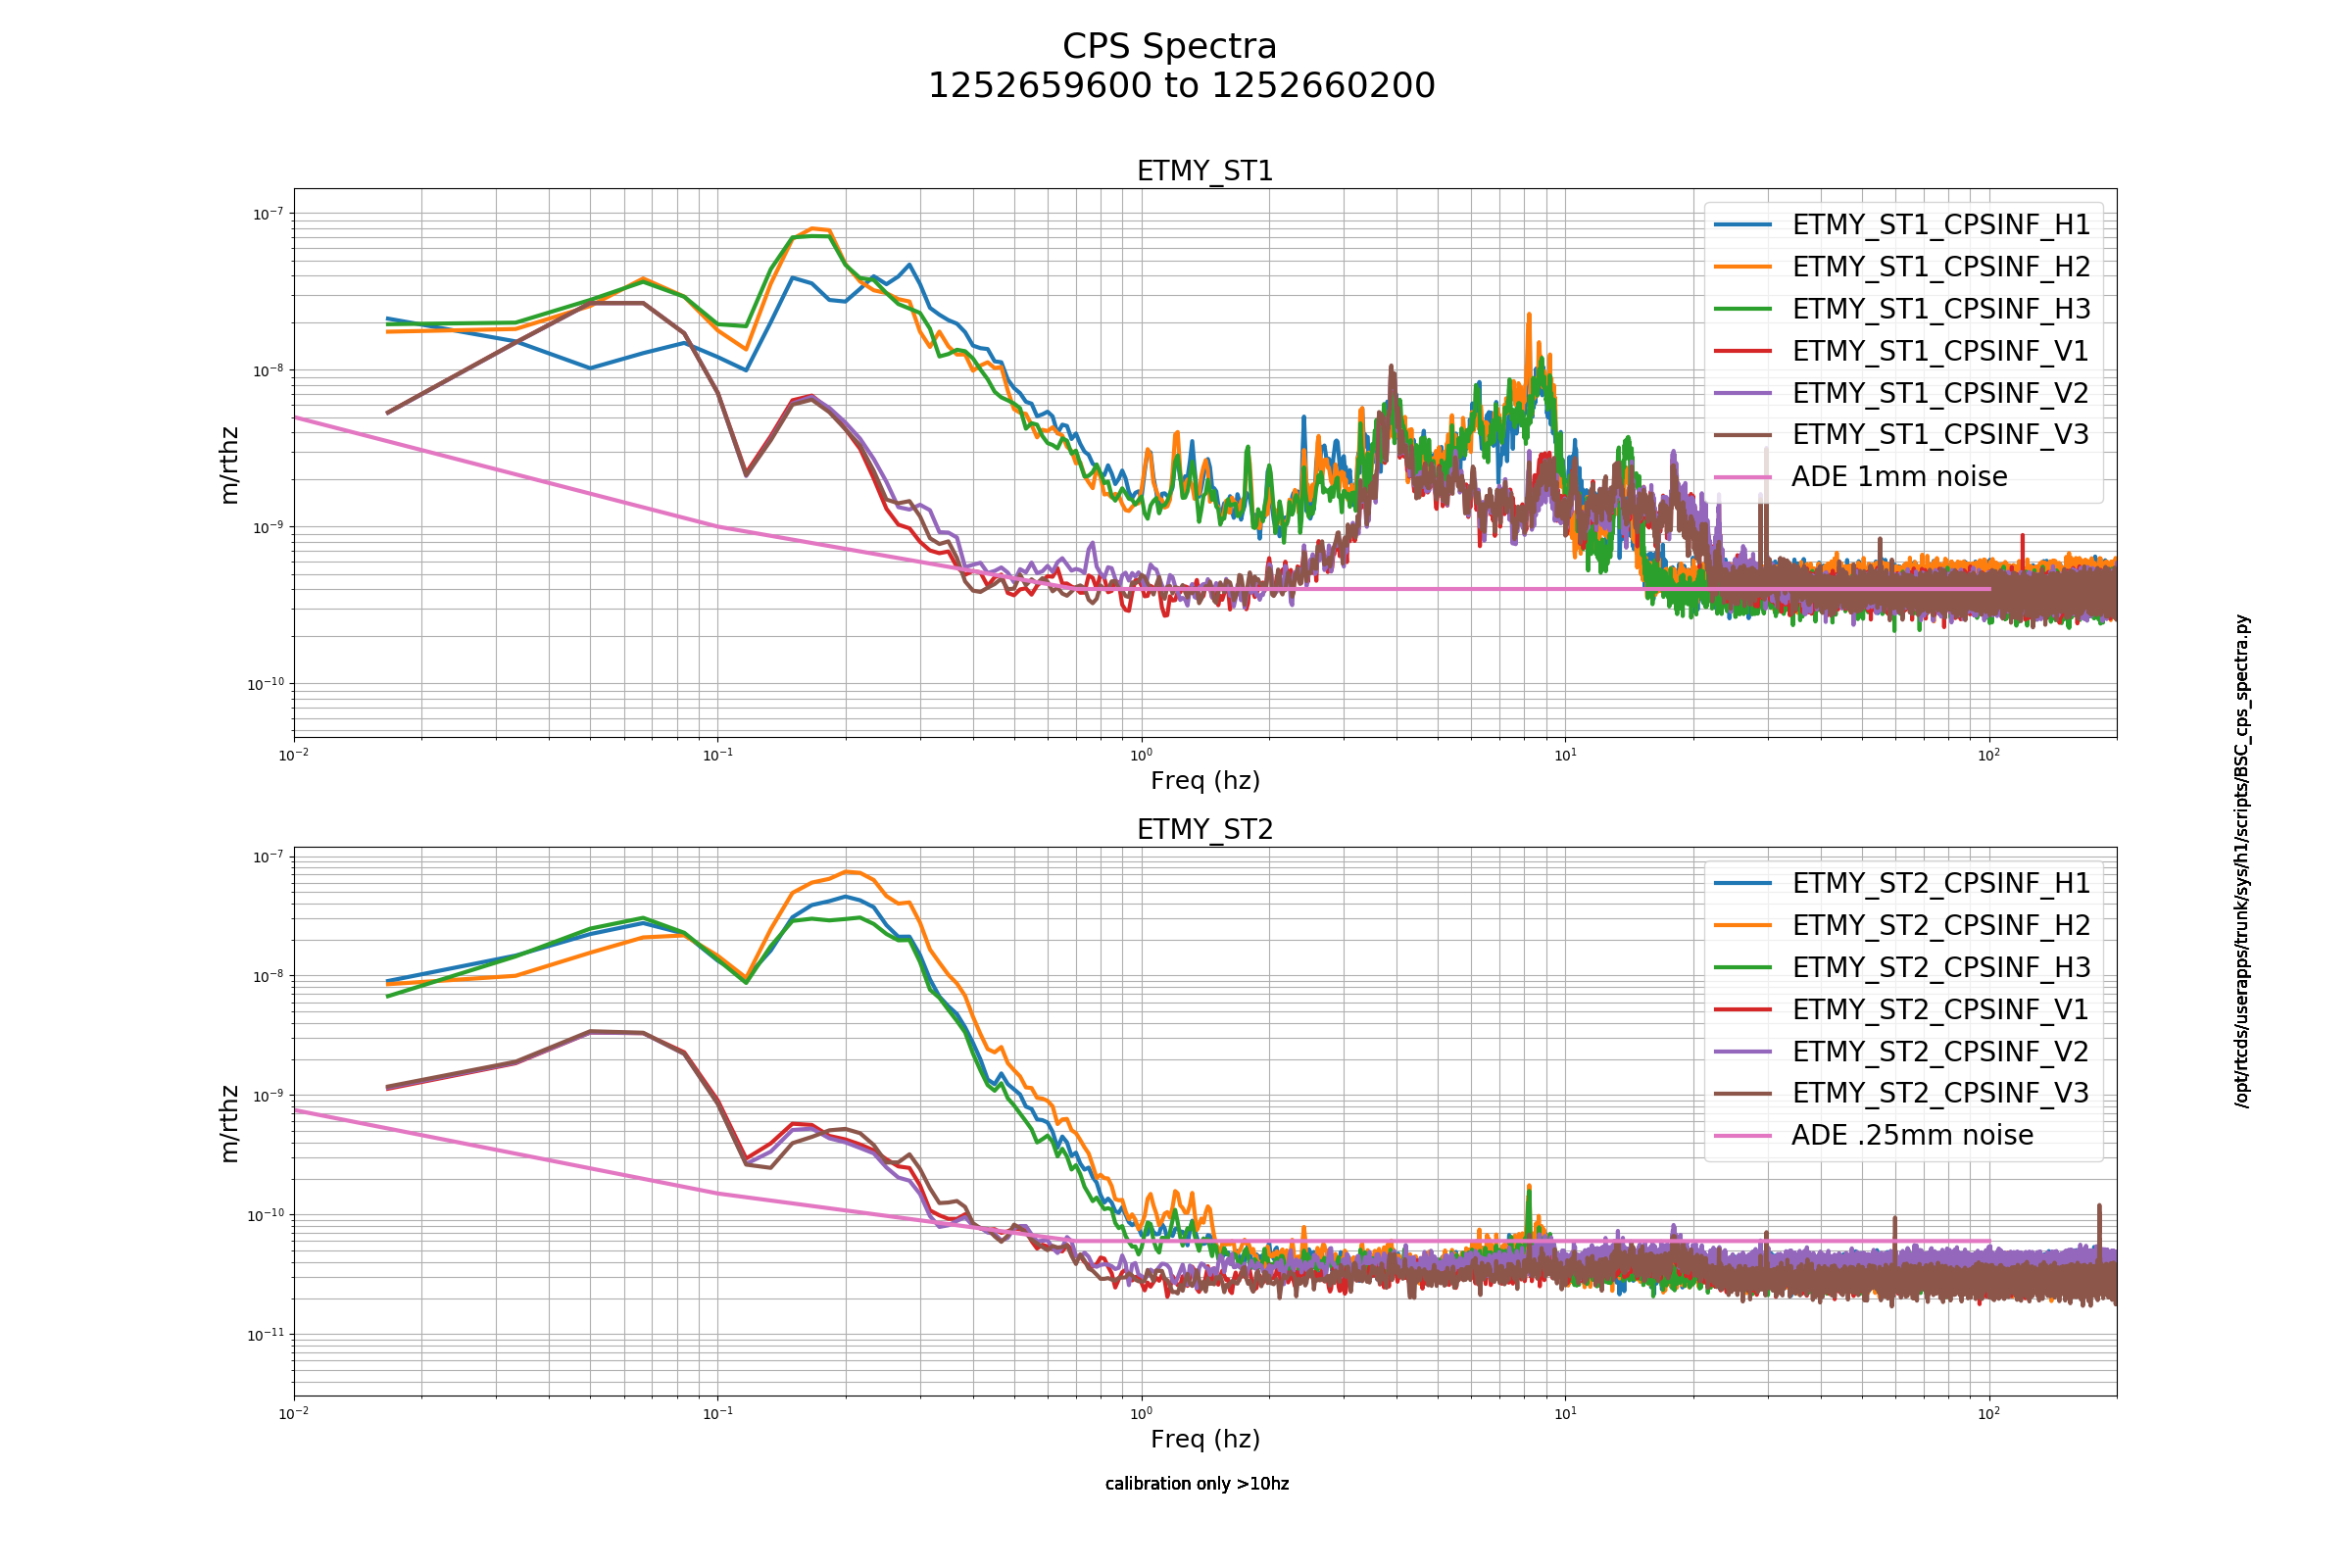
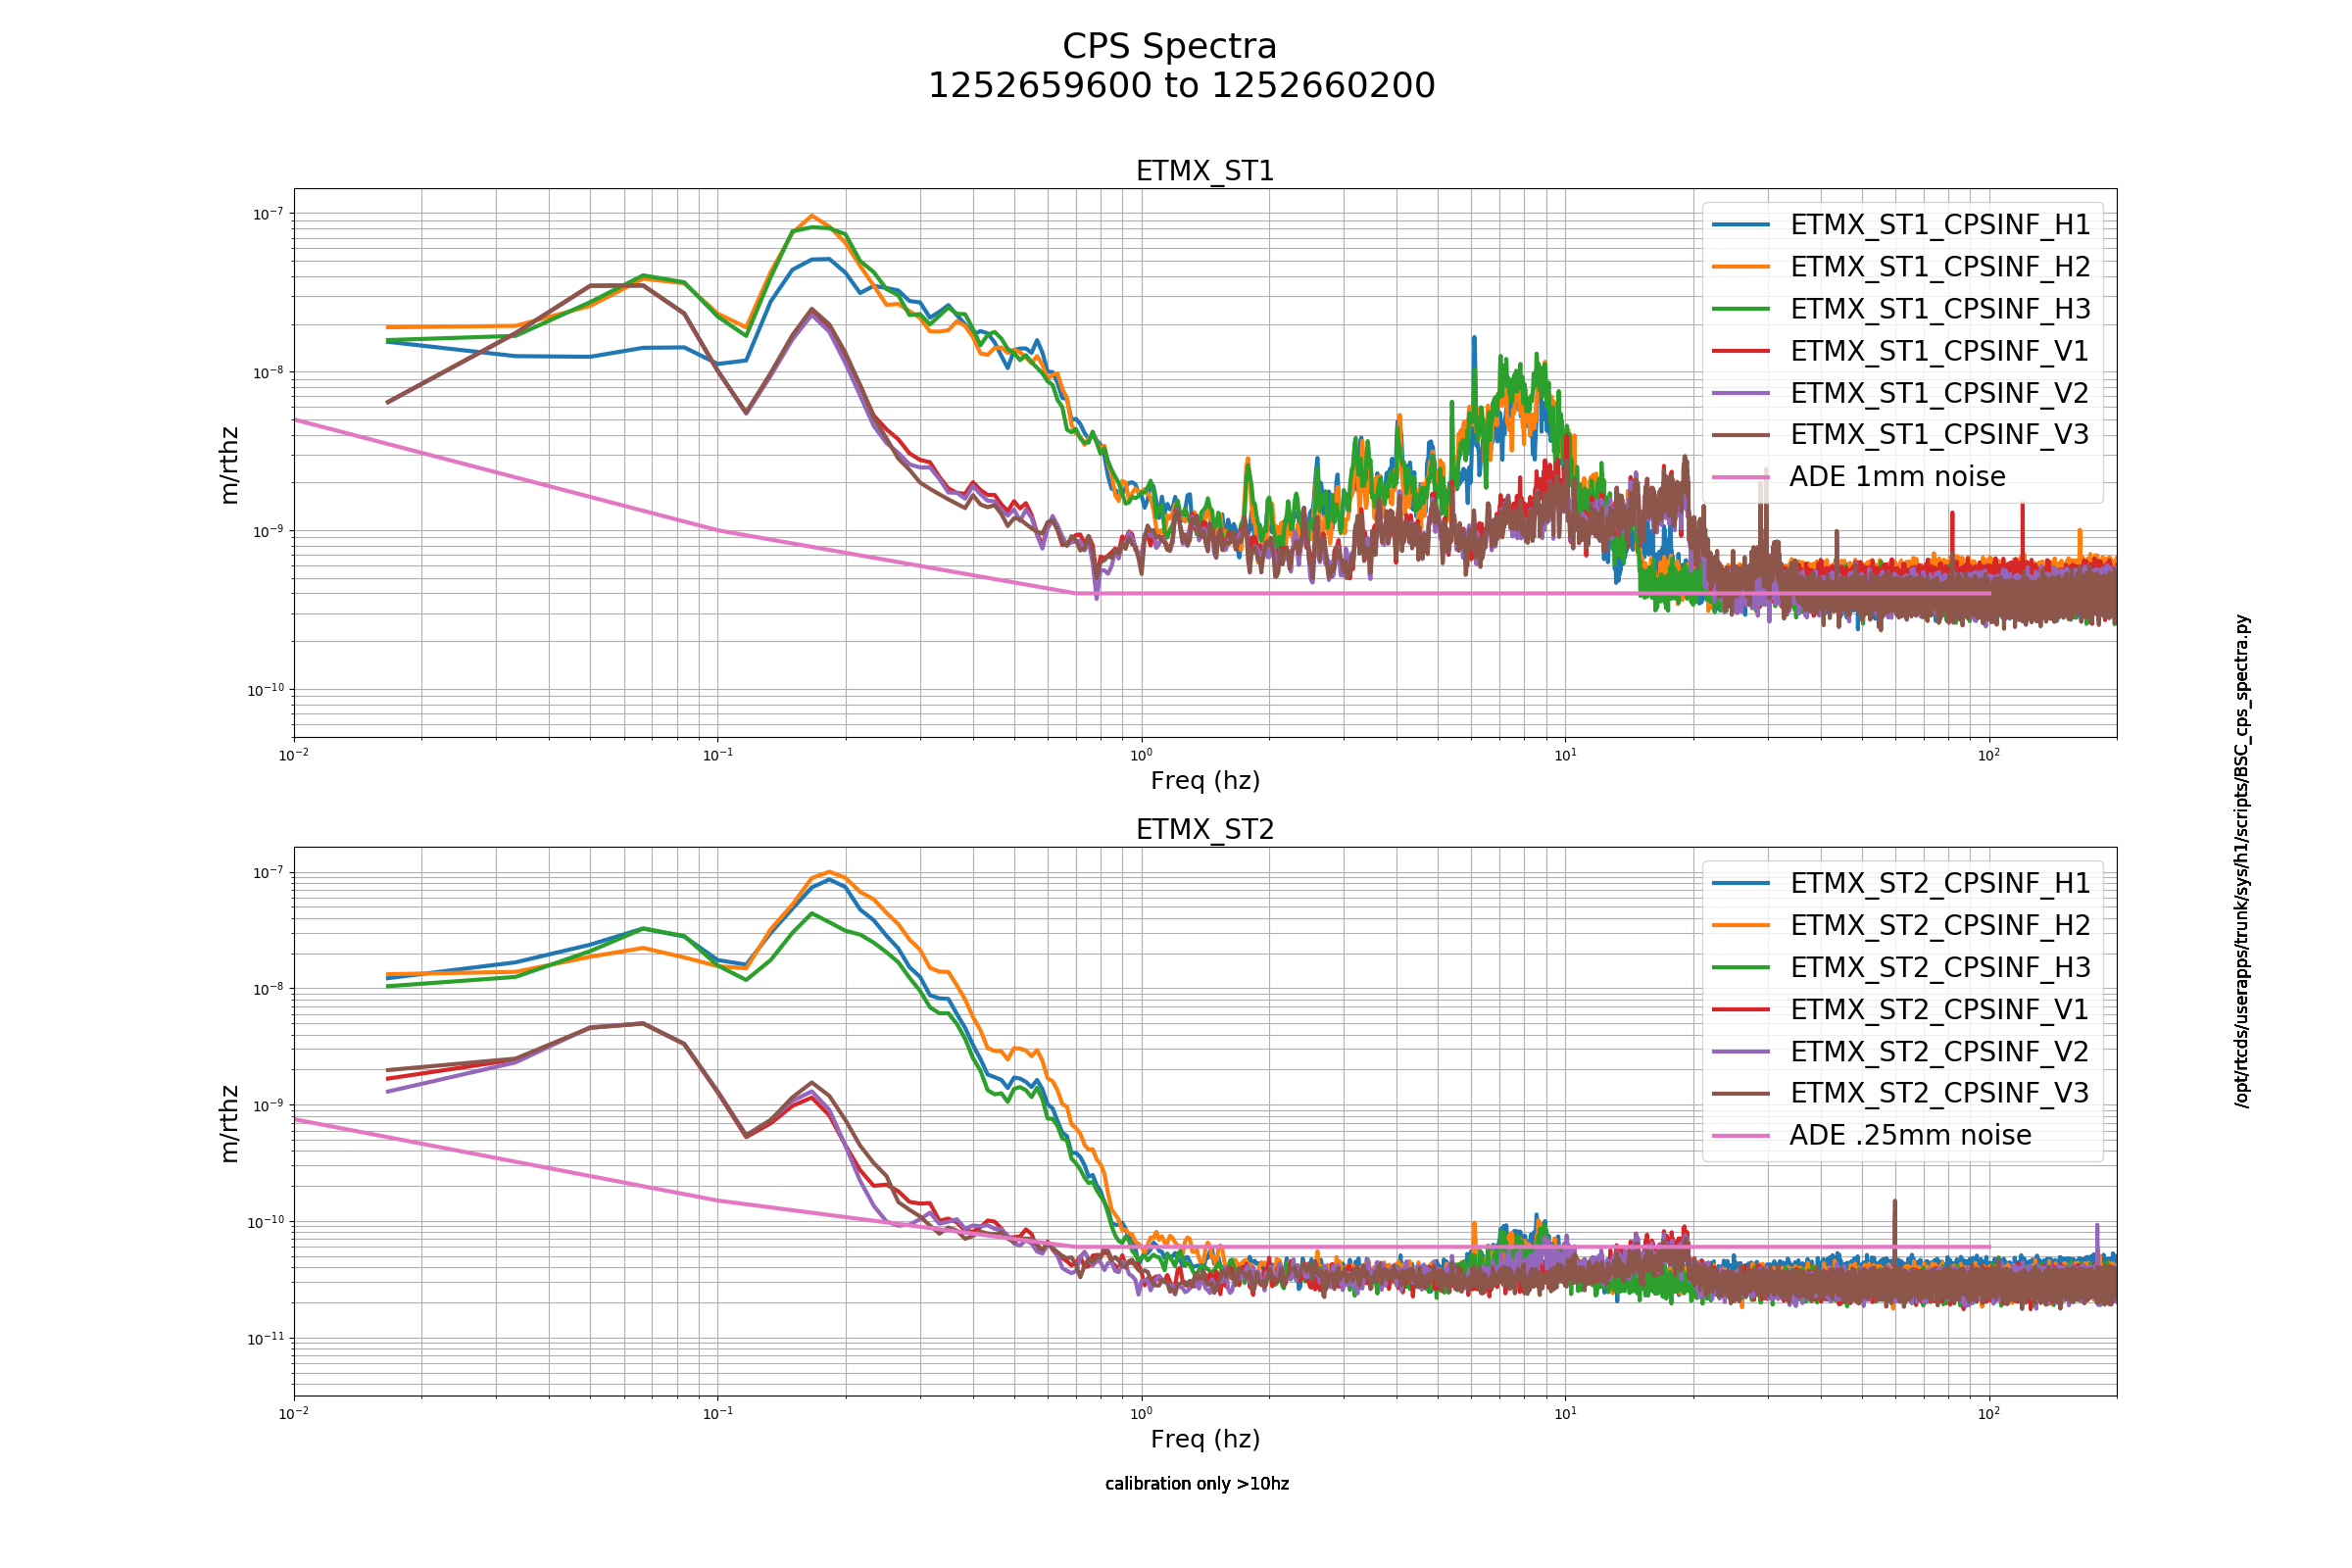
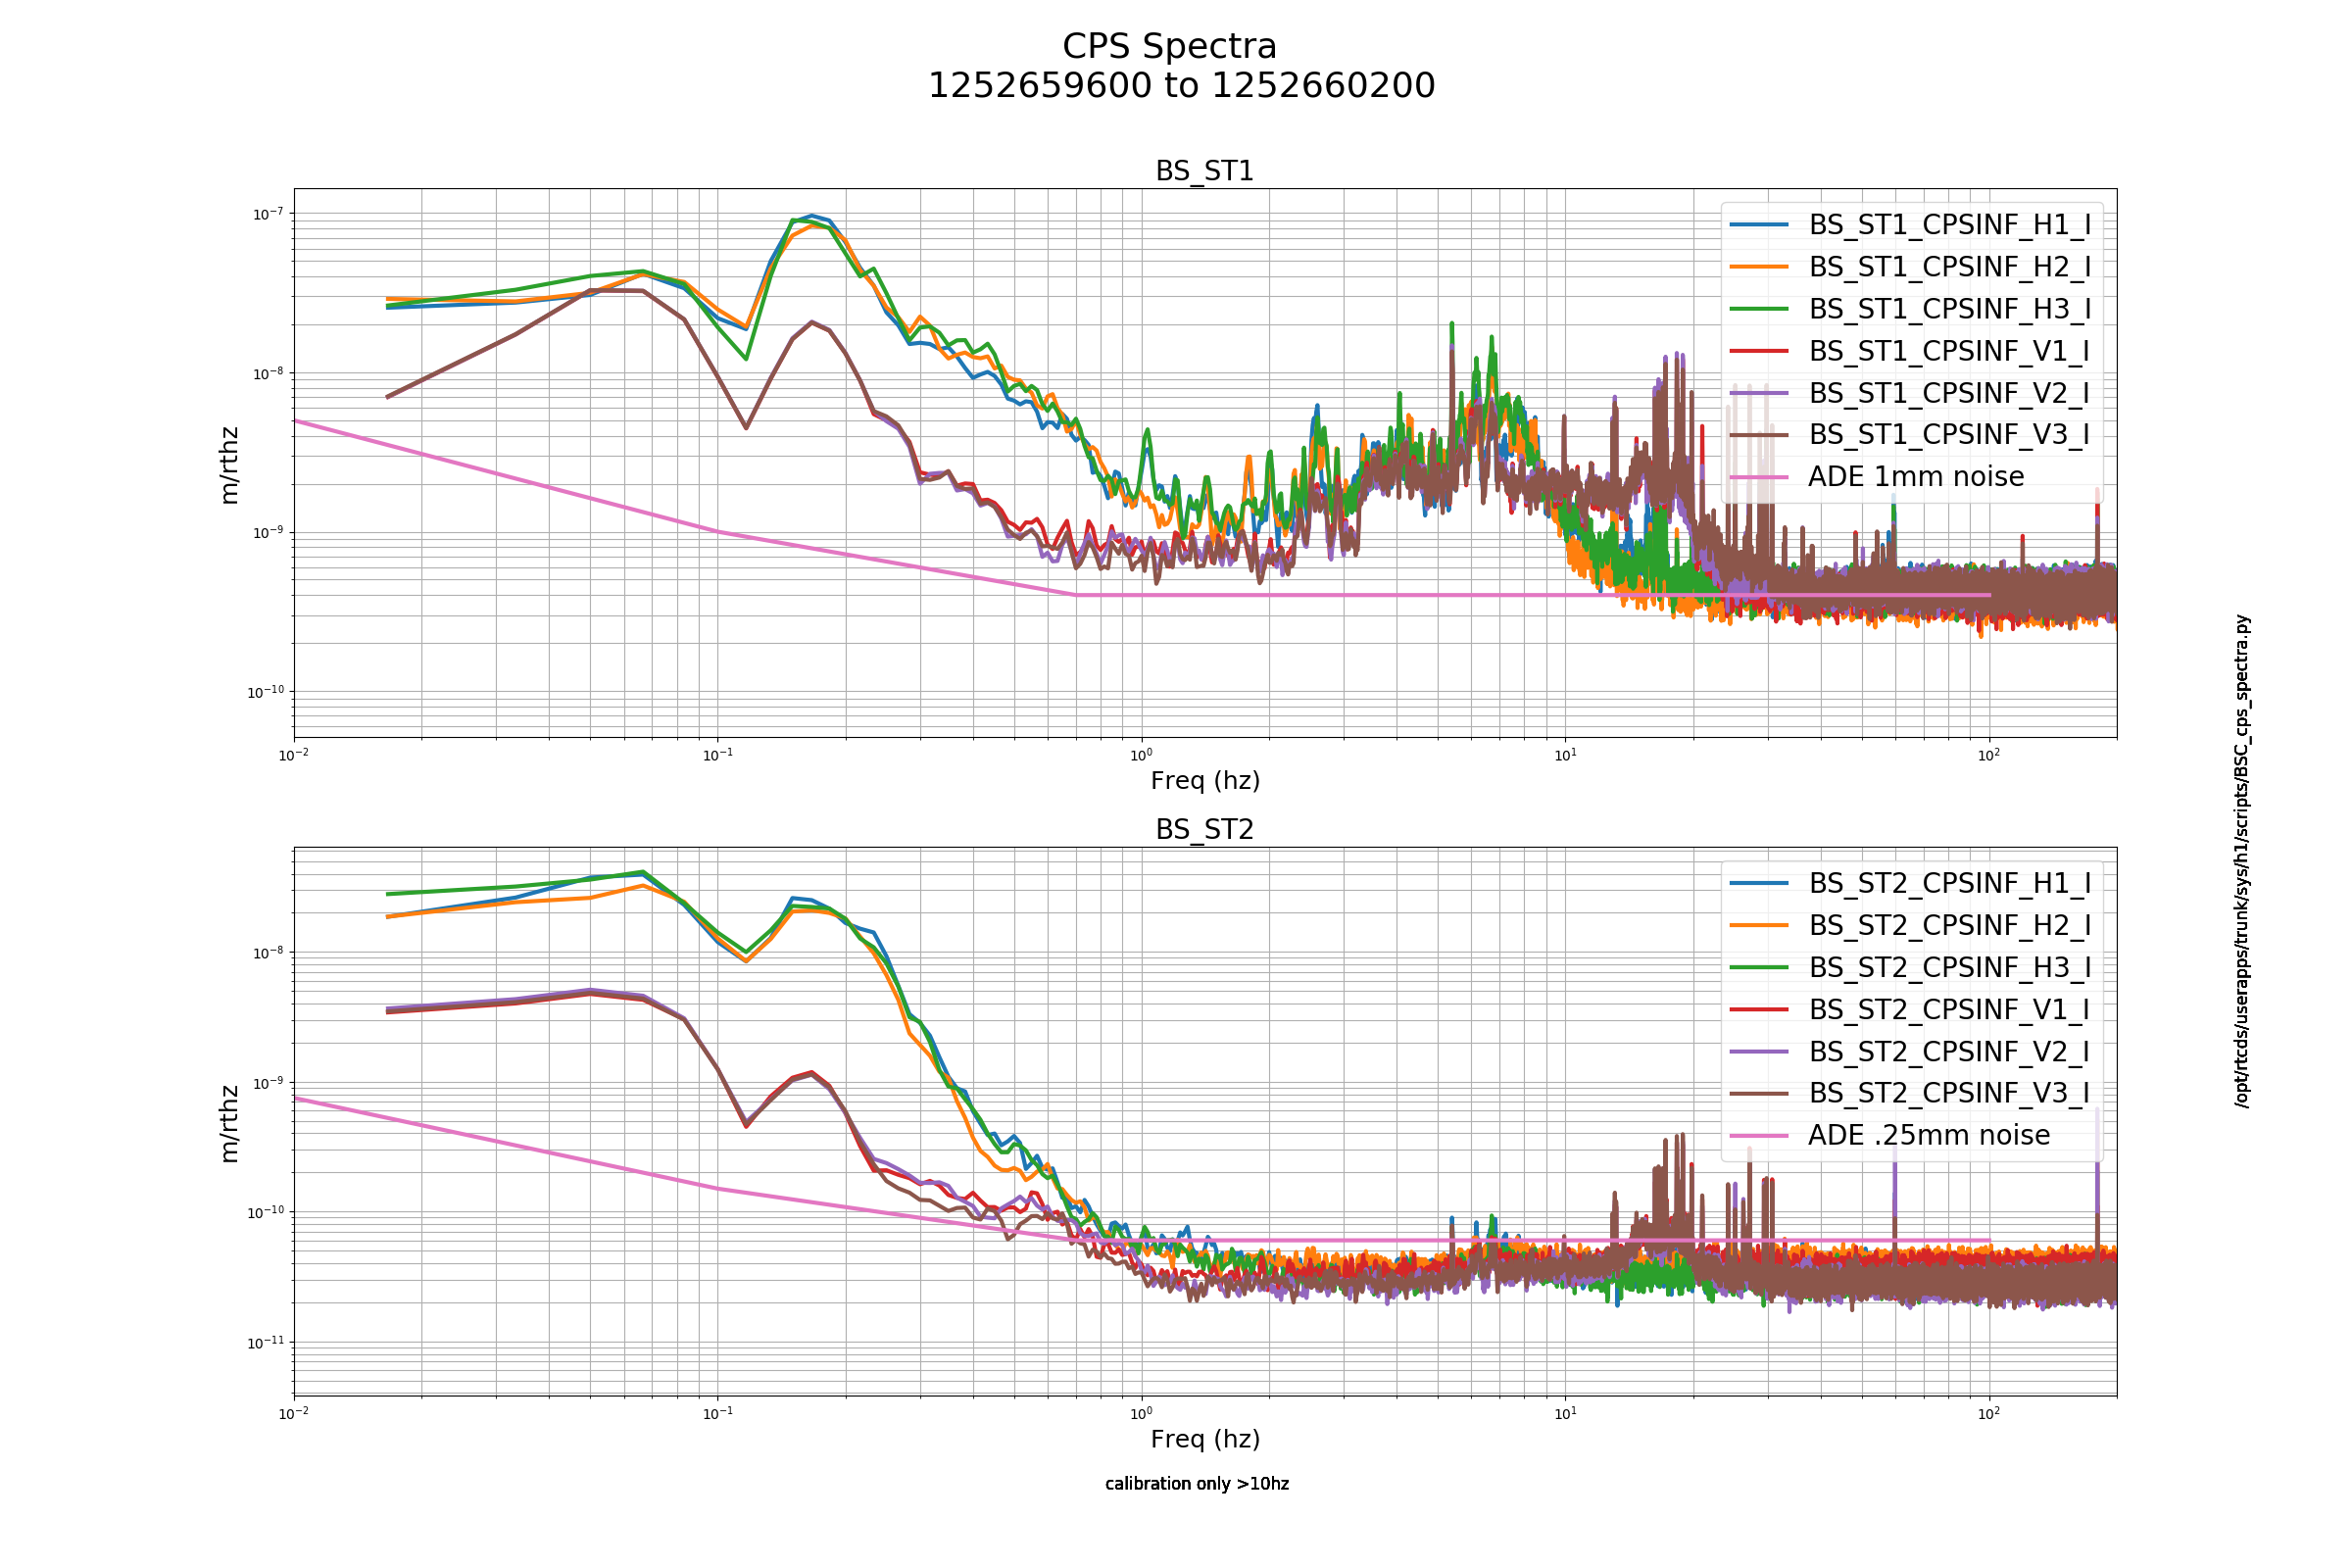
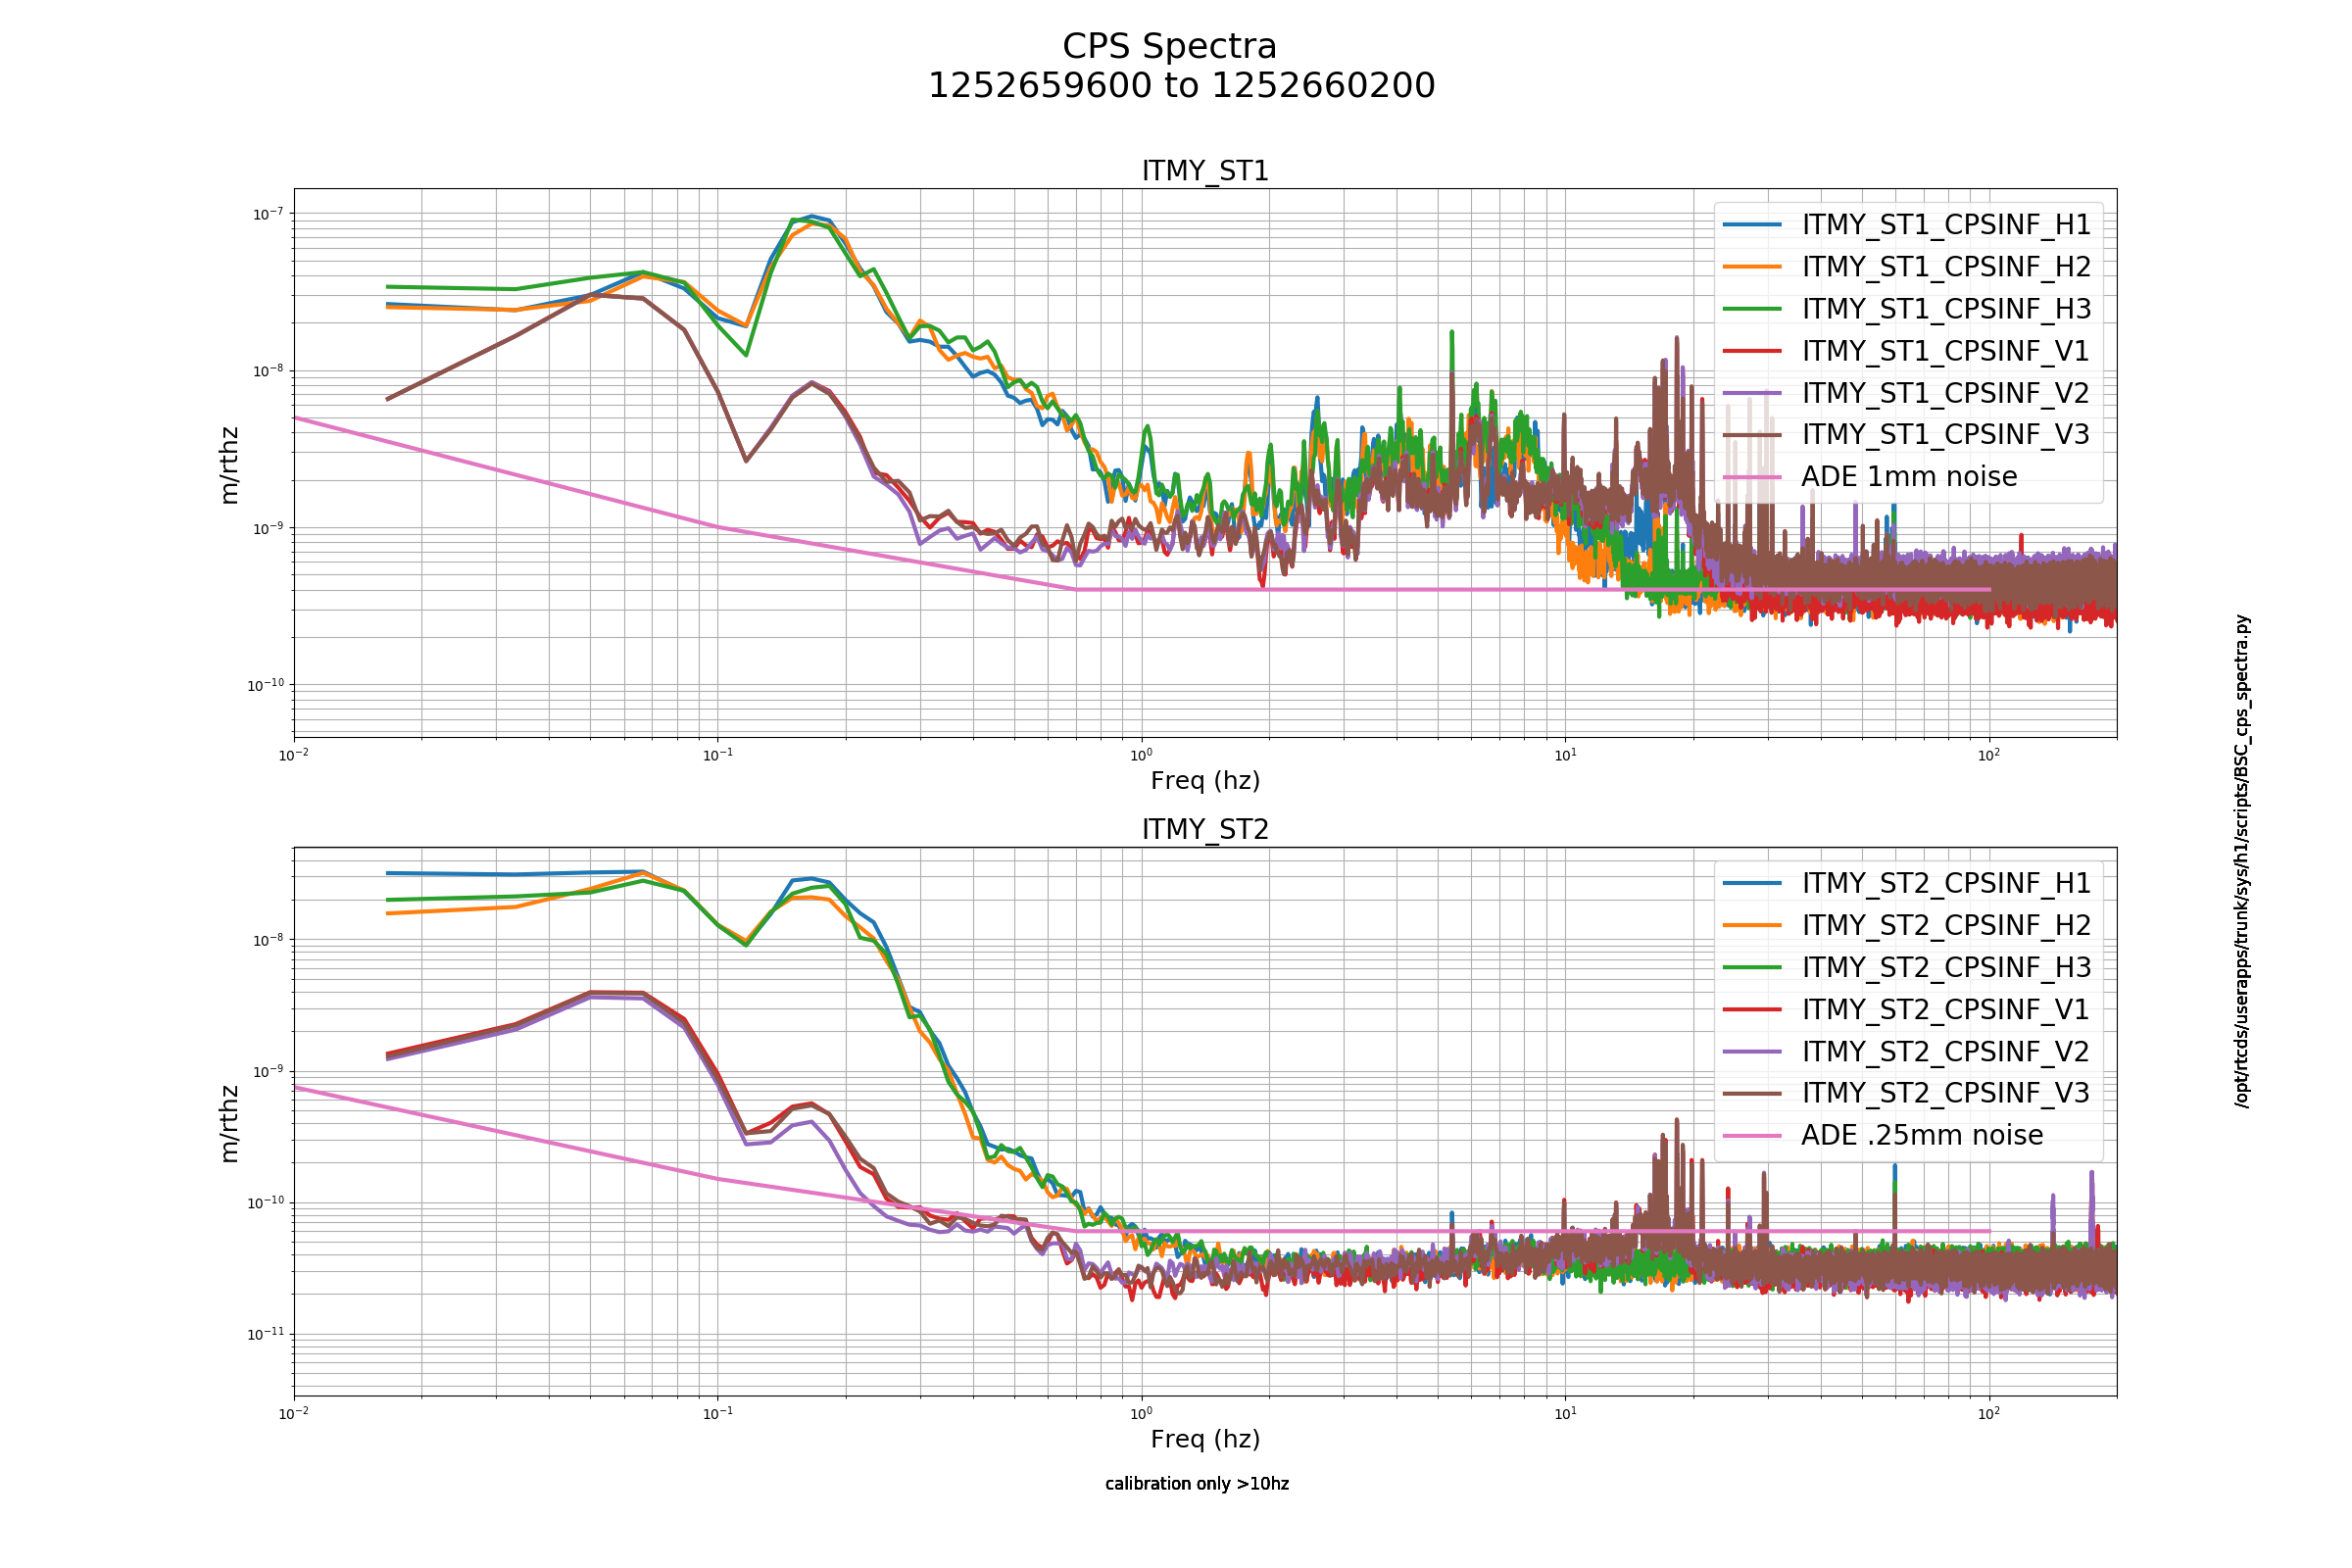
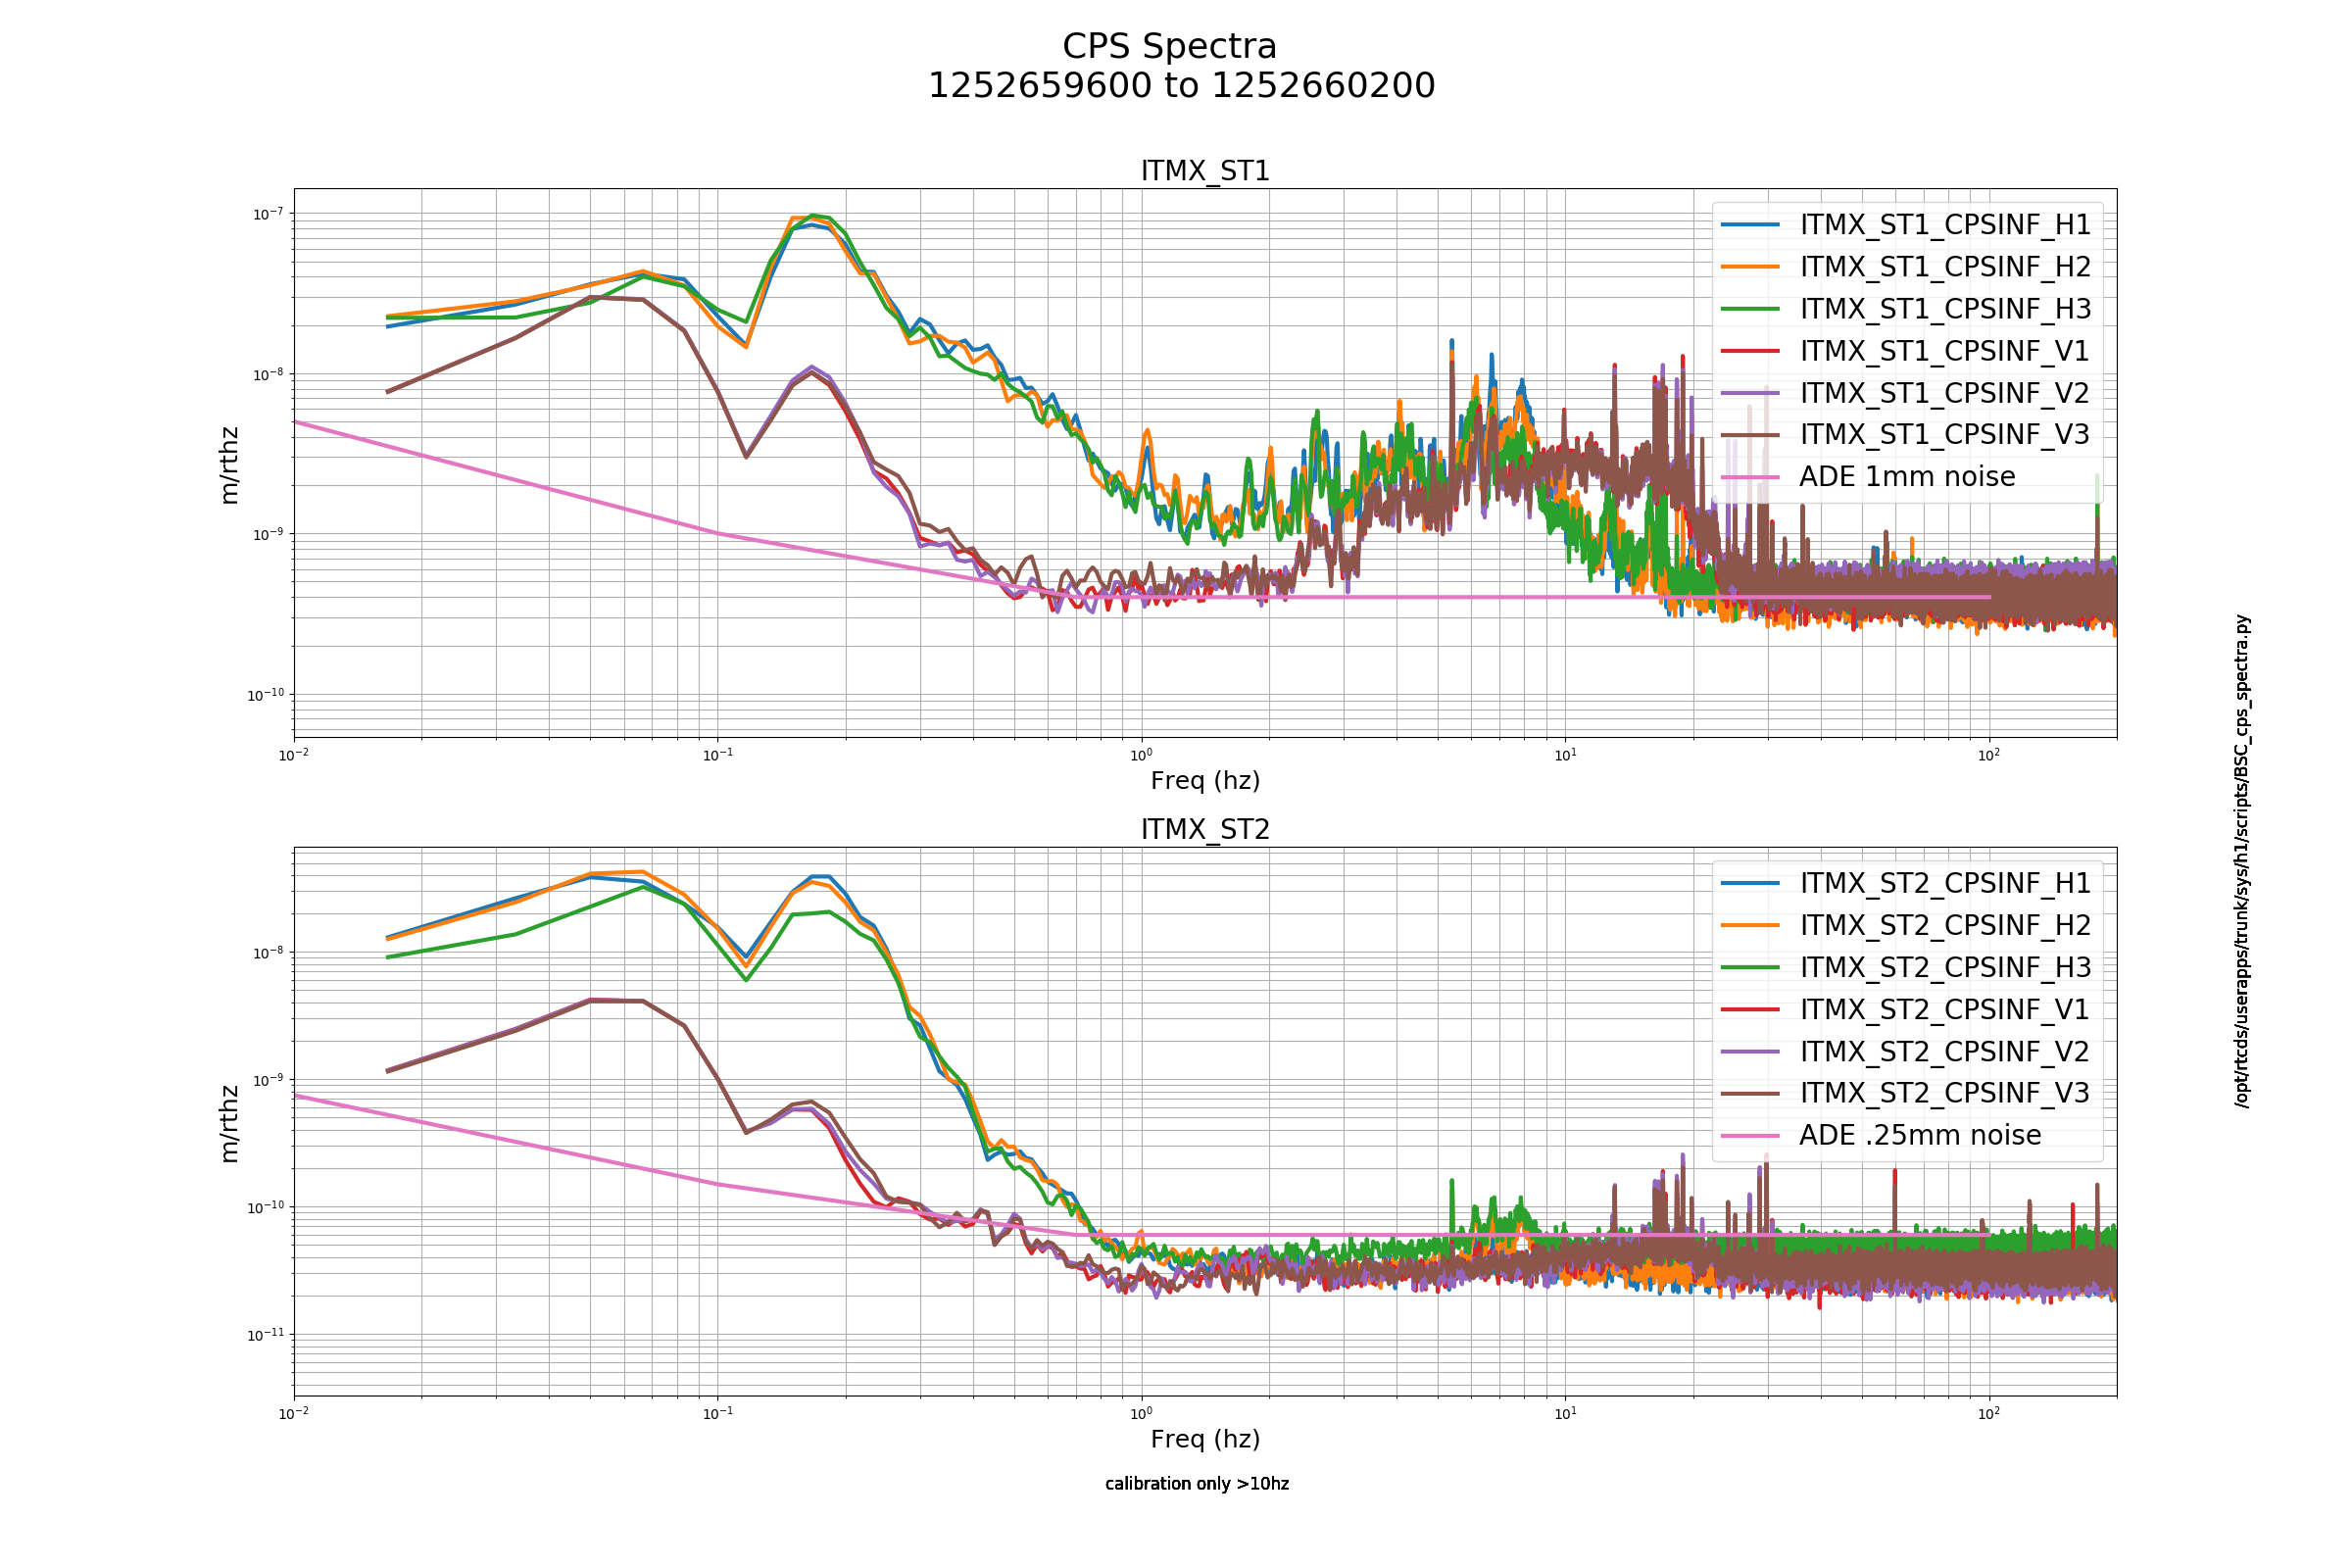
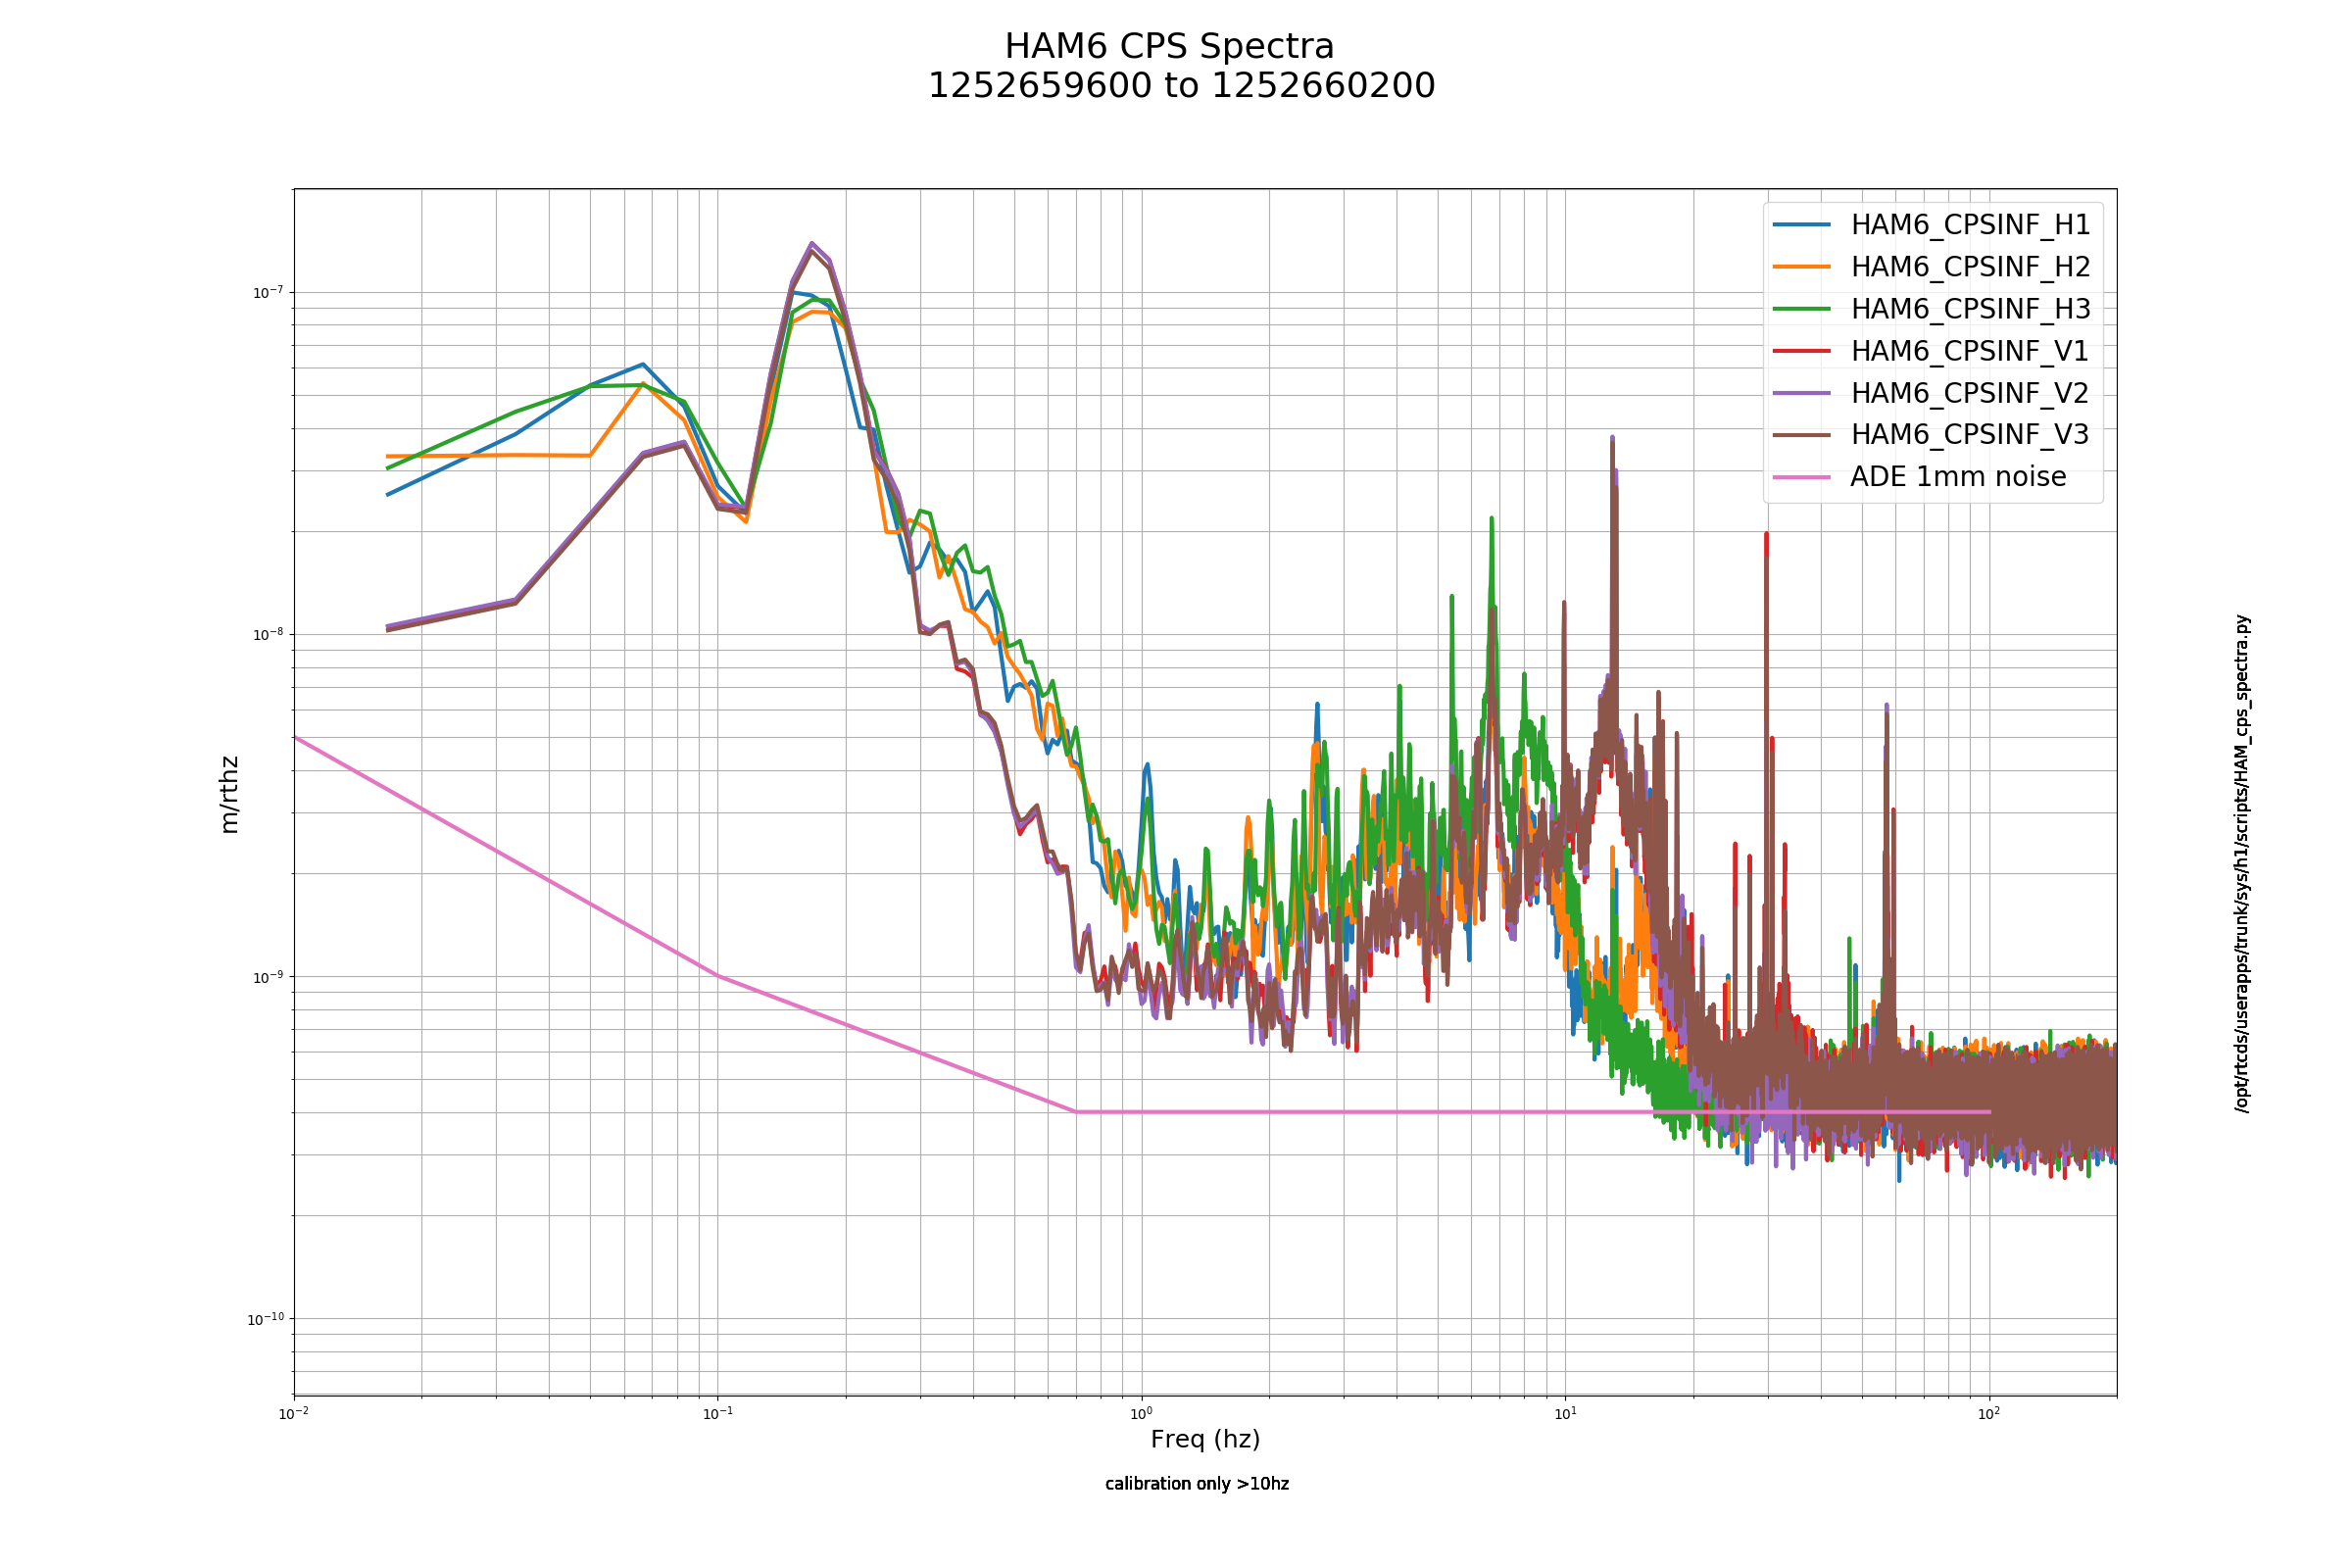
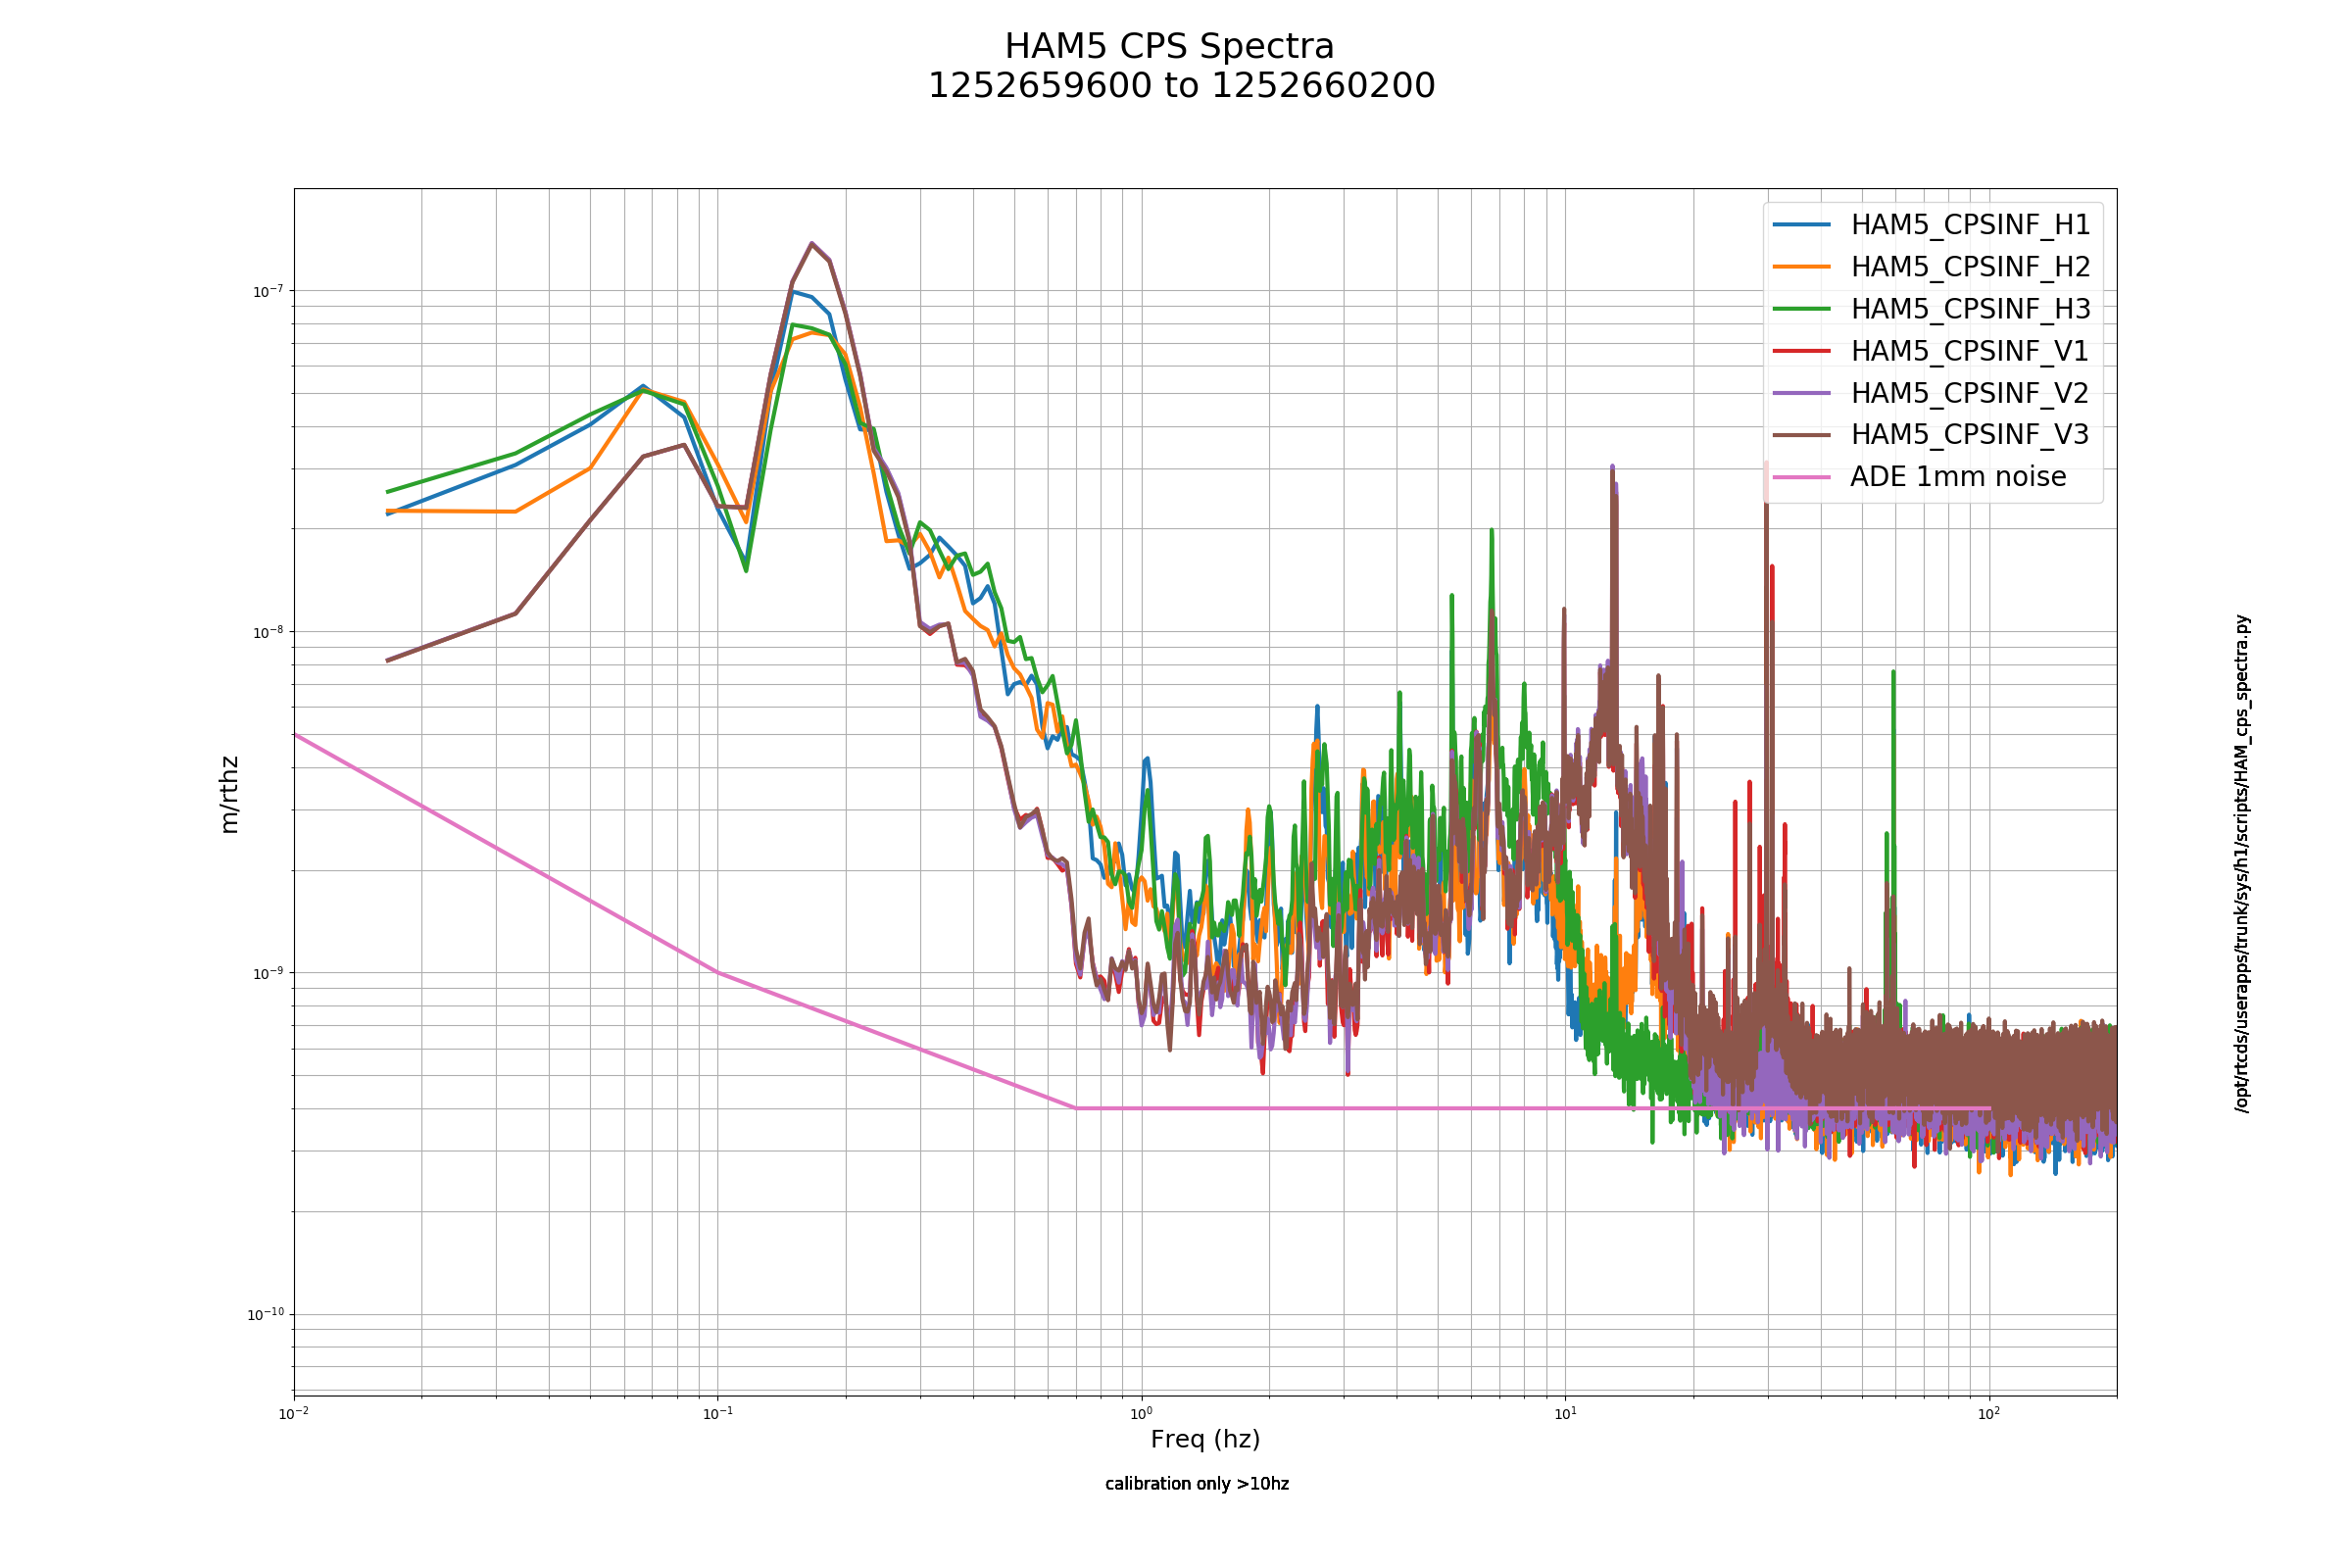
HAM5 V3 has a bump around 30 Hz. Otherwise, these look OK to me.
TITLE: 09/16 Day Shift: 15:00-23:00 UTC (08:00-16:00 PST), all times posted in UTC
STATE of H1: Observing at 114Mpc
OUTGOING OPERATOR: Cheryl
CURRENT ENVIRONMENT:
SEI_CONF state: WINDY
Wind: 2mph Gusts, 1mph 5min avg
Primary useism: 0.01 μm/s
Secondary useism: 0.16 μm/s
QUICK SUMMARY: Observing for the past 3 hours. No issues at this time.
TITLE: 09/16 Owl Shift: 07:00-15:00 UTC (00:00-08:00 PST), all times posted in UTC
STATE of H1: Observing at 114Mpc
INCOMING OPERATOR: Travis
SHIFT SUMMARY: lockloss, relocked, in Observe
LOG:
Jeff K, Sheila, TJ, Jim
Jim had two more locklosses at engage ASC while trying to relock after this afternoon's lockloss. In one case, there aren't many clues except for the usual error signals deviating from 0: 1252450014
In the earlier one 1252449154, the lockloss happened after all the ASC was on and the first convergence checker had passed. At that time we increase the gain of some loops and turn off the offsets in AS36Q which are set in DRMI. I noticed that we have a 4 second wait for a 10 second ramp on the offsets, so I set the wait time to be the TRAMP for the offsets.
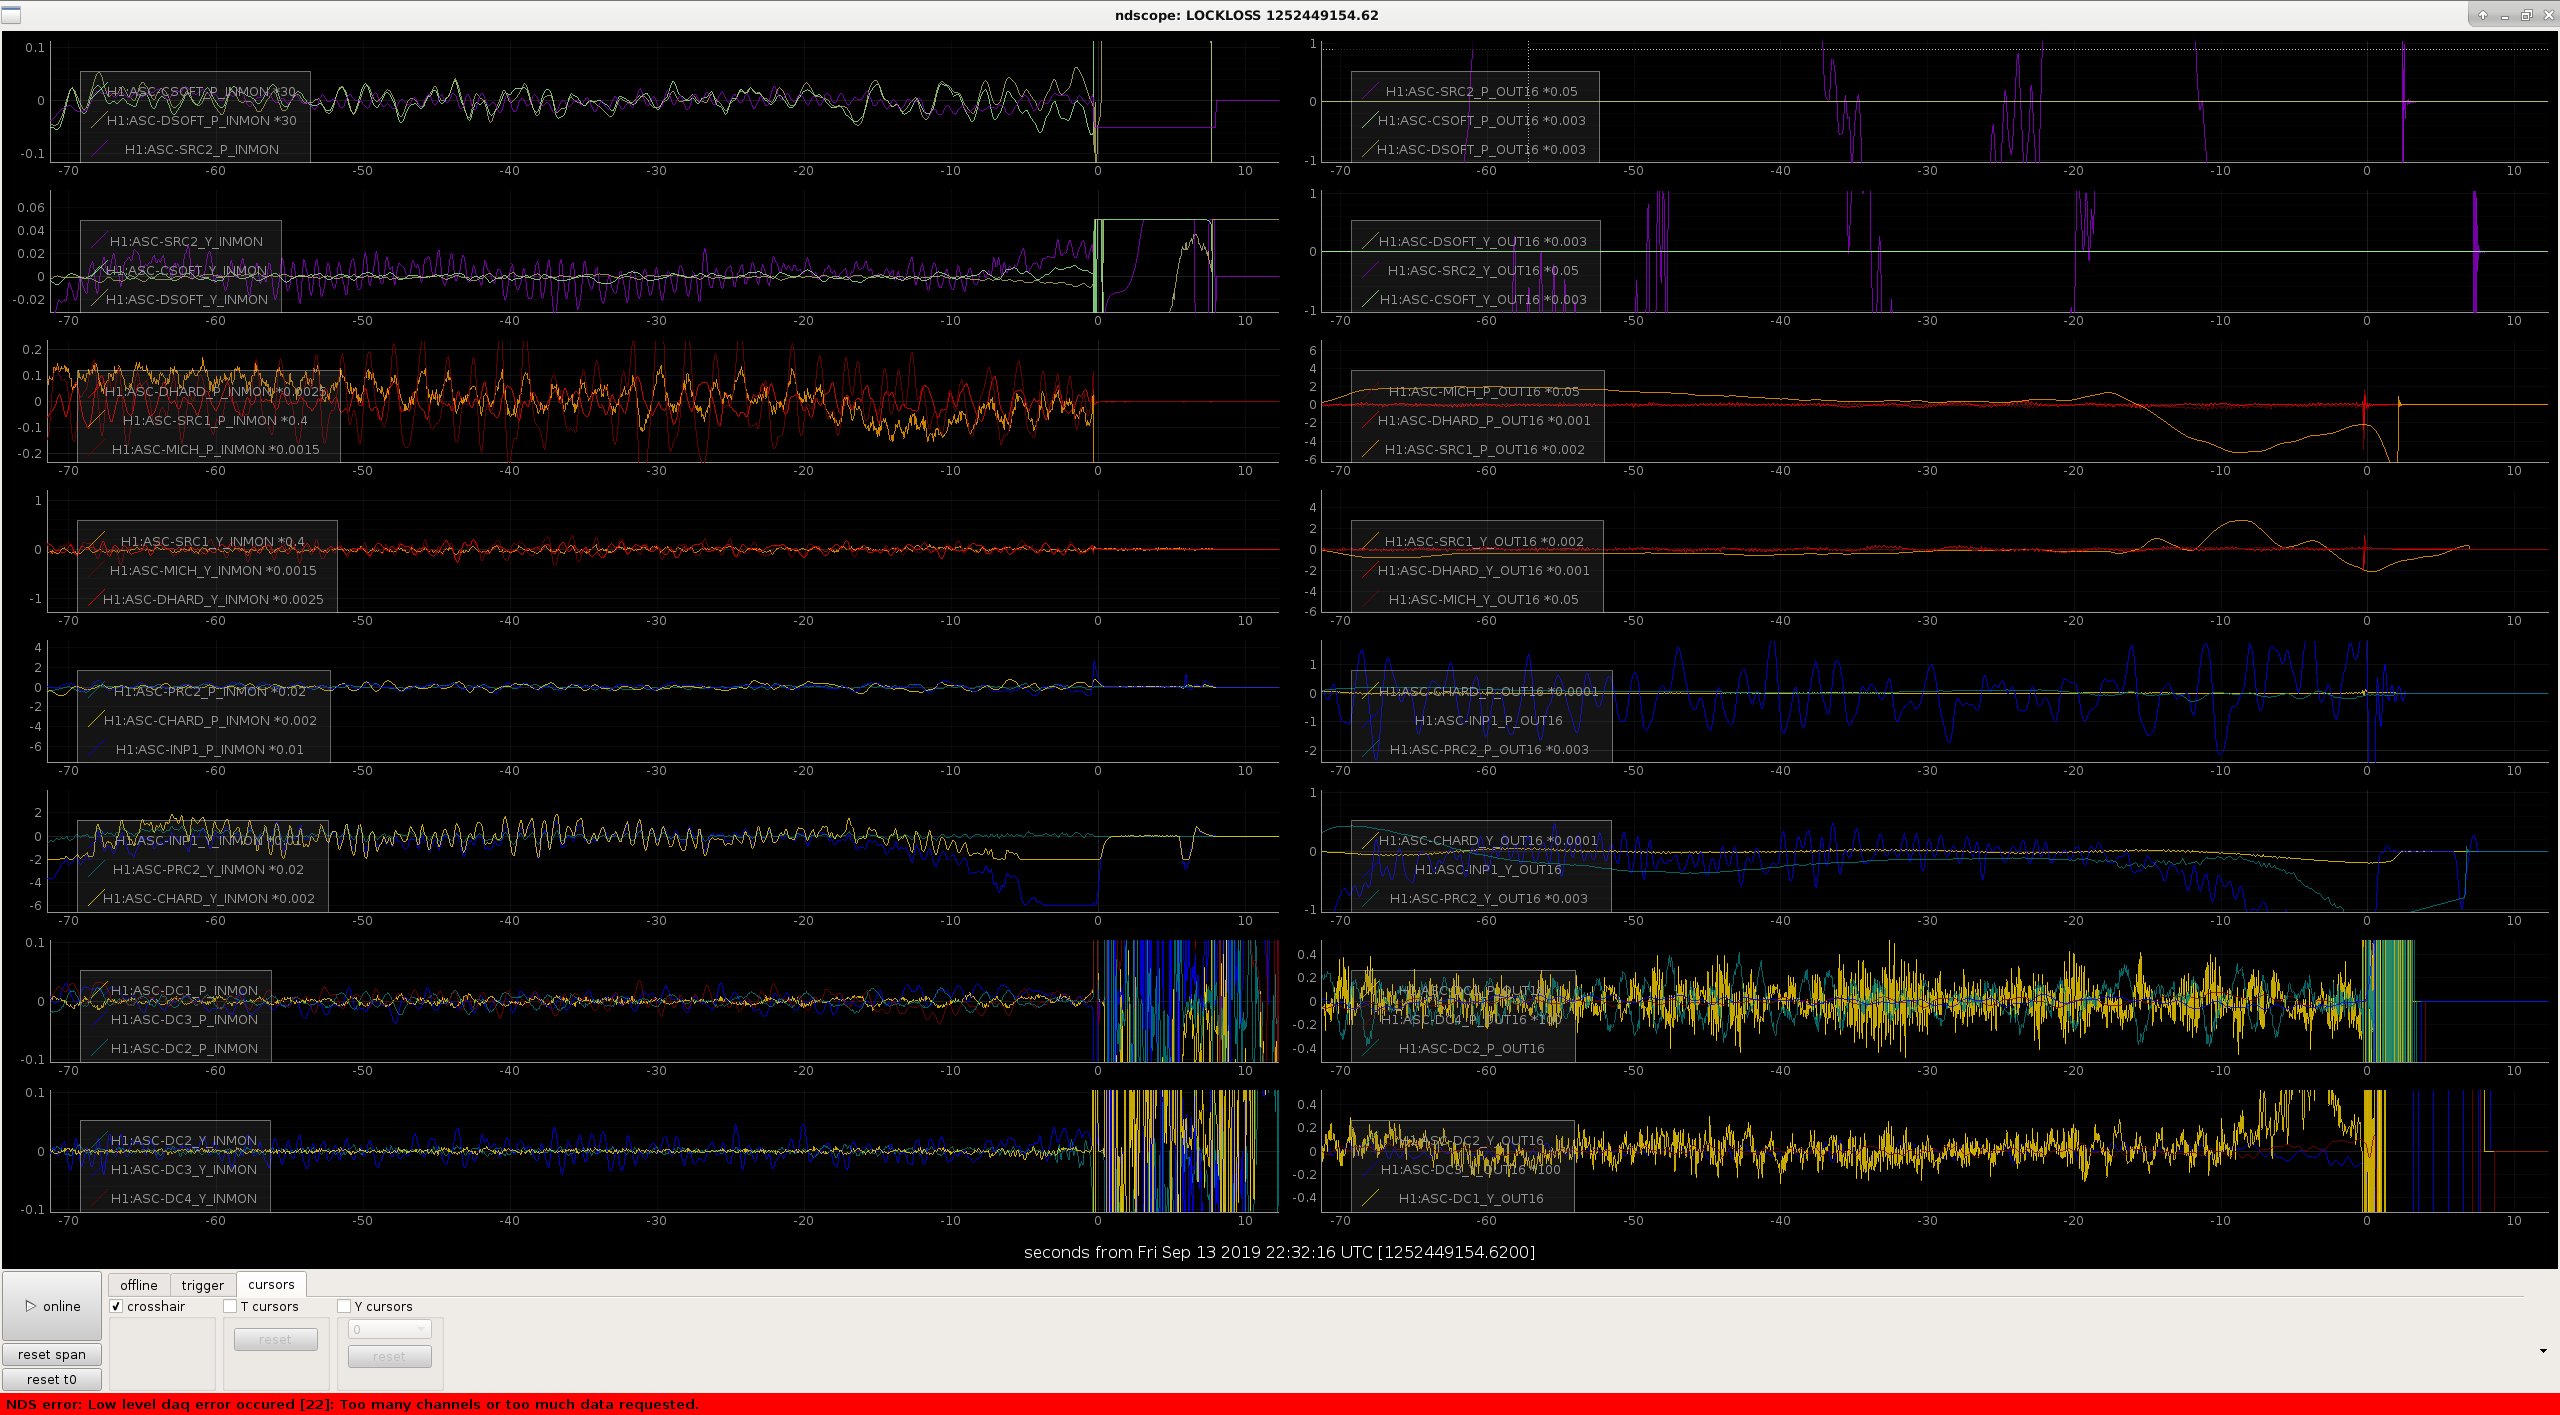
The attached ndscope for this lockloss shows both CHARD and INP1Y hitting the soft limiters in the 5 seconds before the lockloss. We use the soft limiters to allow us to turn on all the ASC loops at once, in principle we would like to not have soft limiters on our slowest loops, and only limit those which move fast so that the slow ones can keep up. We haven't taken the time to figure out which loops actually need the limiters, so we have them on all the loops that get engaged here. This means we are probably unnecessarily limiting the ability of our slower loops to keep up in some cases, so eventually we probably want to be more selective about which soft limiters we are using.
The soft limiter is only meant to help us when we are first engaging the loops. Once we have all the loops on and they have converged once, they shouldn't be on anymore since all they will do is make slow down the ASC system's ability to respond to disturbances. In this lockloss, INP1 + CHARD Y hit their limiters after everything was converged (I am not sure what caused a disturbance). I changed the guardian code so that the soft limiters will be turned off after the first convergence check.
Jeff is looking through some of our recent locklosses from ENGAGE_ASC to see if this could potentially have helped us avoid other similar locklosses.
I finished completing Jeff K's table below. Out of the lock losses from ENGAGE_ASC_FOR_FULL_IFO (STATE N = 430), 6 out of the 9 hit some soft limiters. Most consistently, it was INP1_Y and CHARD_Y. It's tough to say if there was correlation between lock losses before or after the PRC2/SRC1 gain increase at the end of that state.
Loops that get error signal limiters:
PRC2_
INP1_
CHARD_
SRC1_
SRC2_
Ones that don't DHARD, MICH, ADS3 (PRC1)
(1) need to wait for ramp off of offset on MICH
(2) after first convergence checker, we turn off the soft limiters. Used to be that we didn't turn off the soft limiteres until after the *second* converegnece checker ,which is after the PRC2/SRC1 boosts get turned on. So maybe the loops that were limited couldn't keep up with the new boosts.
Locklosses around ENGAGE_ASC_FOR_FULL_IFO (STATE N = 430)
search for guardian state 430
LLN GPS UTC What State? What Hits Soft Limits? Before or After PRC2/SRC1 Gain Increases?
1252450014 September 13 2019, 22:46:36 UTC 435 (no, survived) Well after, INP1, CHARD runaway
0 1252449154 September 13 2019, 22:32:16 UTC 430 INP1, CHARD After
1252421630 September 13 2019, 14:53:32 UTC 435 (no, survived) Well after, INP1, CHARD runaway
1252252912 September 11 2019, 16:01:34 UTC 429 INP1 is wildly oscillating Before (Sheila caused, increased INP1 gain too much )
1 1252249409 September 11 2019, 15:03:11 UTC 430 none After
1252145321 September 10 2019, 10:08:23 UTC 435 (no, survived) Well after, INP1, CHARD runaway
2 1252130742 September 10 2019, 06:05:24 UTC 430 CHARD
1252043449 September 09 2019, 05:50:31 UTC 430 INP1_Y, CHARD_Y After, INP1_P runaway
1251914435 September 07 2019, 18:00:17 UTC 435 none Well after, INP1_Y, CHARD_Y runaway
3 1251913373 September 07 2019, 17:42:35 UTC 430 CHARD
4 1251807482 September 06 2019, 12:17:44 UTC 430 CHARD, INP1
1251806452 September 06 2019, 12:00:34 UTC 430 none After
1231738298 September 05 2019, 17:04:40 UTC 435 none Well after, INP1_Y, CHARD_Y runaway
1251638577 September 05 2019, 13:22:39 UTC 430 CHARD_Y, INP1_Y After
1251636875 September 05 2019, 12:54:17 UTC 430 none After
Follow-up on this change: there have been several more lock-losses in/around the ENGAGE_ASC_FOR_FULL_IFO (see, e.g. operator report in LHO aLOG 51961). I'm not sure this guardian code change to move turning off the error signal ("smooth") limiters worked. One collective series during Travis' Sunday shift: GPS Time UTC Time State Error Limiters Hit Lock Loss Before / After PRC2/SRC1 Gain Increases Did Error Limiters Get Turned Off? 1252609254.84 Sep 15 2019, 19:00:36 UTC 430 none, but close After Yes (Made it to where they're turned off) 1252610293.71 Sep 15 2019, 19:17:55 UTC 430 CHARD_Y, INP1_Y After No 1252611608.05 Sep 15 2019, 19:39:50 UTC 430 none, but close After Yes (Made it to where they're turned off) 1252612537.75 Sep 15 2019, 19:55:19 UTC 430 CHARD_Y, INP1_Y After No 1252613443.62 Sep 15 2019, 20:10:25 UTC 430 CHARD_Y, INP1_Y After No 1252615042.75 Sep 15 2019, 20:37:04 UTC 430 CHARD_Y, INP1_Y After No 1252666222.31 Sep 16 2019, 10:50:04 UTC 430 CHARD_Y, INP1_Y After No For the record, so others can perform the same study: Command for lockloss tool used: lockloss -c /opt/rtcds/userapps/release/isc/h1/ndscope/asc_fullIFO.yml select - Looking at the error signals of the ndscope template (you'll likely have to zoom the y-axis out), look for "flat-lining" where the error signal appears to get large and goes to what looks like an artificially flat trace. Leading up to the above locklosses, this happens at ~ -6 for INPY1_Y and ~ -2 for CHARD_Y. - Looking through the guardian log, see where there are lines 2019-09-16_10:49:38.220815Z ISC_LOCK [ENGAGE_ASC_FOR_FULL_IFO.run] ezca: H1:ASC-PRC2_P_SW1 => 16 2019-09-16_10:49:38.474971Z ISC_LOCK [ENGAGE_ASC_FOR_FULL_IFO.run] ezca: H1:ASC-PRC2_P => OFF: FM1 2019-09-16_10:49:38.474971Z ISC_LOCK [ENGAGE_ASC_FOR_FULL_IFO.run] ezca: H1:ASC-PRC2_Y_SW1 => 16 2019-09-16_10:49:38.723825Z ISC_LOCK [ENGAGE_ASC_FOR_FULL_IFO.run] ezca: H1:ASC-PRC2_Y => OFF: FM1 2019-09-16_10:49:38.724816Z ISC_LOCK [ENGAGE_ASC_FOR_FULL_IFO.run] ezca: H1:ASC-SRC1_Y_SW1 => 16 2019-09-16_10:49:38.975953Z ISC_LOCK [ENGAGE_ASC_FOR_FULL_IFO.run] ezca: H1:ASC-SRC1_Y => OFF: FM1 2019-09-16_10:49:38.977005Z ISC_LOCK [ENGAGE_ASC_FOR_FULL_IFO.run] ezca: H1:ASC-SRC1_P_GAIN => 12 2019-09-16_10:49:38.977982Z ISC_LOCK [ENGAGE_ASC_FOR_FULL_IFO.run] ezca: H1:ASC-AS_A_RF36_Q_PIT_SW1 => 8 2019-09-16_10:49:39.229301Z ISC_LOCK [ENGAGE_ASC_FOR_FULL_IFO.run] ezca: H1:ASC-AS_A_RF36_Q_PIT => OFF: OFFSET 2019-09-16_10:49:39.230172Z ISC_LOCK [ENGAGE_ASC_FOR_FULL_IFO.run] ezca: H1:ASC-AS_A_RF36_Q_YAW_SW1 => 8 2019-09-16_10:49:39.481531Z ISC_LOCK [ENGAGE_ASC_FOR_FULL_IFO.run] ezca: H1:ASC-AS_A_RF36_Q_YAW => OFF: OFFSET 2019-09-16_10:49:39.482179Z ISC_LOCK [ENGAGE_ASC_FOR_FULL_IFO.run] ezca: H1:ASC-AS_A_RF36_Q_YAW_OFFSET => 0 2019-09-16_10:49:39.482503Z ISC_LOCK [ENGAGE_ASC_FOR_FULL_IFO.run] ezca: H1:ASC-AS_A_RF36_Q_PIT_OFFSET => 0 happen, in relation to lines like 2019-09-15_19:39:50.260416Z ISC_LOCK JUMP: ENGAGE_ASC_FOR_FULL_IFO->LOCKLOSS 2019-09-15_19:39:50.260416Z ISC_LOCK calculating path: LOCKLOSS->NOMINAL_LOW_NOISE 2019-09-15_19:39:50.267164Z ISC_LOCK new target: DOWN 2019-09-15_19:39:50.273348Z ISC_LOCK executing state: LOCKLOSS (2) 2019-09-15_19:39:50.274286Z ISC_LOCK [LOCKLOSS.enter] 2019-09-15_19:39:50.395063Z ISC_LOCK JUMP target: DOWN namely, if they're before or after lines like 2019-09-15_19:39:46.596598Z ISC_LOCK [ENGAGE_ASC_FOR_FULL_IFO.run] ezca: H1:ASC-INP1_P_SMOOTH_ENABLE => 0 2019-09-15_19:39:46.596943Z ISC_LOCK [ENGAGE_ASC_FOR_FULL_IFO.run] ezca: H1:ASC-INP1_Y_SMOOTH_ENABLE => 0 2019-09-15_19:39:46.597208Z ISC_LOCK [ENGAGE_ASC_FOR_FULL_IFO.run] ezca: H1:ASC-CHARD_P_SMOOTH_ENABLE => 0 2019-09-15_19:39:46.597478Z ISC_LOCK [ENGAGE_ASC_FOR_FULL_IFO.run] ezca: H1:ASC-CHARD_Y_SMOOTH_ENABLE => 0 2019-09-15_19:39:46.598132Z ISC_LOCK [ENGAGE_ASC_FOR_FULL_IFO.run] ezca: H1:ASC-PRC2_P_SMOOTH_ENABLE => 0 2019-09-15_19:39:46.598455Z ISC_LOCK [ENGAGE_ASC_FOR_FULL_IFO.run] ezca: H1:ASC-PRC2_Y_SMOOTH_ENABLE => 0 2019-09-15_19:39:46.598808Z ISC_LOCK [ENGAGE_ASC_FOR_FULL_IFO.run] ezca: H1:ASC-SRC1_P_SMOOTH_ENABLE => 0 2019-09-15_19:39:46.599082Z ISC_LOCK [ENGAGE_ASC_FOR_FULL_IFO.run] ezca: H1:ASC-SRC1_Y_SMOOTH_ENABLE => 0 2019-09-15_19:39:46.599343Z ISC_LOCK [ENGAGE_ASC_FOR_FULL_IFO.run] ezca: H1:ASC-SRC2_P_SMOOTH_ENABLE => 0 ... if they happen. As indicated above, most did not happen.
Sheila confirms, after discussing my review with her, that it was likely that code changes did not get loaded.
I've loaded the ISC_LOCK guardian code this afternoon, during the calibration measurement period.
2019-09-16_21:16:49.389046Z ISC_LOCK LOAD REQUEST
2019-09-16_21:16:49.390035Z ISC_LOCK RELOAD requested. reloading system data...
2019-09-16_21:16:49.423530Z /opt/rtcds/userapps/release/isc/h1/guardian/ISC_LOCK.py: inconsistent use of tabs and spaces in indentation
2019-09-16_21:16:50.217943Z /opt/rtcds/userapps/release/isc/h1/guardian/ISC_LOCK.py: inconsistent use of tabs and spaces in indentation
2019-09-16_21:16:50.274528Z ISC_LOCK module path: /opt/rtcds/userapps/release/isc/h1/guardian/ISC_LOCK.py
2019-09-16_21:16:50.275249Z ISC_LOCK user code: /opt/rtcds/userapps/release/isc/h1/guardian/switch_SDF_source_files.py
2019-09-16_21:16:50.275249Z ISC_LOCK user code: /opt/rtcds/userapps/release/sys/common/guardian/cdslib.py
2019-09-16_21:16:50.275249Z ISC_LOCK user code: /opt/rtcds/userapps/release/isc/h1/guardian/lscparams.py
2019-09-16_21:16:50.275249Z ISC_LOCK user code: /opt/rtcds/userapps/release/isc/h1/guardian/ISC_GEN_STATES.py
2019-09-16_21:16:50.275249Z ISC_LOCK user code: /opt/rtcds/userapps/release/isc/h1/guardian/ISC_library.py
2019-09-16_21:16:50.275249Z ISC_LOCK user code: /opt/rtcds/userapps/release/isc/h1/guardian/fast_ezca.py
2019-09-16_21:16:55.589754Z ISC_LOCK system archive: code changes detected and committed
2019-09-16_21:16:56.618081Z ISC_LOCK system archive: id: d347c69389743cbdc979e7dfbc2df8a33cd97f2a (221543529)
2019-09-16_21:16:56.618594Z ISC_LOCK RELOAD complete
2019-09-16_21:16:56.619981Z ISC_LOCK W: RELOADING @ NLN_CAL_MEAS.run
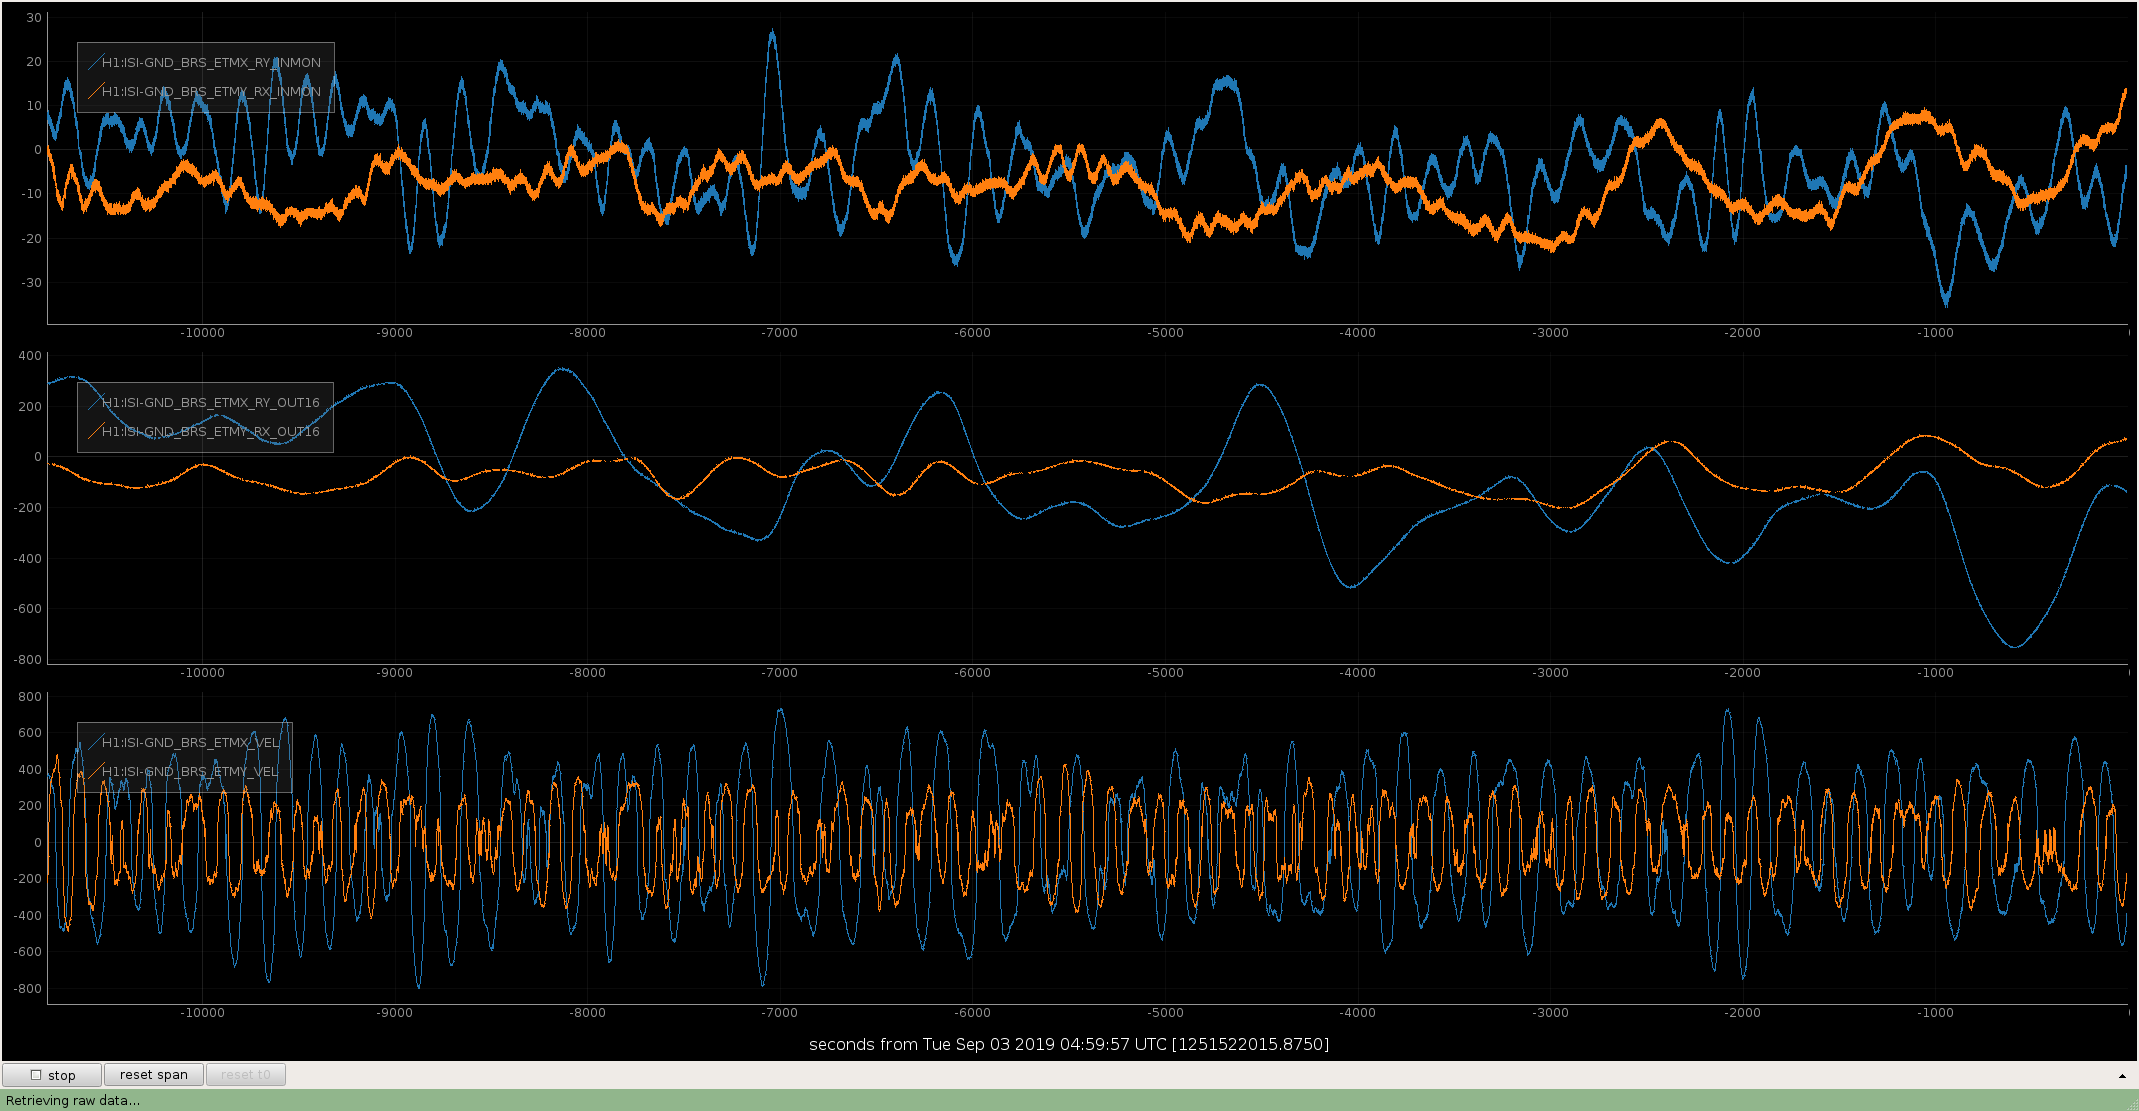
Ed called about difficulty locking, since I don't see anything obvious I looked at BRS channels I foudn trended here: 51338. It looks like the low frequency BLRMS of BRS X has been growing exponentially.
Here's th BRS HEALTH ndscope image during ENGAGE_SOFT_LOOPS
I don't see anything problematic really in the time series. But I did notice from the Detchar summary pages that there was some weird behavior with the inside temperature for a few hours from 16 UTC yesterday (02/09/2019). It takes hours until the BRS itself responds to temperature changes so I'm just guessing but you might be seeing the effects of that. You might consider turning the sensor correction to NON BRS state and lock since the wind is low now anyways. Here is the plot of the temperature
?
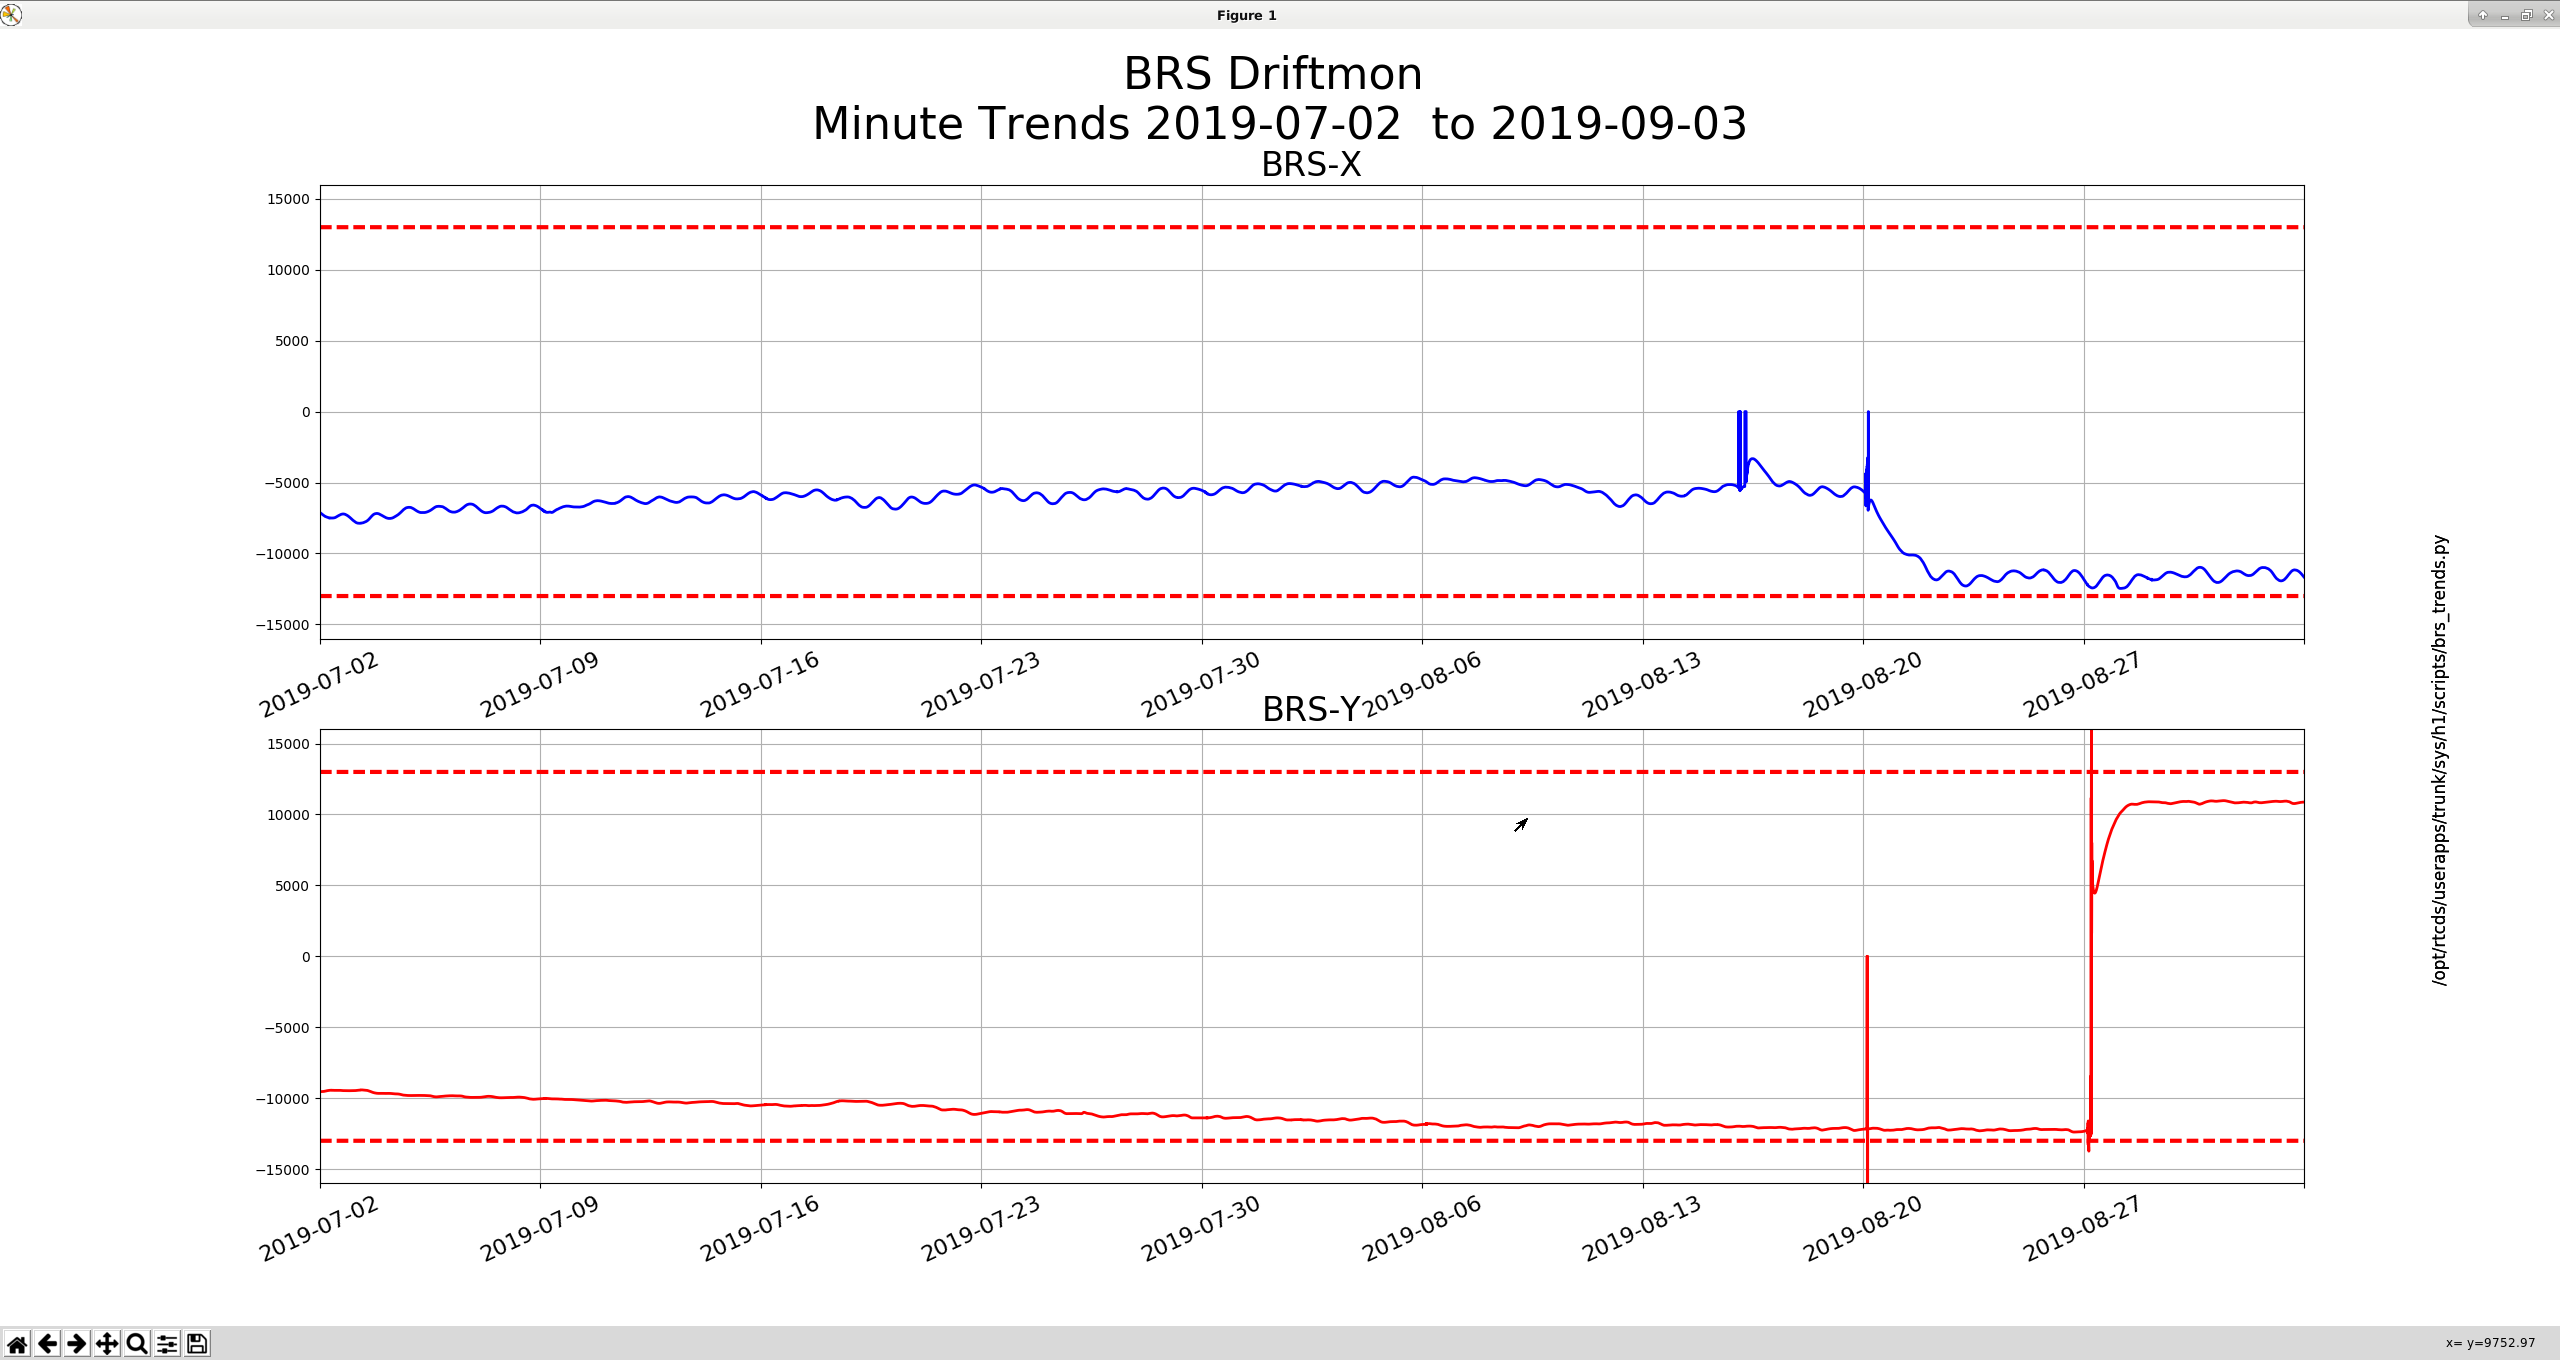
I don't think there is anything wrong with BRSX. First attached trend are 7 weeks of the both BRS driftmons, which are kind of a measure of the DC position. BRSX is close to the level where I would want to recenter, but I hope to push that off until we try to install Eyal and Arnaud's heating pad. I don't think the "strangeness" Eyal notes is anything to be worried about. It's a tenth of a degree, from 8am local to about 4pm, probably the aircon.
Second plot are 4 days of trends for ISC_LOCK (top left), the sensor correction control signal generated from the tilt subtracted STS (bottom left) and the drift (top right) and velocity of BRSX (bottom right). I don't see any signals in the right 2 plots that would cause the spikes in the sensor correction (so I'm assuming they are earthquakes, but I'll keep looking), or would be any cause for concern.
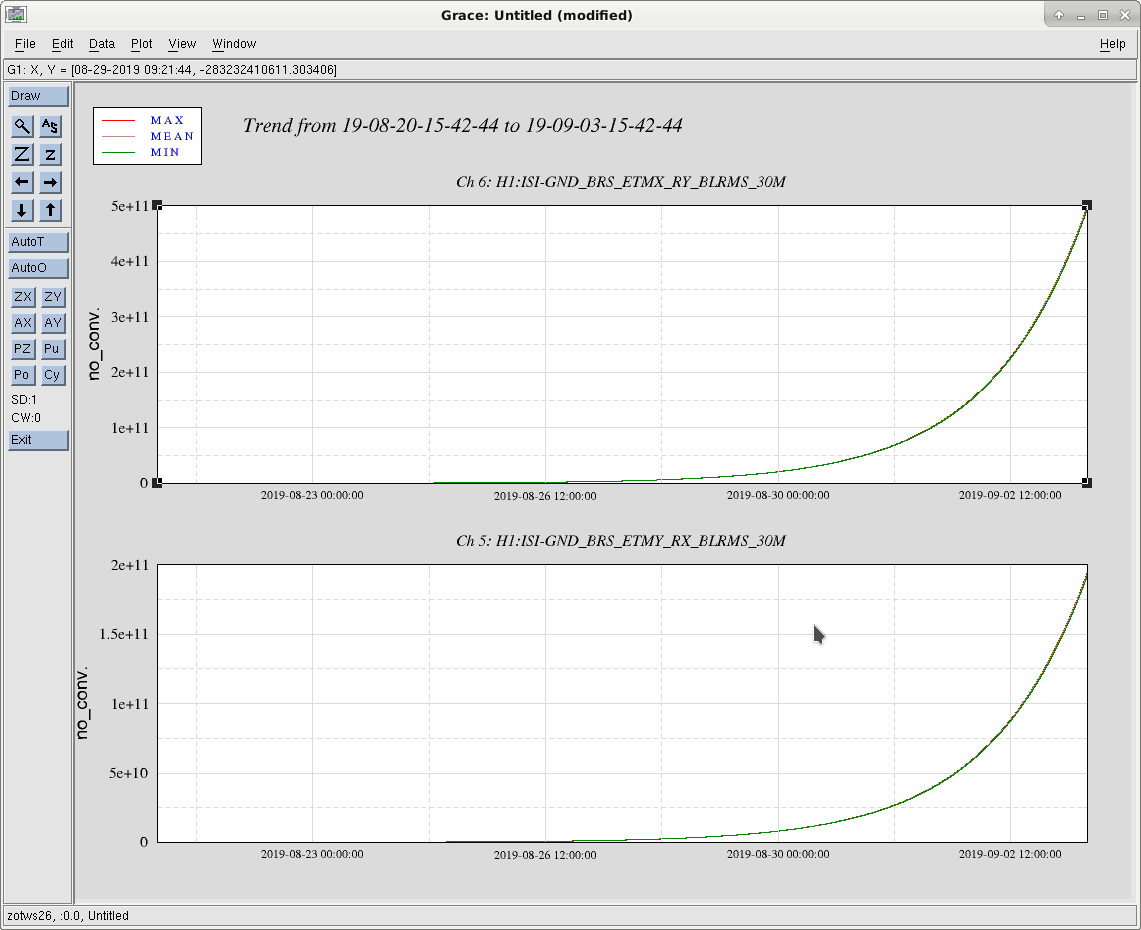
I don't know why the lowest frequency BLRMS of the BRS seem to accumulate these large numbers but I don't think it's a problem. Or if it is, both BRS are busted. Third image is the BLRMS for both BRS for the last 2 weeks. Maybe this is some sort of computational weirdness? Some integrator in the BLRMS filter? Maybe we should periodically clear the histories of some of the filters.
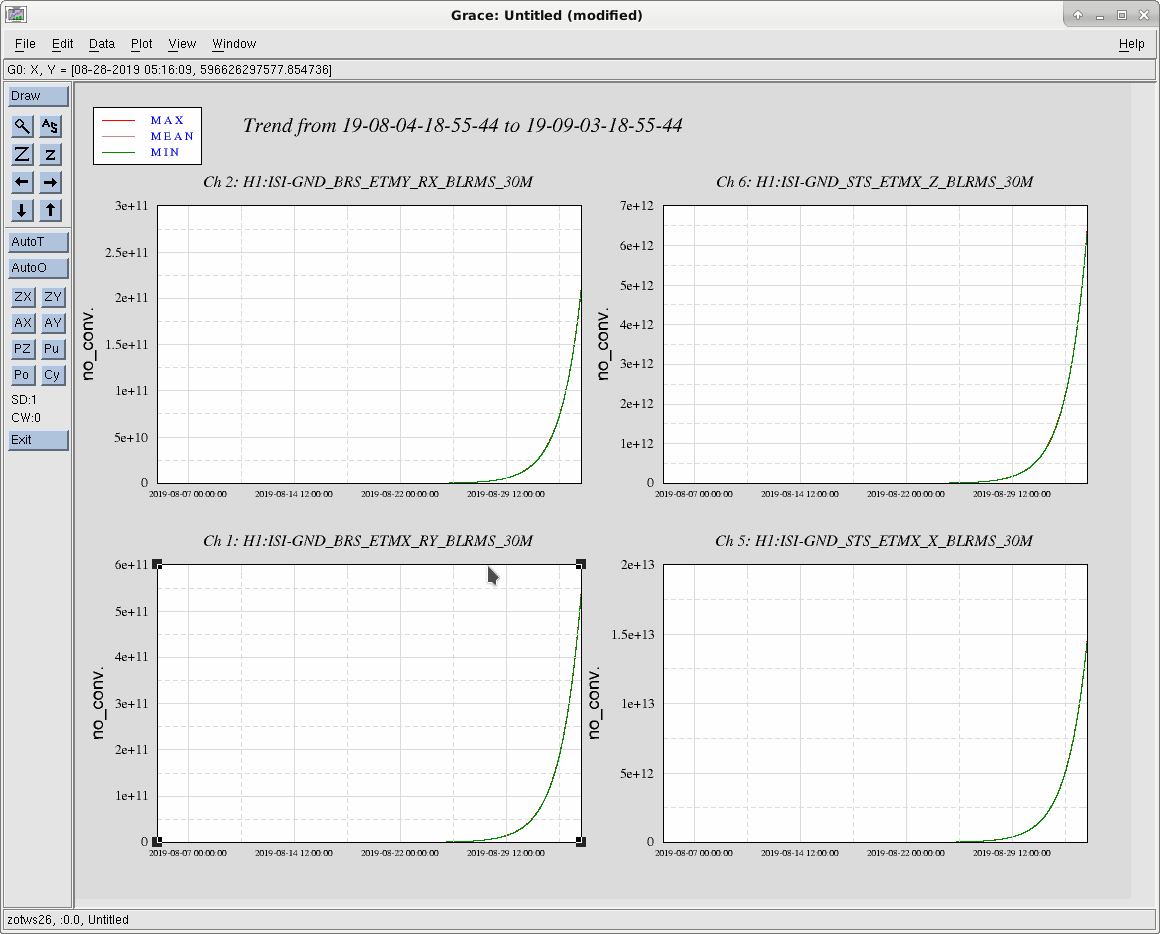
I've looked at few non-brs blrms channels and all of the dc-30mhz blrms channels show this same behavior. The 30mhz low pass is just integrating non-sense. There is no easy way to clear the history of the filter that does the calculation, without restarting the model. Dave and I are talking about adding an epic variable to zero out the filter. We will try prototyping on the test stand.
can you inject in parallel a negative large DC to try and zero it out?
The 30mhz BLRMS filter shouldn't be integrating like this. Filed FRS https://services.ligo-la.caltech.edu/FRS/show_bug.cgi?id=13602
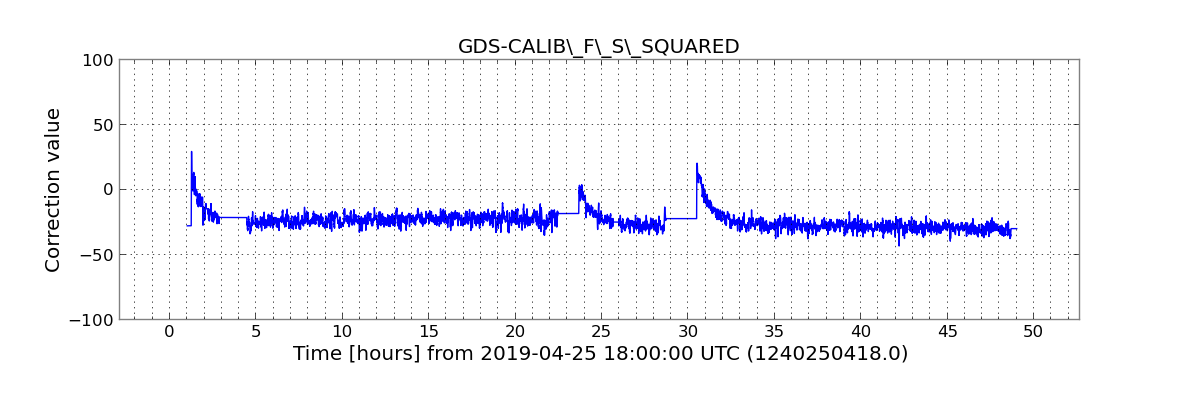
This is a continuation of the investigation in this aLOG comment: https://alog.ligo-wa.caltech.edu/aLOG/index.php?callRep=49620 I've plotted 48 hours of data beginning at 19:00 UTC on April 25, 2019. The goal was to capture the SR3 change noted here: https://alog.ligo-wa.caltech.edu/aLOG/index.php?callRep=48787. There is no obvious noteworthy change in the spring frequency or quality factor seen in this plot, only the usual changes in the few hours at the beginning of each lock stretch. The last plot shows trends of DeltaL / Pcal for the same 48-hour period, comparing C00 to a calibration that additionally corrects for time dependence in fs and Q, as well as kappa_PUM and kappa_UIM. It is consistent with the result of the previous aLOG comment, showing that compensating for more time dependence consistently improves calibration accuracy.
Quick trend comparing SRC spring freqnuency against BNS range and DRMI power levels. This will be done much more carefully ... soon.
[J. Kissel, A. Viets] At Jeff's request, I made time series plots of the SRC optical spring squared frequency with several front-end channels on the same plot, to see which are highly correlated. Additionally, I've listed (in the same order as the plots) the Pearson correlation coefficients between fs^2 and each other channel. Note that the correlation is reduced by two effects: first, fs^2 is not computed during lock loss and therefore remains constant, and second, noisy fluctuations (on ~2 minute time scales for fs^2, since that is about how much input data is used to compute each output value) are probably not correlated. Channel Name Name in Plot Correlation Coefficient Description H1:LSC-TR_Y_NORM_INMON TRY -0.07759334 arm cavity power, normalized to power when the Y arm is locked alone H1:LSC-TR_X_NORM_INMON TRX -0.07641386 arm cavity power, normalized to power when the X arm is locked alone H1:LSC-POPAIR_B_RF90_I_NORM_MON POP90 0.00209429 45 MHz sidebands inside PRC H1:LSC-POPAIR_B_RF18_I_NORM_MON POP18 0.05289885 9 MHz sidebands inside PRC H1:LSC-PR_GAIN_OUT16 PRG -0.0719822 power recycling gain H1:LSC-POP_A_LF_OUT16 POP DC -0.09153975 power inside the PRC H1:LSC-REFL_A_LP_NORM REFL DC 0.01795835 power reflected off of the input to PRM H1:IMC-MC2_TRANS_SUM_OUT16 IMC TRANS -0.08331603 power transmitted from the IMC By eye, the power recycling gain, the power in both arm cavities, the power in the PRC, seem to be consistently negatively correlated. So it would appear that the SRC's optical spring frequency is related in some way to the power circulating in the detector. Note the physical meaning of fs^2 as we have defined it: a positive value indicates an optical anti-spring, and a negative value indicates an optical spring. Based on these results, more power in the detector => optical spring is less "anti" and more "pro."
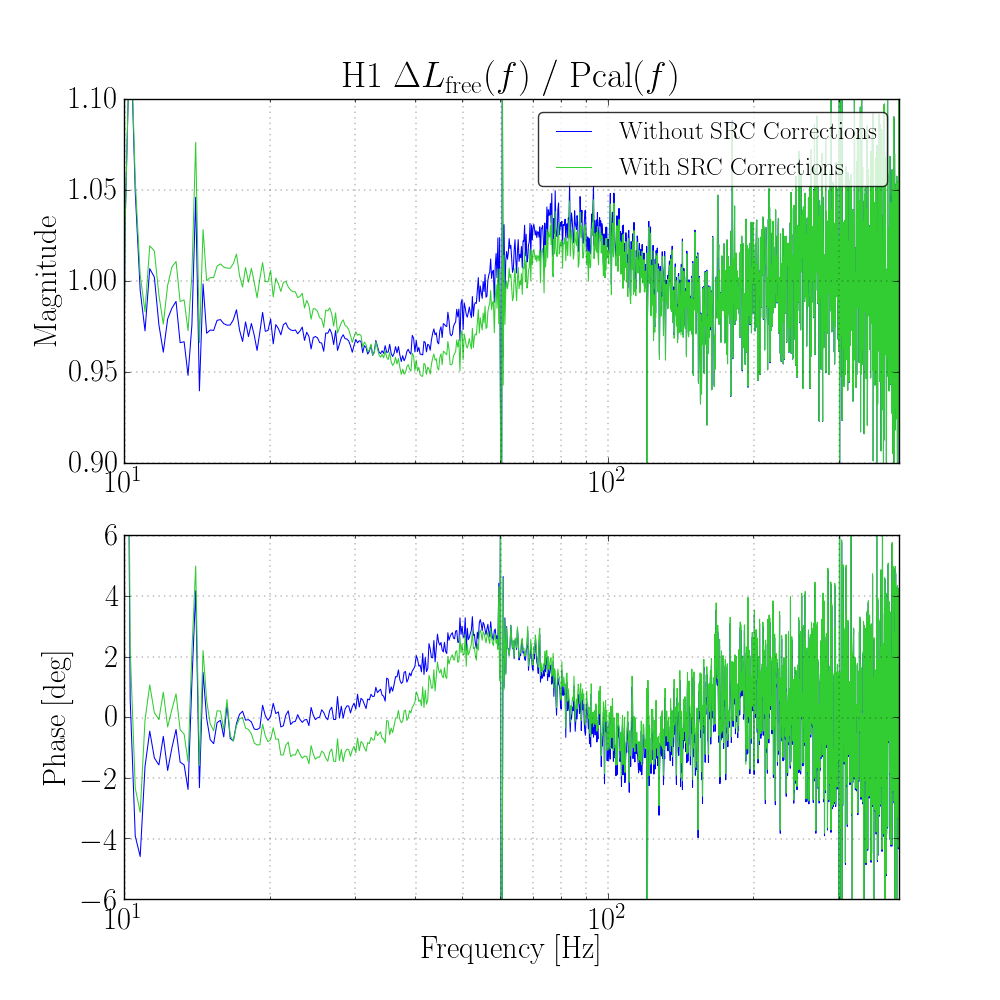
The original aLOG entry shows that correcting for time-dependent systematic errors in the sensing function assuming a model with SRC detuning improves calibration accuracy at the lowest Pcal line frequency. Given that we now believe the primary cause of low-frequency time-dependent systematic errors in the sensing function is a parasitic coupling of angular motion sensing to DARM rather than SRC detuning (see G1901353 and LHO aLOG 50992), I wanted to investigate whether correcting for SRC detuning could lead to an overall improvement in calibration accuracy. The short answer is "Well, close to the lowest Pcal line, yes, but not reliably at other frequencies." I used four Y-end Pcal broadband injections (RX channel), and plotted DeltaL / Pcal from 10-400 Hz for two calibrated data sets: one that corrected for all modeled time-dependence except SRC detuning (spring frequency f_s and quality factor Q), and one that additionally includes time-dependent corrections for SRC detuning. In order to get a measurement of all time-dependent correction factors, I started the gstlal calibration pipeline ~1 hour before the broadband injection, since the calibration lines are turned off during the injections. The dates and associated aLOGs are listed below in the same order as the plots:
Text files with the data of the plots in the previous comment can be found in the calibration SVN in this directory:
aligocalibration/trunk/Runs/O3/H1/Measurements/FullIFOSensingTFs/
with names like
H1_With_SRC_Corrections_over_CAL-PCALY_RX_PD_OUT_DQ_[GPS_START_TIME]-[DURATION].txt
for data corrected for "SRC detuning" time dependence and names like
H1_Without_SRC_Corrections_over_CAL-PCALY_RX_PD_OUT_DQ_[GPS_START_TIME]-[DURATION].txt
for data that is not.
Since there is now precedent, I've moved and committed the above mentions "DCS analysis of broadband injections" text files in to the DCS_BB_plots/ directory, e.g.
/ligo/svncommon/CalSVN/aligocalibration/trunk/Runs/O3/H1/Measurements/FullIFOSensingTFs/DCS_BB_plots/
H1_Without_SRC_Corrections_over_CAL-PCALY_RX_PD_OUT_DQ_1244406526-120.txt
H1_Without_SRC_Corrections_over_CAL-PCALY_RX_PD_OUT_DQ_1246226240-120.txt
H1_Without_SRC_Corrections_over_CAL-PCALY_RX_PD_OUT_DQ_1247431237-120.txt
H1_Without_SRC_Corrections_over_CAL-PCALY_RX_PD_OUT_DQ_1248718240-120.txt
H1_With_SRC_Corrections_over_CAL-PCALY_RX_PD_OUT_DQ_1244406526-120.txt
H1_With_SRC_Corrections_over_CAL-PCALY_RX_PD_OUT_DQ_1246226240-120.txt
H1_With_SRC_Corrections_over_CAL-PCALY_RX_PD_OUT_DQ_1247431237-120.txt
H1_With_SRC_Corrections_over_CAL-PCALY_RX_PD_OUT_DQ_1248718240-120.txt