TITLE: 06/05 Eve Shift: 23:00-07:00 UTC (16:00-00:00 PST), all times posted in UTC
STATE of H1: Commissioning
OUTGOING OPERATOR: Ed
CURRENT ENVIRONMENT:
Wind: 34mph Gusts, 27mph 5min avg
Primary useism: 0.13 μm/s
Secondary useism: 0.09 μm/s
QUICK SUMMARY: commissioning in progress
TITLE: 06/05 Day Shift: 15:00-23:00 UTC (08:00-16:00 PST), all times posted in UTC
STATE of H1: Lock Acquisition
INCOMING OPERATOR: Cheryl
SHIFT SUMMARY:
Commissioning most of the day and is still ongoing
LOG:
15:56 Apollo contractor changing AC lines in VPW - may cause alarms.
16:43 Chris changing lights in the optics lab
16:45 H&L Electric on site at LSB - about an hour for work
20:59 Hugh out to roof
Laurence Datrier, Sheila Dwyer
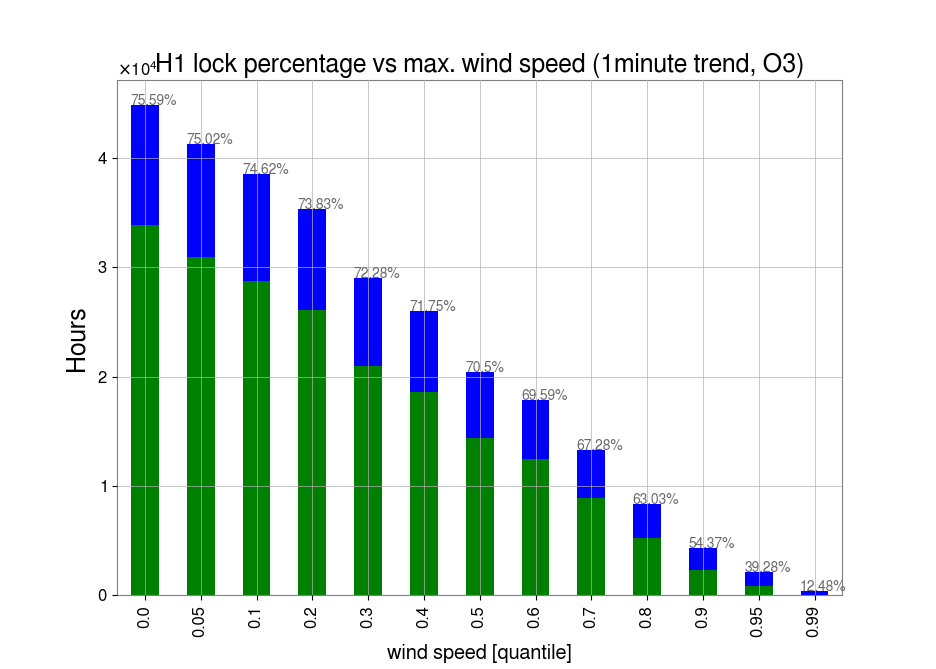
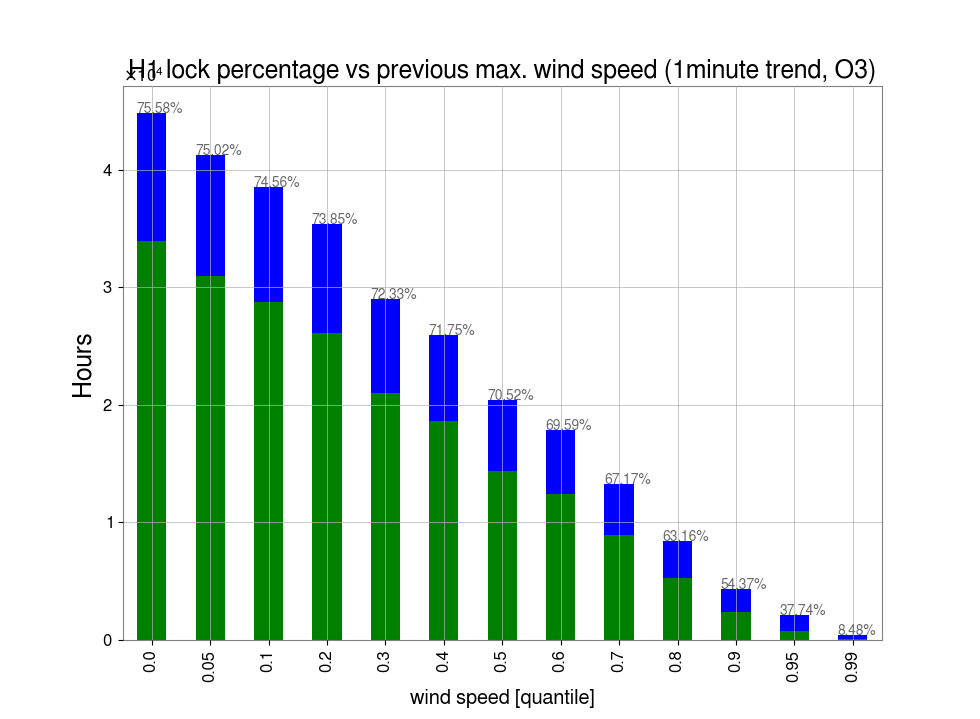
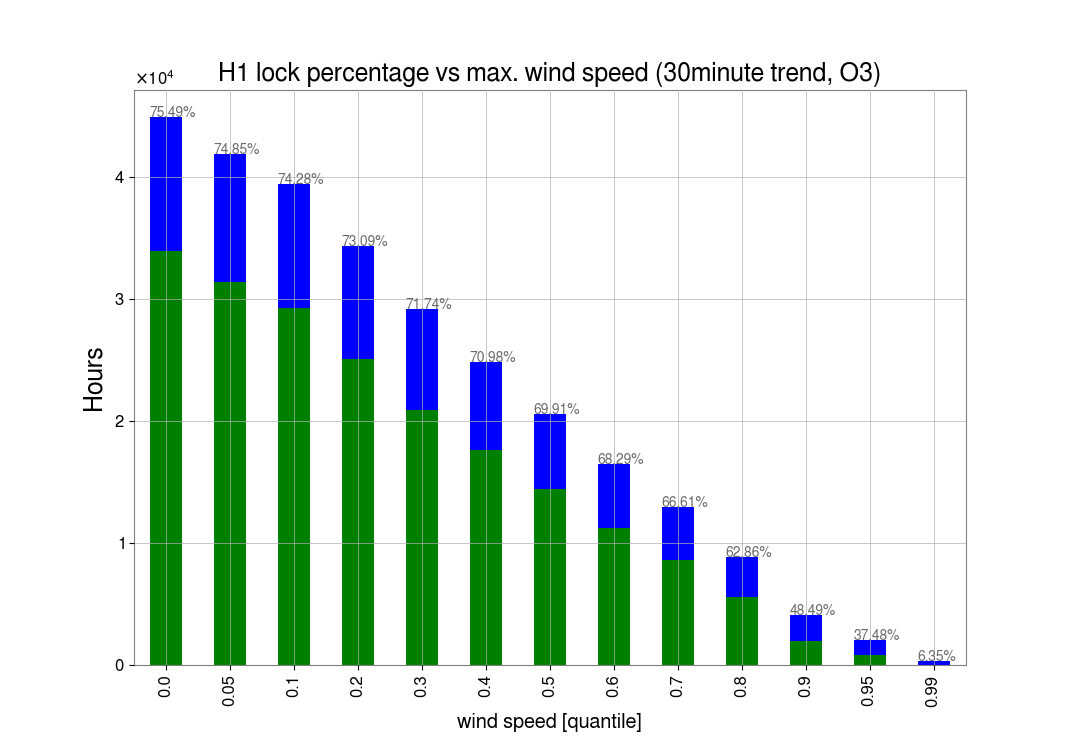
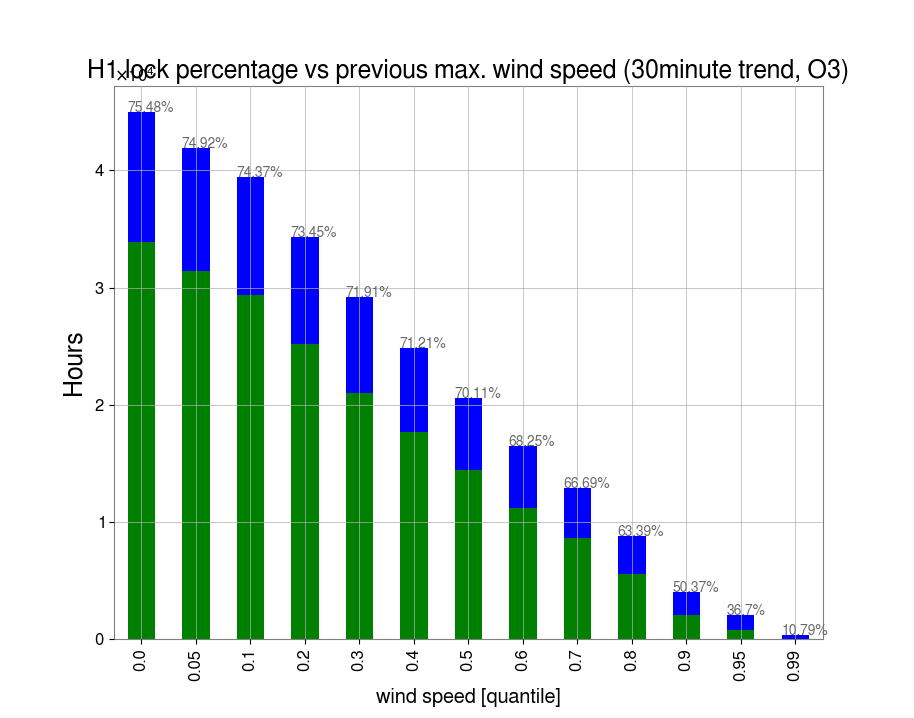
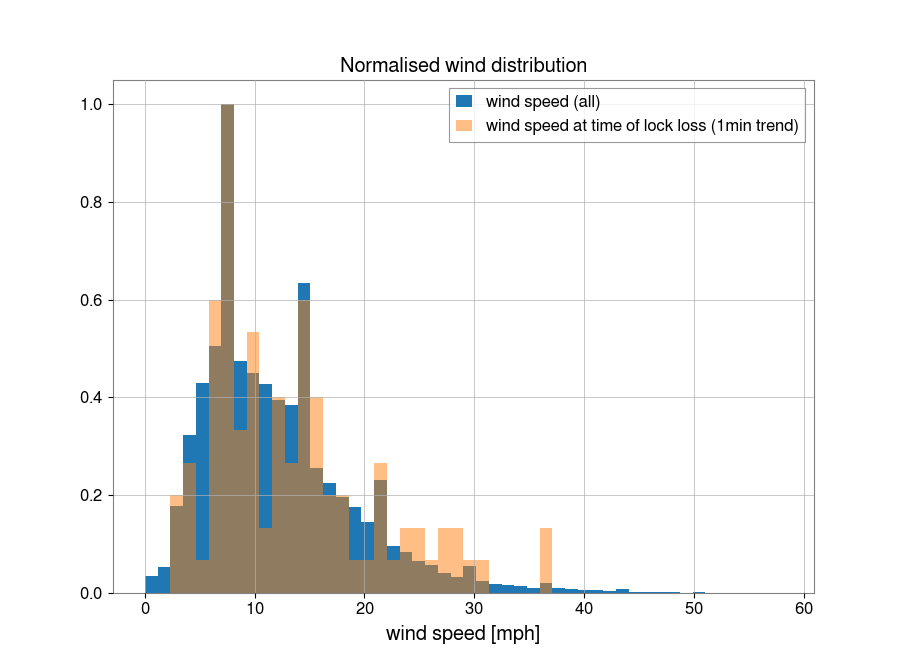
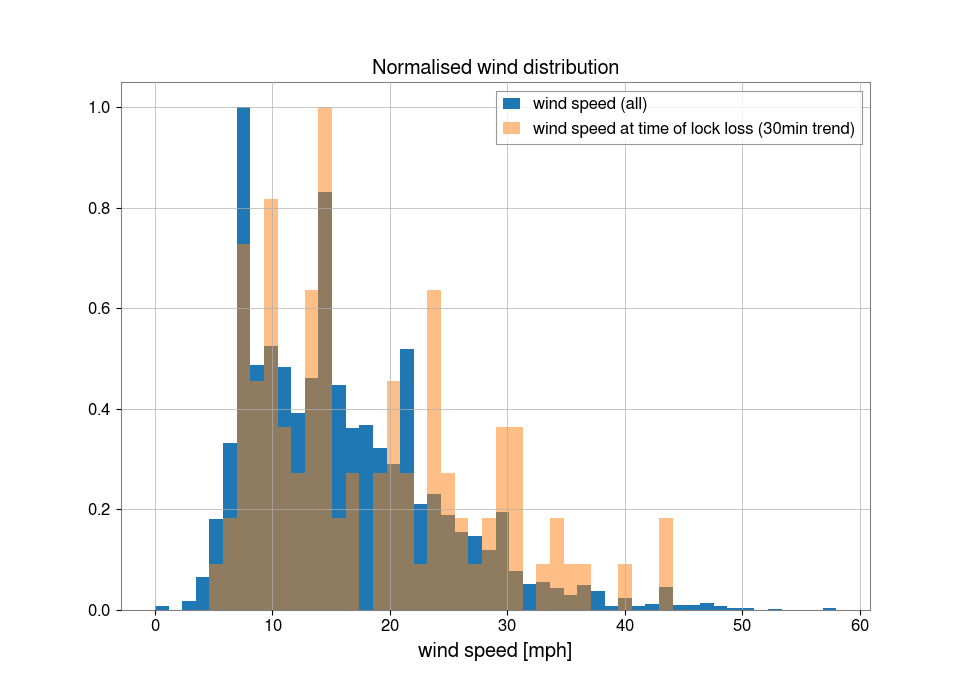
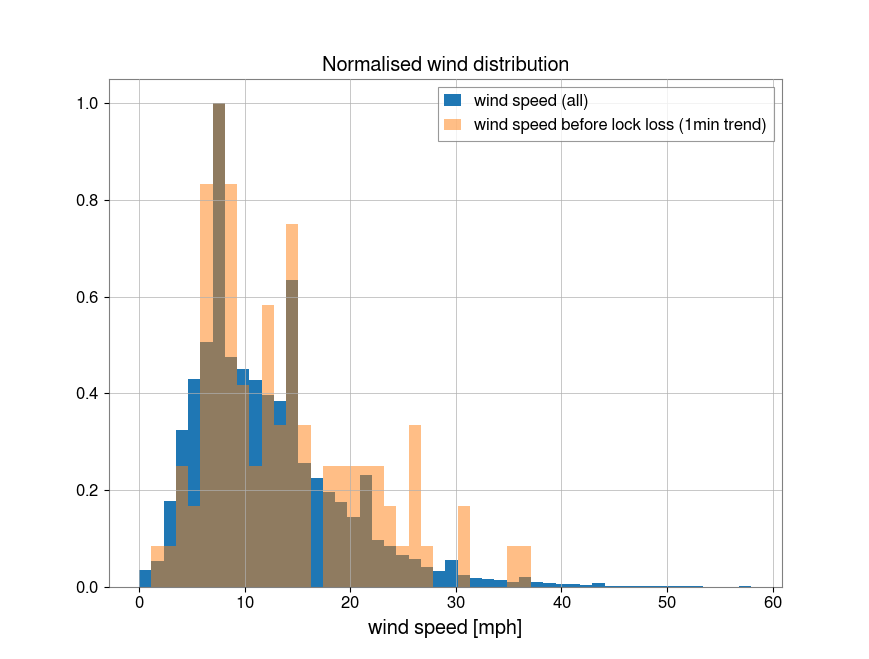
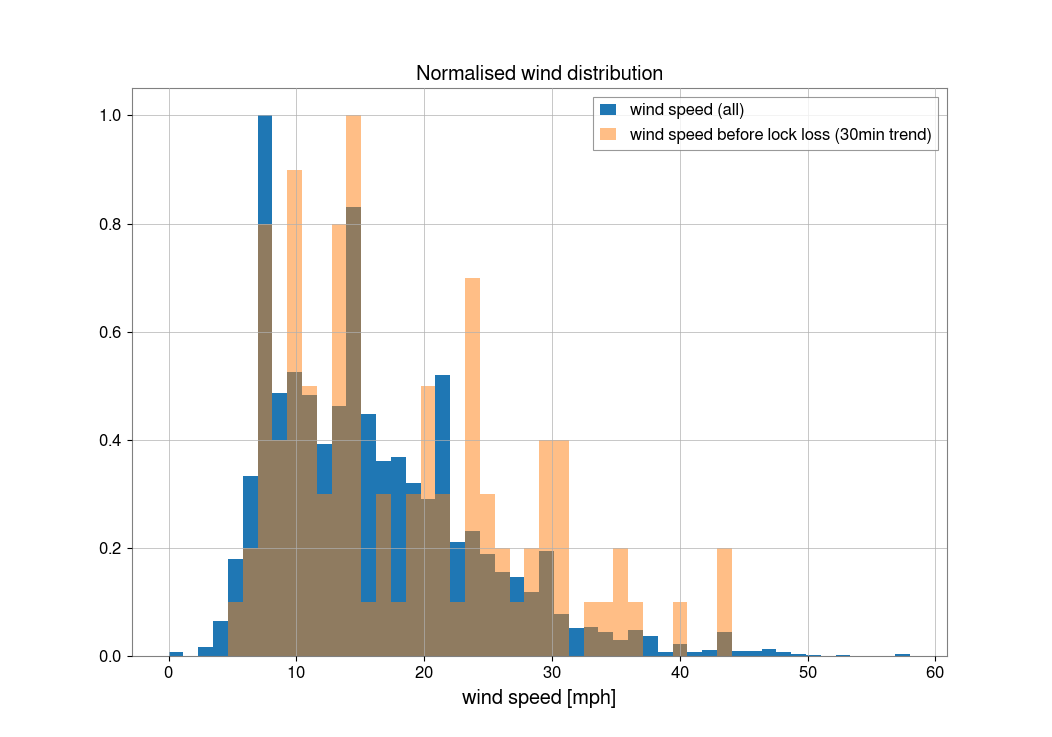
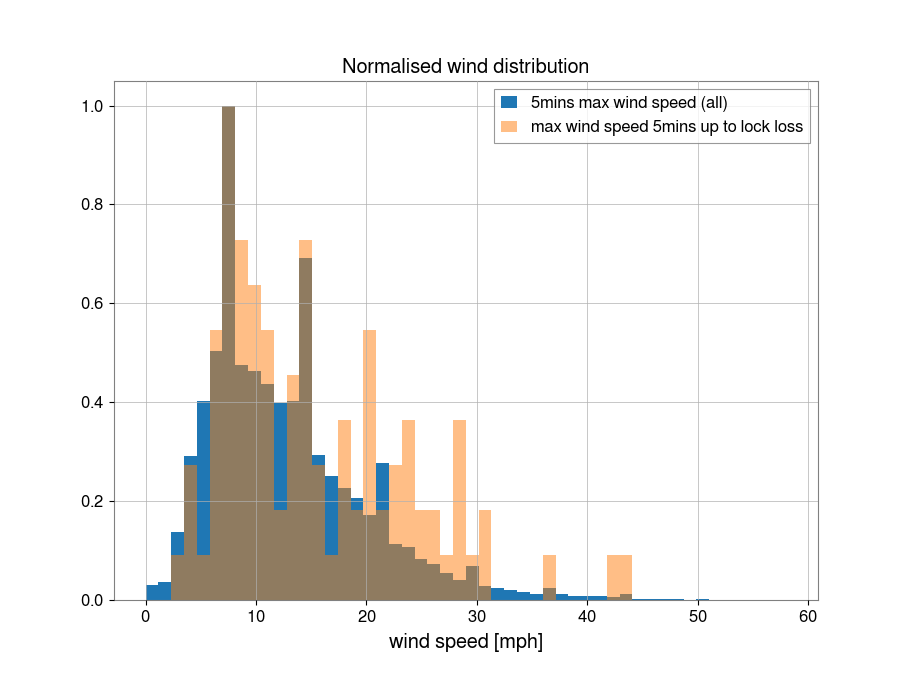
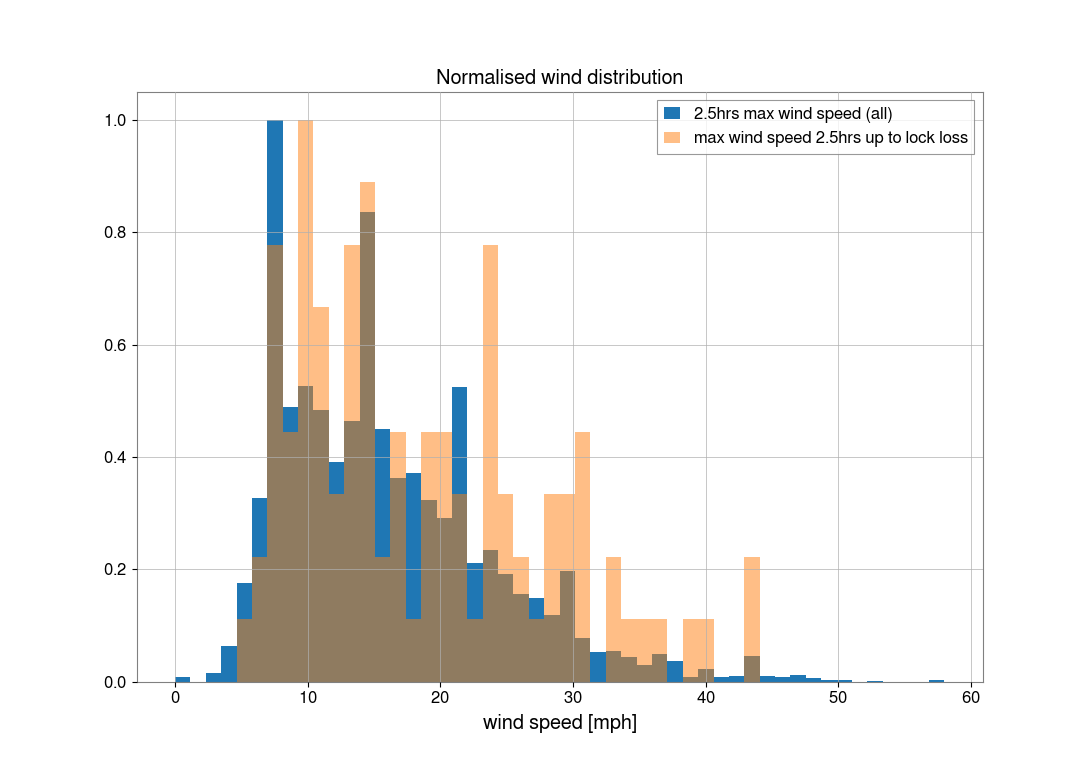
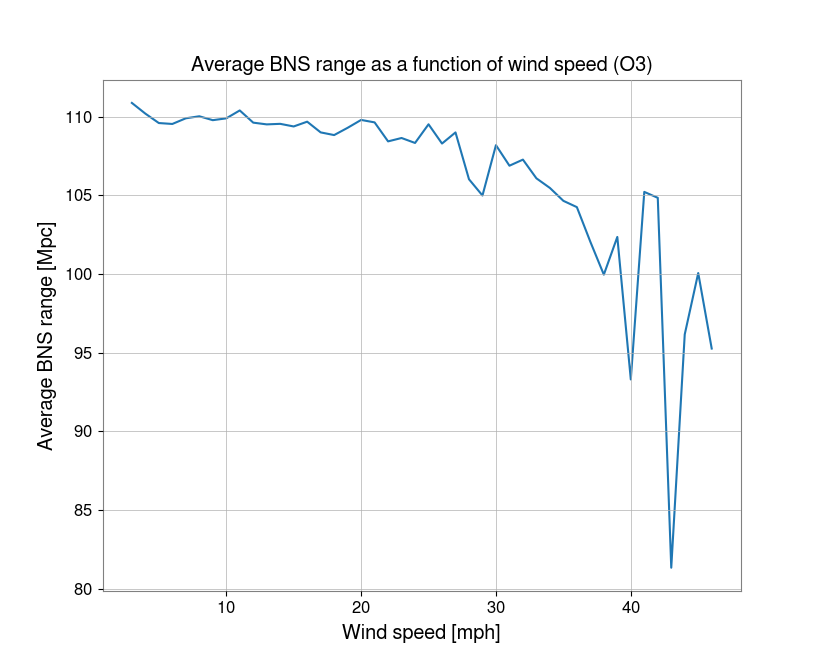
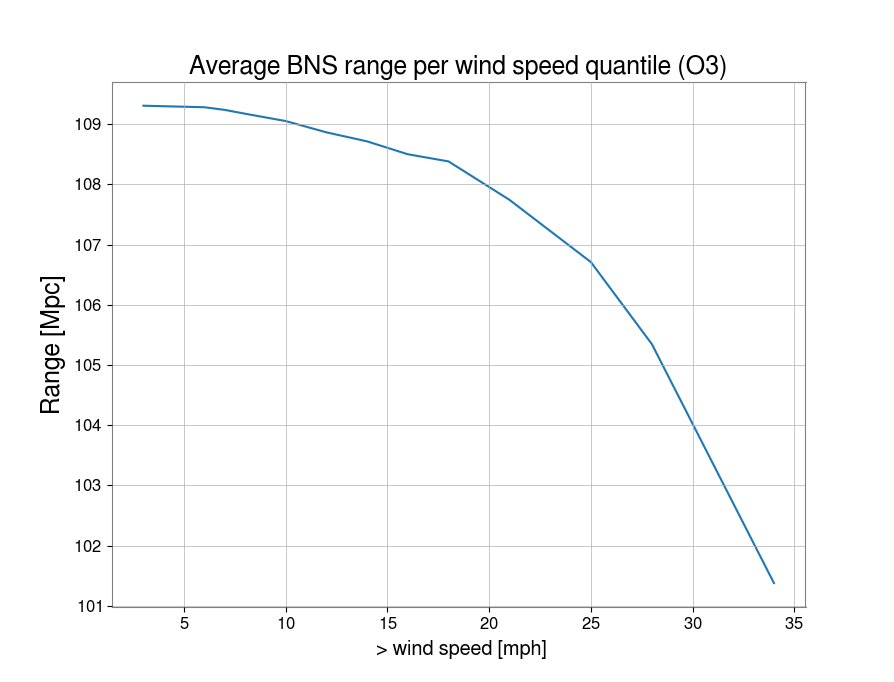
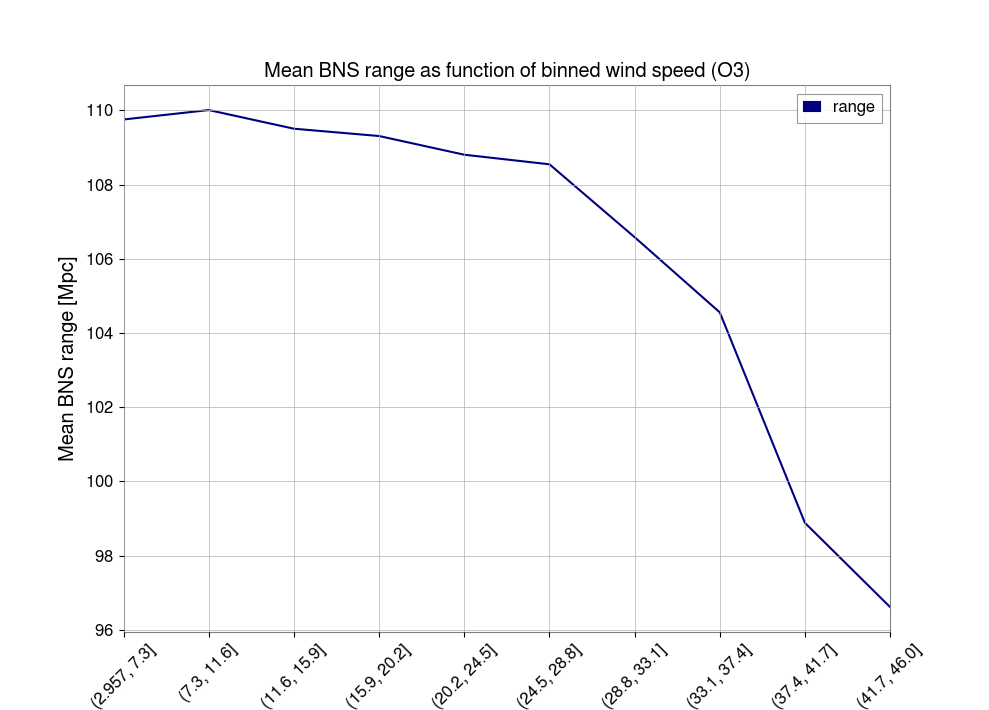
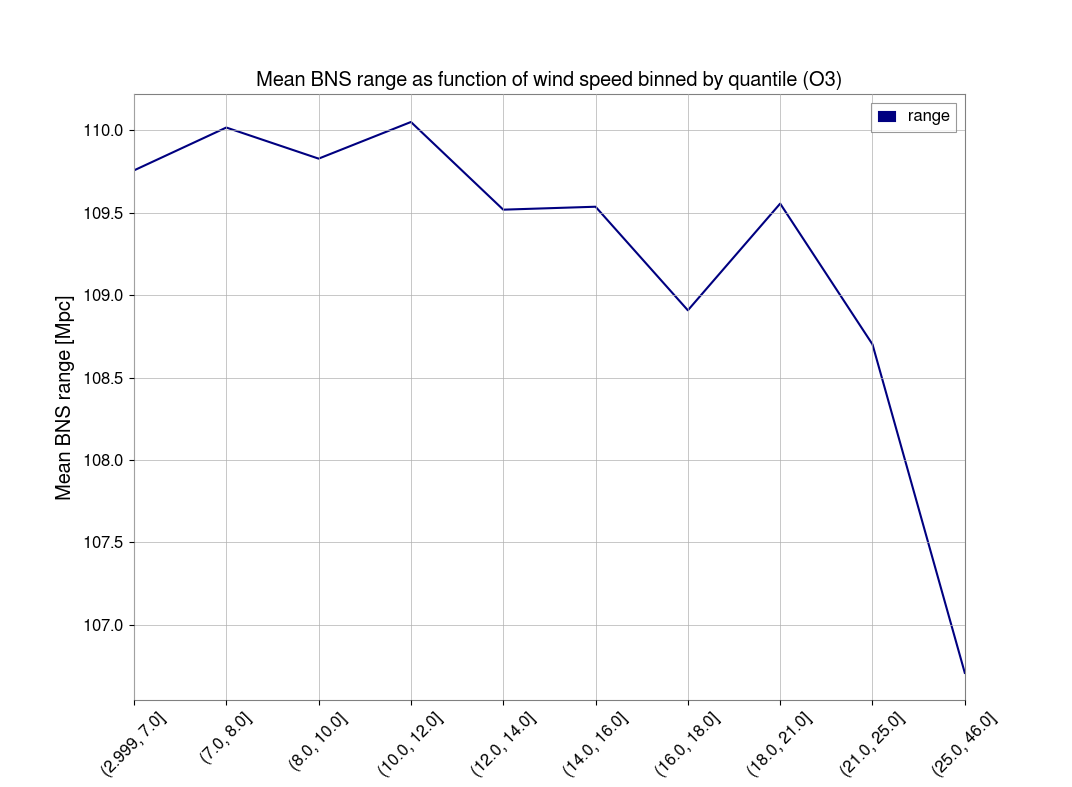
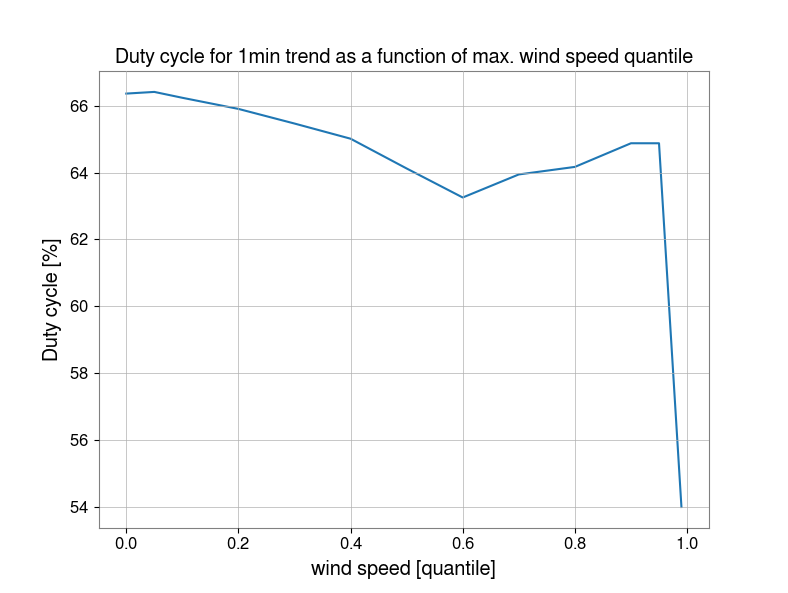
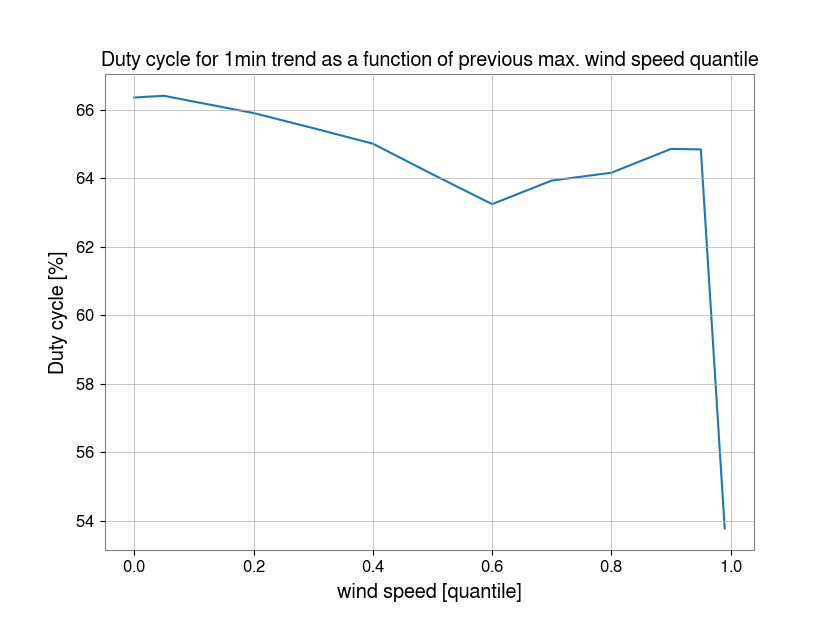
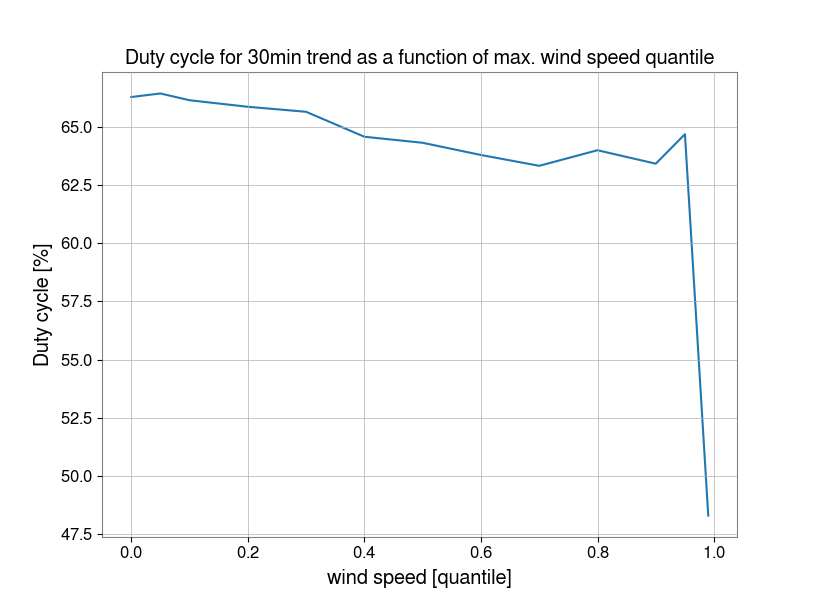
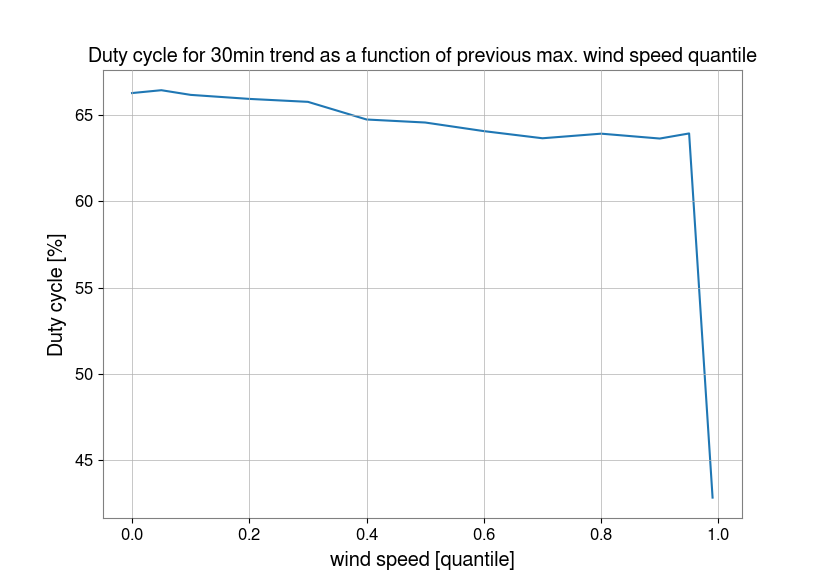
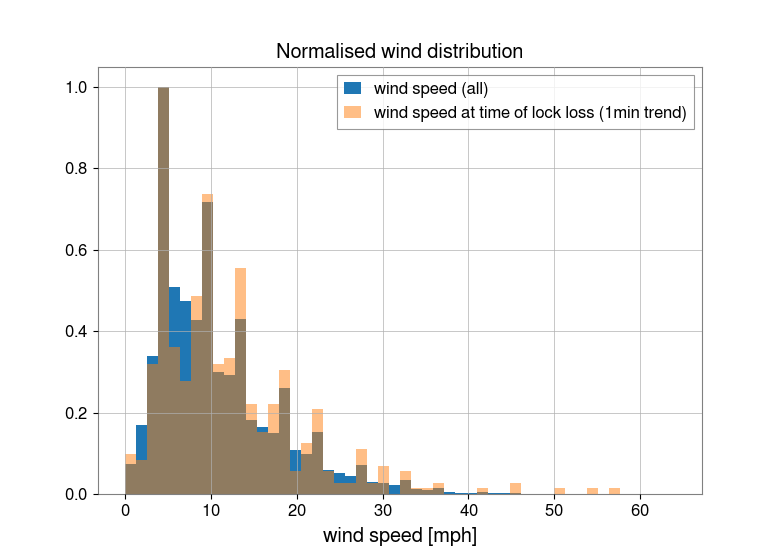
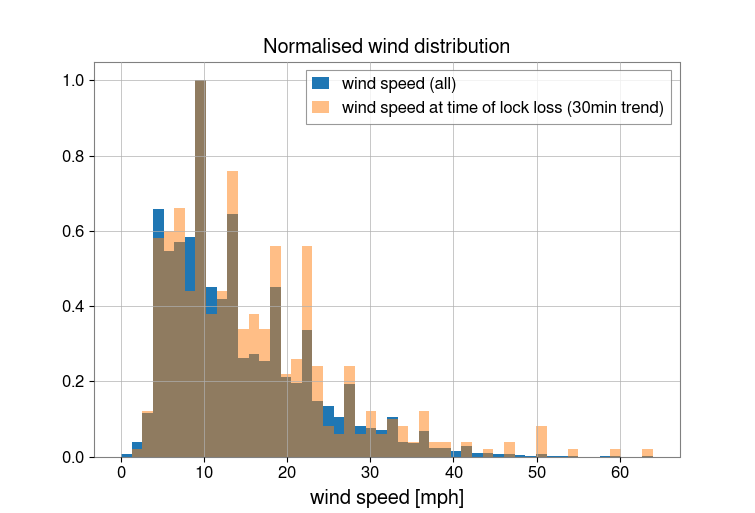
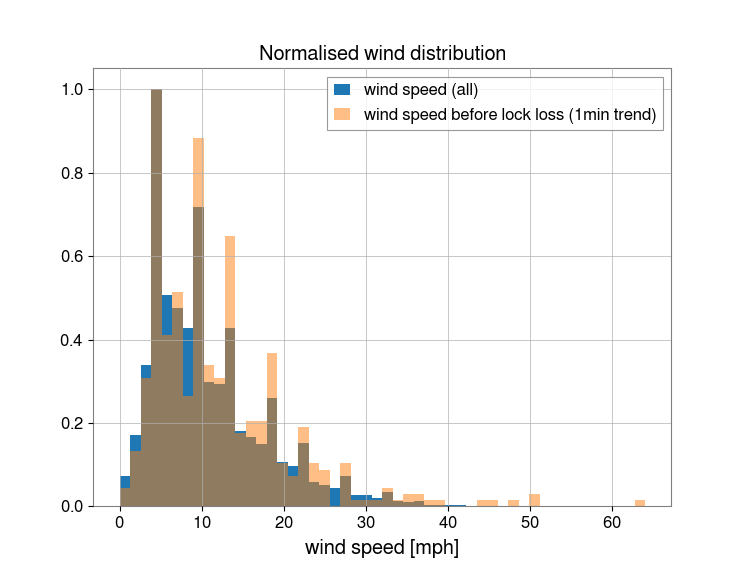
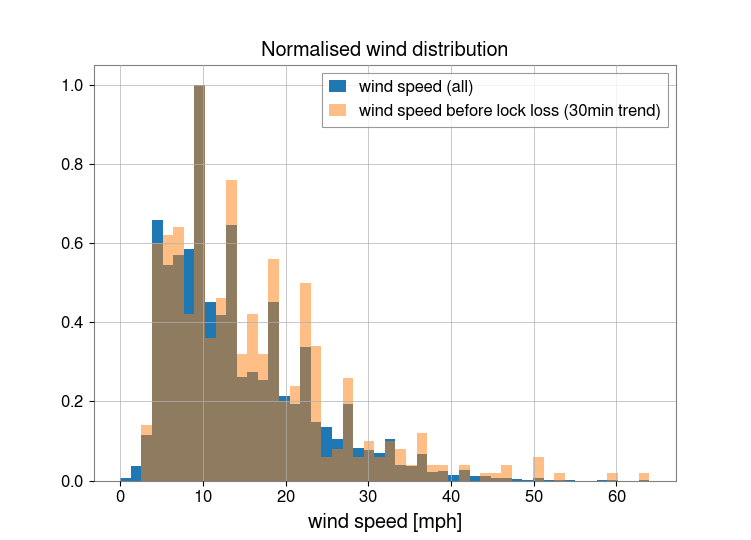
A repeat of the analysis in 49542 along with a look at the impact of wind on BNS range.
We used the maximum wind speed of the three max. 1min and 30min trends for the H1 EX, EY, CS wind channels for O3 up to 2 June 2019.
The first histograms and trend line show duty cycle vs wind speed percentiles, for wind speed vs lock status and previous wind speed (max. of previous 1 or 30 min) vs lock status. Looking at the previous wind speed shows more down time due to high winds. Percentiles and wind speed values are (in mph):
| percentile | 5 | 10 | 20 | 30 | 40 | 50 | 60 | 70 | 80 | 90 | 95 | 99 |
| 1min trend wind speed [mph] | 4 | 5 | 9 | 8 | 9 | 11 | 12 | 14 | 17 | 21 | 25 | 35 |
| 30min trend wind speed [mph] | 6 | 7 | 9 | 11 | 13 | 15 | 17 | 19 | 22 | 27 | 31 | 43 |
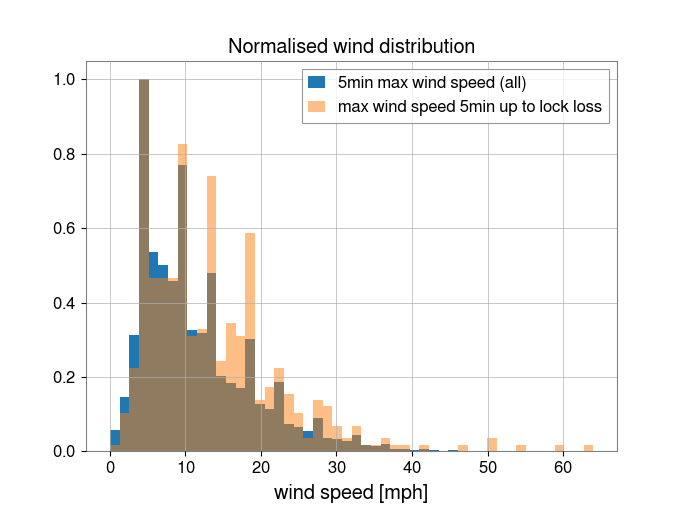
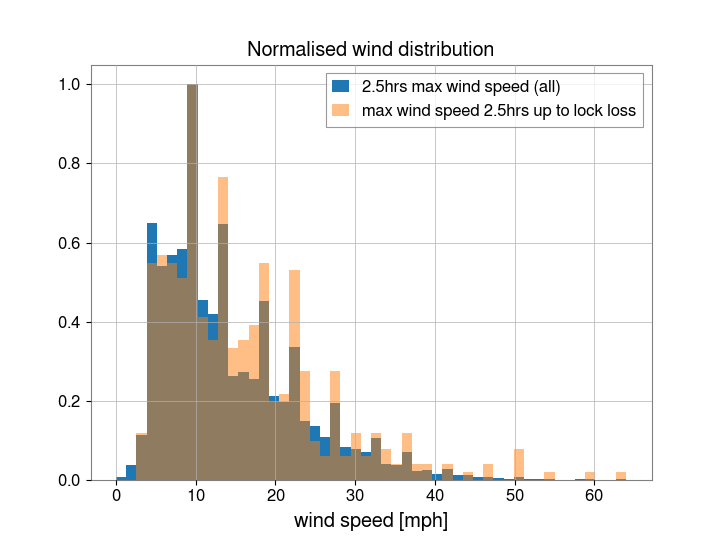
The following histograms are the normalised distributions for wind speed at:
Compared to the normalised distribution at all times (blue).
The following plots look at the BNS range as a function of wind speed while the interferometer is locked. Again, the maximum wind speed of the three max. 1min trends for EX, EY and CS wind channels are used.
Thanks for looking into the effect of wind on lock loss and BNS range in the first two months of O3. I've used the BNS Range vs Wind Speed reported above, convolved with the yearly wind speed PDF (based on ~8 yr of data) to calculate the effect on yearly average BNS range and BNS detection rate (volume) in the attached notebook. I calculate ~1.2 MPc BNS range increase (or ~1.5 MPc for the windy season). This amounts to a ~3% increase (~4% in the windy season) in the detection rate (volume x time) for BNS.
The DetChar group has been asked to look into the effect of wind on BBH range and any glitches which might negatively effect searches such as Bursts.
I have cleared the timing error on h1iopasc0. Logs suggest it ran long (17uS) at 08:39 PDT this morning.
TITLE: 06/05 Day Shift: 15:00-23:00 UTC (08:00-16:00 PST), all times posted in UTC
STATE of H1: Observing at 108Mpc
OUTGOING OPERATOR: Corey
CURRENT ENVIRONMENT:
Wind: 7mph Gusts, 5mph 5min avg
Primary useism: 0.01 μm/s
Secondary useism: 0.05 μm/s
QUICK SUMMARY:
TITLE: 06/05 Owl Shift: 07:00-15:00 UTC (00:00-08:00 PST), all times posted in UTC
STATE of H1: Observing at 109Mpc
INCOMING OPERATOR: Ed
SHIFT SUMMARY:
Nice shift with H1 locked for ~13.5hrs & riding through a couple of earthquakes.
NOTE: Please hit "LOAD" for ISC_LOCK next time we have a lockloss (request via Georgia).
LOG:
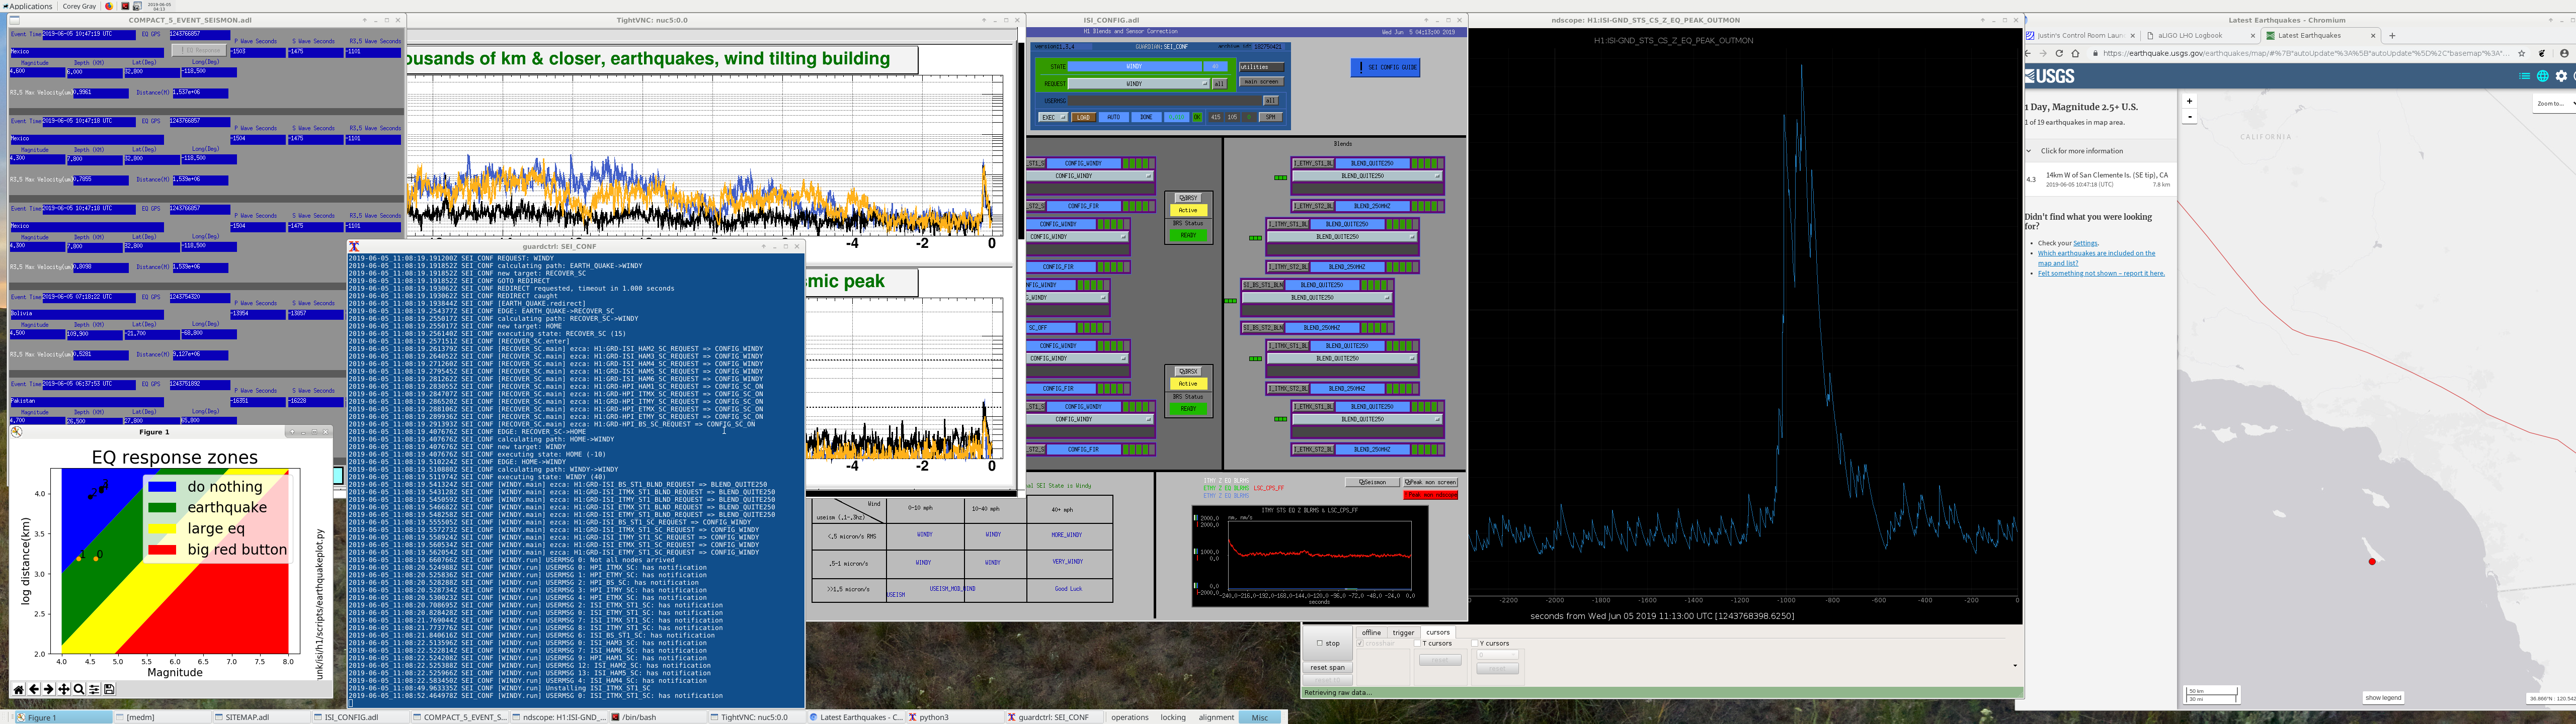
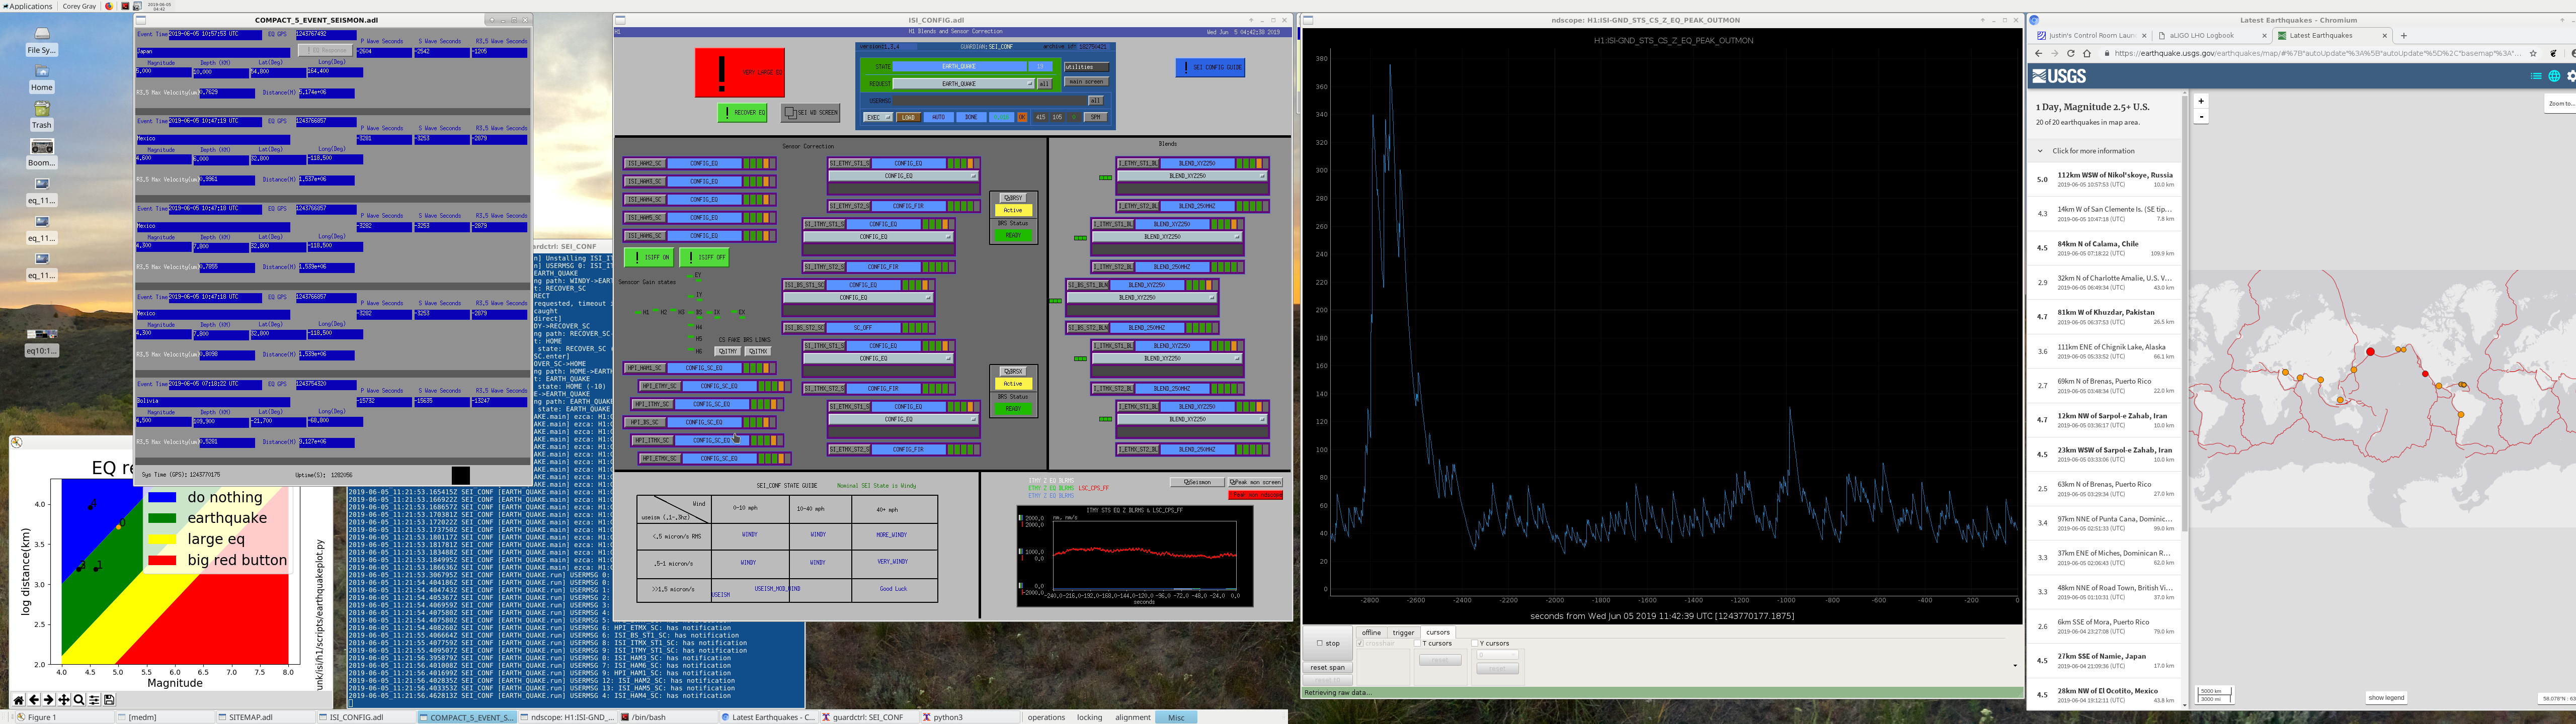
Noticed an EQ on SEISMON. Only a 4.3 but it was off southern CA coast and R-wave was within a minute of arrival when I noticed.
LOG Of Activity:
10:52 Notice EQ fastly approaching on SEISMON (no verbal given):
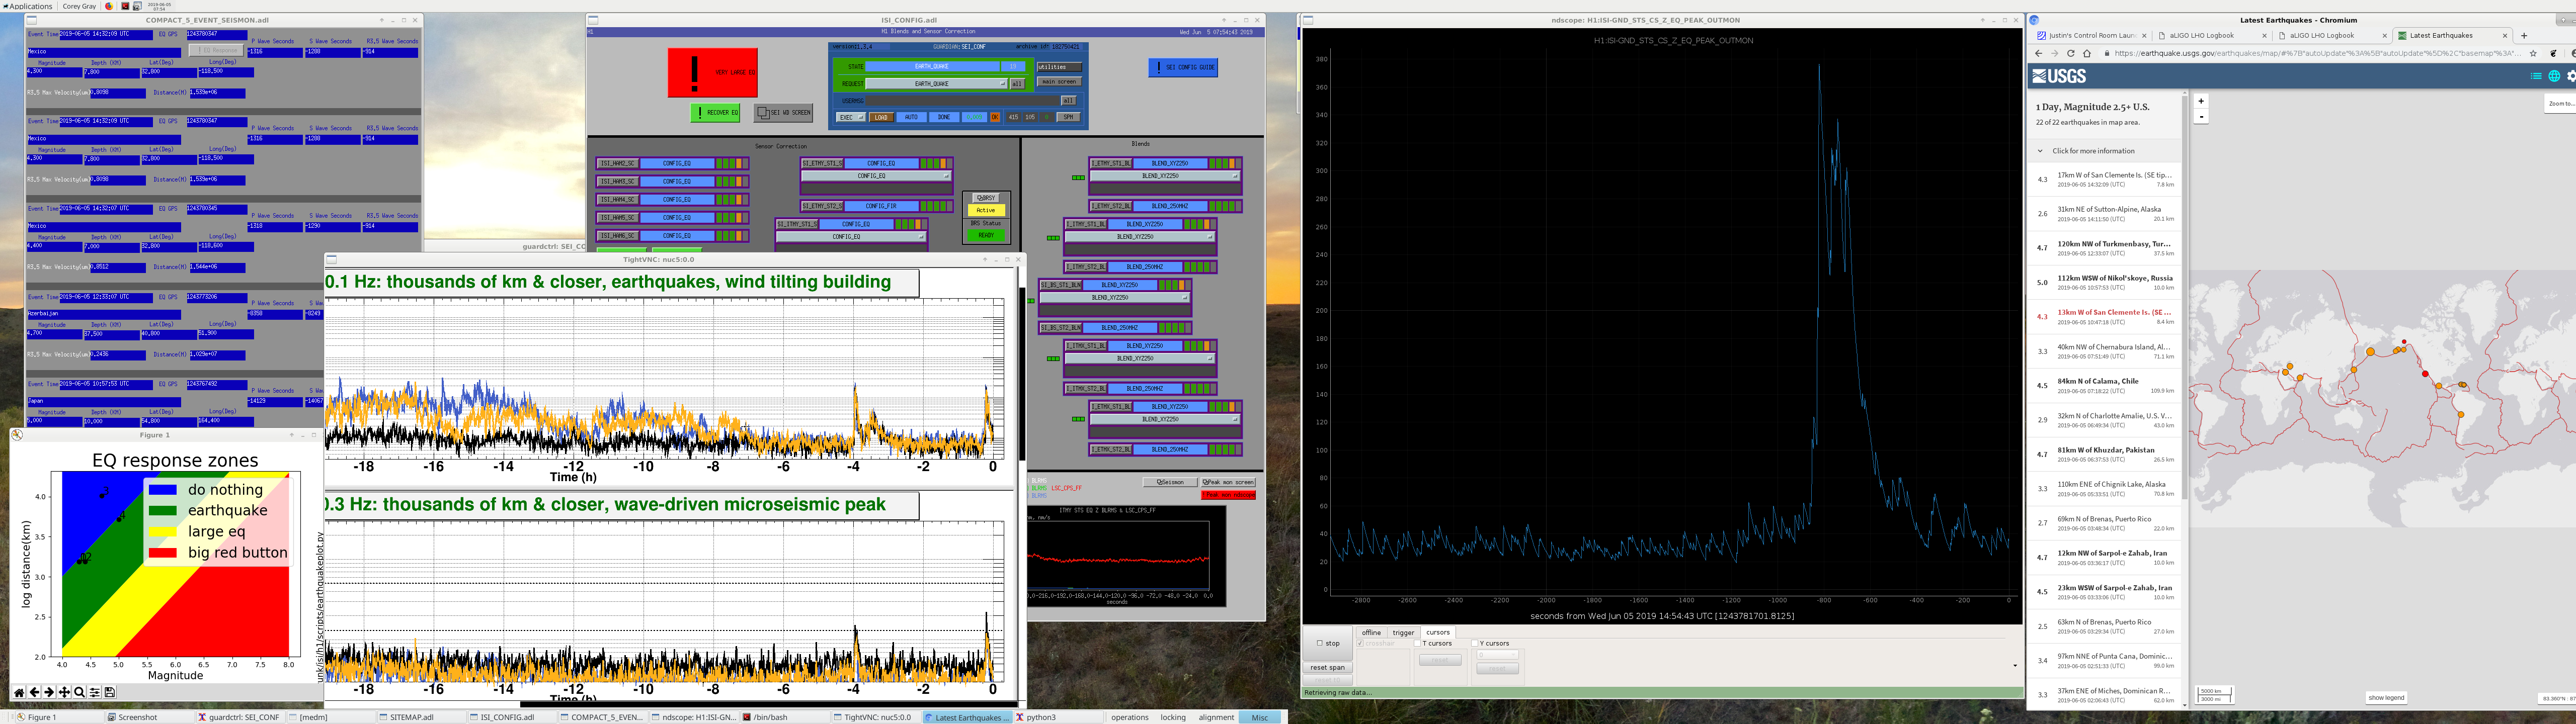
Another 4.3 Southern CA EQ at 14.36 (screenshot attached)
5.0 Japan EQ at 11:19 (Seismon lists this as barely on the line of EARTHQUAKE-worthy).
Tagging @DetChar and SEI for data in seismic's sensor correction configuration transition studies.
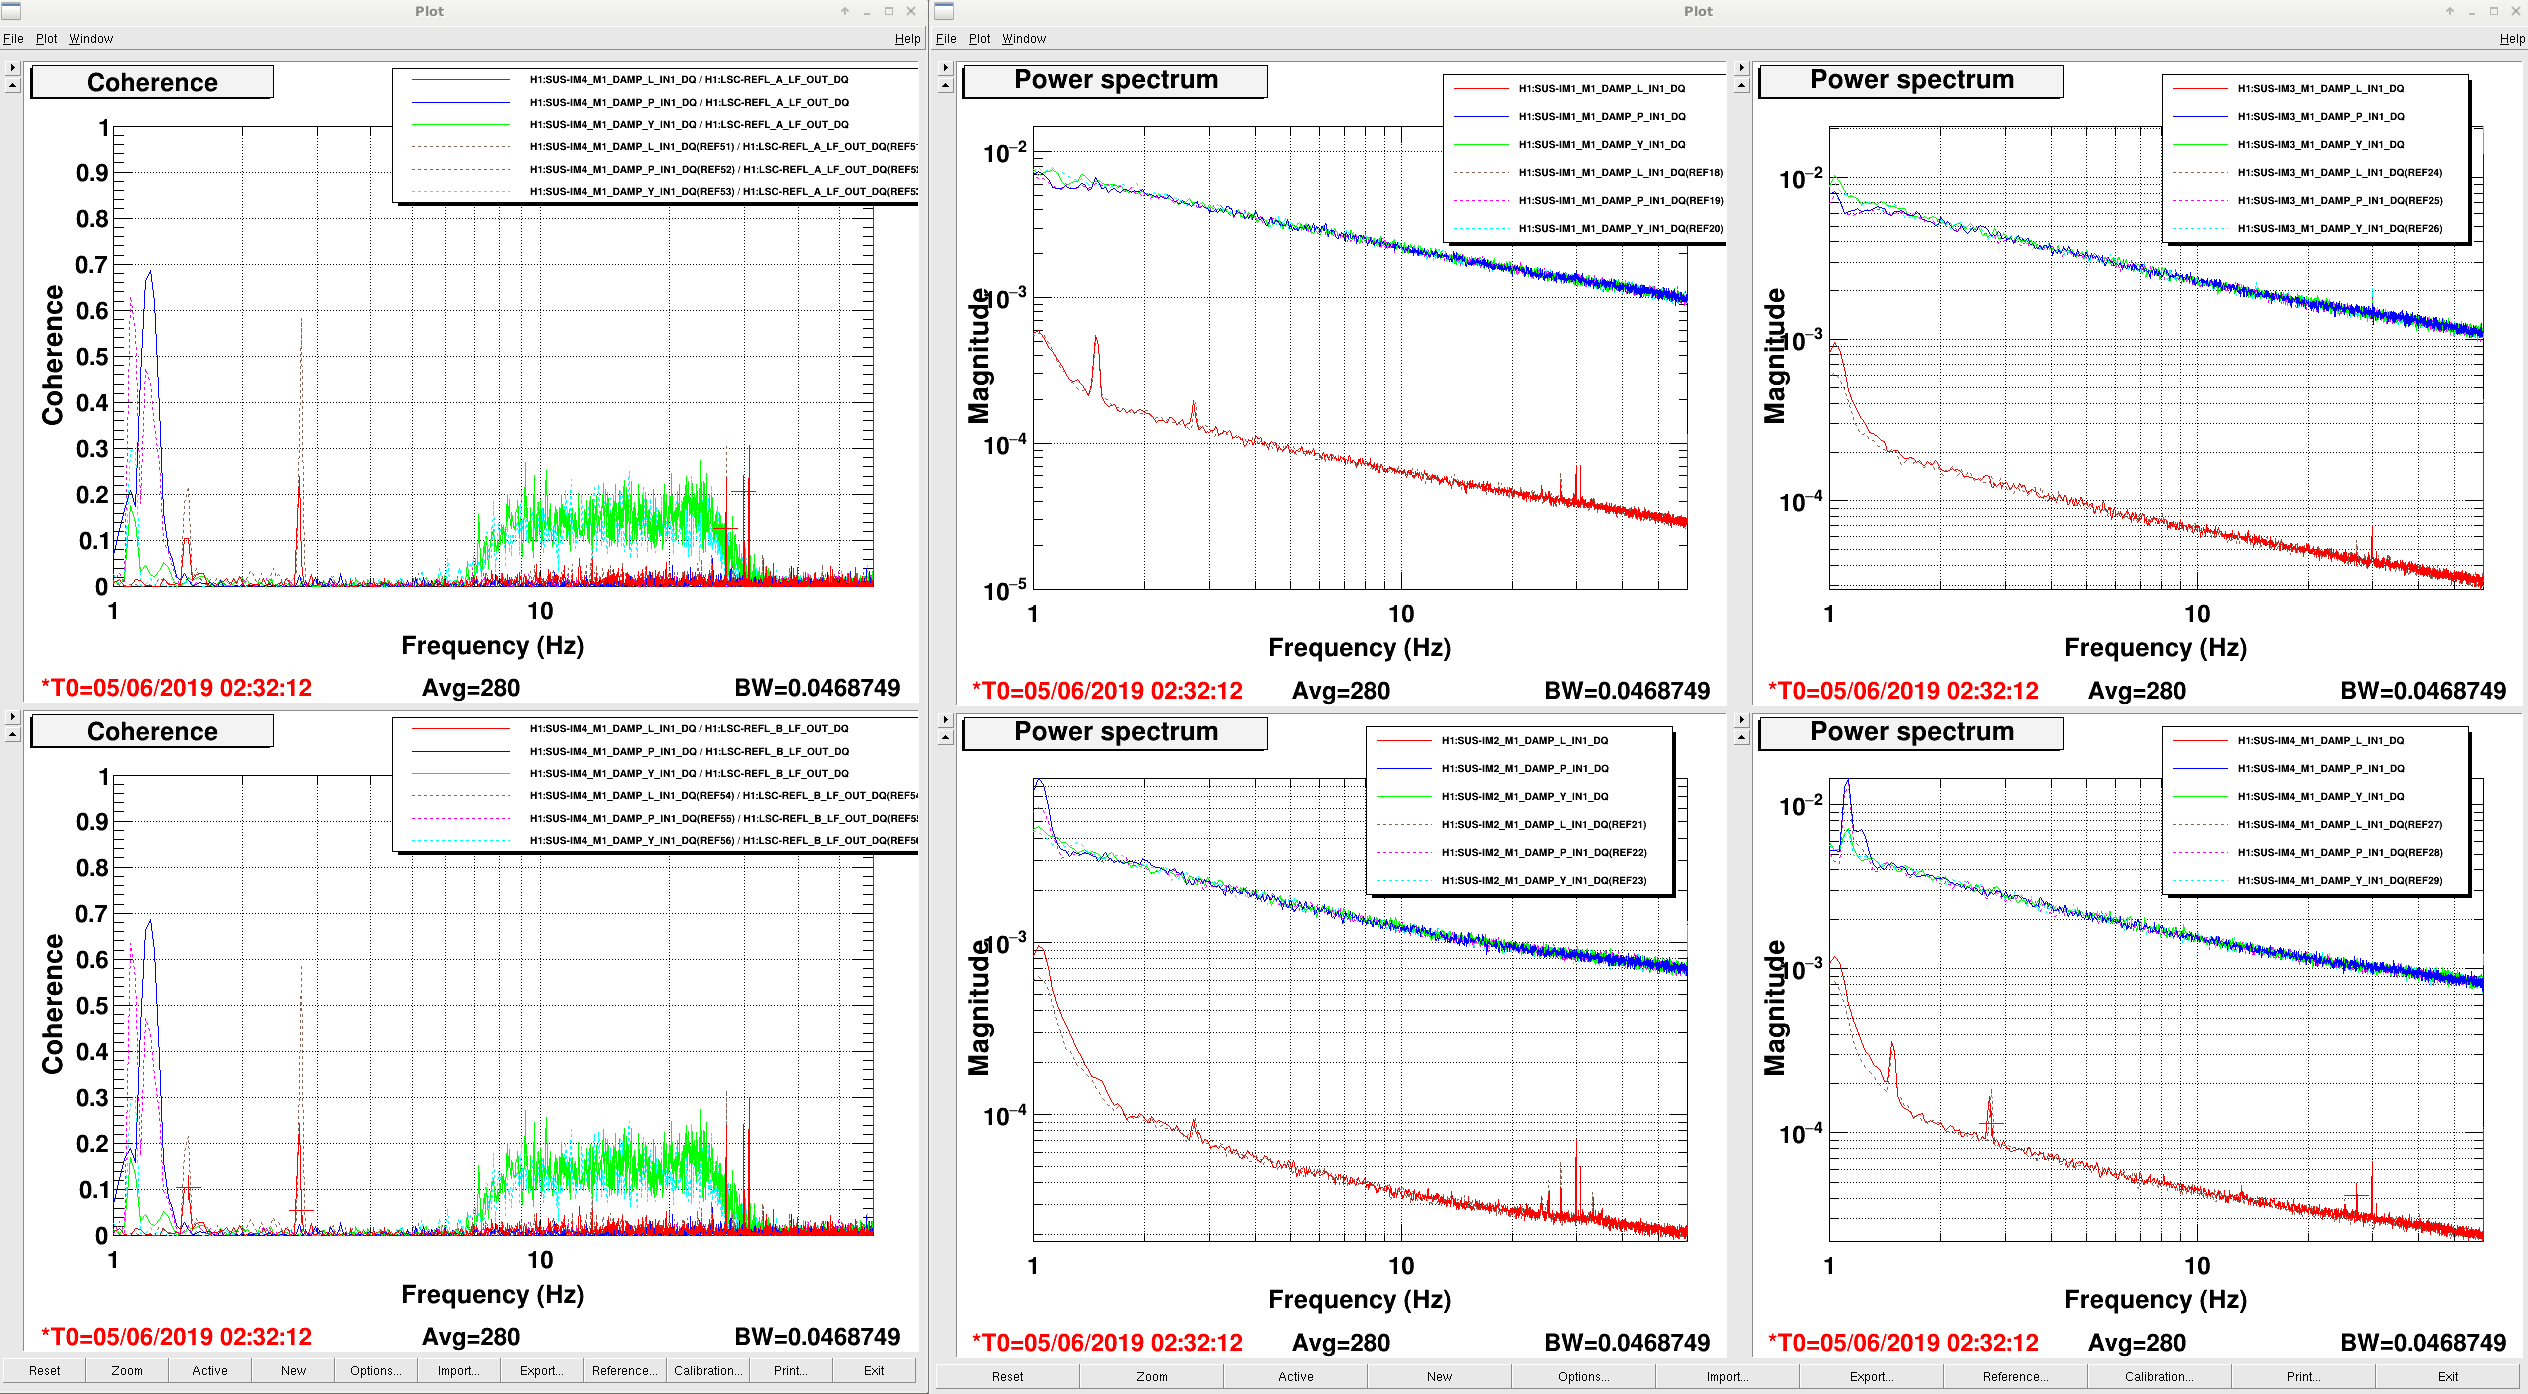
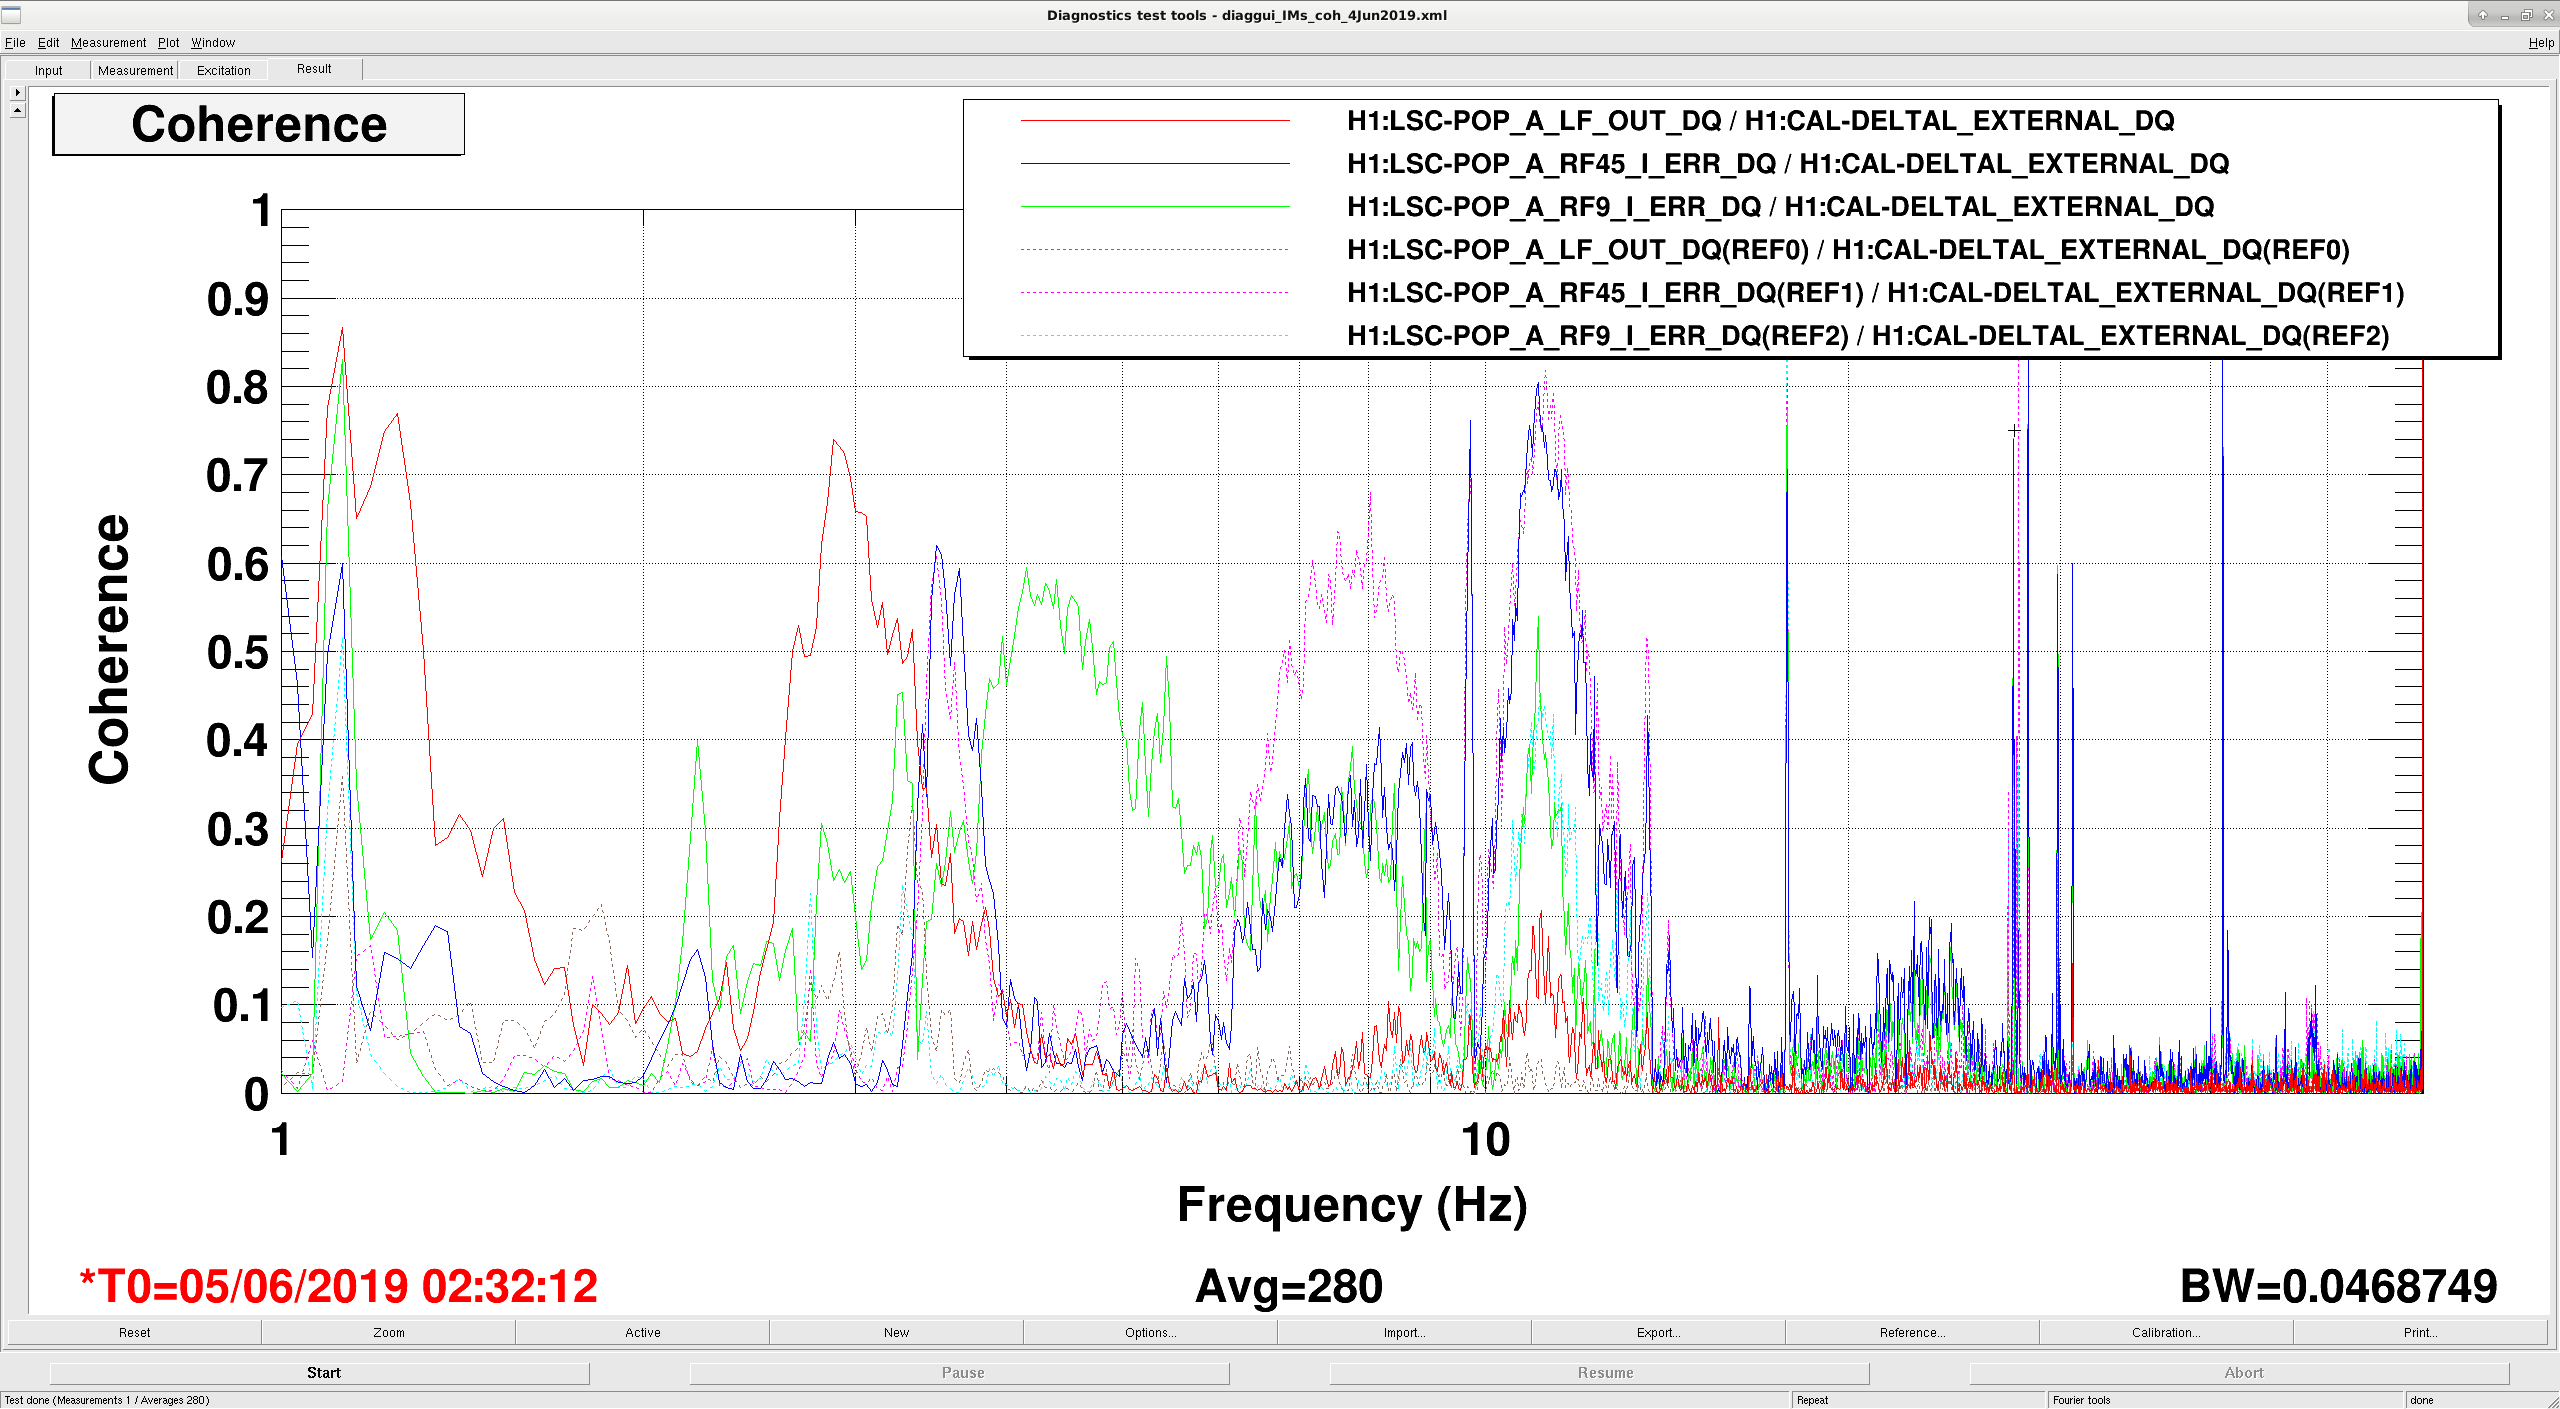
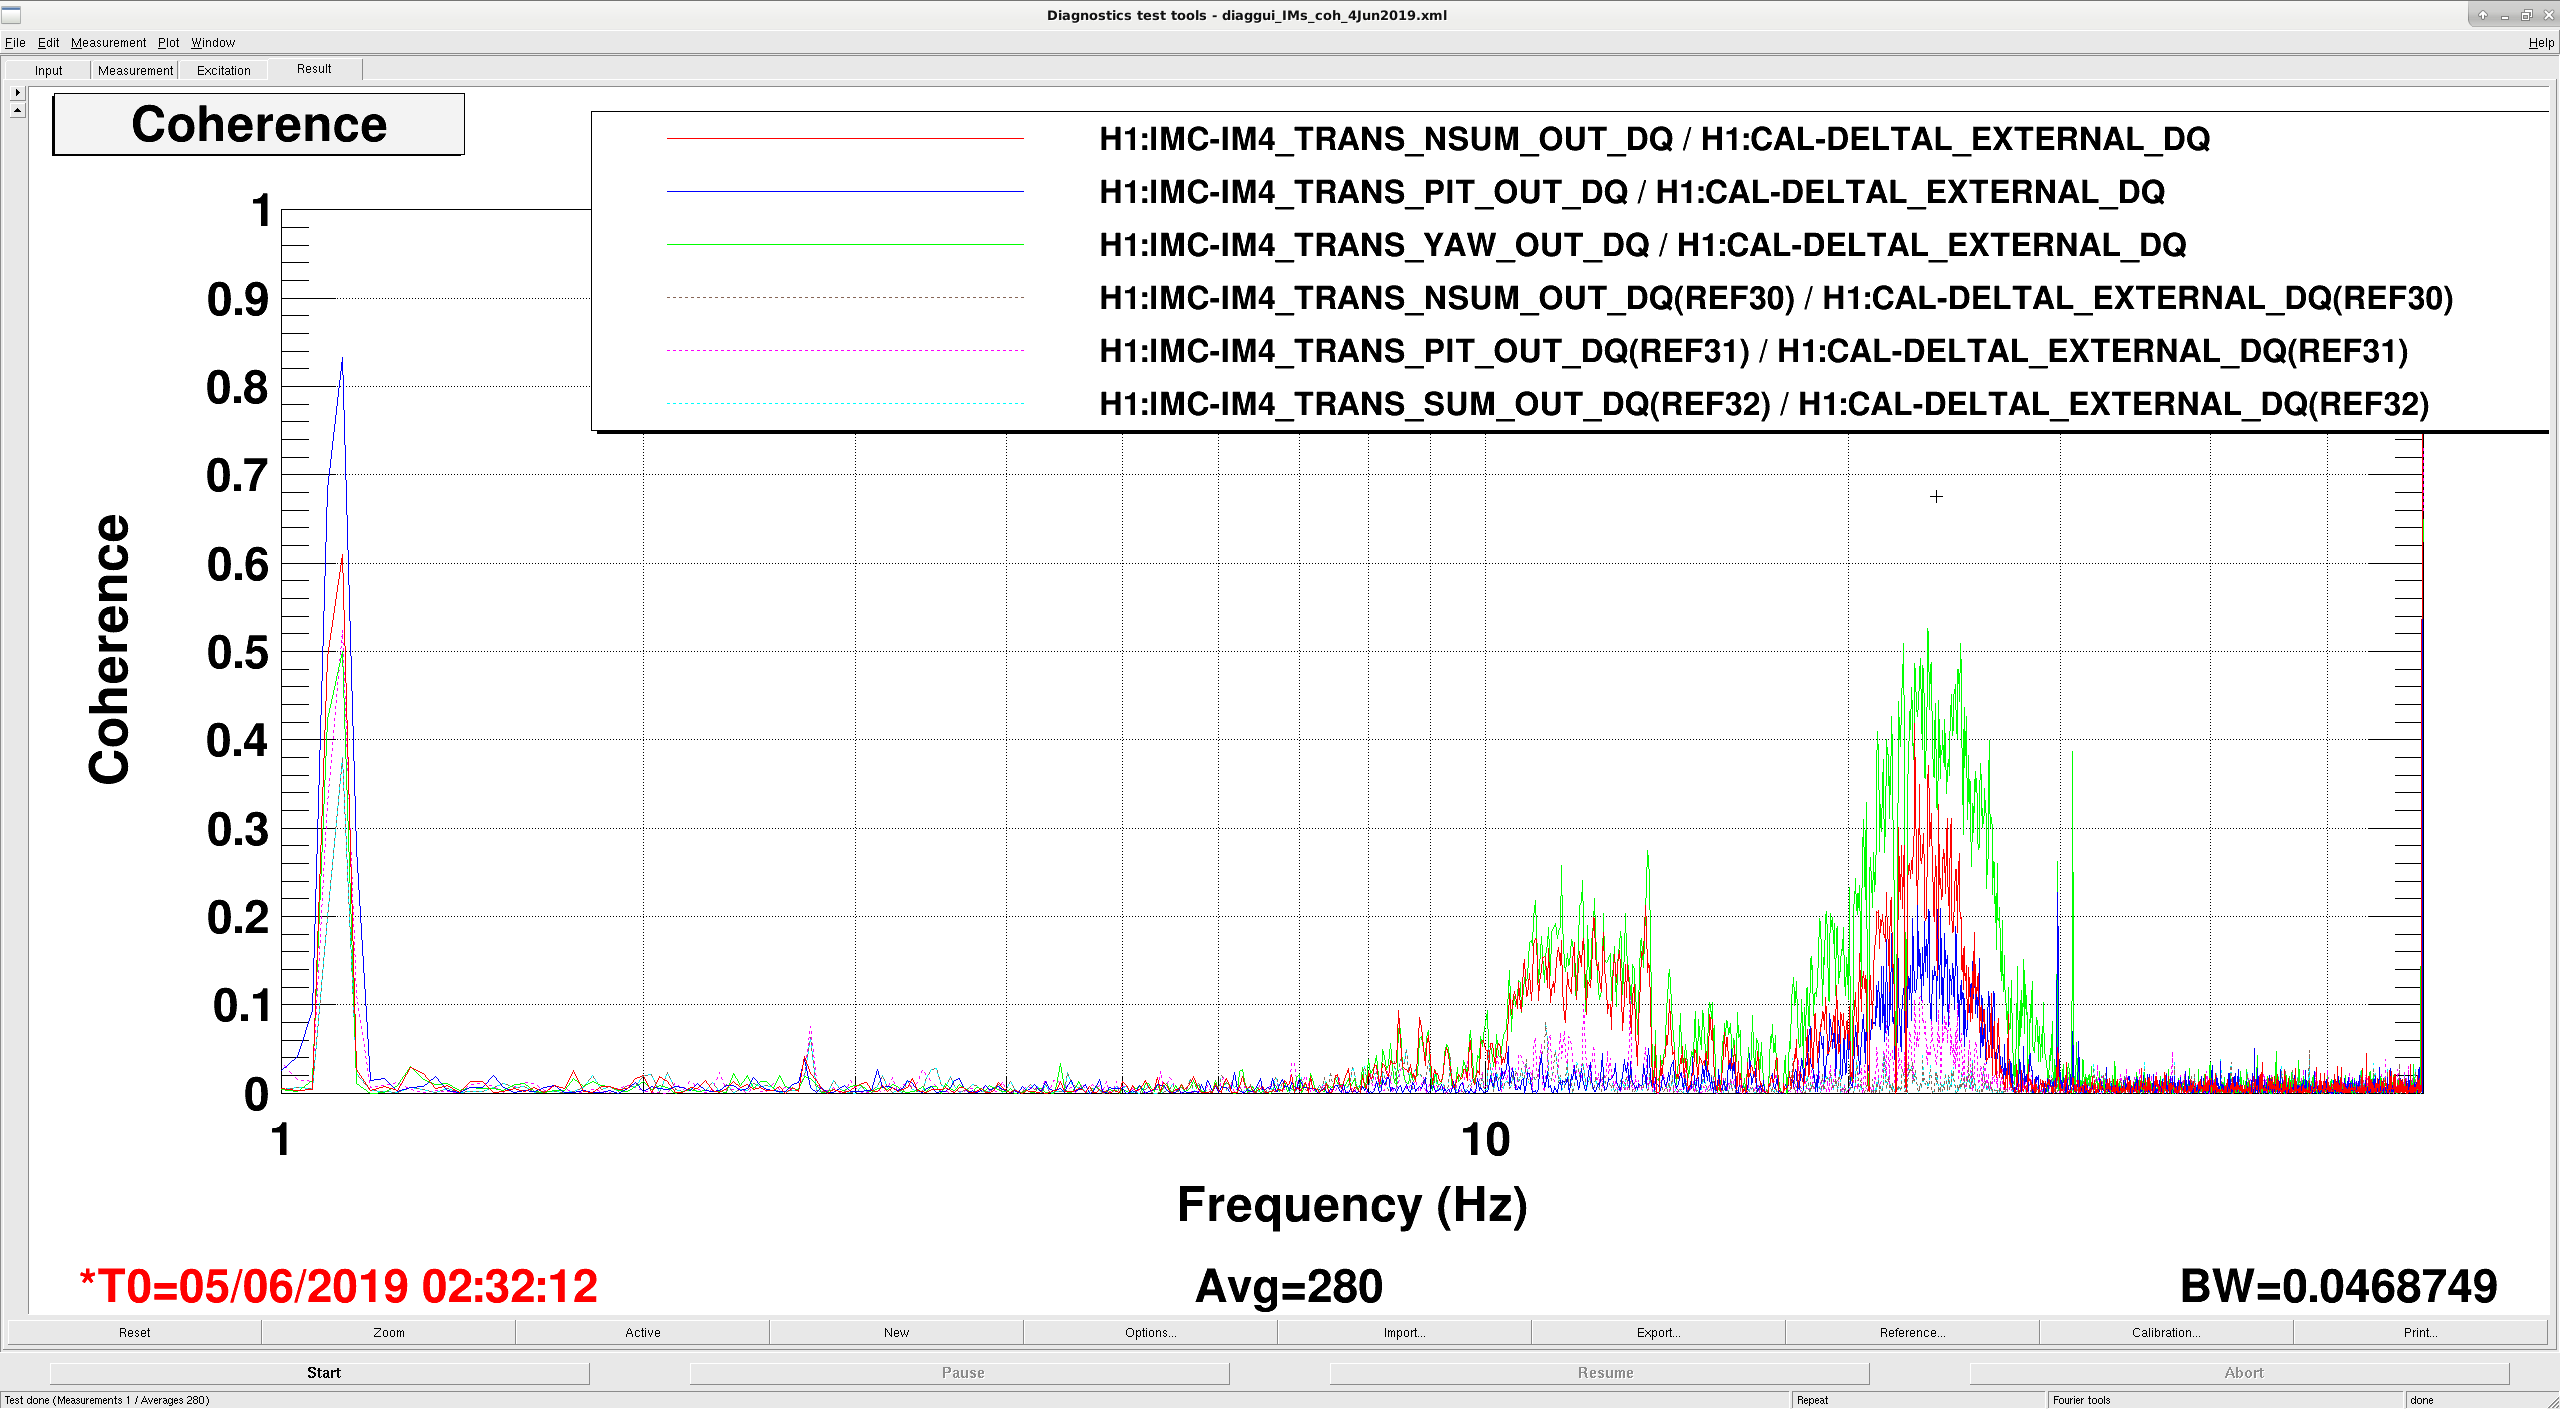
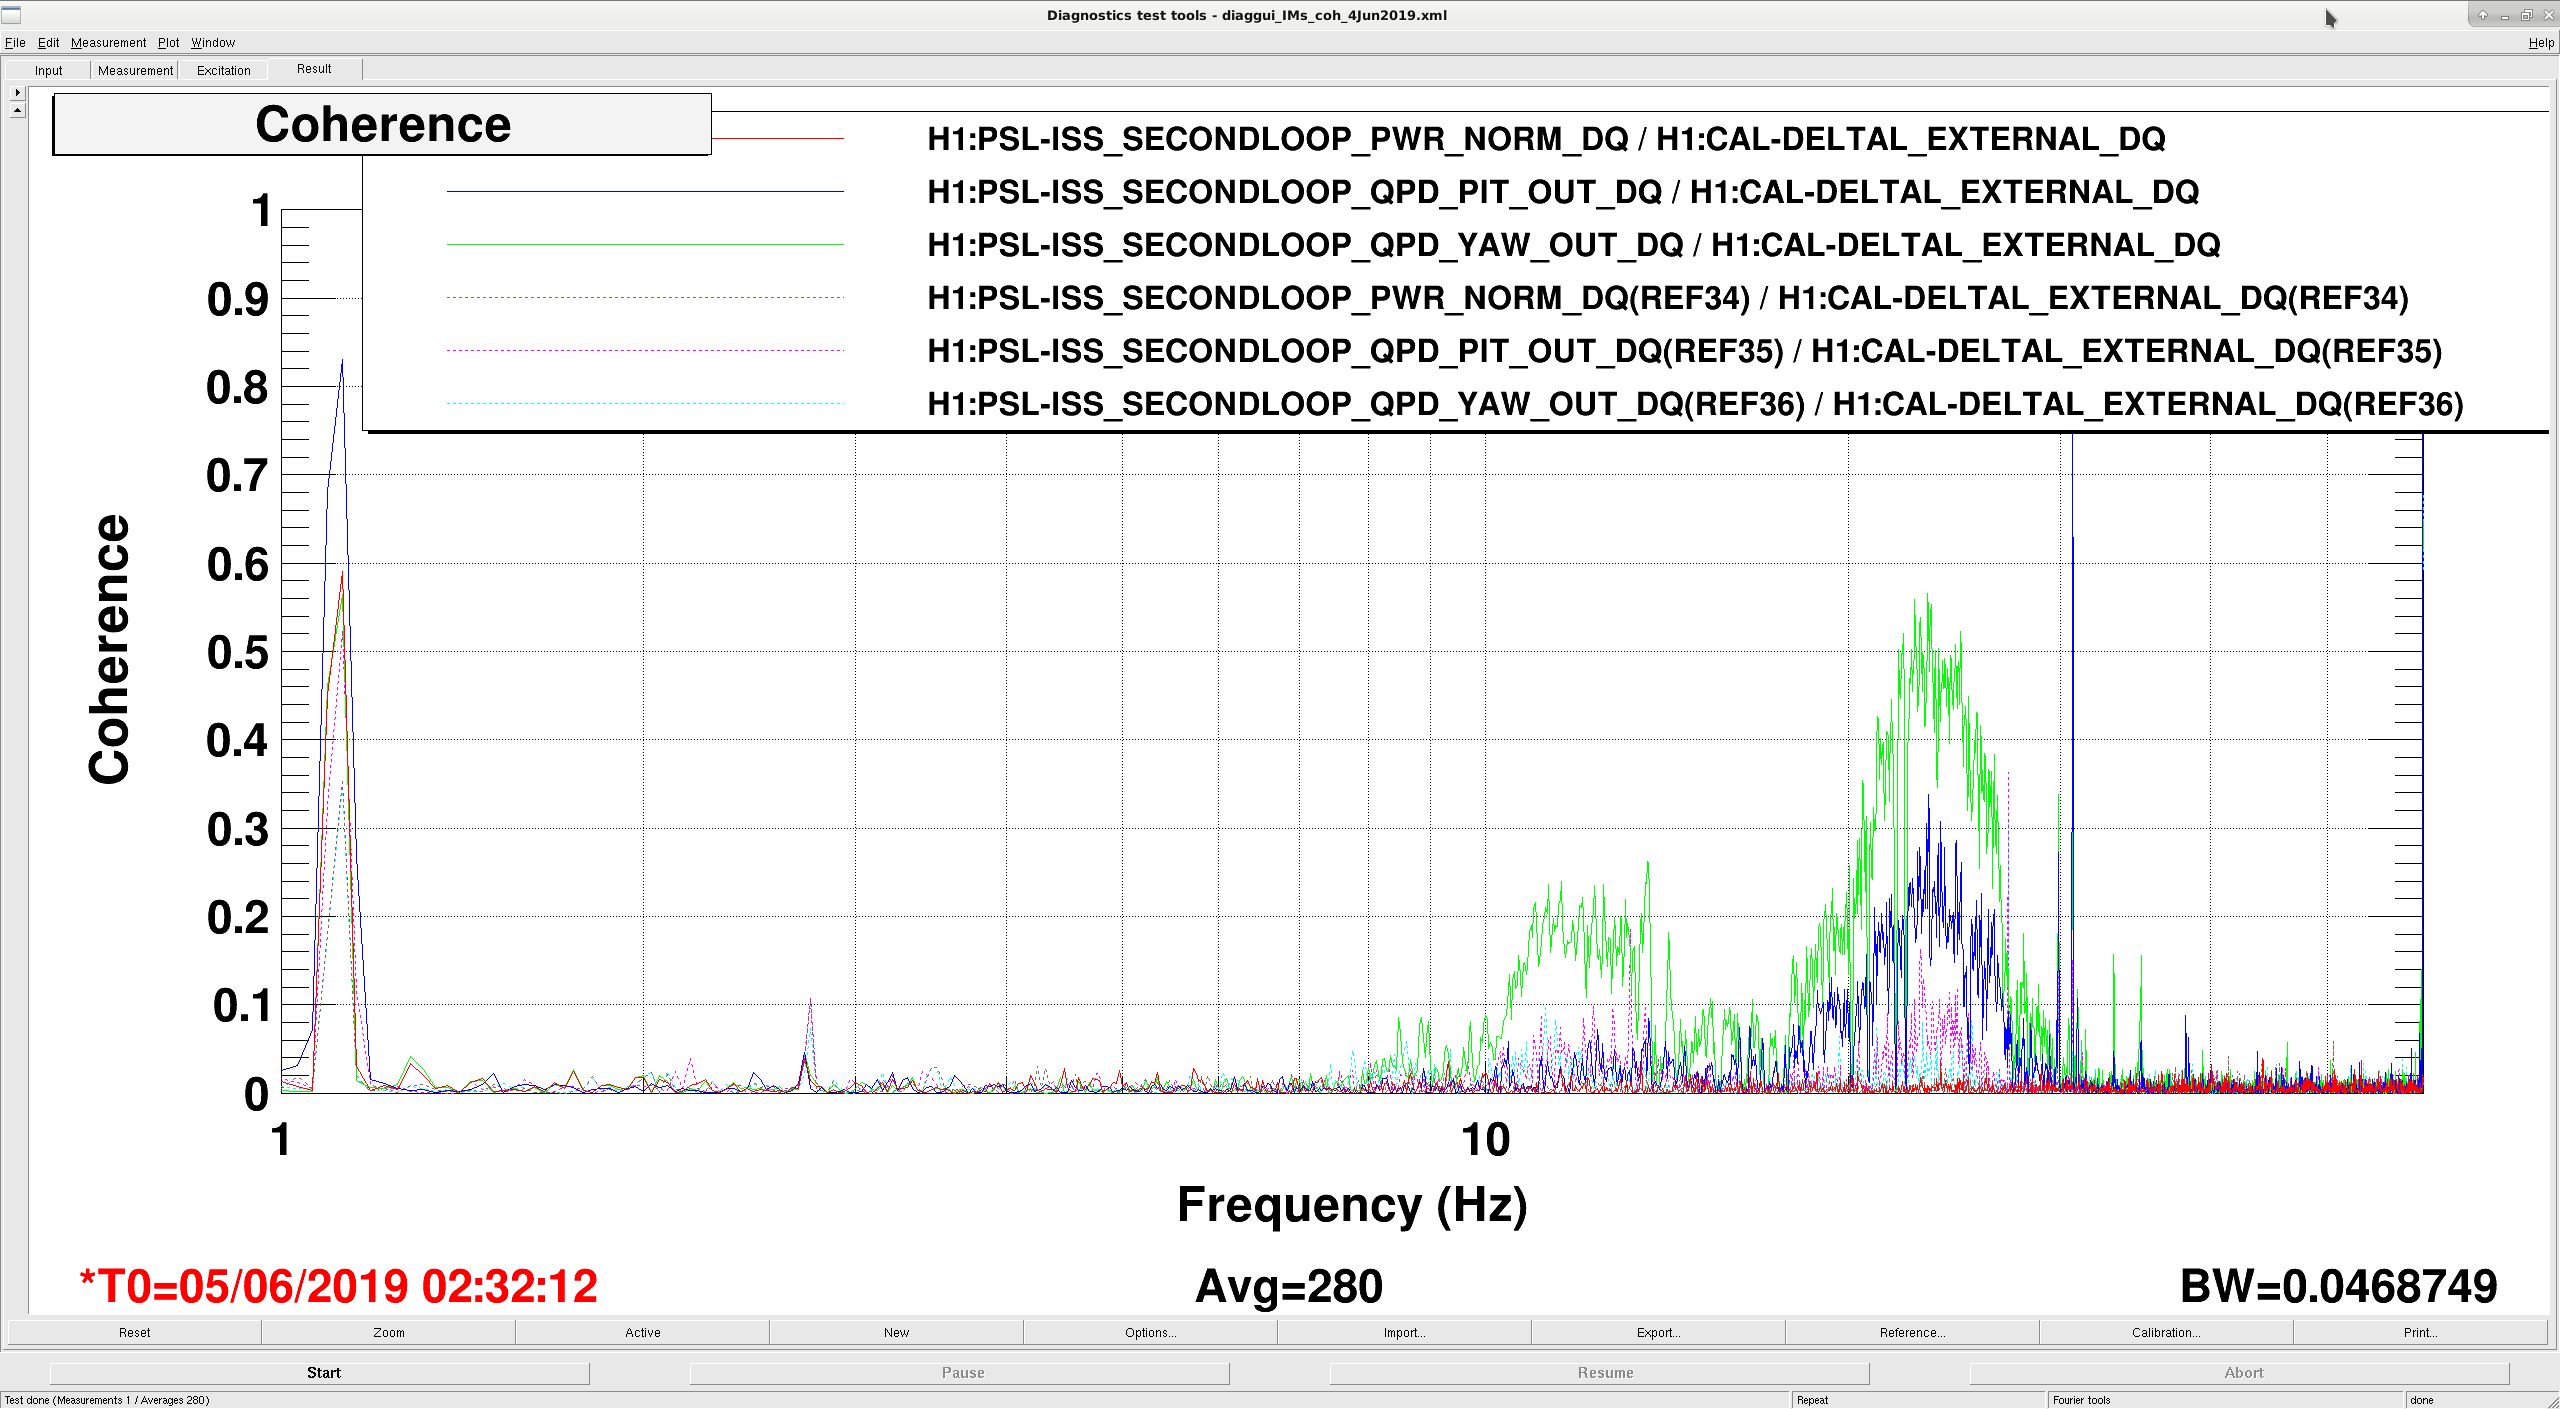
There's an increase in noise between 20Hz and 30Hz. I made some plots of IO IMs, which see an increase between DARM and IM pitch and yaw signals, also REFL and POP signals, though not saying any of these are the source, just that the change from yesterday is noticeable. Plots attached.
TITLE: 06/05 Owl Shift: 07:00-15:00 UTC (00:00-08:00 PST), all times posted in UTC
STATE of H1: Observing at 104Mpc
OUTGOING OPERATOR: Cheryl
CURRENT ENVIRONMENT:
Wind: 11mph Gusts, 7mph 5min avg
Primary useism: 0.01 μm/s
Secondary useism: 0.08 μm/s
Microseism is really low (almost off the screen!) & low winds.
QUICK SUMMARY:
H1 has been lock for approaching 5.75hrs (& Observing for almost 4hrs).
Cheryl noted we need to LOAD the ISC_LOCK guardian node during the next lockloss for a new line Georgia added.
TITLE: 06/05 Eve Shift: 23:00-07:00 UTC (16:00-00:00 PST), all times posted in UTC
STATE of H1: Observing at 108Mpc
INCOMING OPERATOR: Corey
SHIFT SUMMARY: work on DRMI ASC, then LVEA Sweep, then in Observe since
LOG:
Description in the name of the file:
2:14 UTC - H1 in Observe
I swept the LVEA, and found a phone was plugged in. Looking at HAM6, I saw that there were many curtains in contact with the HAM6 East door and two were sitting up against the viewport nozzles, so I moved the curtains off of the door, and put them on the set of white stairs that was in front of the door. I don't know that the curtains were a problem, but the amount of contact did not seem just incidental.
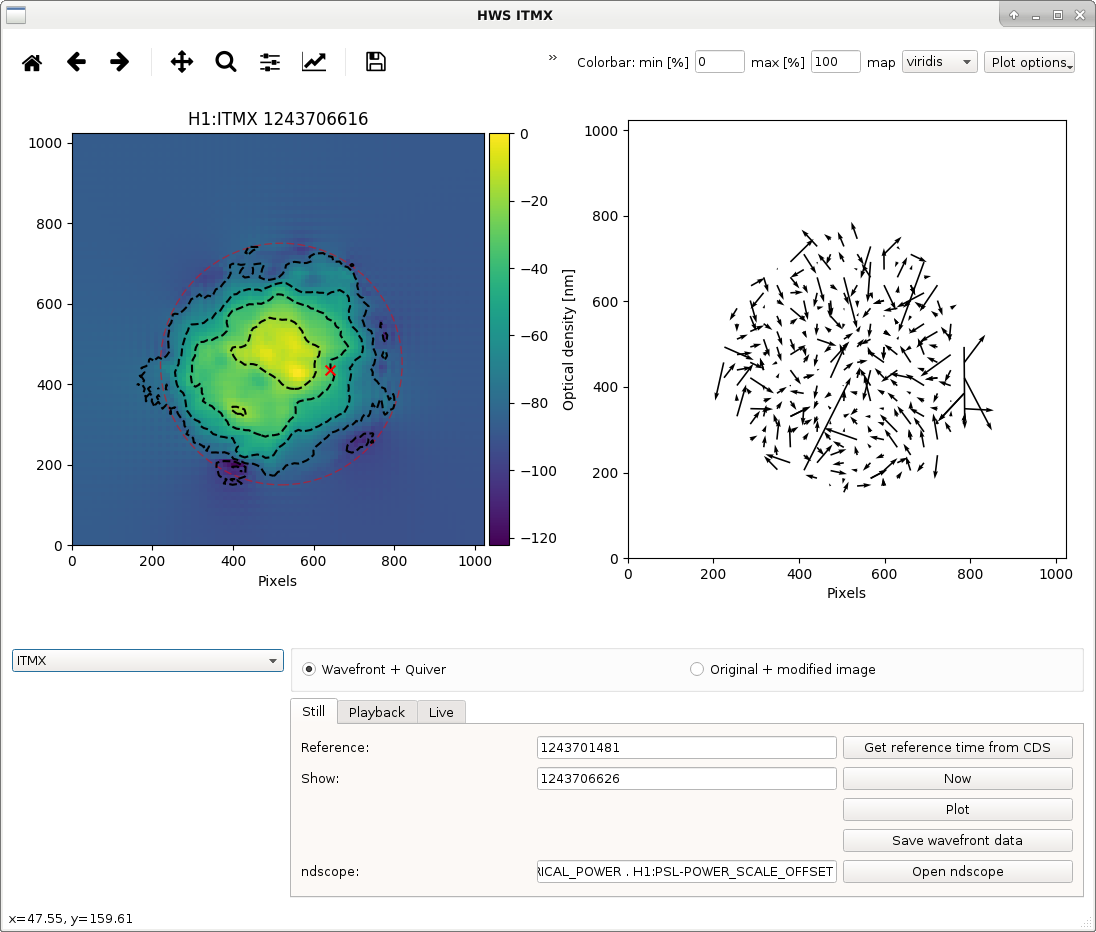
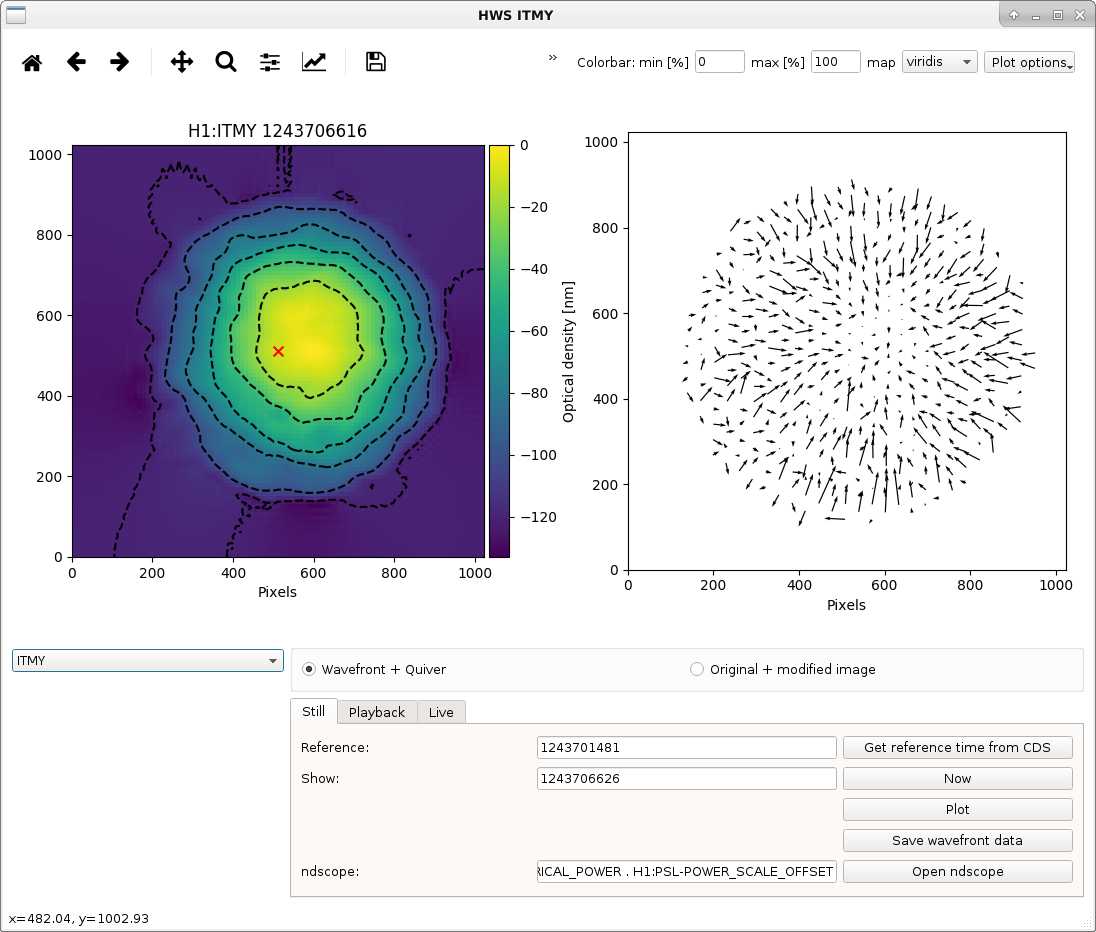
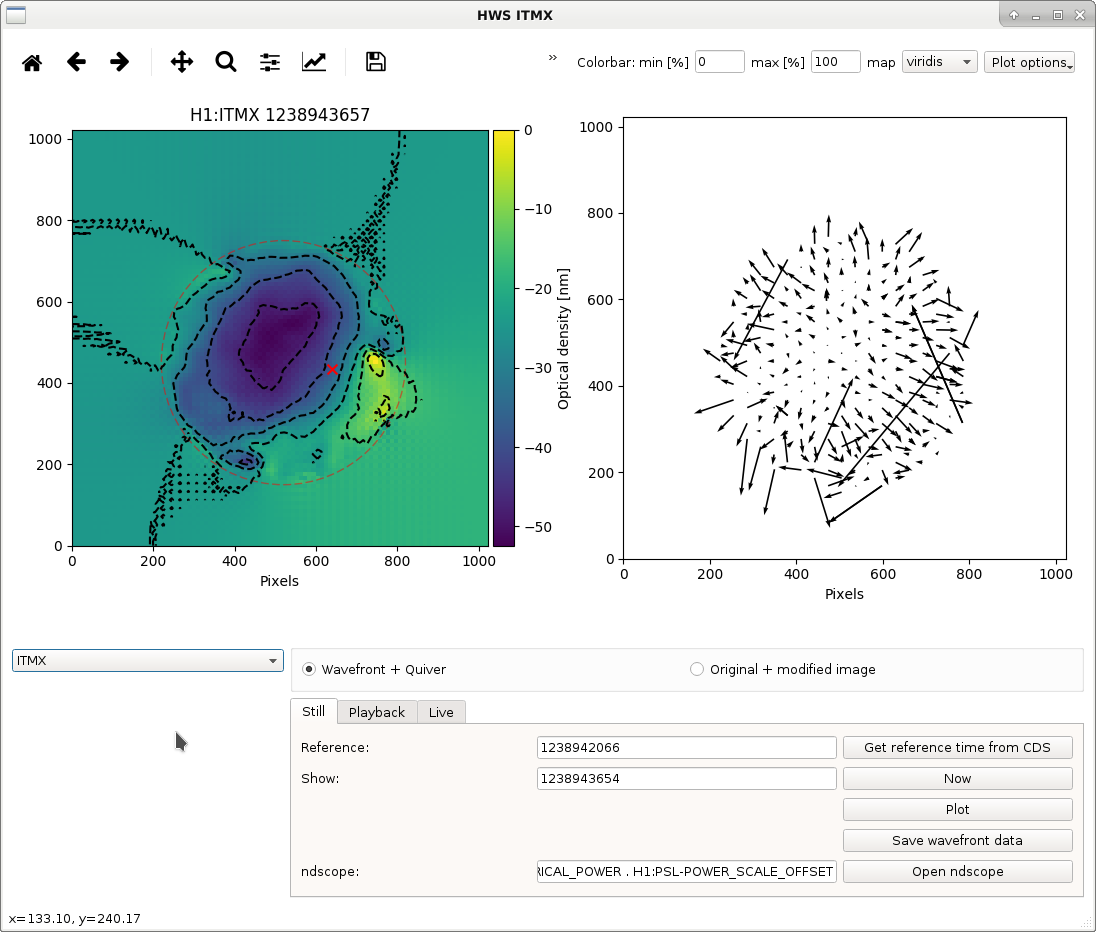
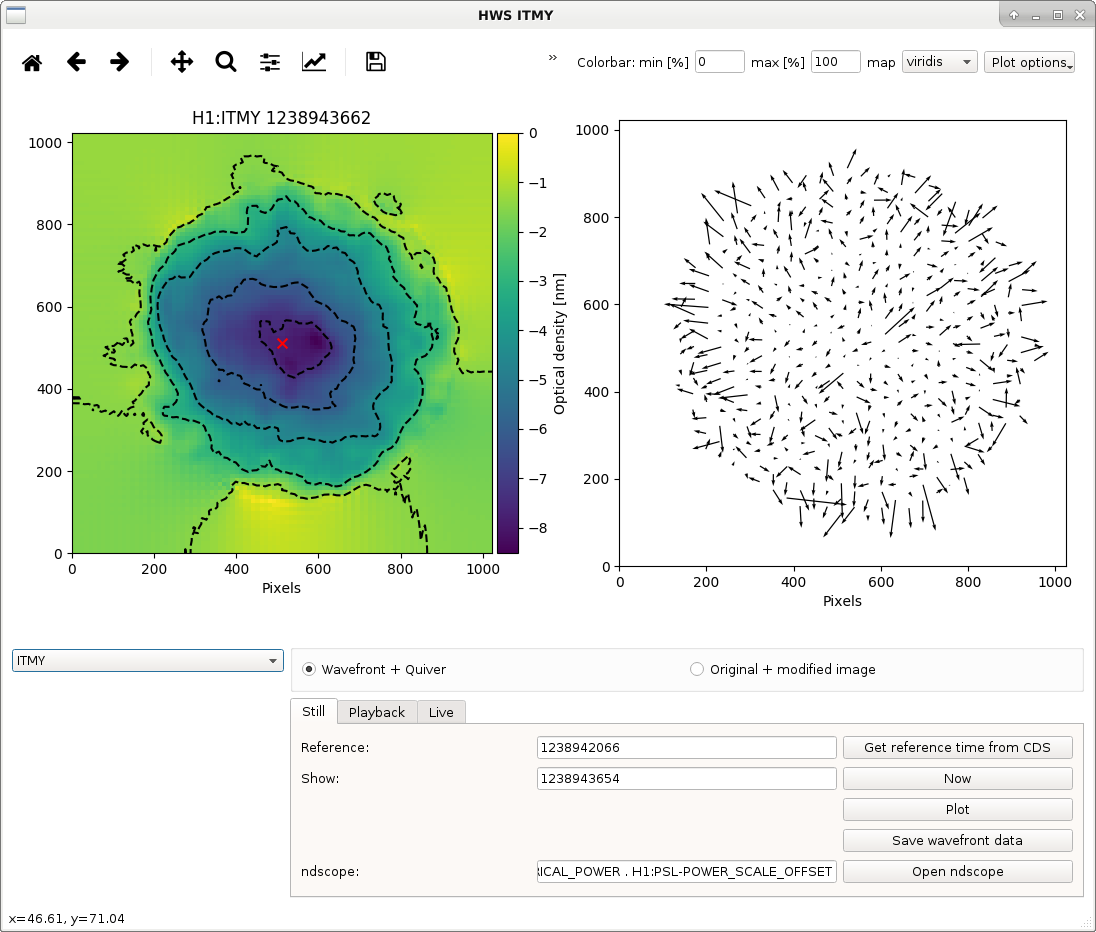
While Sheila and Jenne were commissioning the DRMI ASC today I used the Hartmanns to check the spot positions of the CO2 lasers on the ITMs.
Fortuitously, both CO2 lasers were turned off for an hour this morning during maintenance. I used the time while they were both heating up, with nominal ring heater and no IFO beam. First plot is ITMX today, second is ITMY today. ITMX looks pretty funky, but we know there is some clipping of the Hartmann beam.
I also made Hartmann images of a time in April when the CO2s were turned off in full lock: 3rd plot is ITMX in April, 4th plot is ITMY in April. The spot positions look very similar between April and now, which is good.
Looking back to after we pico'd the CO2s in December, however, looks very different, see plots 1 and 3 of TVo's comment here. Many things could have changed between now and then though.
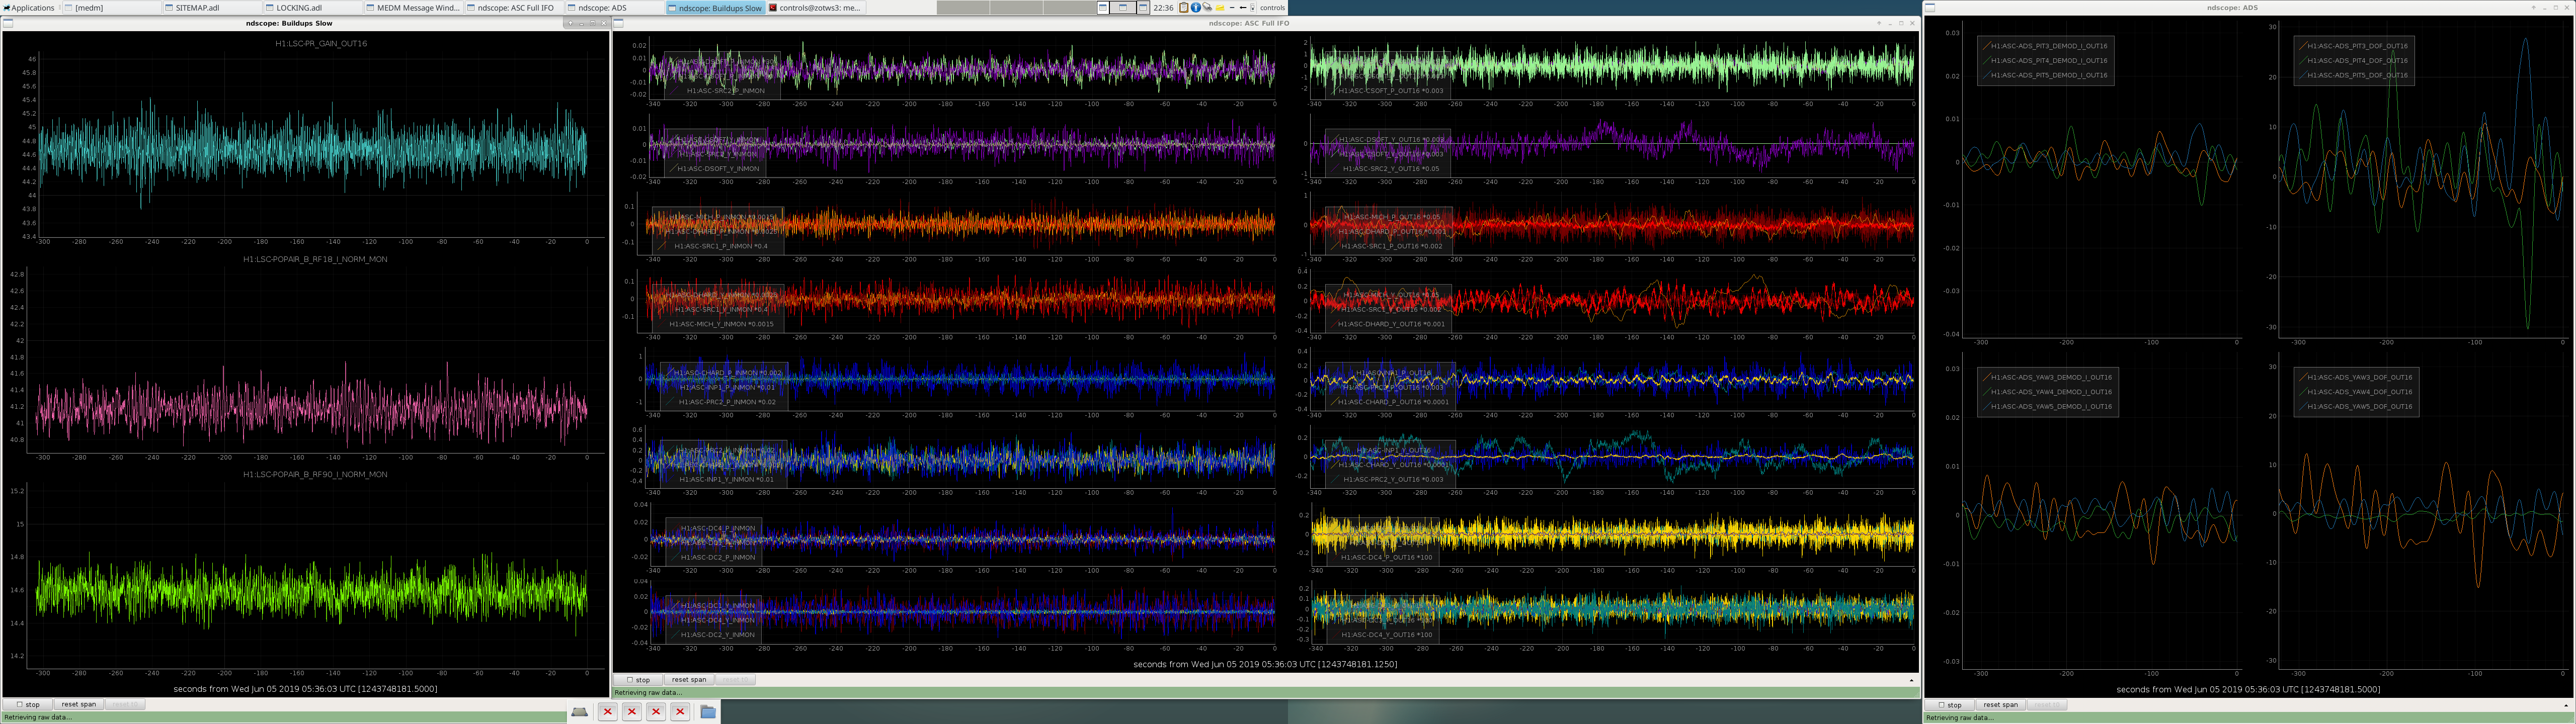
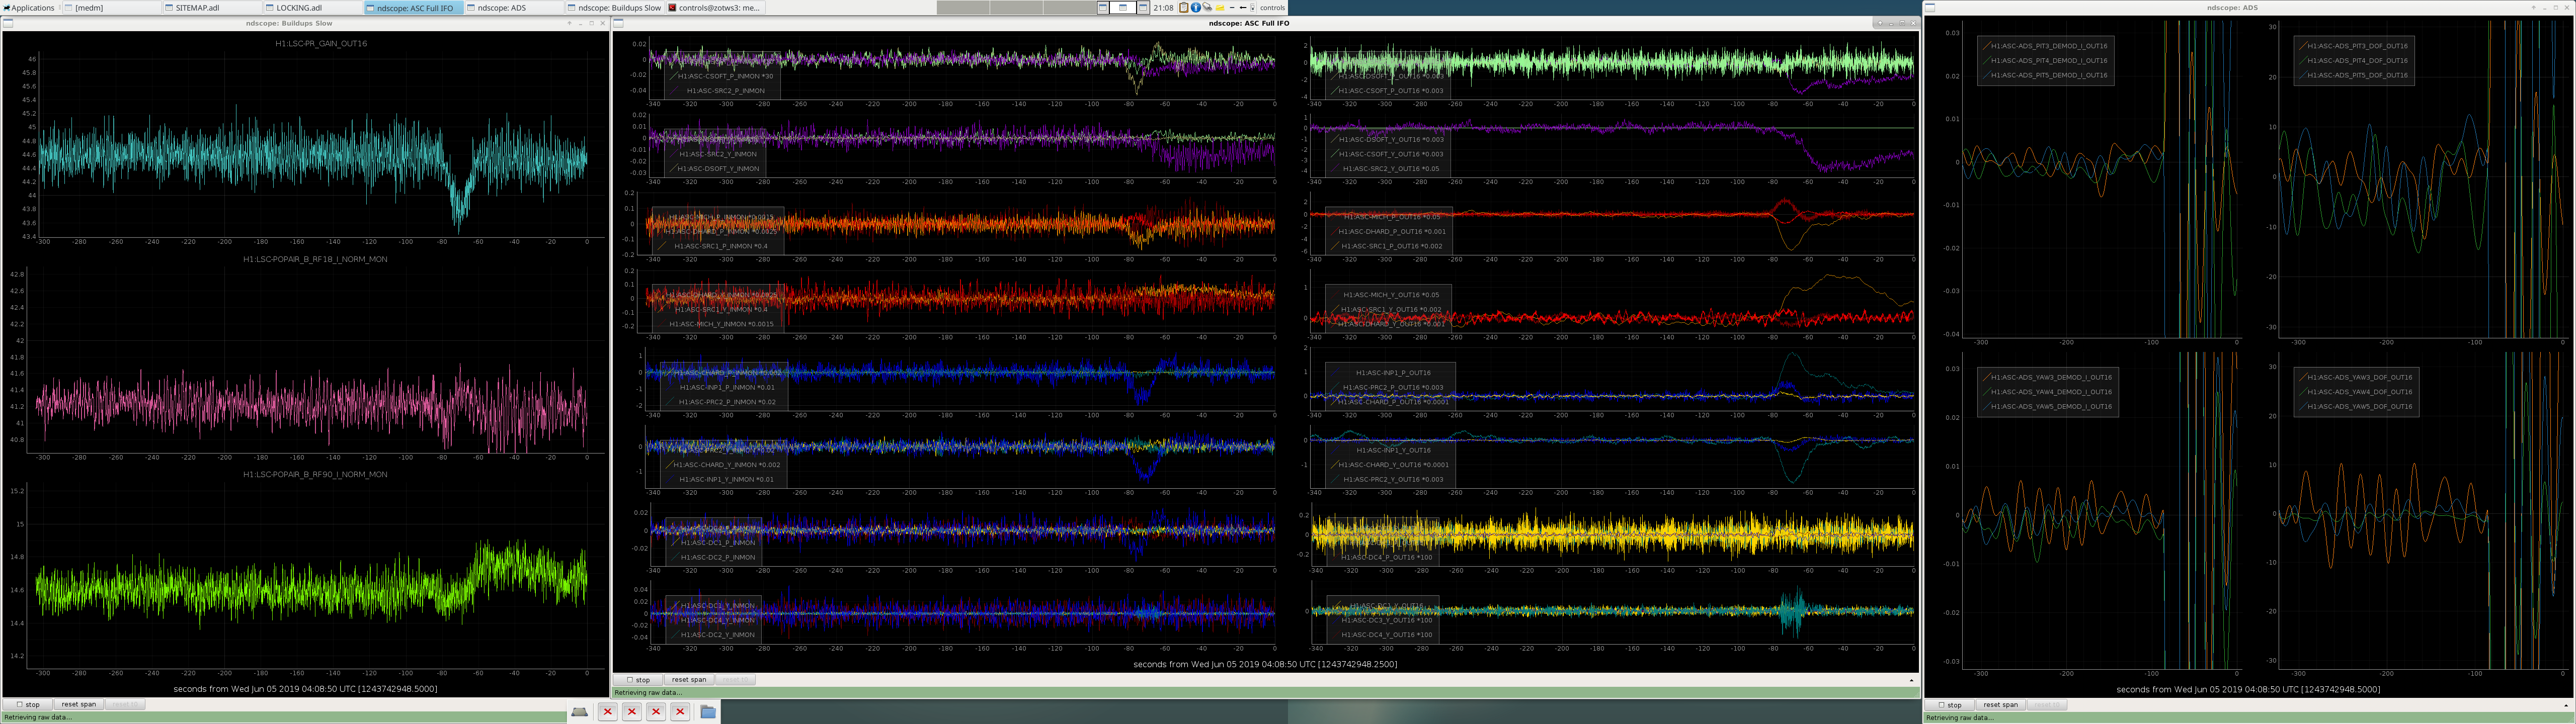
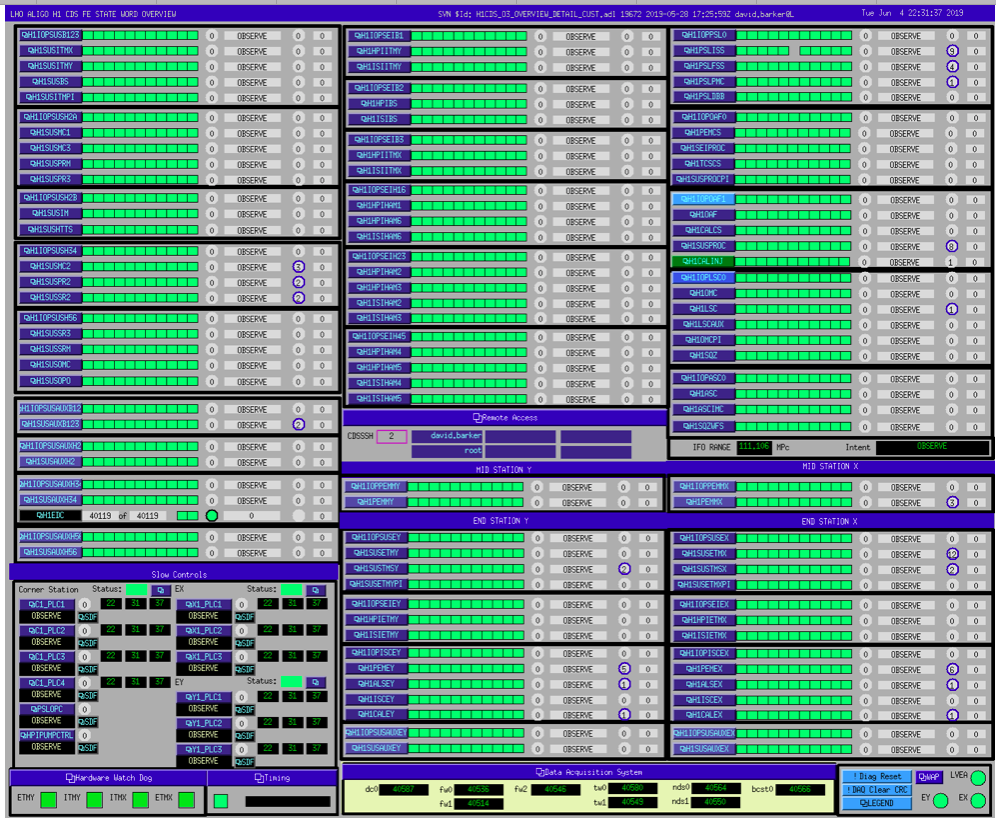
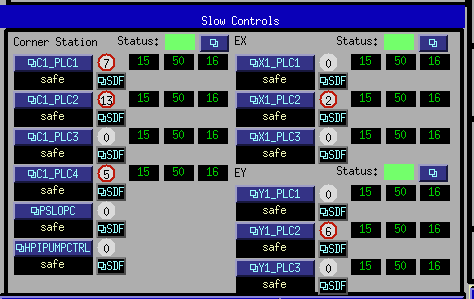
I'm not sure if this looks any better, but all the slow controls displays are now in one block, including buttons to open the SDF screens. Also the SDF diffs are now marked with a RED circle since guardian DIAG_SDF is monitoring these systems. Snippet is attached.
Laurence Datrier, Sheila Dwyer
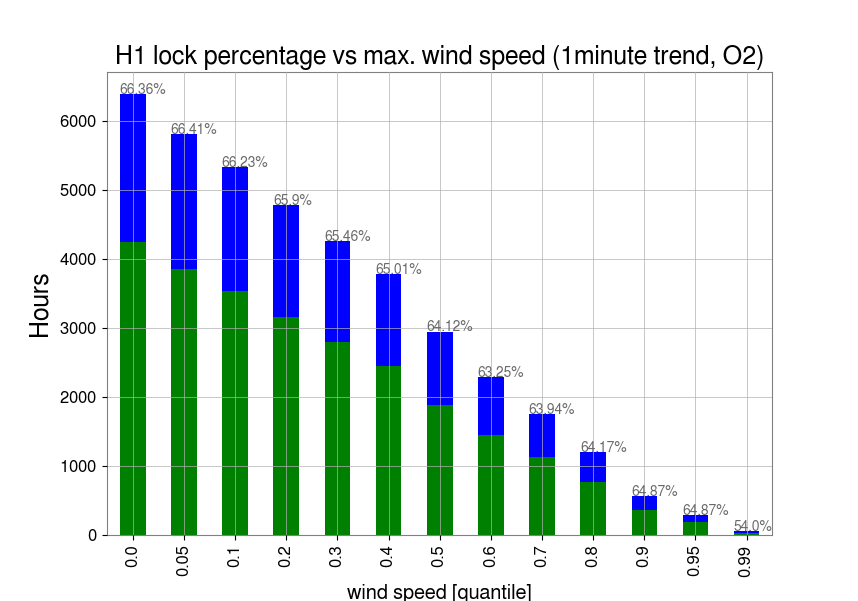
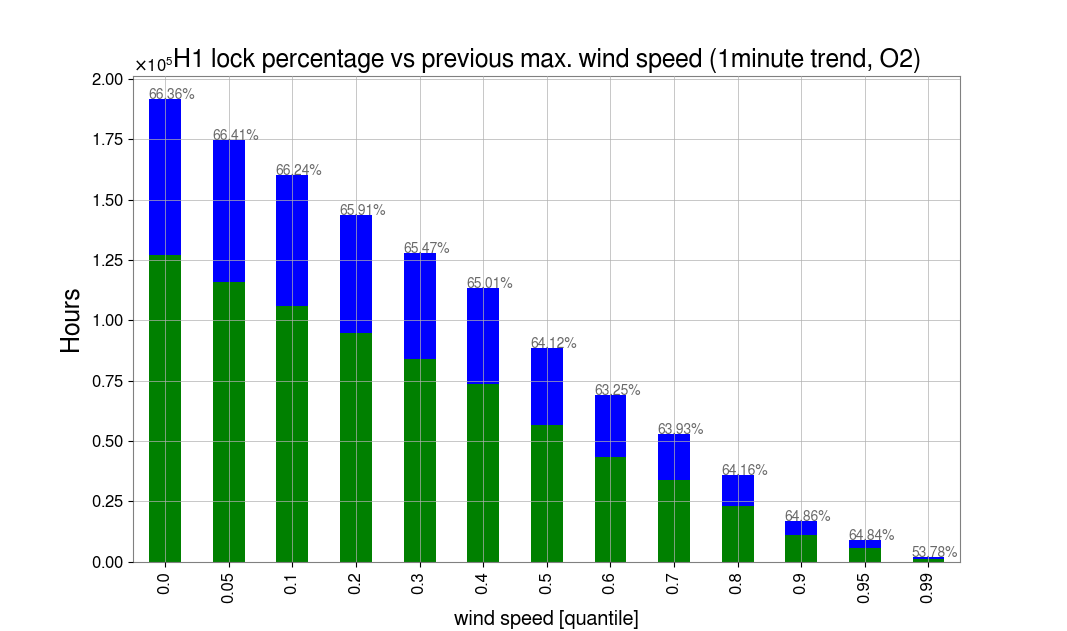
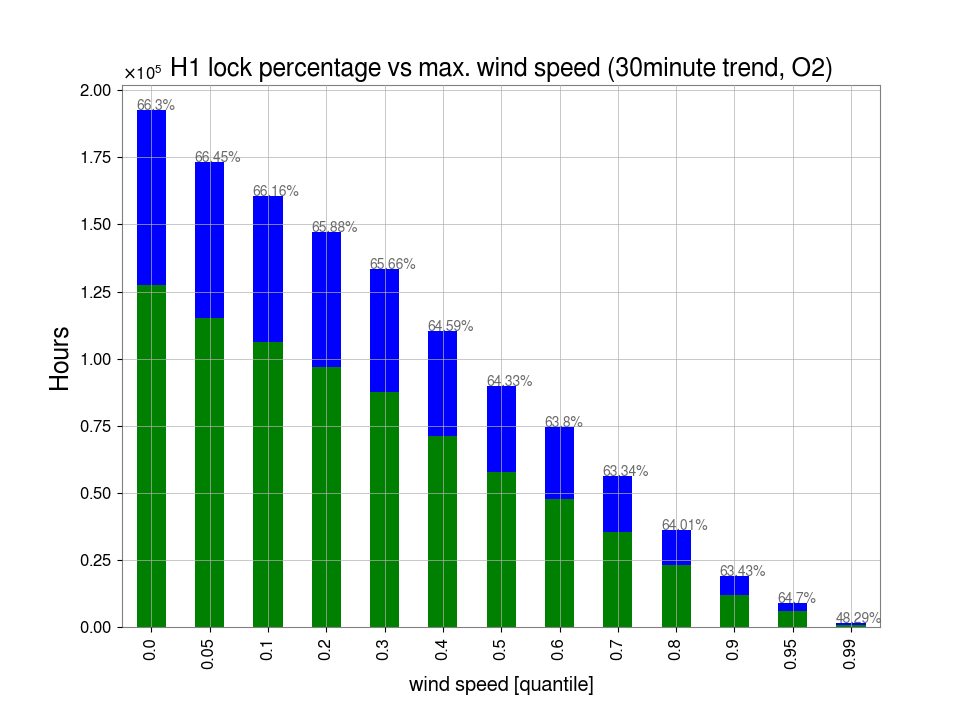
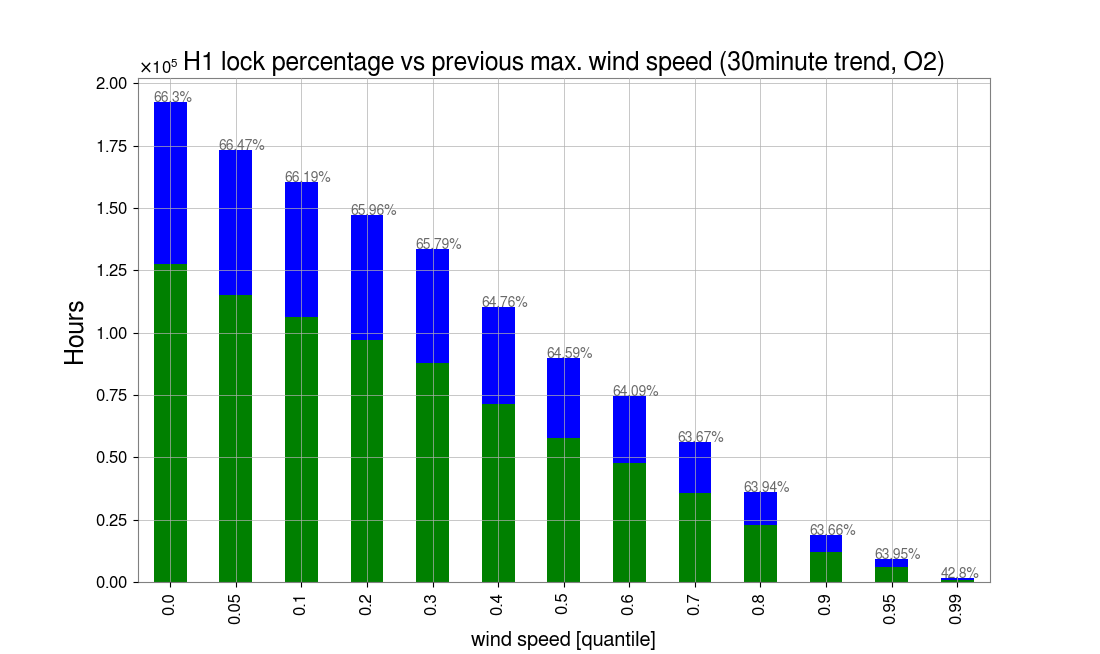
We looked at O2 data for H1 to get an estimate of down time due to wind. We used the maximum wind speed of the three max. 1min and 30min trends for the H1 EX, EY, CS wind channels, for all of O2.
The first histograms and trend line show duty cycle vs wind speed percentiles, for wind speed vs lock status and previous wind speed (max. of previous 1 or 30 min) vs lock status. Looking at the previous wind speed shows more down time due to high winds. Percentiles and wind speed values are (in mph):
| percentile | 5 | 10 | 20 | 30 | 40 | 50 | 60 | 70 | 80 | 90 | 95 | 99 |
| 1min trend wind speed [mph] | 3 | 4 | 5 | 6 | 7 | 9 | 11 | 13 | 16 | 21 | 25 | 33 |
| 30min trend wind speed [mph] | 5 | 6 | 7 | 8 | 10 | 12 | 14 | 17 | 21 | 26 | 31 | 41 |
The following histograms are the normalised distributions for wind speed at:
Compared to the normalised distribution at all times (blue). A significant tail appears in the distribution for wind speed at time of lock loss for winds >~35mph.
Interesting. Is this consistent with the histogram of 8 years of wind speed data in this log:
https://alog.ligo-wa.caltech.edu/aLOG/index.php?callRep=12996
and the O2 locking vs wind speed in Figure 16 of this paper?
https://dcc.ligo.org/LIGO-P1800038
It would also be useful to calculate the correlation of BNS range with wind speed. We may be able to maintain lock at higher wind speeds than in the past, but does the range suffer?
I used the wind wind speed histogram from 8 years of data at LHO:
https://alog.ligo-wa.caltech.edu/aLOG/index.php?callRep=12996
to calculate a wind probability density function. I then convolved it with a fit (approximation) of the O2 duty cycle vs wind speed from figure 16 in:
https://dcc.ligo.org/LIGO-P1800038
If interferometer locking was completely independent of wind speed, then only a 1.6% improvement in duty cycle would result.
However the BNS & BBH range *may* decrease at higher wind speeds.
Based on the table that Laurence posted, these wind speed percentiles are fairly consistent with Margarita's 8 year histograms in 12996. Margarita finds that the hourly maximum of the wind speed is about 31.3 mph 4.8% of the time, Laurence finds that the 30 minute maximum exceeds 31 mph 5% of the time.
Note that Laurence is plotting duty cycle for all the times with wind speeds above a certain quantile, while Krishna plots duty cycle vs wind speed in P1800038 , so they aren't directly comparable. The best comparison to Figure 16 would be to Laurence's 5th attachment, which is quite similar, the duty cycle is between 60-70% for wind speeds less than ~32 mph in P1800038, and less than the 99th percentile for the minute trend in Laurence's plot, which is 33mph.
I believe that the duty cycle vs wind speed plot in Figure 16 of P1800038 is based on minute trends of the wind speed, although I'm not completely certain of that. If it is based on minute trends, it makes most sense to convolve the wind speed vs duty cycle plot from P1800038 with a wind speed distribution based on the first line in Laurence's table, based on minute trends. (Or, to use wind speed vs duty cycle based on hour maximum instead).
The detailed O2 time accounting for H1 states that the interferometer was only down for wind 0.3% of the time:
https://ldas-jobs.ligo.caltech.edu/~detchar/summary/1164556817-1187733618/time_accounting/lho/
As Daniel point outs, wind might be responsible for some fraction of the time spent trying to re-lock.
Curiously the O2 accounting for L1 states that wind caused 2.7% downtime:
https://ldas-jobs.ligo.caltech.edu/~detchar/summary/1164556817-1187733618/time_accounting/llo/
I think it would be useful to run this again for O3 so far. A quick look indicates that the detector is rather more sensitive to wind now than at the end of O2. I went poking though the DetChar pages looking for impact of high wind - and one can see that for speeds of ~10 meters/sec one can often see dips in the range, and when the speed passes that LHO often looses lock. I counted up 15 days in the first 2 months where there seemed to be a clear correlation-by-eye between (wind vs. range) or (wind vs. operation). I expect there are many reasons why the detector is more sensitive, and hopefully we can get back to the sort of robustness that was achieved at the end of O2, but I think that, were there a wind break in place now, things would be easier to run.
I've posted an alog for the same analysis for O3, along with a look at the BNS range as a function of wind speed.
Philippe Nguyen, Corey Austin, Sharan Banagiri, Kara Merfeld, Anamaria Effler, Robert Schofield
O3 initial PEM injections took place mainly the weeks of March 25 at LLO and March 18 and April 15 at LHO. Hundreds of injections were made at tens of locations including acoustic, magnetic, shaking, impulse and RF injections (DTT files: https://lhocds.ligo-wa.caltech.edu/exports/pem/19aMarPEMinjections/LHO). A preliminary report was prepared, https://alog.ligo-wa.caltech.edu/aLOG/index.php?callRep=47881, we reference it below when it contains more detail then presented here.
A. Vibration coupling
1) Worst site: LLO EX transmission monitor
The large drops visible in LLO’s range as anthropogenic vibration levels increase, are associated with the EX transmission monitor. The noise has a higher SNR in the pitch and yaw signals from the quad diodes than it does in DARM. Thus, the diodes witness the noise before it is combined with other noise in DARM. Candidates include scattering and servo noise. https://alog.ligo-la.caltech.edu/aLOG/index.php?callRep=46147
2) Next worst sites: at LLO are EY and HAM5/6 and, at LHO, HAM5/6 and the PSL followed by EY
Figure 1 indicates the sites at LHO and LLO where the ambient vibration level is estimated to make the greatest roughly linear contribution to DARM for each frequency. A rough summary of the LHO plot is that, the greatest ambient vibration contribution to DARM is in the HAM5/6 area below 100 Hz, and in the PSL area above 100 Hz. The rough summary for LLO is that the worst sites are HAM5/6 and EY, and both are a significant contribution to DARM below 100 Hz.
The plots are made by first calculating a coupling function (meters of DARM per meter of motion at sensor) for each sensor for each of multiple injections, and then producing a single coupling function for each sensor, using an algorithm to select the best of the multiple injections, usually the loudest relative to other sensors. The coupling function is multiplied by the ambient vibration level to produce an estimate of the ambient contribution to DARM. At each frequency in the plot, the sensor or sensor region with the highest estimated contribution to DARM is indicated by color, and the estimated contribution plotted.
These estimates are for banded linear coupling. When we notice upconversion, we study it separately, injecting in narrow bands to find the motion frequencies responsible for the upconversion. The estimates in Figure 1, however, may be somewhat distorted by upconversion: if the upconverted noise is within the injection band, that noise is assumed to be produced by the injection at the frequency that the upconverted noise appears at in DARM. This tends to be more of a problem for scattering, since it is so non-linear, than for beam jitter. We did not find cases of upconversion, other than at the ETMX transmission monitor, that would alter these estimates of the worst coupling.
These plots, other summary plots, and coupling functions for every relevant PEM sensor are located at PEM.LIGO.ORG, press the “coupling functions” button.
3) At both sites, HAM5/6 coupling is likely at the septum
The coupling at HAM5/6 was narrowed down to the septum at both LHO and LLO, using impulse injections. https://alog.ligo-wa.caltech.edu/aLOG/index.php?callRep=48886
4) EY coupling at LLO is likely in the manifold, at LHO, it may in the ETMY chamber. More evidence is needed to be confident that baffling the rest of the periscope and the Pcal beam nozzles will fix the LLO EY coupling problem.
Impulse injections suggest that the vibration coupling site at LLO EY is in the manifold (near the Pcal periscope) and, with less certainty, that the coupling site at LHO EY is in BSC 10. Resonance structure of the signals suggest that we don’t have accelerometers on the coupling sites. There are some glints visible from the un-baffled part of the LLO EY periscope, but other sites have similar glints. There is the possibility of scattering from the Pcal beam nozzle, but shaking was inconclusive. More evidence is needed in order to be confident that baffling the rest of the periscope and the Pcal beam nozzles will fix the EY coupling problem. https://alog.ligo-la.caltech.edu/aLOG/index.php?callRep=46208
5) HAM5/6 coupling at the septum window?
The coupling at the septum may be at the window: a bright scattered light spot is visible on the septum window at LHO, at a viewpoint 3 degrees from the beam. https://alog.ligo-wa.caltech.edu/aLOG/index.php?callRep=48965
However, no spot was observed at LLO at 28 degrees (the 3 degree view was not available), https://alog.ligo-la.caltech.edu/aLOG/index.php?callRep=45980 , and updated scattering estimates from Peter F. suggest that the window could not account for the scattering unless there is some imperfection https://alog.ligo-la.caltech.edu/aLOG/index.php?callRep=46272 .
One mitigation possibility would be to remove or angle the window and hedge our bets by also baffling the light-accessible regions of the septum.
Other beam spots on LLO HAM6: https://alog.ligo-la.caltech.edu/aLOG/index.php?callRep=45378, https://alog.ligo-la.caltech.edu/aLOG/index.php?callRep=44985
OMC REFL beam not the cause of the main HAM5/6 scattering: https://alog.ligo-la.caltech.edu/aLOG/index.php?callRep=46010 .
6) IO jitter coupling at both sites
Figure 2 shows jitter coupling for both sites.
7) Comparison of LLO EY and EX in-lock photos
Relevant to the source of coupling at both the TMSX and EY, are photos taken at the LLO end stations: https://alog.ligo-la.caltech.edu/aLOG/index.php?callRep=45469
The photos show a beam spot on the mirror that sends the red beam to the ALS table, M13.
8) Shaker injections at EY produce noise similar to some anthropogenic noise https://alog.ligo-la.caltech.edu/aLOG/index.php?callRep=46089
9) Other vibration coupling
Beamtube shaking https://alog.ligo-la.caltech.edu/aLOG/index.php?callRep=45710
Coupling at LHO BS chamber, LLO BSC1, and at the reduction flanges by the ITM optical levers at both sites is shown in Figure 3.
48 Hz peak at LHO The 48Hz peak at LHO appears to be driven acoustically (though modulated by alignment or other source). See the consistently lower amplitude when the HVAC is off https://alog.ligo-wa.caltech.edu/aLOG/index.php?callRep=48919 . Acoustic and impulse injections suggest that the source is in the vertex area, possibly in BSC2, but more work is needed.
Reduction of 58 Hz chiller peak at LHO: https://alog.ligo-wa.caltech.edu/aLOG/index.php?callRep=47881
10) Vibration coupling not seen (at least 10 below DARM)
|
Site |
Location |
Injection Type |
Relevant to |
|
LHO, LLO |
mids |
Acoustic/shaker 10-100 Hz |
Beamtube scatter |
|
LHO, LLO |
IOT2L (IMC table) |
Acoustic/shaker 10-100 Hz |
Local coupling |
|
LHO, LLO |
IMC tube (HAM2-3) |
Shaker 5-100 Hz |
Local coupling |
|
LHO |
HEPI EX, EY, BS, IX, IY |
HEPI Inj 1-100 Hz, beam dof |
ACB, BS baffles, scatter |
|
LLO |
ISI all BSC and HAM |
ISI Inj 1-5 Hz, beam and r dofs |
Daytime scatter |
|
LLO |
Arm beamtube |
Shaker ~58 Hz |
Beamtube scatter |
|
LHO, LLO |
SRC tube (HAM4-5) |
Shaker 5-100 Hz |
Local coupling |
11) Vibration coupling estimates from PEM injections correctly predict environmental coupling
We usually expect the coupling functions to be good to within a factor of about 2. For the known vibration features in DARM, the 48 Hz and 90 Hz peaks, as well as several of the jitter peaks at LHO, the estimate in Figure 1 is good to within a factor of 2. In addition to this comparison to stationary features, the coupling predictions have been tested against several transients, mentioned below.
LLO DARM glitch near S190510g is correctly predicted from PEM injection coupling functions. It was produced by thunder-driven vibration at EY https://alog.ligo-la.caltech.edu/aLOG/index.php?callRep=46025
Range reduction from LHO HVAC is roughly predicted from estimates for HAM5/6. https://alog.ligo-wa.caltech.edu/aLOG/index.php?callRep=48912
Range reduction from rain at LHO is roughly consistent with PEM coupling functions https://alog.ligo-wa.caltech.edu/aLOG/index.php?callRep=49495
Range reduction from wind at LHO is roughly consistent with PEM coupling functions.
B. Magnetic Coupling
Figure 4 shows that magnetic coupling is at least a factor of 10 below DARM at both sites. The coupling function for the stochastic group estimates of inter-site correlation from the LEMIs is here:
We only have one large coil working so these estimates of magnetic coupling are made using comb injections instead of broad- band injections (because of limitations in the field amplitude we can produce with the current system). Resonances observed in magnetic field coupling from the large-coil, broad-band injections (https://alog.ligo-wa.caltech.edu/aLOG/index.php?callRep=47881 ), justify the ongoing installation of large coils so that we don’t miss similar resonances between combs. We are now dominated by electronic and cable coupling, so the coupling functions are more complex than when the coupling was dominated by permanent magnets on optics.
Weekly injections. Because cable and electronics coupling can vary with electronics work, magnetic coupling is expected to vary during the run. In O2 the coupling varied at LHO by a factor of several between the beginning and end of the run. To better understand and identify changes in coupling, we have set up weekly automatic injections for each Tuesday before maintenance. The results are here: https://lhocds.ligo-wa.caltech.edu/exports/pem/WeeklyMagneticInjection/output/
Weekly injections have also begun at LLO: https://alog.ligo-la.caltech.edu/aLOG/index.php?callRep=45731
C. RF Coupling
Figure 5 shows that we can detect 9 and 45 MHz injections at both sites with at least two orders of magnitude greater SNR on our radio receivers than with DARM.
D. Site activities
Figure 6 shows several activities in the control room that show in DARM, an animated crowd walking, rolling a chair with a person in it across the control room, and dropping a large super ball from 4 ft. I suggest that we be a little more careful with site activities in this high-detection rate era. There is a chance that new or rare noise sources, that are not well accounted for in background estimates, may result in wasted telescope time before we get a chance to retract alerts based on PEM.
Update to B. Magnetic Coupling
The results from weekly magnetic injections have now been moved to
https://ldas-jobs.ligo-wa.caltech.edu/~philippe.nguyen/weekly-magnetic-injections/output/summary/ for LHO
https://ldas-jobs.ligo-la.caltech.edu/~philippe.nguyen/weekly-magnetic-injections/output/summary/ for LLO