Pep Covas, Jeff Kissel
This is an update on past's week alog regarding bounce/roll measurements:
| Optic | Bounce mode [Hz] | Roll mode [Hz] |
| SRM | 27.45 | 40.88 |
| SR2 | 27.50 | 40.91 |
| SR3 | 27.71 | 45.32 |
| PRM | 27.59 | 40.87 |
| PR2 | 27.41 | 40.94 |
| PR3 | 28.21 | 46.09 |
| MC1 | 27.39 | 40.81 |
| MC2 | 27.74 | 40.91 |
| MC3 | 27.42 | -- |
| BS | 17.79 | 26.06 |
Due to maintenance work requiring the fire pumps to be operated, I've bypassed these cell phone alarms.
Bypass will expire:
Tue Jun 4 12:36:36 PDT 2019
For channel(s):
H0:FMC-CS_FIRE_PUMP_1
H0:FMC-CS_FIRE_PUMP_2
Bypassed has expired, all cell phone alarms are now active.
WP 8227 Output from svn update attached.
TITLE: 06/04 Day Shift: 15:00-23:00 UTC (08:00-16:00 PST), all times posted in UTC
STATE of H1: Preventive Maintenance
OUTGOING OPERATOR: Corey
CURRENT ENVIRONMENT:
Wind: 6mph Gusts, 5mph 5min avg
Primary useism: 0.01 μm/s
Secondary useism: 0.09 μm/s
QUICK SUMMARY:
We have been moving off the POP QPDs since we stopped using them for ASC control and moved to the dither. The driver was switched off at the rocker switch, so I turned it on at the start of the maintence period. It may have been me moving a ladder or climbing around HAM2 that caused the lockloss.
TITLE: 06/04 Owl Shift: 07:00-15:00 UTC (00:00-08:00 PST), all times posted in UTC
STATE of H1: Earthquake
INCOMING OPERATOR: Ed
SHIFT SUMMARY:
H1 Locked most of the shift (7hrs40min). Rode through a smallish EQ. Maintenance Time!
LOG:
STS Centering Check run. All proof masses within range, EXCEPT for following( > 2.0 [V] ):
T240 Centering Check run. All proof masses within range, EXCEPT for following (> 0.3 [V] ):
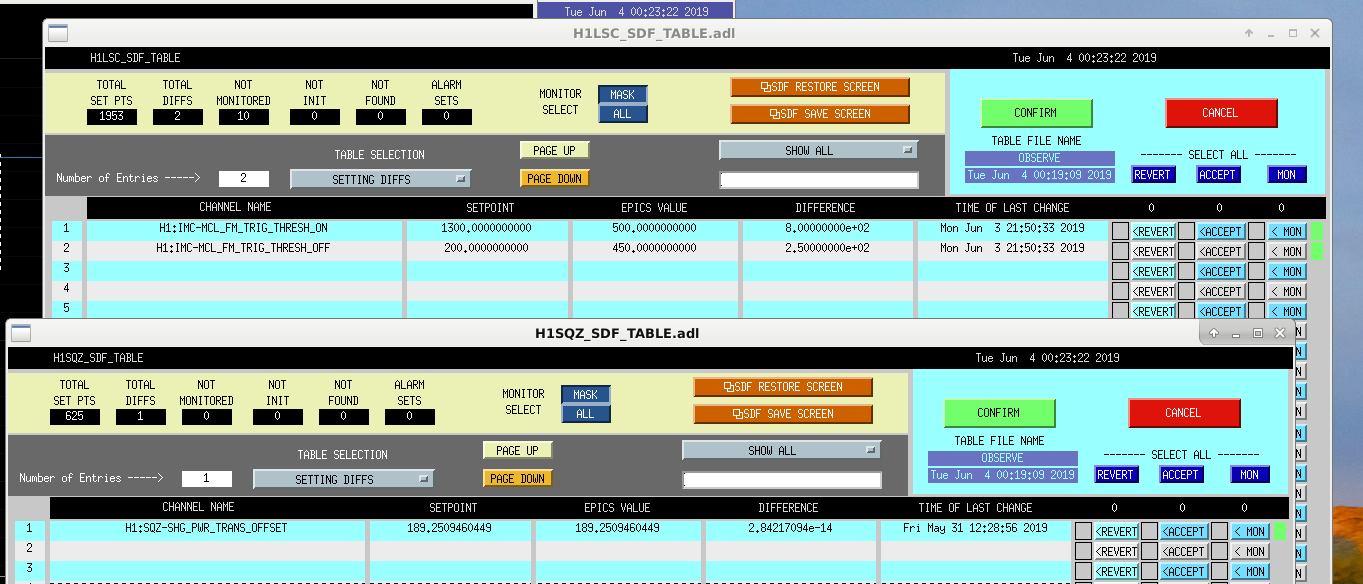
When back at NLN, had a few SDF Diffs (attached):
1) IMC-MCL Threshold ON/OFF values.
I remember seeing this a week or so ago (5/23 & 5/25), but since (1) I couldn't remember the issue, (2) it's midnight, (3) didn't know where these channels were, and (4) I wanted to get back to OBSERVING, I ACCEPTED these values. In hindsight, looking at trends it seems I should have reverted these values, because the DOWN took us to the values we were at (i.e. 500 for ON & 450 for OFF). So this might be an open issue for the next time we look at SDF diffs.
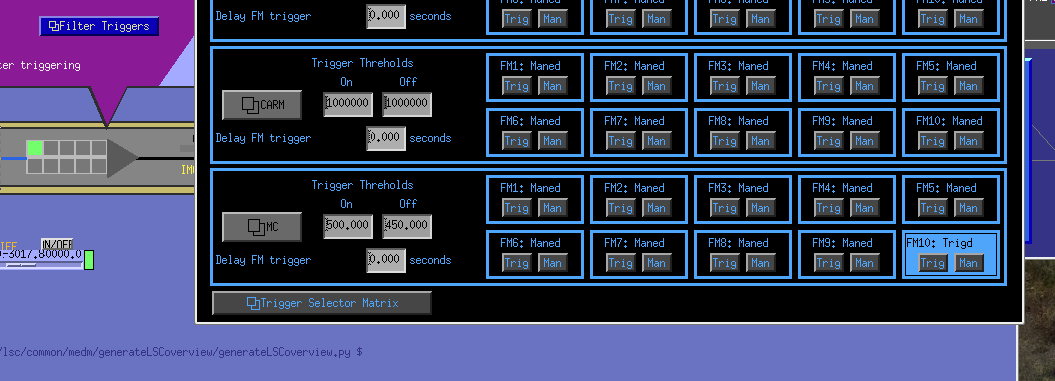
Ended up finding these IMC channels via the LSC Overview under the Filter Trigger button in the "middle" of the screen (attached).
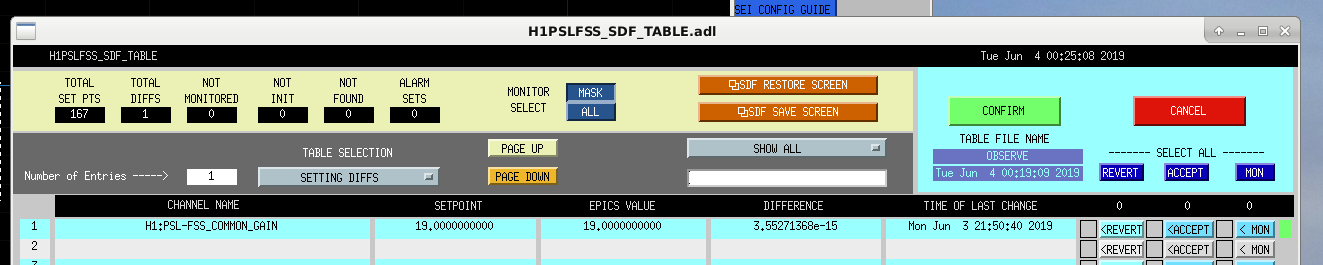
2) Diff due to significant value/digit (i.e. 10^-14)
I just ACCEPTED these for the PSL ISS & SQZ SHG
Also took Observatory Mode from EARTHQUAKE to OBSERVING.
TITLE: 06/04 Owl Shift: 07:00-15:00 UTC (00:00-08:00 PST), all times posted in UTC
STATE of H1: Earthquake
OUTGOING OPERATOR: Cheryl
CURRENT ENVIRONMENT:
Wind: 7mph Gusts, 5mph 5min avg
Primary useism: 0.06 μm/s
Secondary useism: 0.10 μm/s
QUICK SUMMARY:
Walked into Cheryl taking H1 back up after recovering from a ~6.2 EQ from Japan. She mentioned not needing to do an alignment and in fact basically taking H1 back with minimal tweaks needed (other than PRM touch up. She also mentioned hanging out in DRMI_LOCKED_PREP_ASC for a while as she watched all the ASC signals converge before moving on).
Just made it back to OBSERVING.
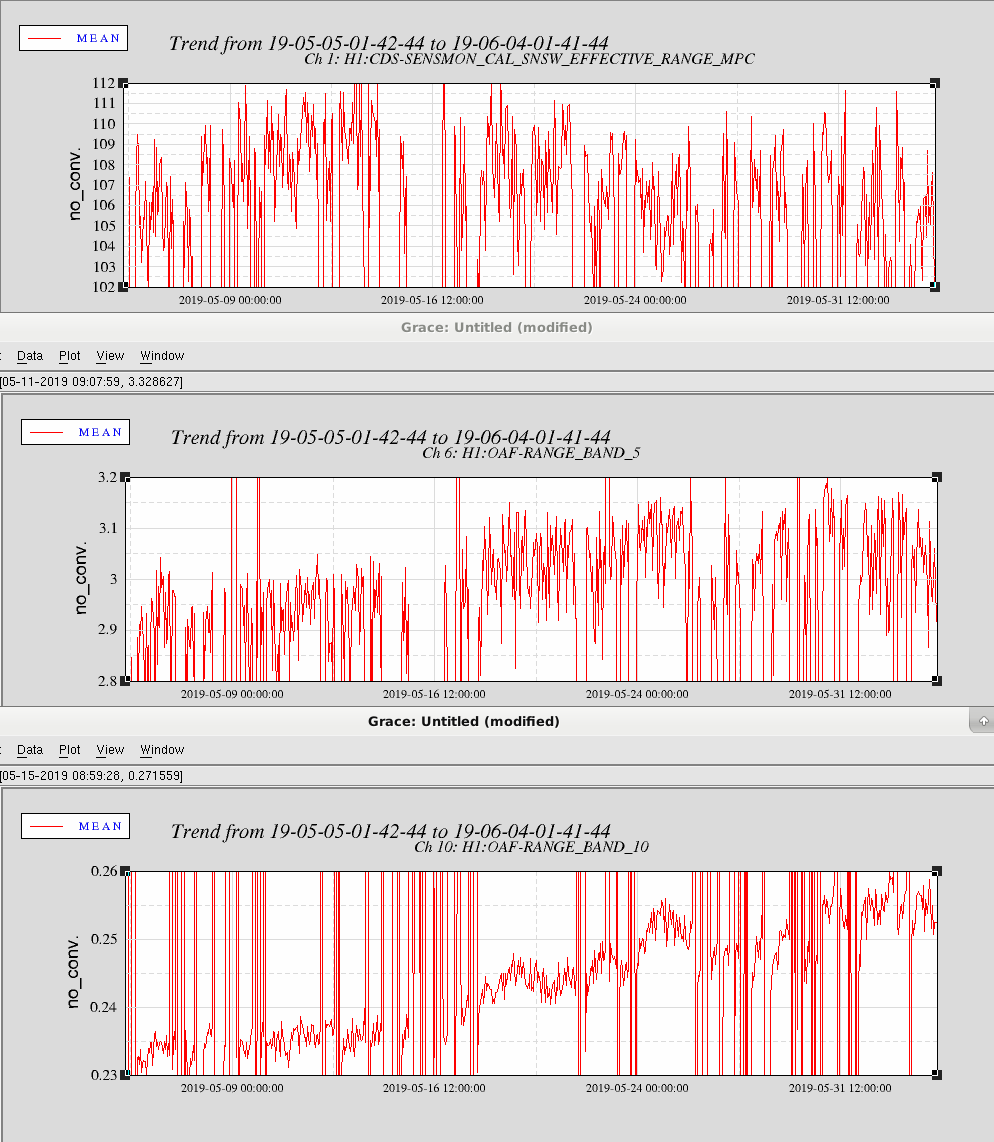
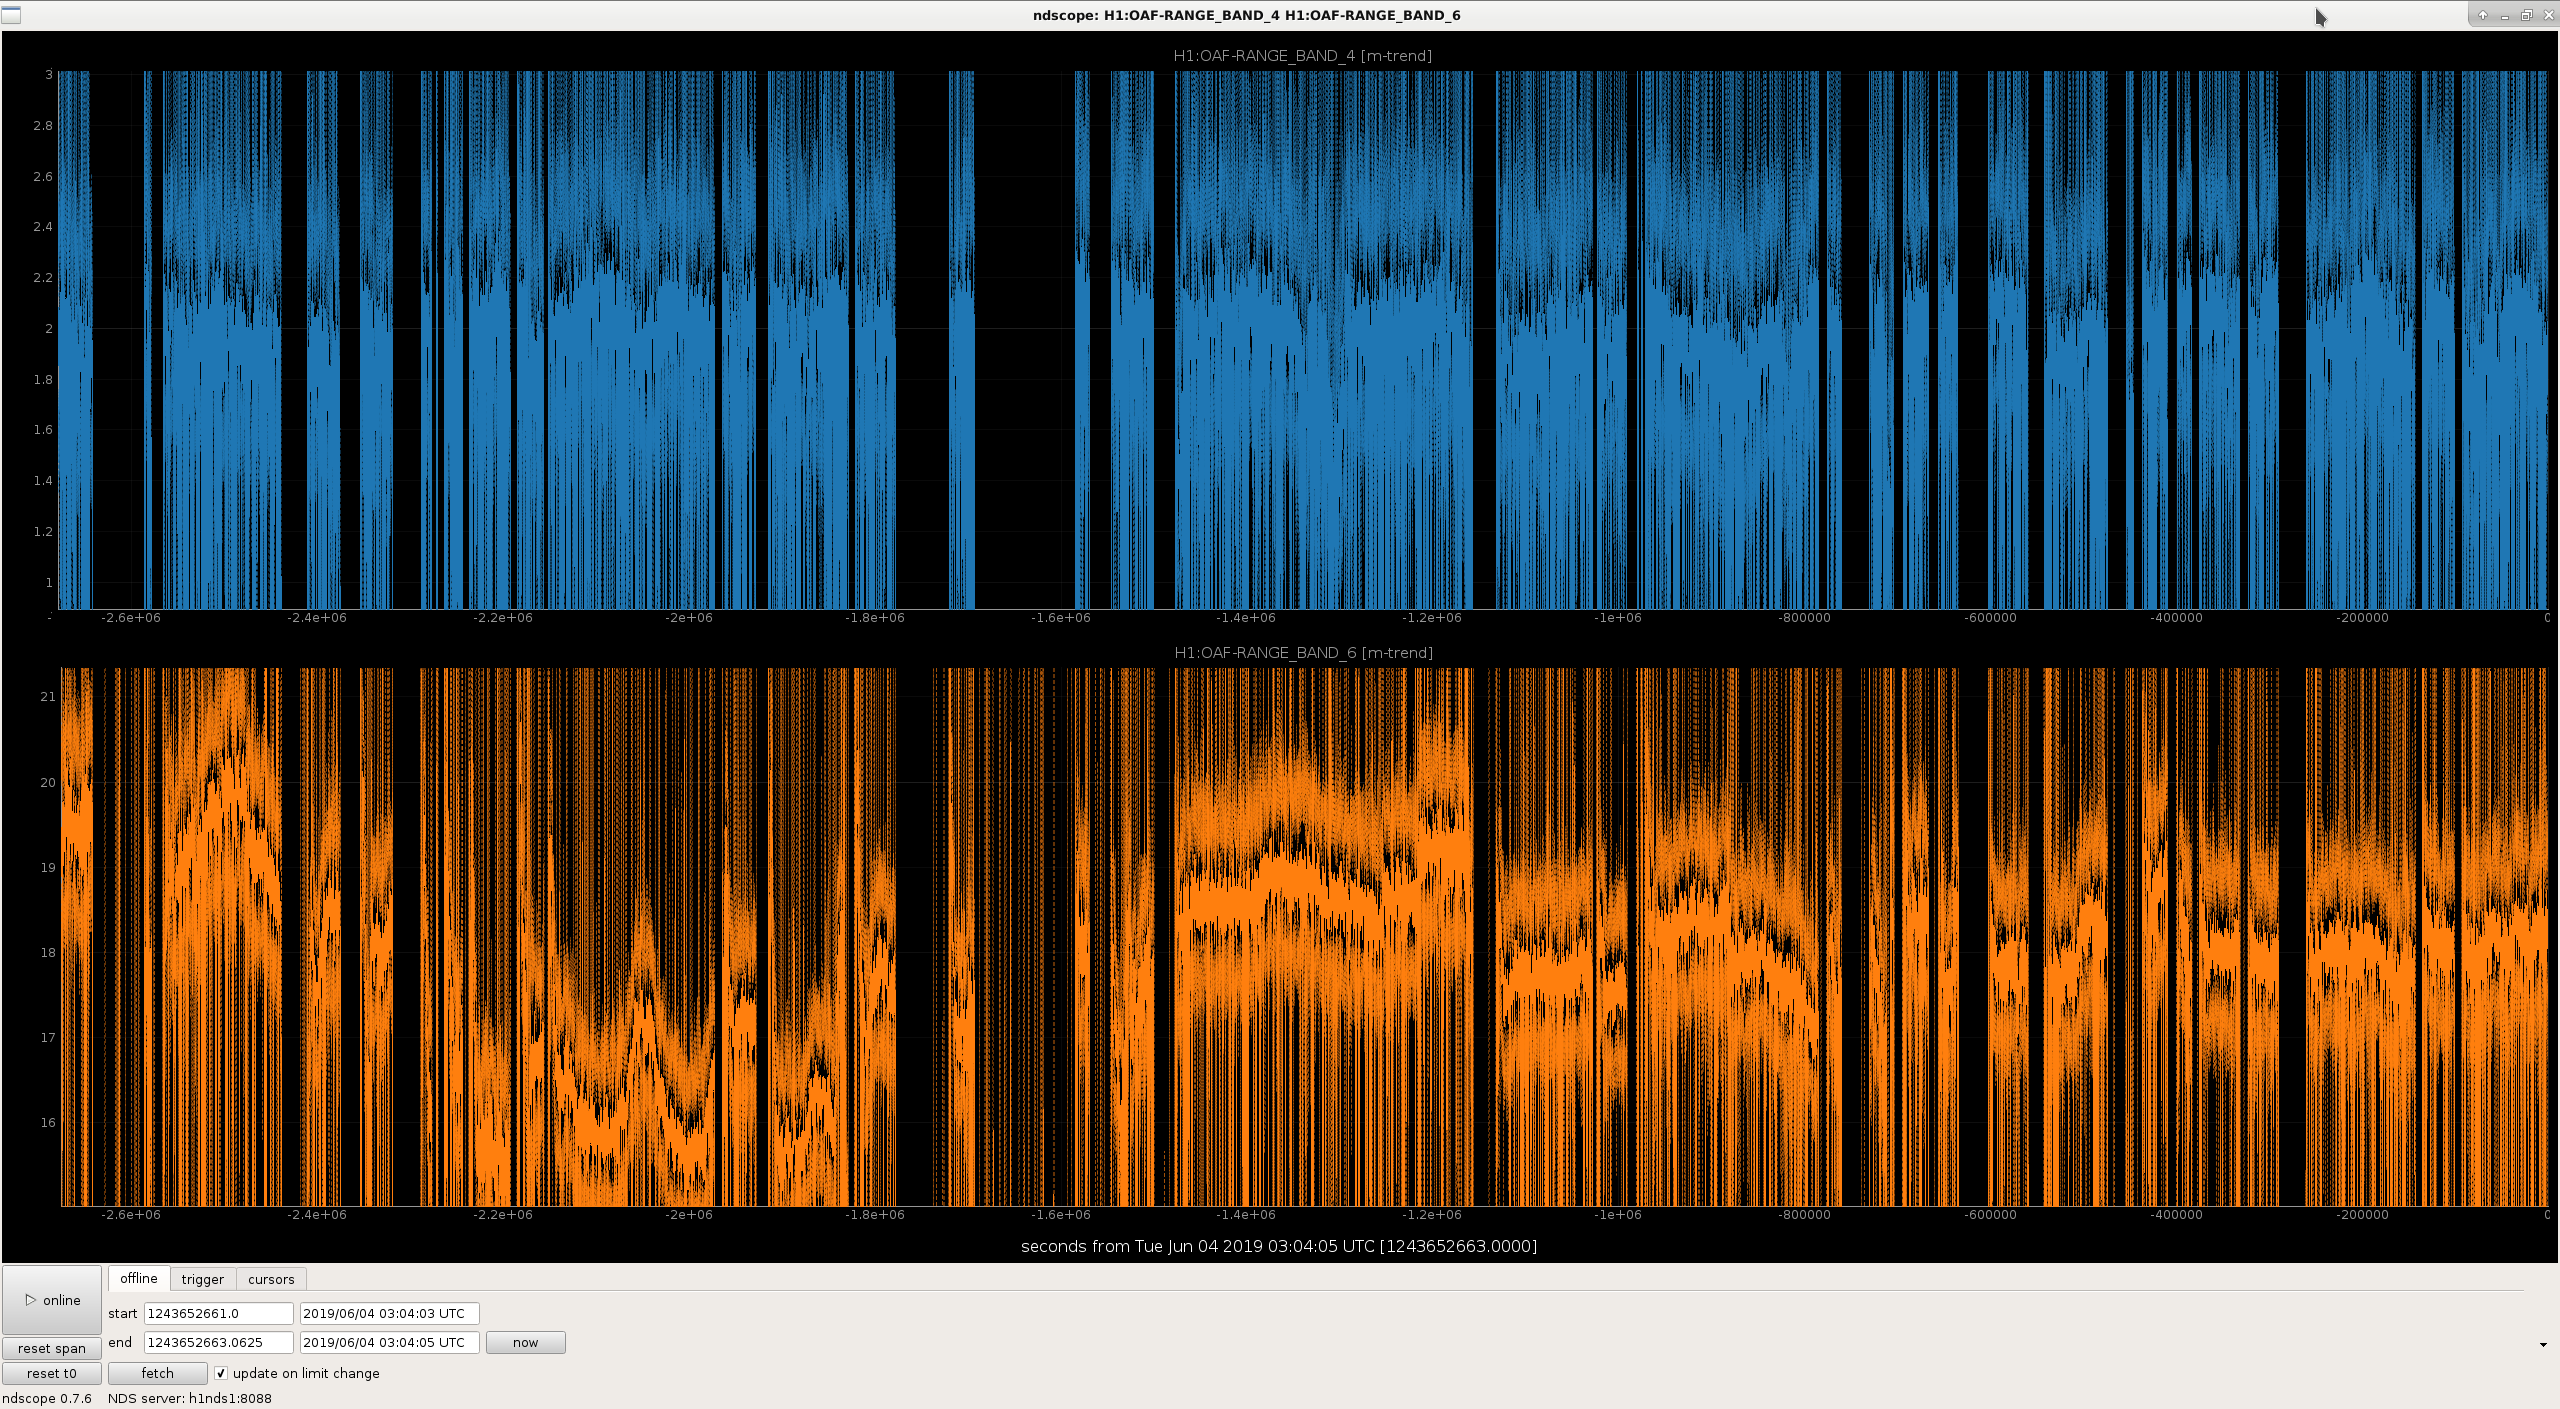
I looked at 30 days of H1 range and the BLRMS channels, and found a clear increase in the frequency range 100-450Hz (H1:OAF-RANGE_BAND_5), and 400-420Hz (H1:OAF-RANGE_BAND_10). I found 6 channels that have a clear decrease, and two channels that are either flat or jump around, making their contribution unclear with this first look.
PLOT 1: Increasing BLRMS:
PLOT 2: decreasing BLRMS:
PLOT 3: flat/variable BLRMS:
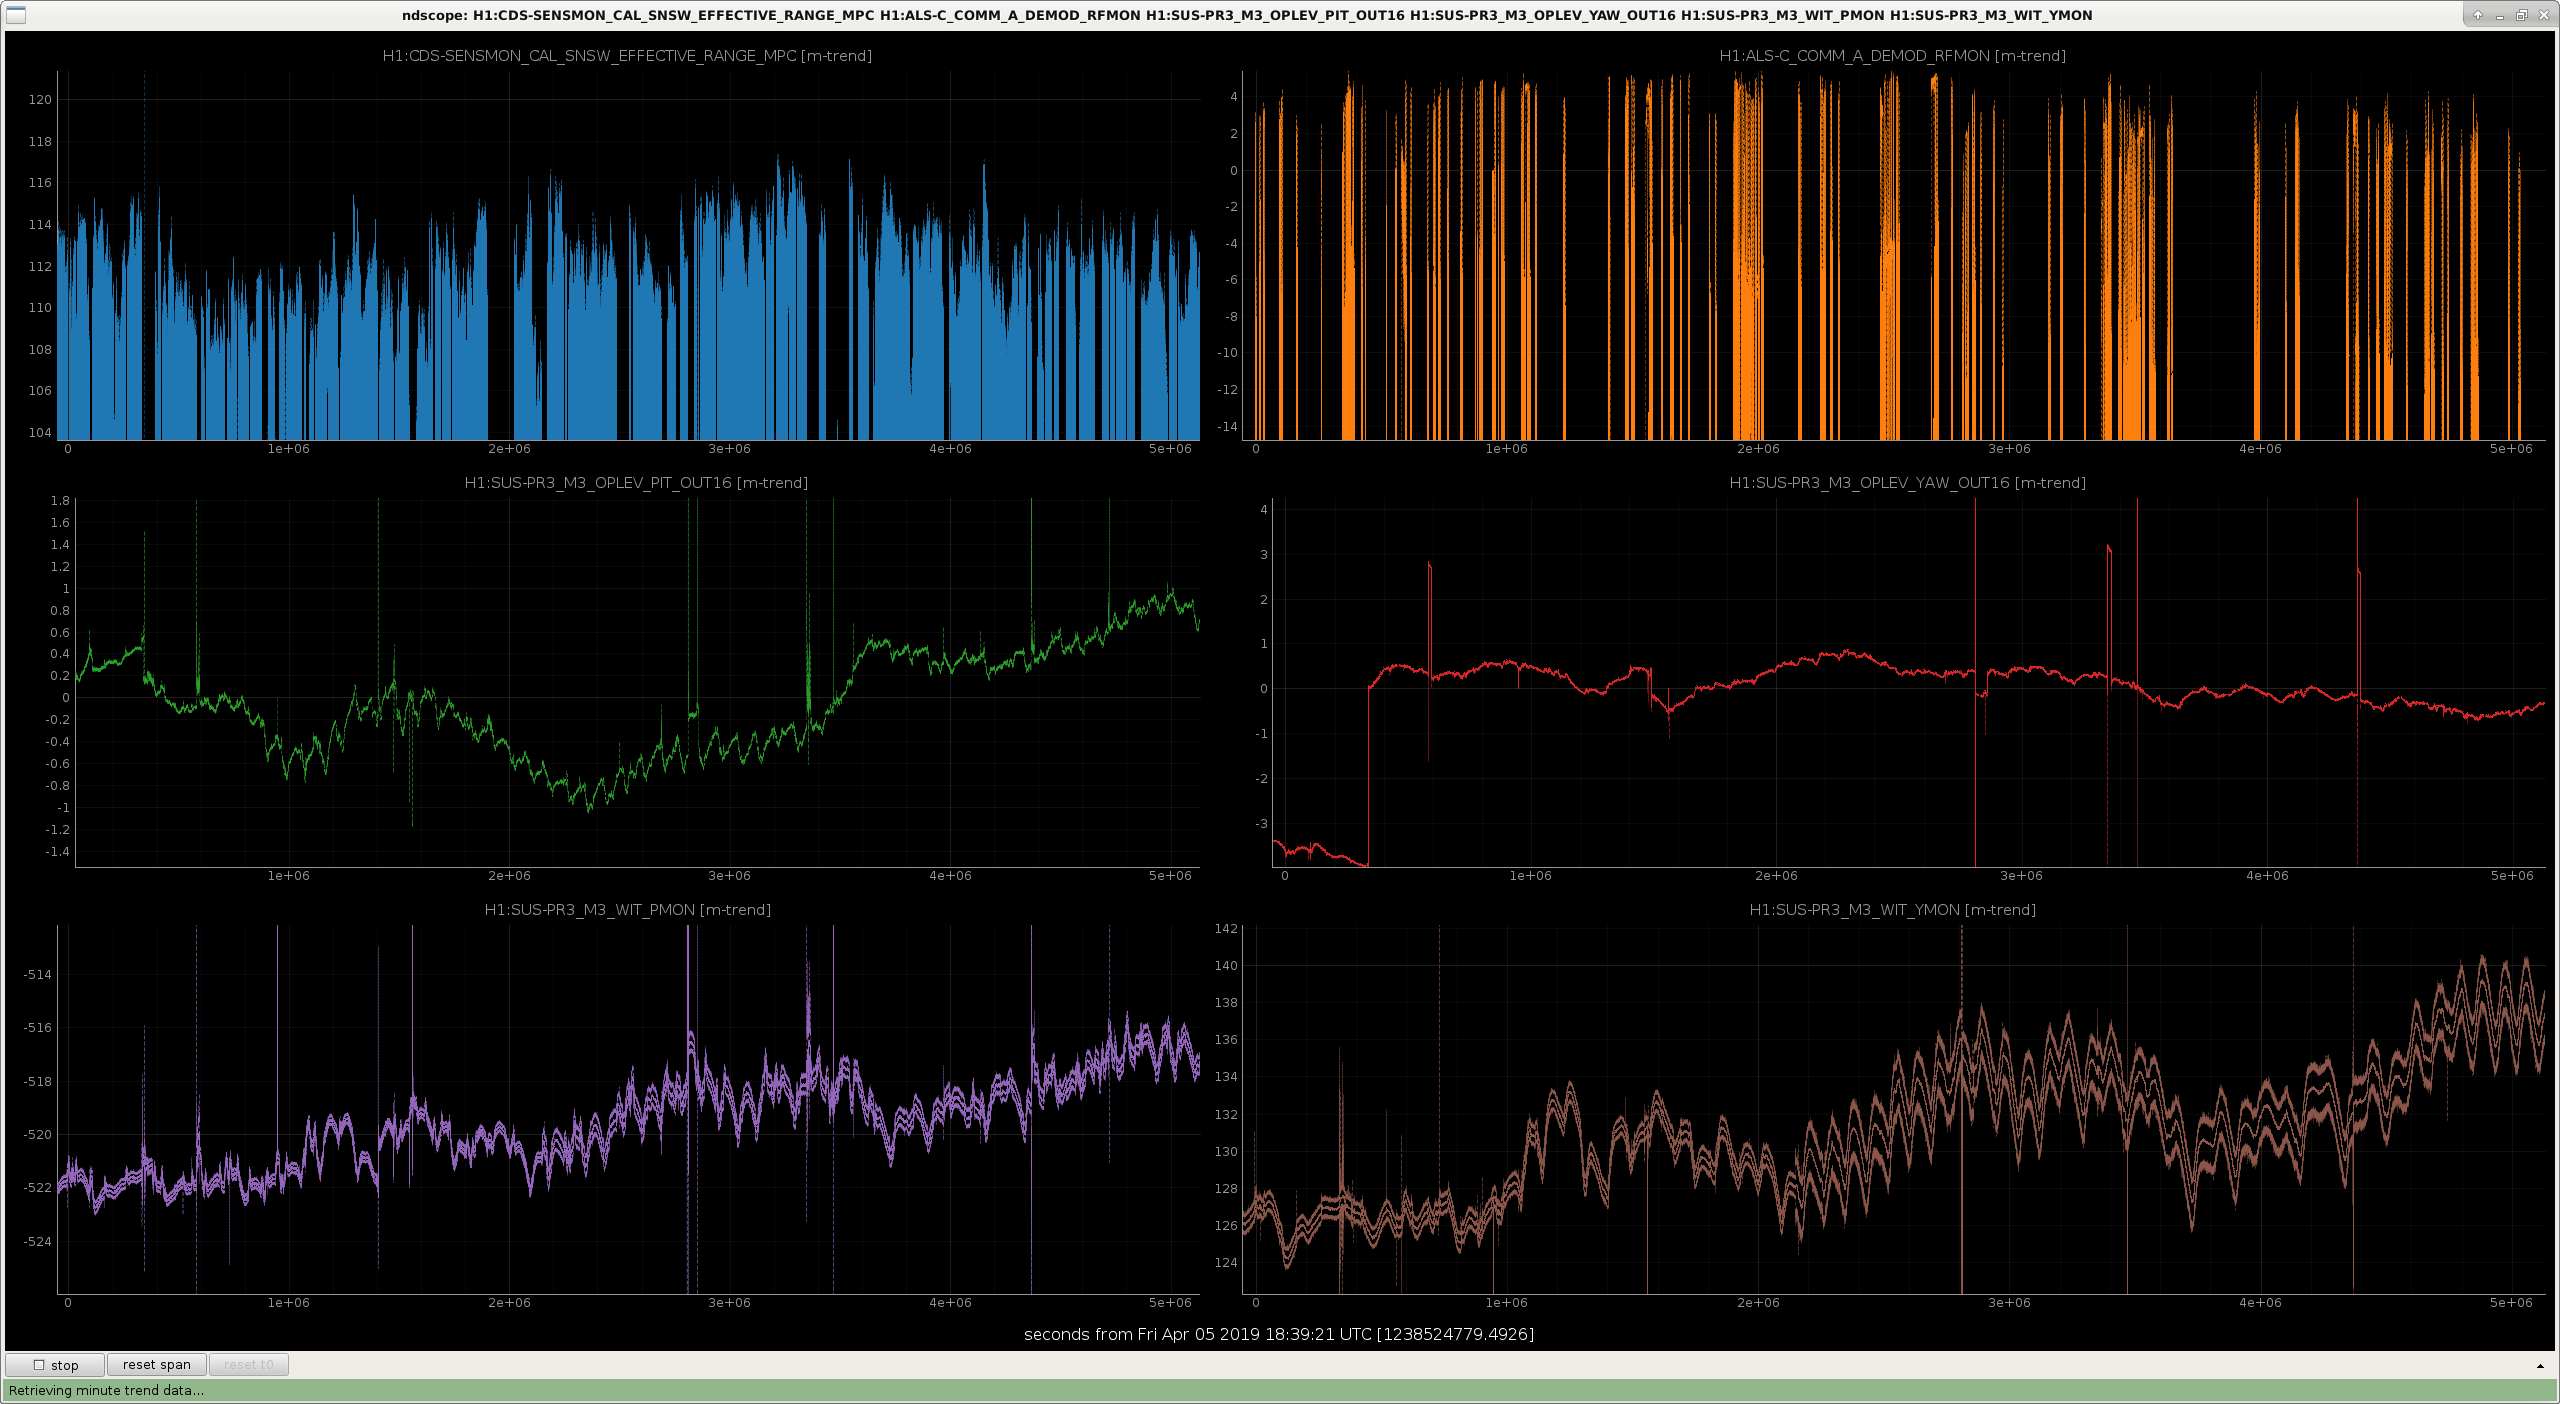
Another thing that I thought of was PR3 potential drift, since the COMM beatnote looks like it's been getting a little lower over time.
In the attached plot I have the range as well as the COMM beatnote on the top row, and then the PR3 oplev and PR3 osems on the lower two rows. The beatnote trace in orange is nearly impossible to interpret since the beatnote changes with alignment, and I haven't taken the time to plot only times when we're actually aligned, so nevermind. But, the oplev and osems don't seem to show any dramatic drift (good, and expected that PR3 shouldn't really move a lot), and certainly they don't seem to correlate with the overall shape of the range.
@DetChar: Isn't this the kind of study for which LASSO was designed? My impression is that LASSO would do this more rigorously, providing mathematically confirmed correlation (as opposed to "by eye"). I understand that there's a LASSO summary page (e.g. LASSO:20190603), but as is often the case, we're interested in trends over much longer time-scales than a single day...
TITLE: 06/04 Eve Shift: 23:00-07:00 UTC (16:00-00:00 PST), all times posted in UTC
STATE of H1: Earthquake
INCOMING OPERATOR: Corey
SHIFT SUMMARY: Locked until Earthquake
LOG:
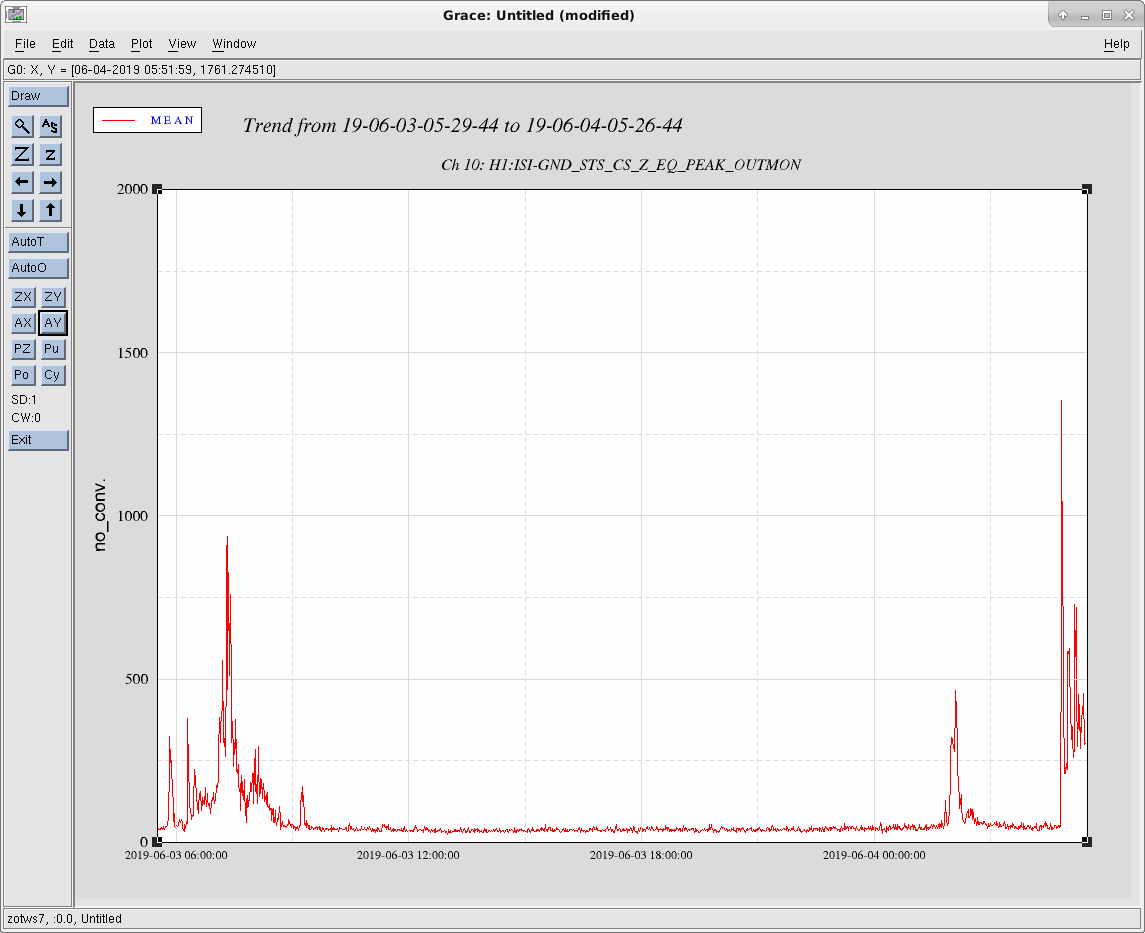
Plot attached shows H1:ISI-GND_STS_CS_Z_EQ_PEAK_OUTMON for 1 day.
I spoke with the operator (Cheryl V.) and she is looking into it.
back now.
TITLE: 06/03 Eve Shift: 23:00-07:00 UTC (16:00-00:00 PST), all times posted in UTC
STATE of H1: Observing at 111Mpc
OUTGOING OPERATOR: TJ
CURRENT ENVIRONMENT:
Wind: 16mph Gusts, 11mph 5min avg
Primary useism: 0.05 μm/s
Secondary useism: 0.08 μm/s
QUICK SUMMARY: locked, in Observe
TITLE: 06/03 Day Shift 23:00 – 00:00 (16:00-17:00), all times posted in UTC
STATE of H1: Observing
INCOMING OPERATOR: Cheryl
SHIFT SUMMARY: Uneventful 50 minutes, IFO still locked/Observing
LOG:.
23:00 (16:00) Start of shift
23:18 (16:18) Betsy to MX -- drop off 3IFO equipment
23:24 (16:24) Kyle back from MY
23:49 (16:49) Betsy back from MX
23:50 (16:50) Handing off to Cheryl
Ops Shift Transition: 06/03/2019, Day Shift 23:00 – 7:00 (16:00-00:00) - UTC (PT)
State of H1: Locked
Intent Bit: Observing
Weather: 20-25 mph wind, clear sky
Primary 0.03 – 0.1Hz: 0.01 um/s
Secondary 0.1 – 0.3Hz: 0.1 um/s
Outgoing Operator: TJ
Quick Summary: Locked for 21.5 hours, Observing for a little less. Covering the first hour of Cheryl’s shift.
About 45 minutes ago SEISMON picked up a couple earthquakes in Malayasia, some of which were reported over 6 magnitude, but I didn't get a notification. I know TJ was working on using the lines from my response plot to trigger the verbal notification, but I can't tell if that's in yet.
Gah! I used the wrong line on your graph. Fixed now. It will notify for any EQ in your green, yellow, or red areas.
Unfortunately, I cannot import your script to get the lines because the alarm handler computer does not have matplotlib installed. So if you make any changes to the lines, we will also need to change them in Verbal.
FYI: I do not believe the EQ during Cheryl's shift had a verbal (when I scroll back I don't see anything listed). And I had a smaller EQ tonight (but it was in the GREEN area) and I did not receive a verbal for that.
Laurence Datrier, Sheila Dwyer
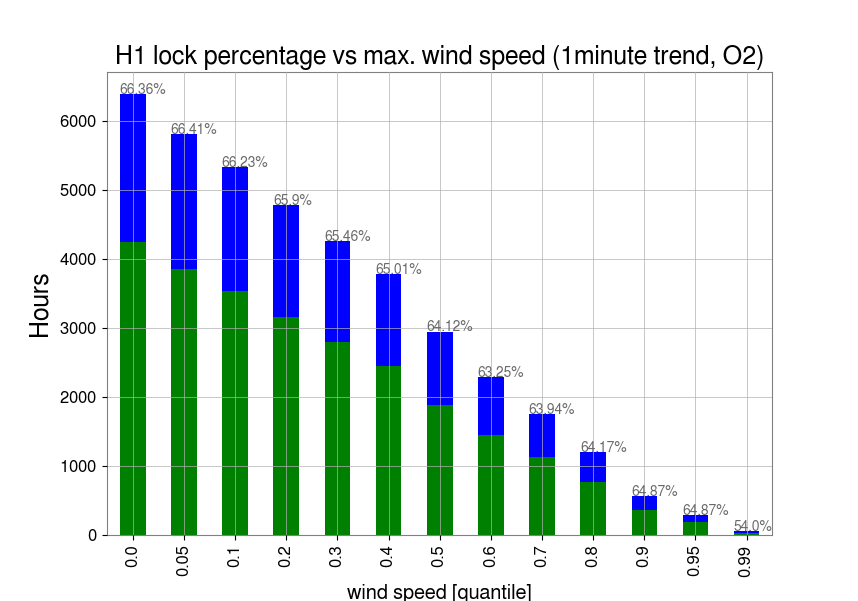
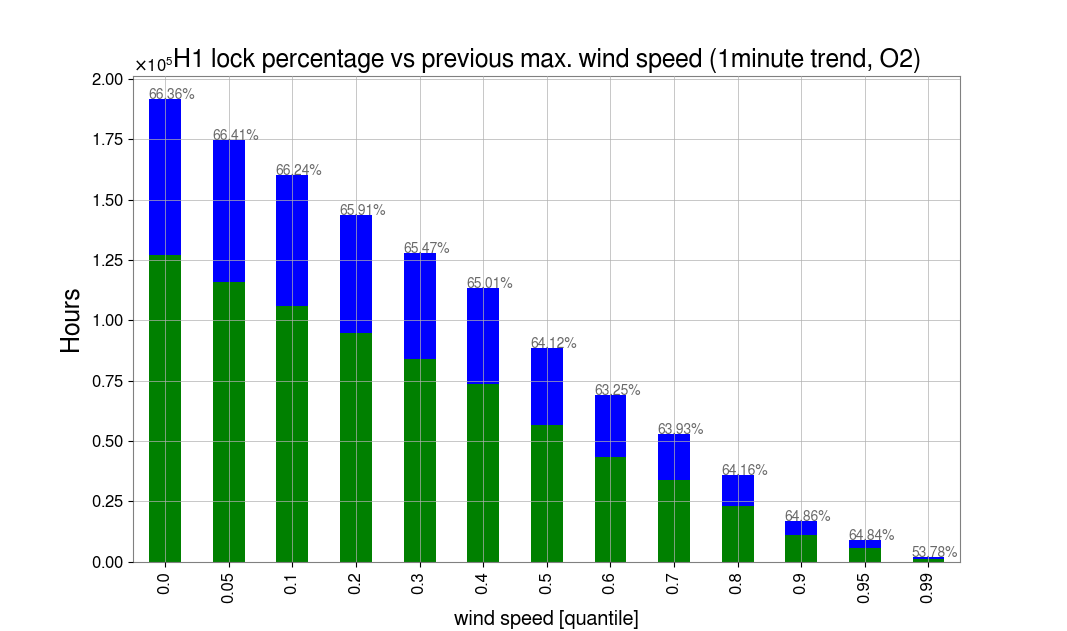
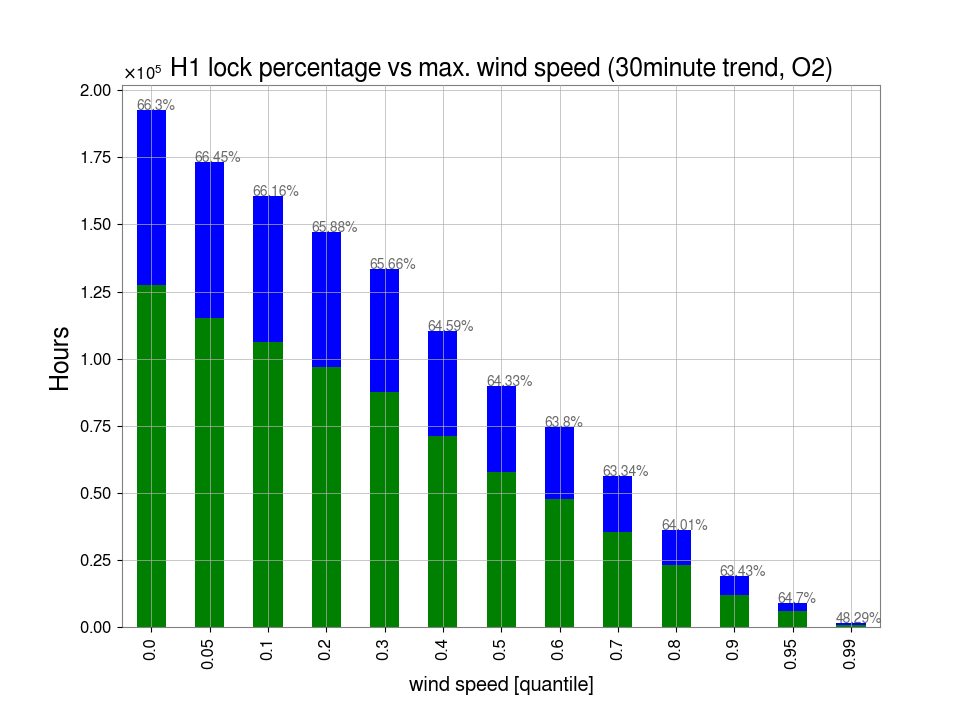
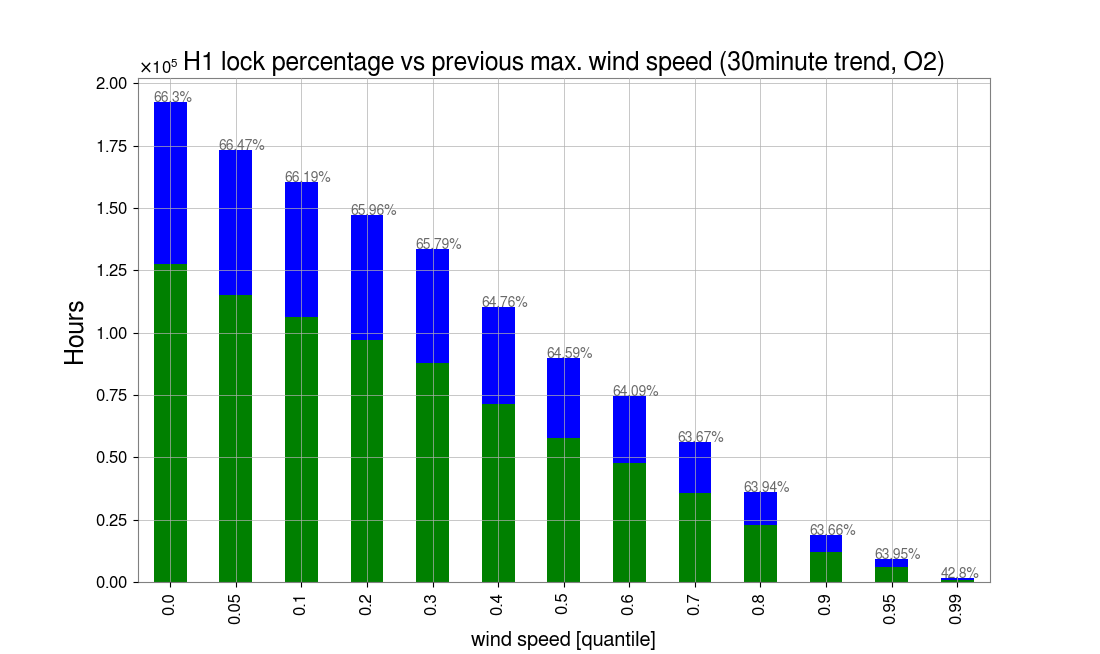
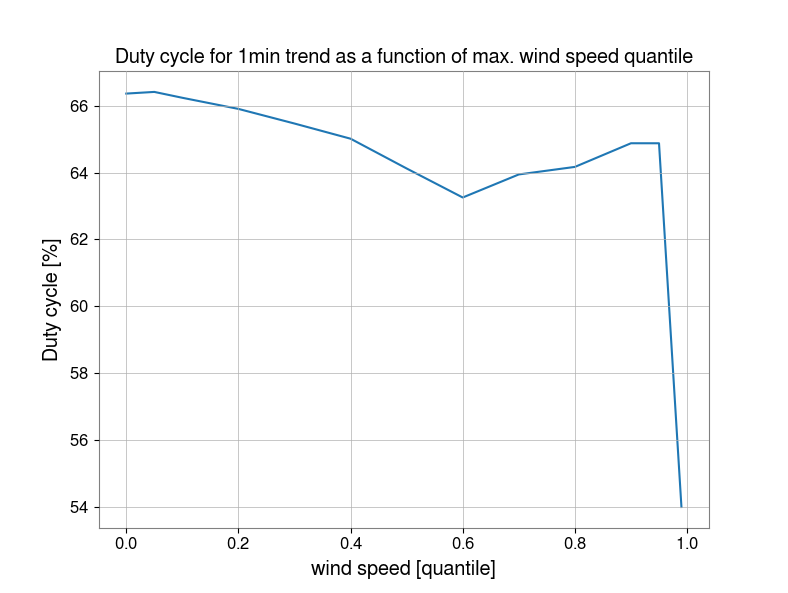
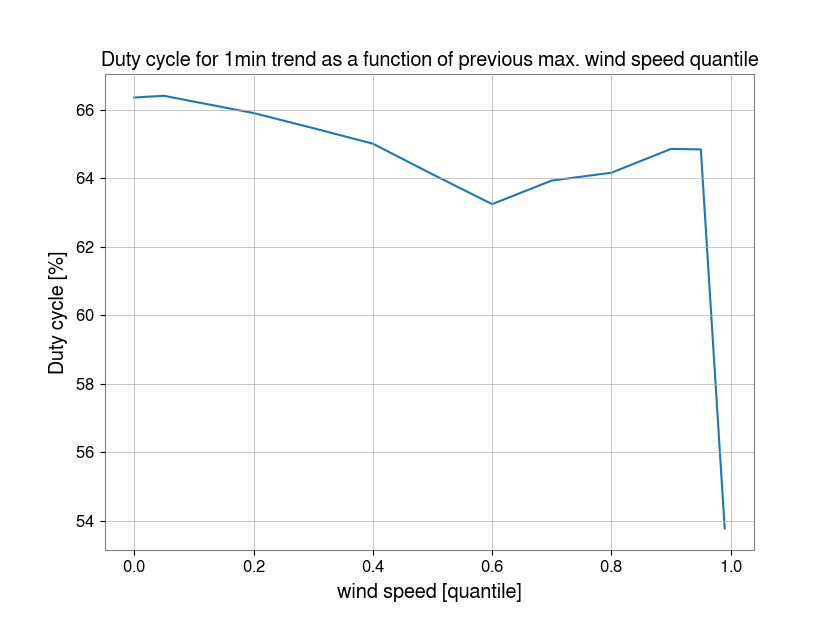
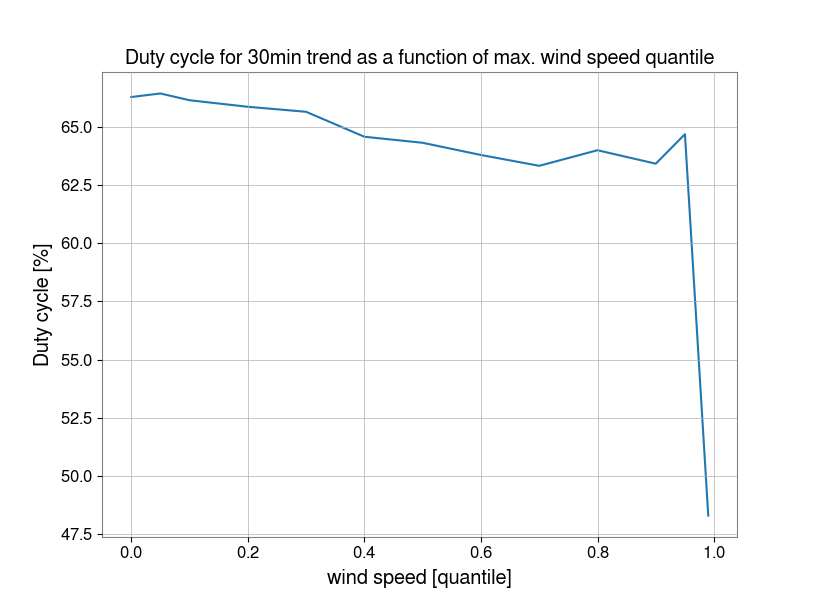
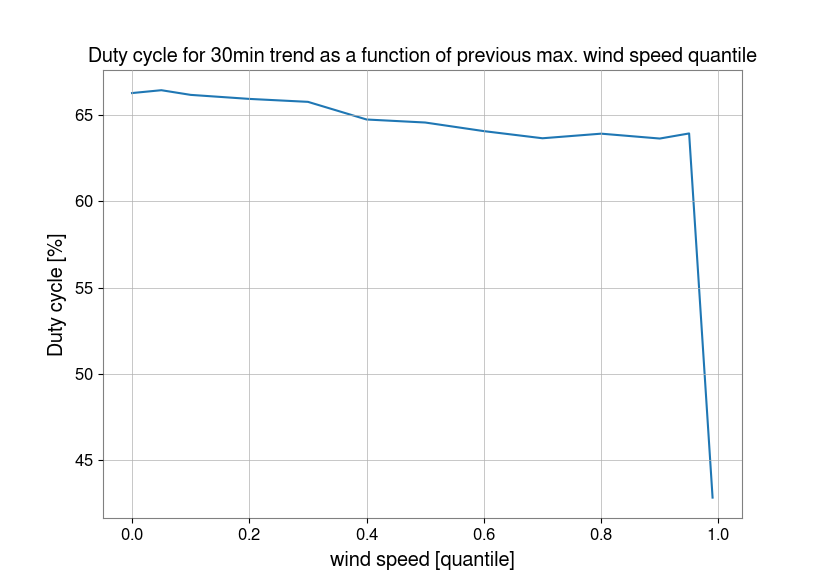
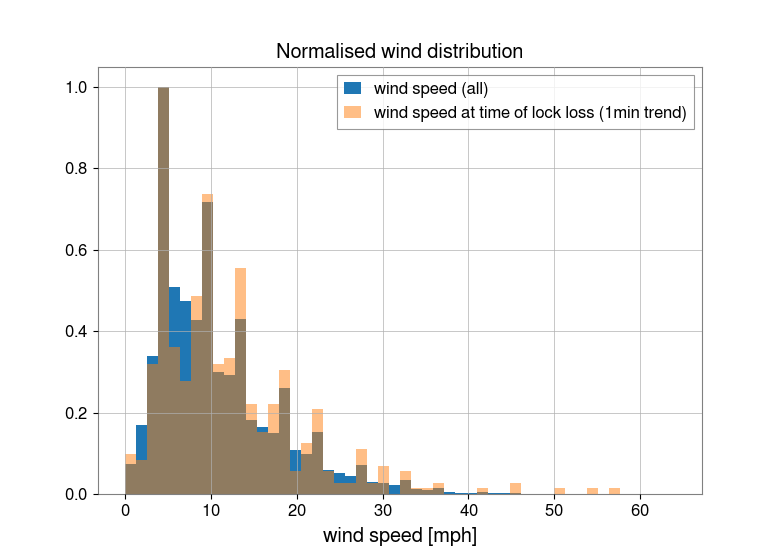
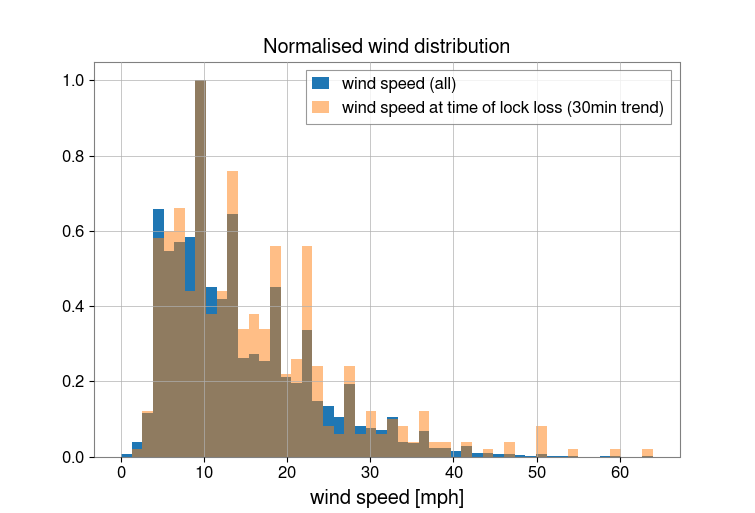
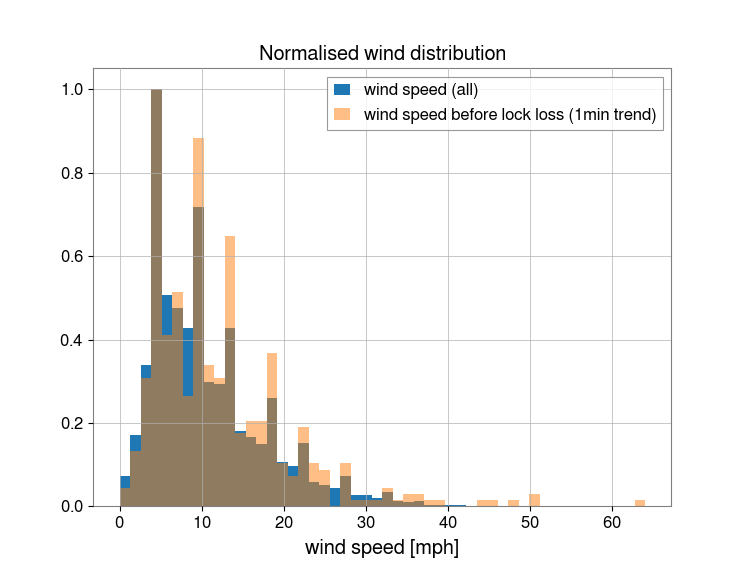
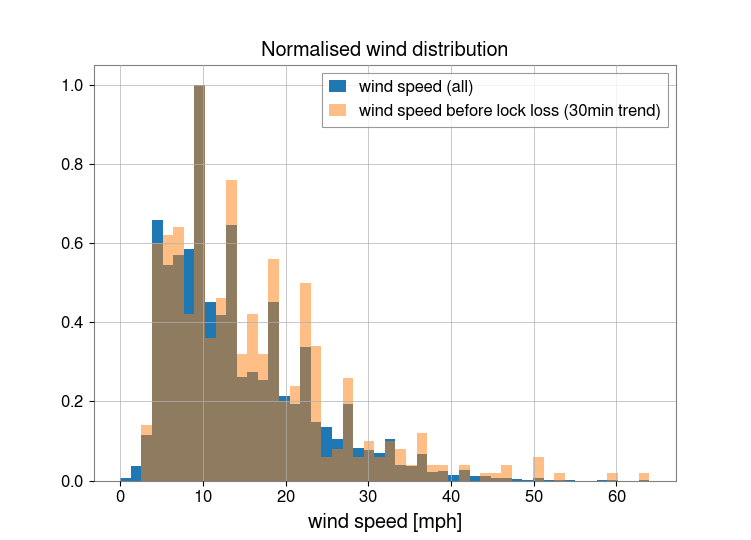
We looked at O2 data for H1 to get an estimate of down time due to wind. We used the maximum wind speed of the three max. 1min and 30min trends for the H1 EX, EY, CS wind channels, for all of O2.
The first histograms and trend line show duty cycle vs wind speed percentiles, for wind speed vs lock status and previous wind speed (max. of previous 1 or 30 min) vs lock status. Looking at the previous wind speed shows more down time due to high winds. Percentiles and wind speed values are (in mph):
| percentile | 5 | 10 | 20 | 30 | 40 | 50 | 60 | 70 | 80 | 90 | 95 | 99 |
| 1min trend wind speed [mph] | 3 | 4 | 5 | 6 | 7 | 9 | 11 | 13 | 16 | 21 | 25 | 33 |
| 30min trend wind speed [mph] | 5 | 6 | 7 | 8 | 10 | 12 | 14 | 17 | 21 | 26 | 31 | 41 |
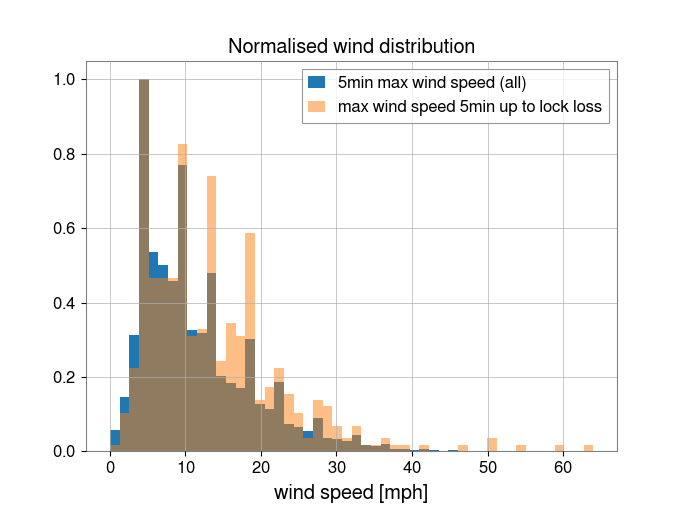
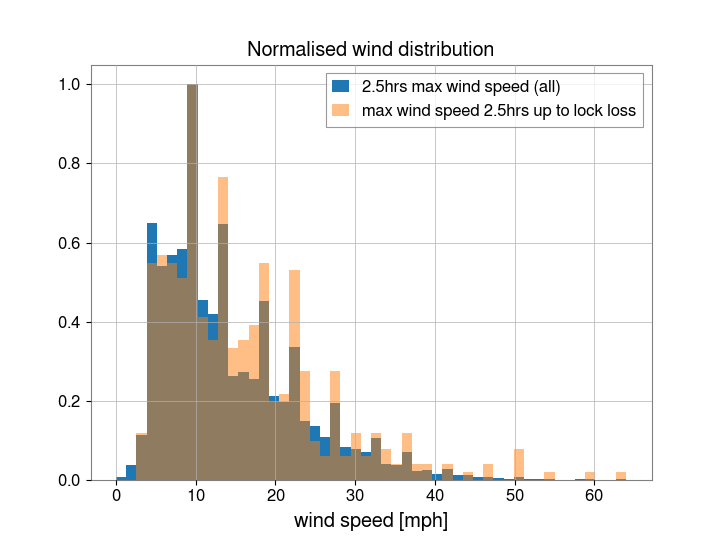
The following histograms are the normalised distributions for wind speed at:
Compared to the normalised distribution at all times (blue). A significant tail appears in the distribution for wind speed at time of lock loss for winds >~35mph.
Interesting. Is this consistent with the histogram of 8 years of wind speed data in this log:
https://alog.ligo-wa.caltech.edu/aLOG/index.php?callRep=12996
and the O2 locking vs wind speed in Figure 16 of this paper?
https://dcc.ligo.org/LIGO-P1800038
It would also be useful to calculate the correlation of BNS range with wind speed. We may be able to maintain lock at higher wind speeds than in the past, but does the range suffer?
I used the wind wind speed histogram from 8 years of data at LHO:
https://alog.ligo-wa.caltech.edu/aLOG/index.php?callRep=12996
to calculate a wind probability density function. I then convolved it with a fit (approximation) of the O2 duty cycle vs wind speed from figure 16 in:
https://dcc.ligo.org/LIGO-P1800038
If interferometer locking was completely independent of wind speed, then only a 1.6% improvement in duty cycle would result.
However the BNS & BBH range *may* decrease at higher wind speeds.
Based on the table that Laurence posted, these wind speed percentiles are fairly consistent with Margarita's 8 year histograms in 12996. Margarita finds that the hourly maximum of the wind speed is about 31.3 mph 4.8% of the time, Laurence finds that the 30 minute maximum exceeds 31 mph 5% of the time.
Note that Laurence is plotting duty cycle for all the times with wind speeds above a certain quantile, while Krishna plots duty cycle vs wind speed in P1800038 , so they aren't directly comparable. The best comparison to Figure 16 would be to Laurence's 5th attachment, which is quite similar, the duty cycle is between 60-70% for wind speeds less than ~32 mph in P1800038, and less than the 99th percentile for the minute trend in Laurence's plot, which is 33mph.
I believe that the duty cycle vs wind speed plot in Figure 16 of P1800038 is based on minute trends of the wind speed, although I'm not completely certain of that. If it is based on minute trends, it makes most sense to convolve the wind speed vs duty cycle plot from P1800038 with a wind speed distribution based on the first line in Laurence's table, based on minute trends. (Or, to use wind speed vs duty cycle based on hour maximum instead).
The detailed O2 time accounting for H1 states that the interferometer was only down for wind 0.3% of the time:
https://ldas-jobs.ligo.caltech.edu/~detchar/summary/1164556817-1187733618/time_accounting/lho/
As Daniel point outs, wind might be responsible for some fraction of the time spent trying to re-lock.
Curiously the O2 accounting for L1 states that wind caused 2.7% downtime:
https://ldas-jobs.ligo.caltech.edu/~detchar/summary/1164556817-1187733618/time_accounting/llo/
I think it would be useful to run this again for O3 so far. A quick look indicates that the detector is rather more sensitive to wind now than at the end of O2. I went poking though the DetChar pages looking for impact of high wind - and one can see that for speeds of ~10 meters/sec one can often see dips in the range, and when the speed passes that LHO often looses lock. I counted up 15 days in the first 2 months where there seemed to be a clear correlation-by-eye between (wind vs. range) or (wind vs. operation). I expect there are many reasons why the detector is more sensitive, and hopefully we can get back to the sort of robustness that was achieved at the end of O2, but I think that, were there a wind break in place now, things would be easier to run.
I've posted an alog for the same analysis for O3, along with a look at the BNS range as a function of wind speed.
Measurement technique: - Using DTT, grab amplitude spectral densities of individual OSEMs on M2 and M3 stages (or only M2, or including Optical Levers, depending on which sensors the suspension has), e.g. H1:SUS-${OPTIC}_${M2/M3}_OSEMINF_${OSEMDOF}_OUT_DQ H1:SUS-${OPTIC}_M3_OPLEV_${PIT/YAW}_OUT_DQ - It is good practice and helpful to also grab an ASD of the excitation channel used below, treat it as an "A" channel, and plot the coherence as well. While exploring for the given mode, use 5 exponential (aka "running") averages, with a 0.05 Hz frequency resolution. Once you've found the mode, increase the resolution to 0.01 or 0.005 Hz resolution, and measure for 5+ averages, depending on your patience and/or the amount of time you have. - Using the COIL DRIVER Binary IO, switch the coil driver state to the highest possible range (State 2 -- ACQ ON, LP OFF for all of the above mentioned suspensions, and if need be, use the "secret" functionality to request State -2, and switch off all COILOUTF compensation filters). - Using AWGGUI, excite an individual OSEM coil on the M2 stage, using a band-limited uniform noise excitation, where the frequency limits of the bands are ~1-2 Hz wide, centered around the expected frequency. We used a 4th order elliptic band-pass, with 1 dB ripple. One can typically drive amplitudes of 5e6 counts without saturating the DAC. Channels are of the form H1:SUS-${OPTIC}_M2_COILOUTF_${OSEMDOF}_EXC. - Use the cursor in the DTT ASD template to find the resonant feature that results from your excitation. The above data was gathered at a 0.01 or 0.005 frequency resolution, so one should tried the numbers as though they have an uncertainty of f_res +/- 0.01Hz. An example template is shown in the attachment (i.e. during the measurement of PR3's V3 mode), but all templates have been saved to: /ligo/svncommon/SusSVN/sus/trunk/${SUSTYPE}/H1/${OPTIC}/SAGM2/Data/YYYY-MM-DD_H1SUS${OPTIC}_M2*Search.xml Note -- the only suspension mode for which we don't have an answer is H1 SUS MC3's Highest Roll Mode (R3). We tried several different excitations in order to find it, but turned up unsuccessful everytime: - Driving an M2 coil as described above (we tried UR), with band-limited uniform noise, - Driving all M2 coils in PITCH (via the M2_DRIVEALIGN_P2P_EXC channel), with band-limited uniform noise, - Driving all M2 coils in PITCH, with a swept sine excitation, and dense frequency vector between 39 and 42 Hz. We tried the above both in the standard State 2 acquire filtering and also in the secret State -2 and the compensation filters off.