
patrick.thomas@LIGO.ORG - posted 20:01, Friday 26 April 2019 (48800)
Ops Eve Mid Shift Status
Have remained in observing. No issues.
Have remained in observing. No issues.
00:25 UTC Robert still running an injection.

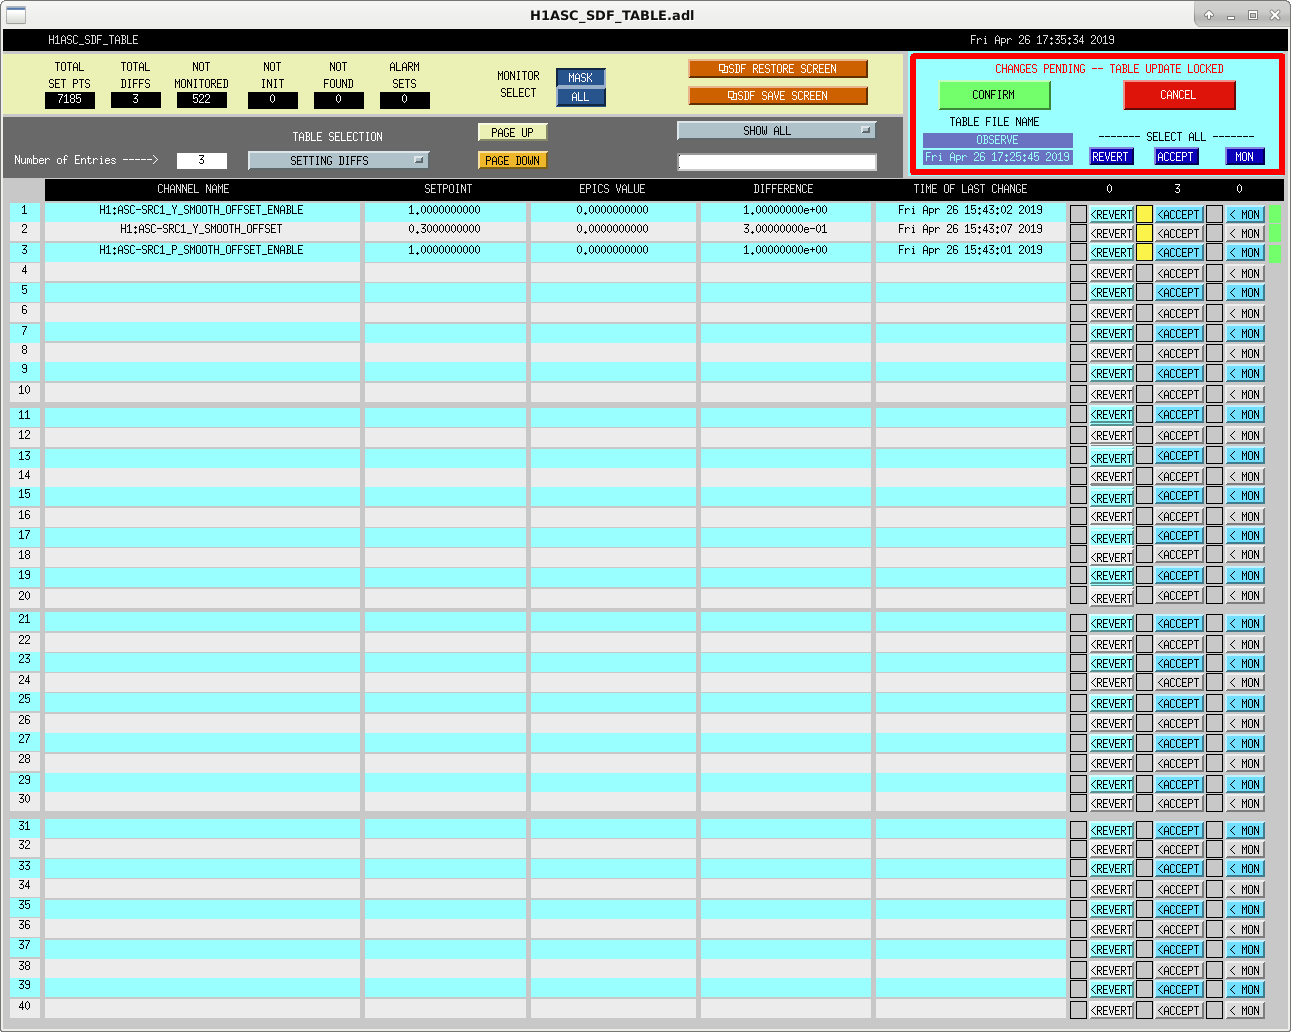
Accepted attached SDF differences created by Georgia.
00:40 UTC Observing
TITLE: 04/26 Day Shift: 15:00-23:00 UTC (08:00-16:00 PST), all times posted in UTC
STATE of H1: Lock Acquisition
INCOMING OPERATOR: Patrick
SHIFT SUMMARY: a couple lock losses, relocking now
LOG:
TITLE: 04/26 Eve Shift: 23:00-07:00 UTC (16:00-00:00 PST), all times posted in UTC
STATE of H1: Lock Acquisition
OUTGOING OPERATOR: Cheryl
CURRENT ENVIRONMENT:
    Wind: 24mph Gusts, 19mph 5min avg
    Primary useism: 0.09 μm/s
    Secondary useism: 0.12 μm/s
QUICK SUMMARY:

Reacquiring lock.
Following up on alog 48717 that shows that the projected frequency noise in DARM is limited by the IMC shot and dark noise above 2-3 kHz.
| 1.85W | 35W | |
|---|---|---|
| in lock | 0.08 mW | 1.4 mW |
| out of lock | 4 mW | ~75 mW |
The modulation index is 12.5 mrad for the 24 MHz phase modulation according to alog 41889.
If we install a shutter for protection, we should be able to increase the power on the IMC REFL photodetector by up to 10. On the other hand, we can increase the modulation index by 16 before we are doubling the reflected power during lock. However, the later is hampered by the fact that the 24 and 45 MHz modulation share the same electrode on the EOM. The 24 MHz is off resonance and we are already driving it pretty hard.
I have taken fresh LSC feedforward measurements, after the IFO had been at 35W for about 2 hours, and the SR3 heater had been at 4W for at least 2.5 hours. This used about 30 min of commissioning time.
Note to self for the future: All of the FF_to_DARM templates should give identical results, since the feedforward signals go through the same path to DARM (via differential ETM output matrix elements), so make sure that the frequencies that have coherence are good enough in one template for all 3 LSCs, then we only have to take one version of this measurement, rather than the 3 I took today.
Since we haven't had a PRCL FF measurement before, I copied templates from MICH and SRCL FF, and then used the PRCL excitations from Sheila's noise buget folder. I also set the PRCL FF elements of the LSC output matrix to match the MICH and SRCL values of ETMX=+1, ETMY=-1. I'll try to find a moment to fix the screen, but the FF output matrix screen doesn't display the PRCL column of the matrix, so these are currently hidden.
Data is saved in the usual place: /opt/rtcds/userapps/release/lsc/h1/scripts/feedforward/ , and it's all checked into the svn. I did update the references in all of the templates, since I can't remember how old they are, but they're pretty old.
I spent some time figuring out the ipython notebooks for MICH and SRCL feedforward fitting, then reorganized them, removed a lot of unused code, and added a bunch of comments, so that hopefully it is a little more user friendly.
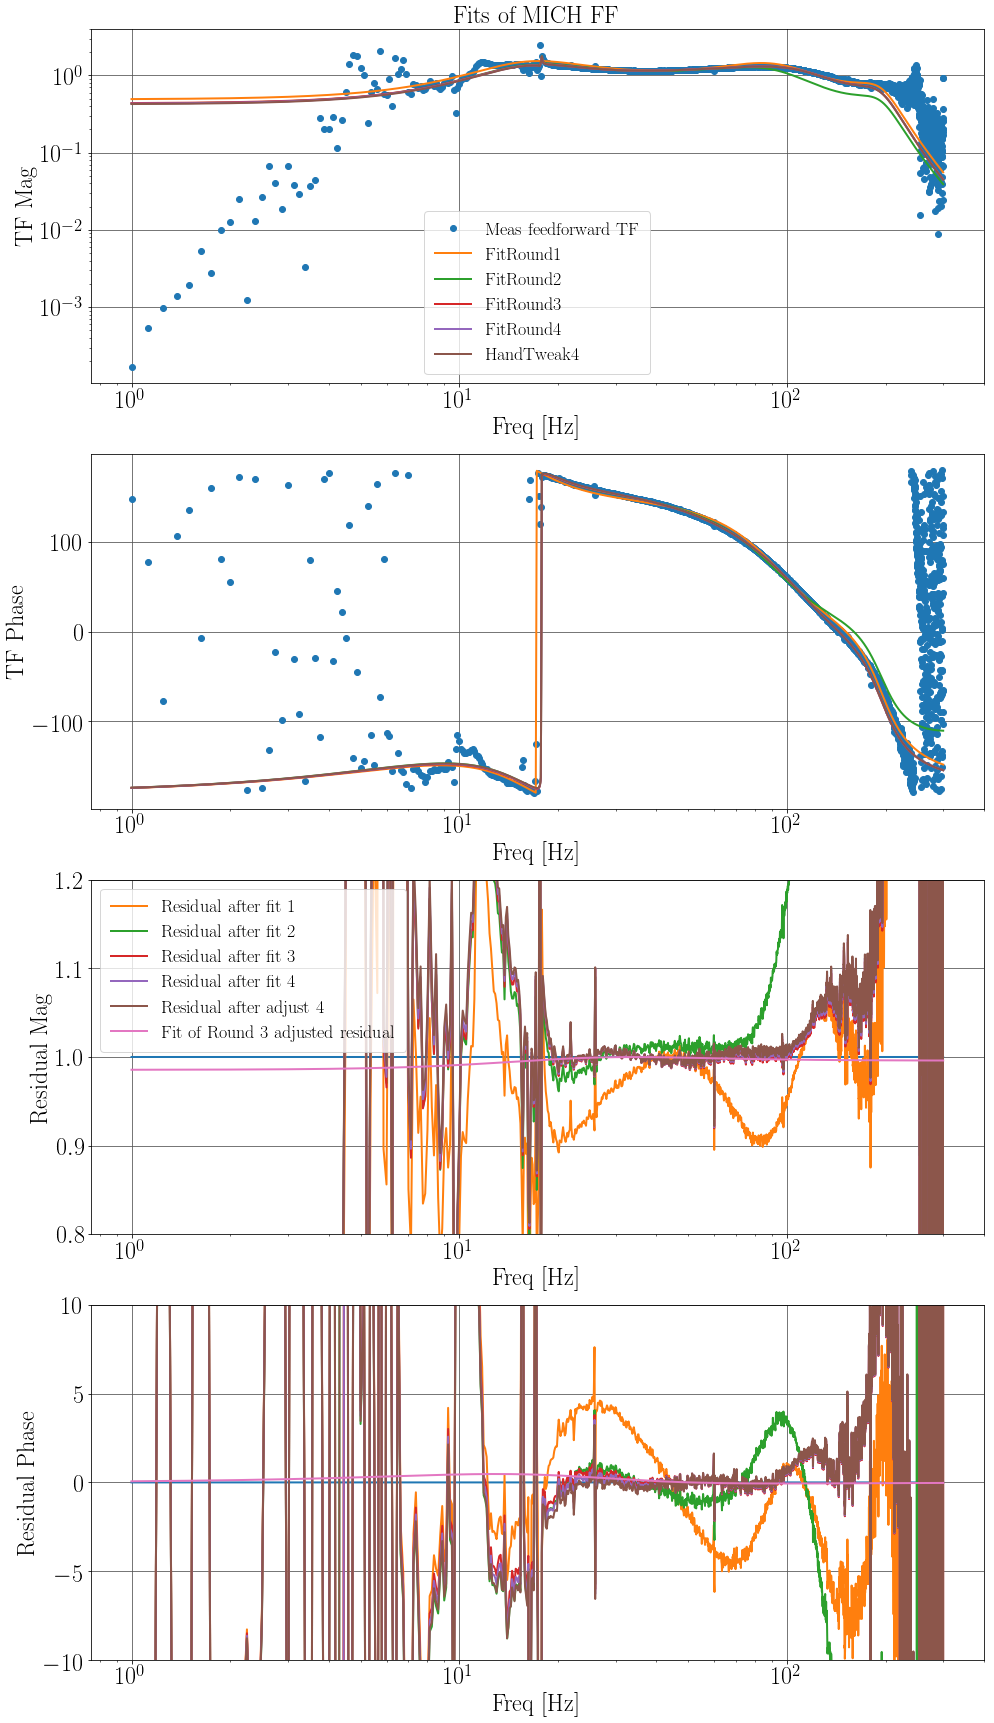
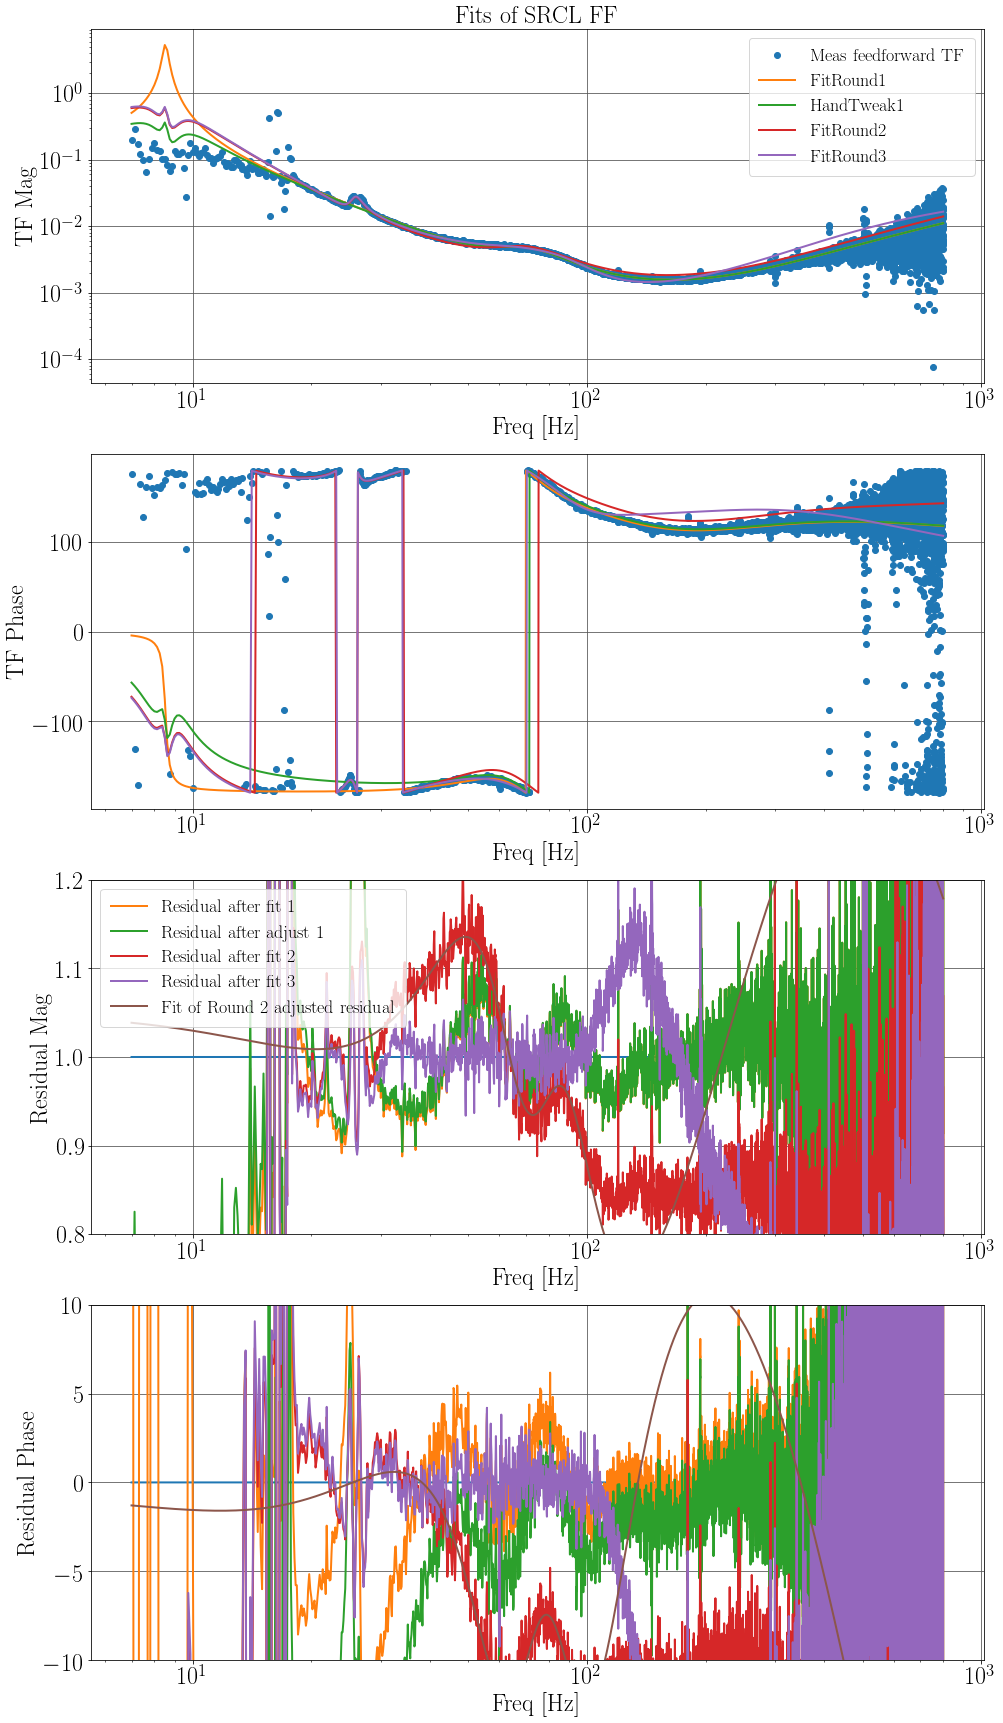
One of the big changes I made was iterating on the fits. I let iirrational run and get a good fit, then I apply that filter to the measured feedforward transfer function, and redo the fitting. I repeat this several times until the residual between the measured TF and the fit is very nearly unity in the band that we care about. Note that, as Danny and others had found, I do have to fiddle with the frequencies, coherence threshold, and fit order for each of my rounds of fitting, so this is not yet an automated process. Perhaps this is something that we can ask the CSWG to look into making more automated by iterating over different fitting parameters and then keeping the one with the lowest residual.
The first two attached figures are the results of my fits for MICH and SRCL. The blue dots are the measured feedforward transfer functions, and the colors are the fitted filters or residuals after different rounds of fitting. Orange is after the first fit, then green, red, purple, and brown. For MICH I am using the brown result, and for SRCL am using the purple.
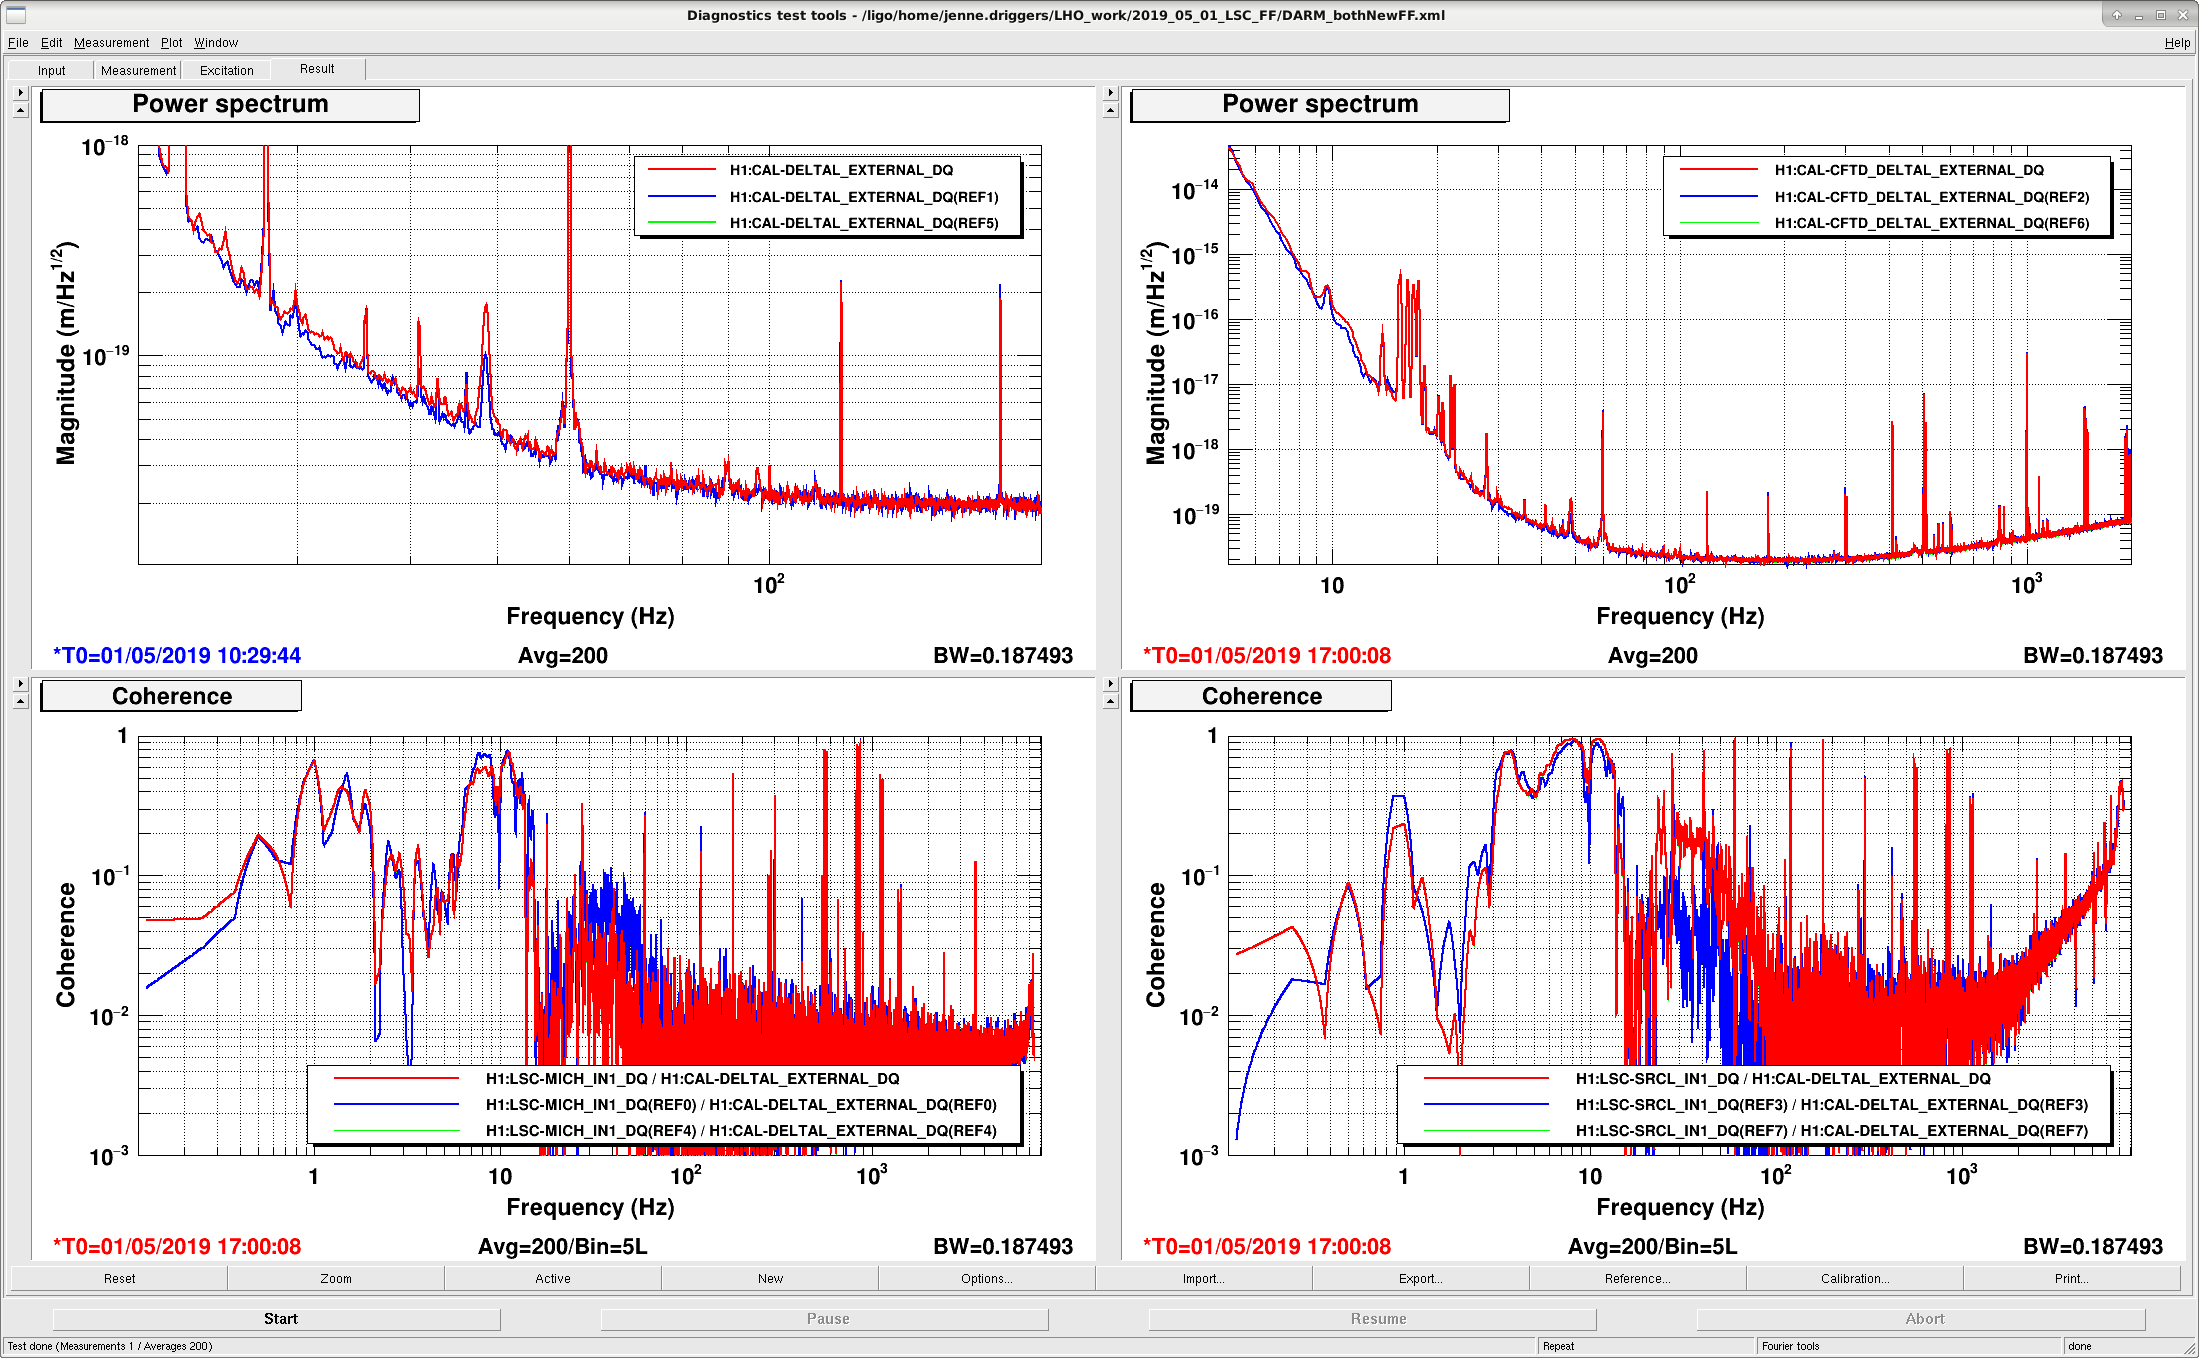
Unfortunately, these didn't seem to help a whole lot. The third figure is DARM and coherence of DARM with MICH and SRCL with blue being earlier in the lock and red after I changed both MICH and SRCL to the new filters. I do wonder a bit if part of the reason that it doesn't look so great in these long averages is that the ASC is oscillating and the IFO is moving around with a ~2 minute period. For just a few averages, it seems like there is a bit of an improvement in DARM around 30 Hz, but it goes away after a few averages.
Wednesday 17apr2019 - Friday 19apr2019: No Restarts
Saturday 20apr2019:
Crash of h1susauxh2 front end computer
Sunday 21apr2019 - Monday 22apr2019: No Restarts
Tuesday 23apr2019:
Tuesday Maintenance. Beckhoff CS and EY upgrades. h1edc channel reconfiguration. Associated DAQ restart. Unexpected restart of SDF for ecatc1plc4.
There were limiters on the ASC DC centering loops, in the ASC filter banks. (The integrators for these loops are in the suspensions). Jenne and I can't think of a reason why we would be using limiters there, so we have turned them off and accepted this in SDF. It looks like the guardian should not be turning them back on.
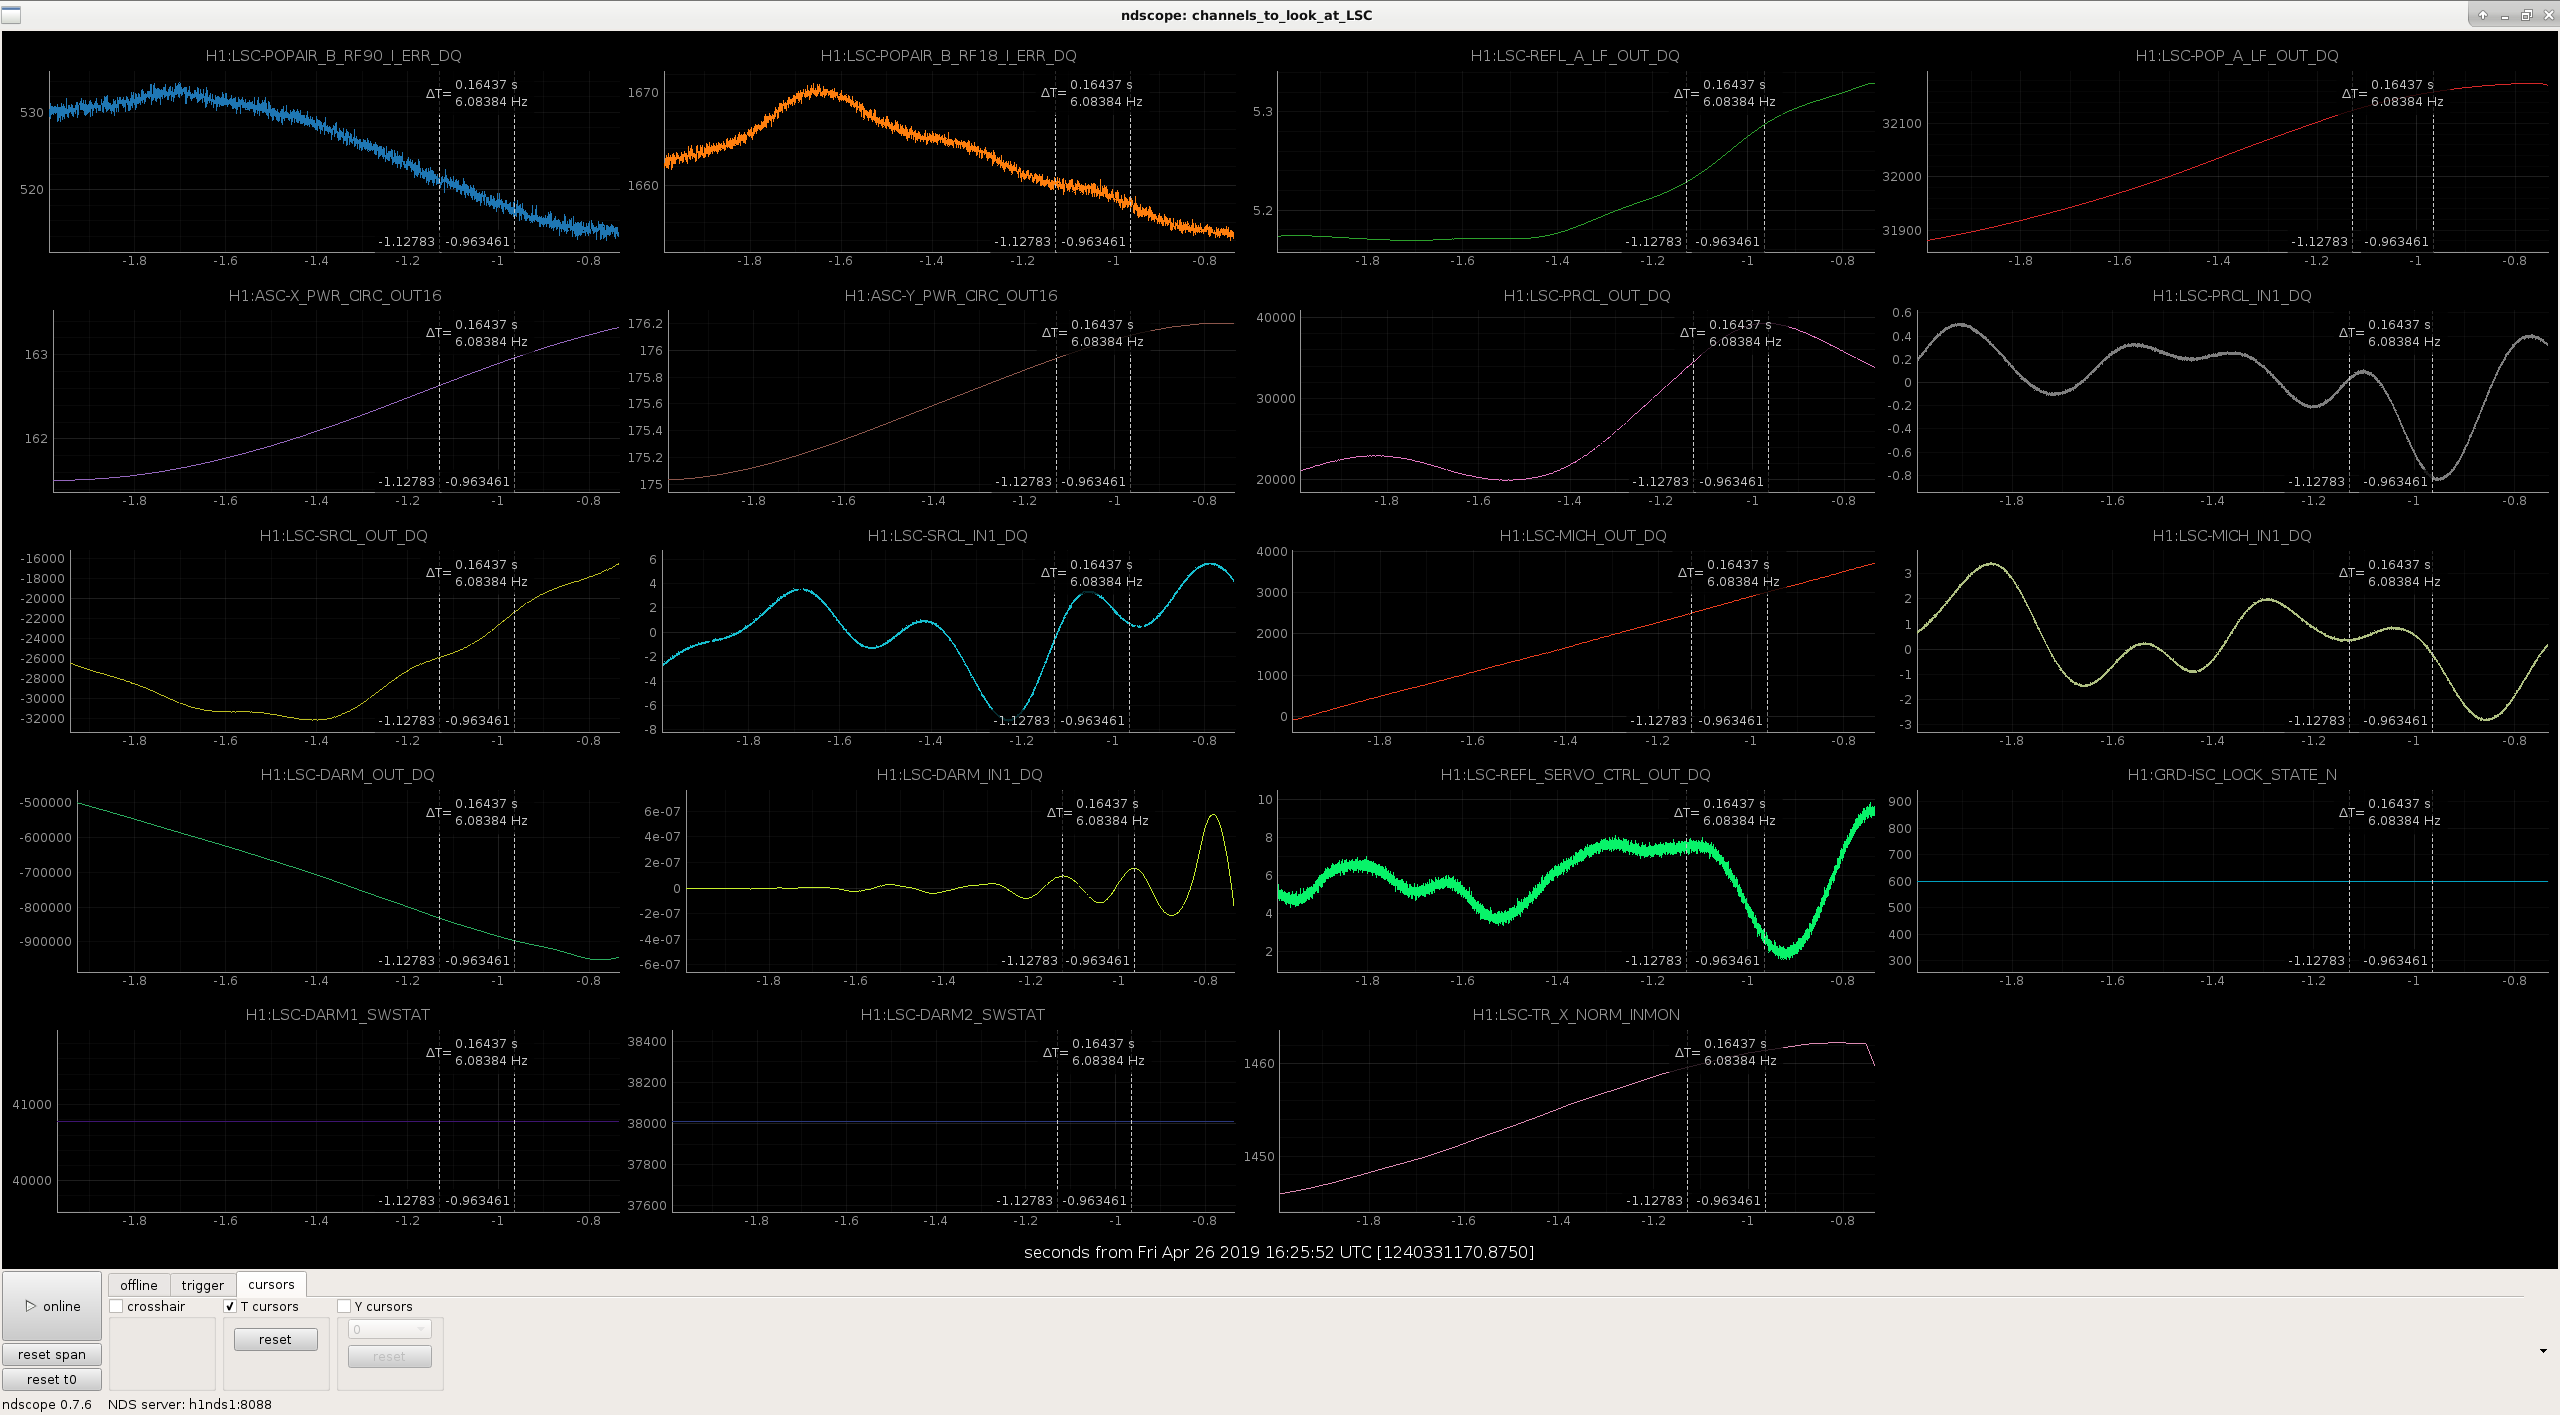
This most recent lockloss 1240331170 is similar to a couple of others we have had in the last few weeks when it is windy. This kind of lockloss is one of our motivations for working on the length/angle decoupling that Jenne has been modeling and we made some measurements for yesterday afternoon. 48767
You can see on the web lockloss tool that we saturated the PUM of ETMX with low frequency drive (around 0.1 Hz).
Looking at the attached screenshot, you can see that in the last seconds of the lock there is a ring up in DARM at around 6.1 Hz, about 8 seconds before the lockloss there was a similar signal in DARM at around 5 Hz that rang down. It seems like these faster oscillations also happen in CHARD, and they are happening when the PUM is saturating.
Since this is a pattern that we have seen a couple of times (winds elevated, ETMX saturated with pringle drive), this would be a good type of lockloss to try to identify automatically.
[Sheila, Jenne]
We have turned on the SR3 cage servo (after updating the setpoint in its guardian code), and then set the SR3 disc heater to 4W (from its previous nominal of 5W) per the recommendation from the alog thread starting with alog 48406.
Turned the SR3 cage servo off at 00:49 UTC.
<b>TITLE:</b> 04/26 Day Shift: 15:00-23:00 UTC (08:00-16:00 PST), all times posted in UTC
<b>STATE of H1:</b> Observing at 103Mpc
<b>OUTGOING OPERATOR:</b> Jeff
<b>CURRENT ENVIRONMENT:</b>
Wind: 24mph Gusts, 21mph 5min avg
Primary useism: 0.08 μm/s
Secondary useism: 0.12 μm/s
<b>QUICK SUMMARY:</b> Locked for over 20 hours
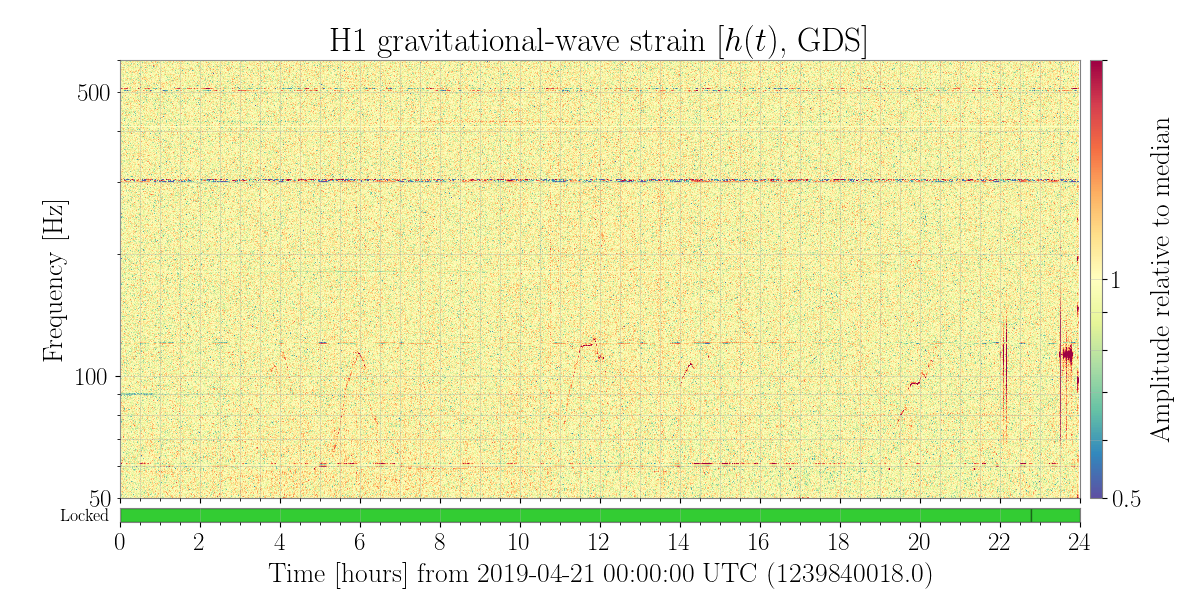
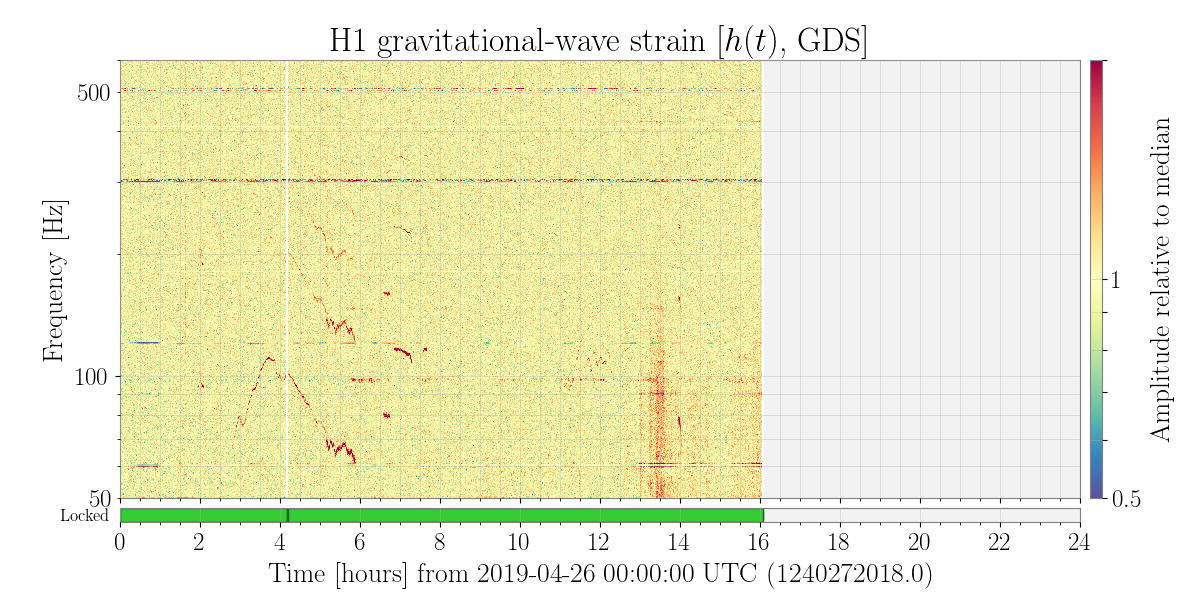
A slowly wandering line in h(t) on April 21 between 60 and 120 Hz appears to come from the squeezer.

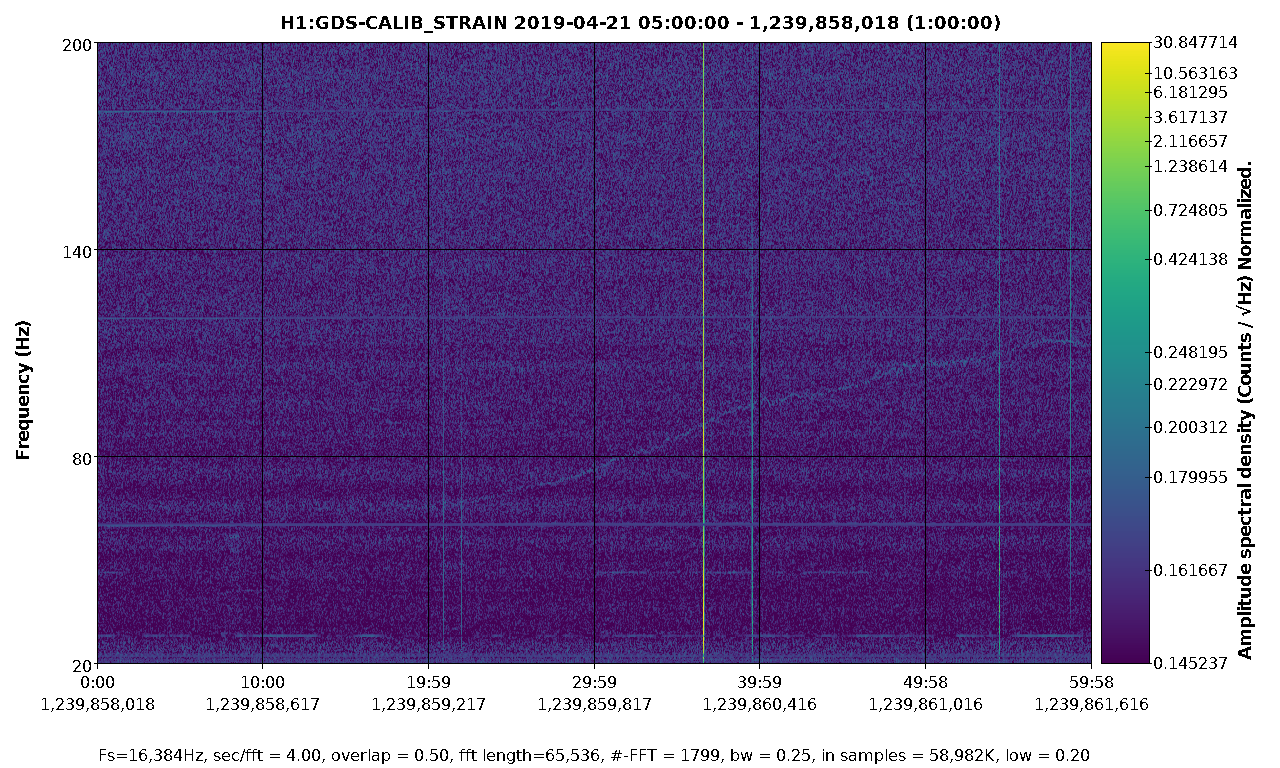
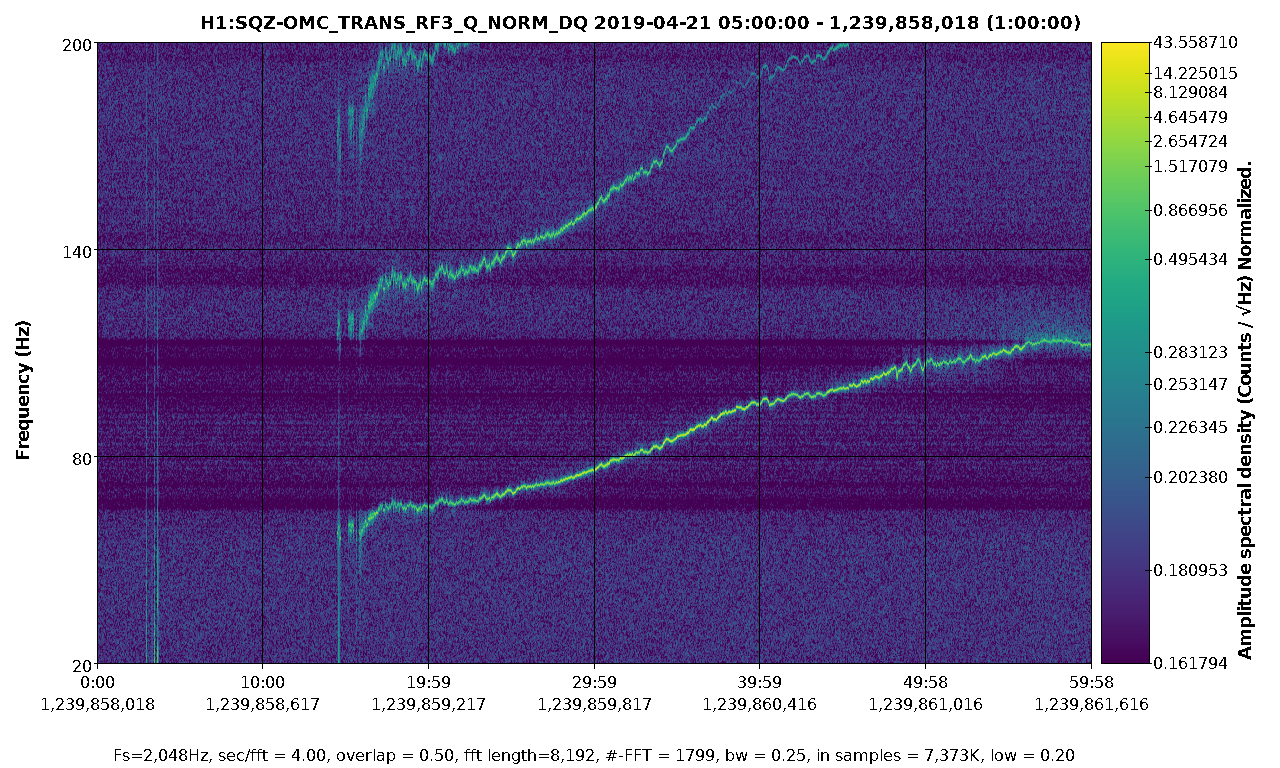
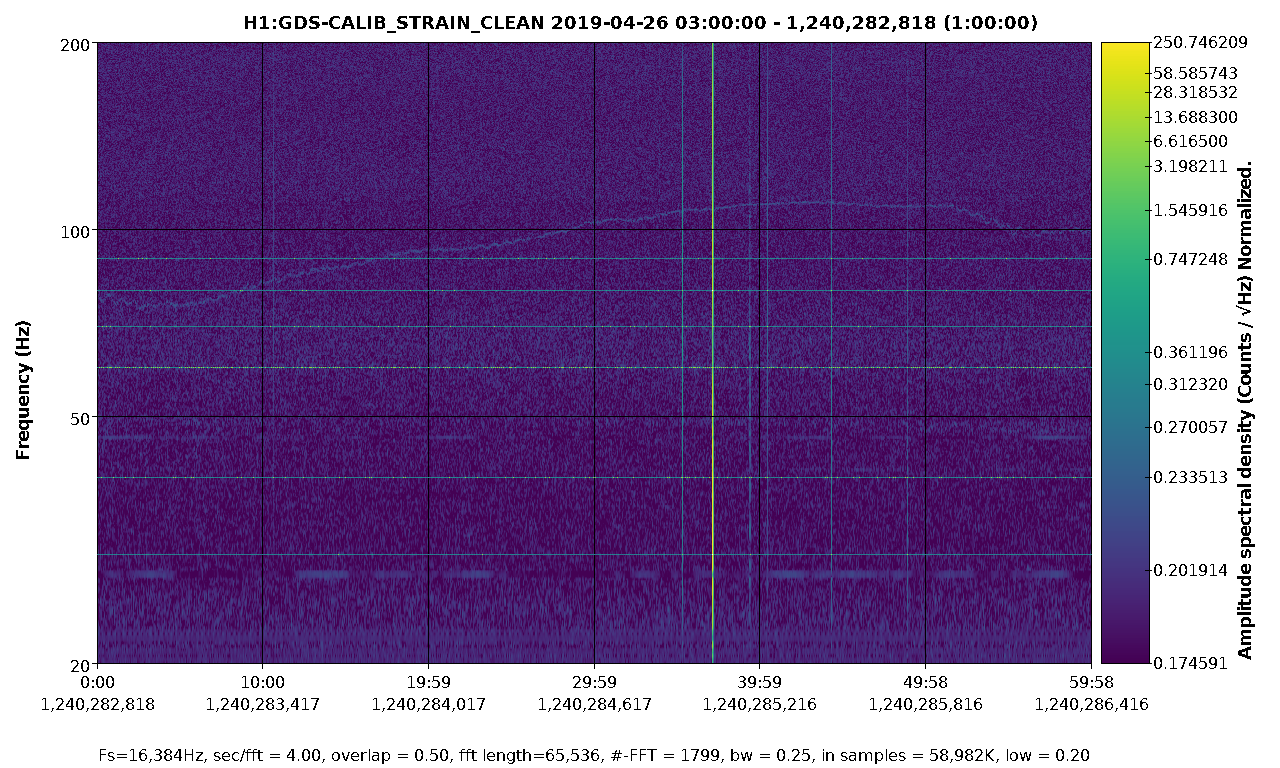
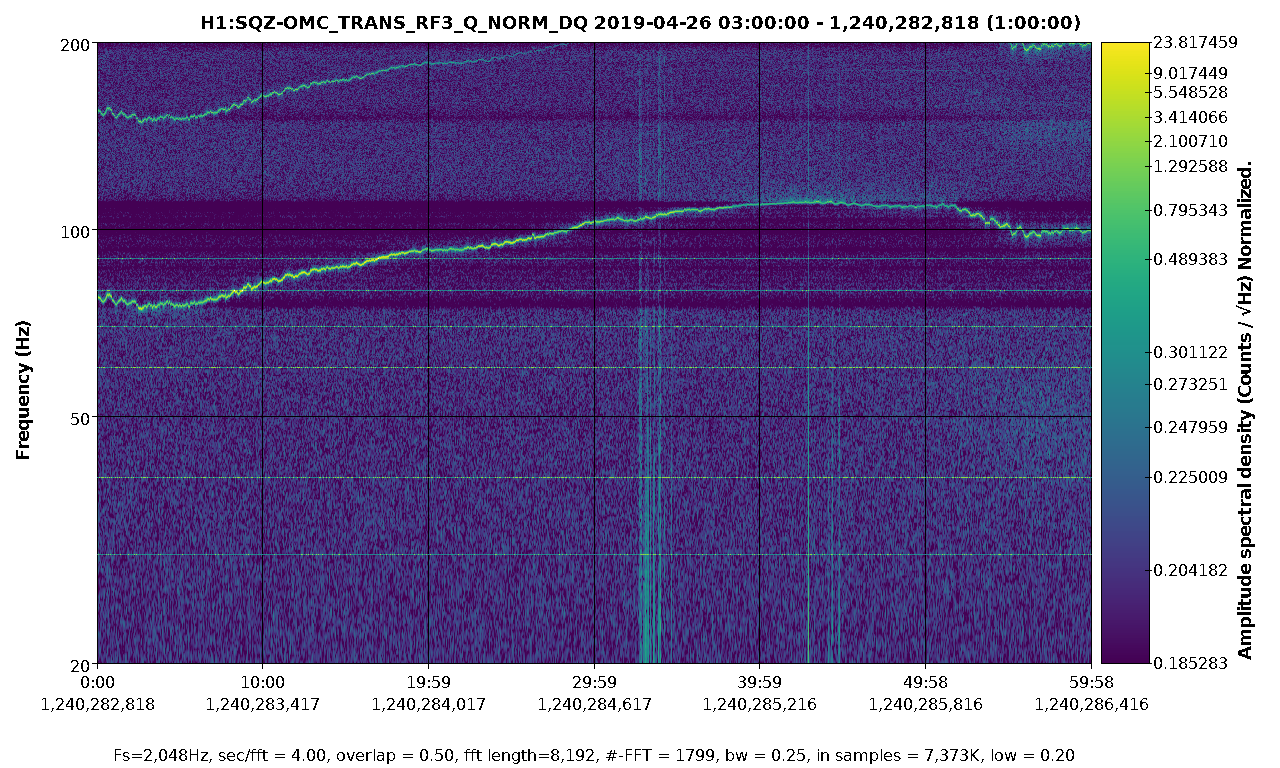
The line was noticed in Edgard Bonilla's DQ shift (wiki link). It appears on at least two other days. It's subtle and hard to notice, but a spectrogram of the bucket captures it (first attachment). Zooming in on an hour, we can match h(t) up with some of the squeezer channels. The second attachment is an hour of h(t). The third is a squeezer channel where this line, and others, are very bright. The highest of the lines also just barely appears in h(t).

I don't think this is pickup from DARM because the lines are much more prominent in the squeezer. We haven't yet tried to track where in the squeezer these might originate; I wanted to just quickly document that this is happening.
Did you get a chance to check the accelerometers on the tables (ISCT6 and SQZT6 - sensor maps at PEM.LIGO.ORG)?
The wandering squeezer line seems stronger today (26 April) (see Fig. 1). The next two images are the same as Andy's above but for today. Note how strong the lines are in the SQZ channel. The final two figures are the accelerometers suggested by Robert.
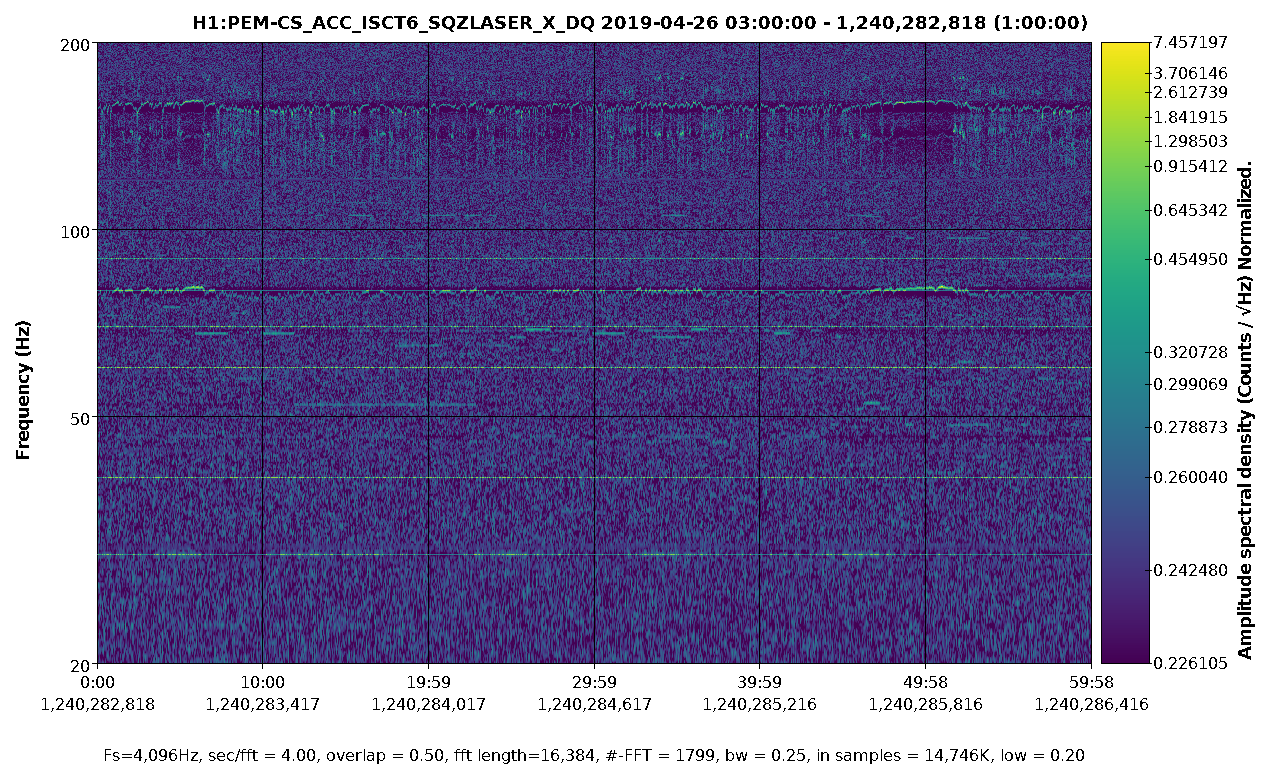
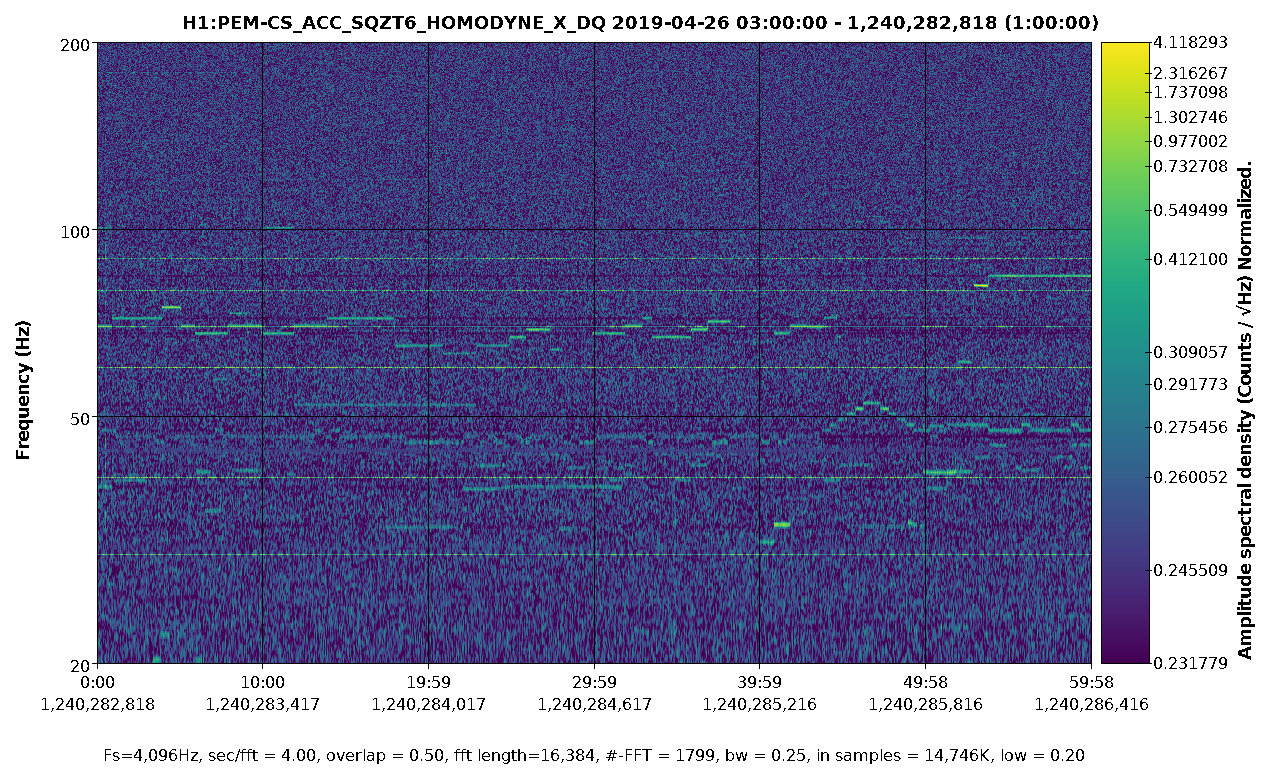
I don't see anything in the squeezer or ISCT6 accelerometer over the time in these plots.
Strong wandering lines seen today (29th April) too. They stay in DARM for intervals of ~30 - 60 min. I see the same trends as described before - the wandering line appears in H1:SQZ-OMC_TRANS_RF3_Q_NORM, but not in any of the accelerometer channels. I attach a pdf with some spectrograms.
0:55 H1 Bumped OUT of Observing.
This was found to be due to an "unlocked TCS_ITMy_CO2 laser". Looking at NDScope (see attached screenshot), the laser power took a jump up from ~50.16W and the TCS_ITMY_CO2 guardian node spent a few minutes at the FIND_LOCK_POINT adjusting an offset (see attached pdf of log file). Eventually the guardian returned to its nominal state, of LASER_UP (at 1:01utc). It had a "new pzt setpoint of 50.536W".
At this point, it looked like everything was good to go to Observing, so at 1:06utc, I returned H1 to Observing.
Summary: TCS ITMy CO2 laser was unlocked for a few minutes & Guardian restored laser. However, laser power changed from 50.16W to 50.536W. I have not seen this before.
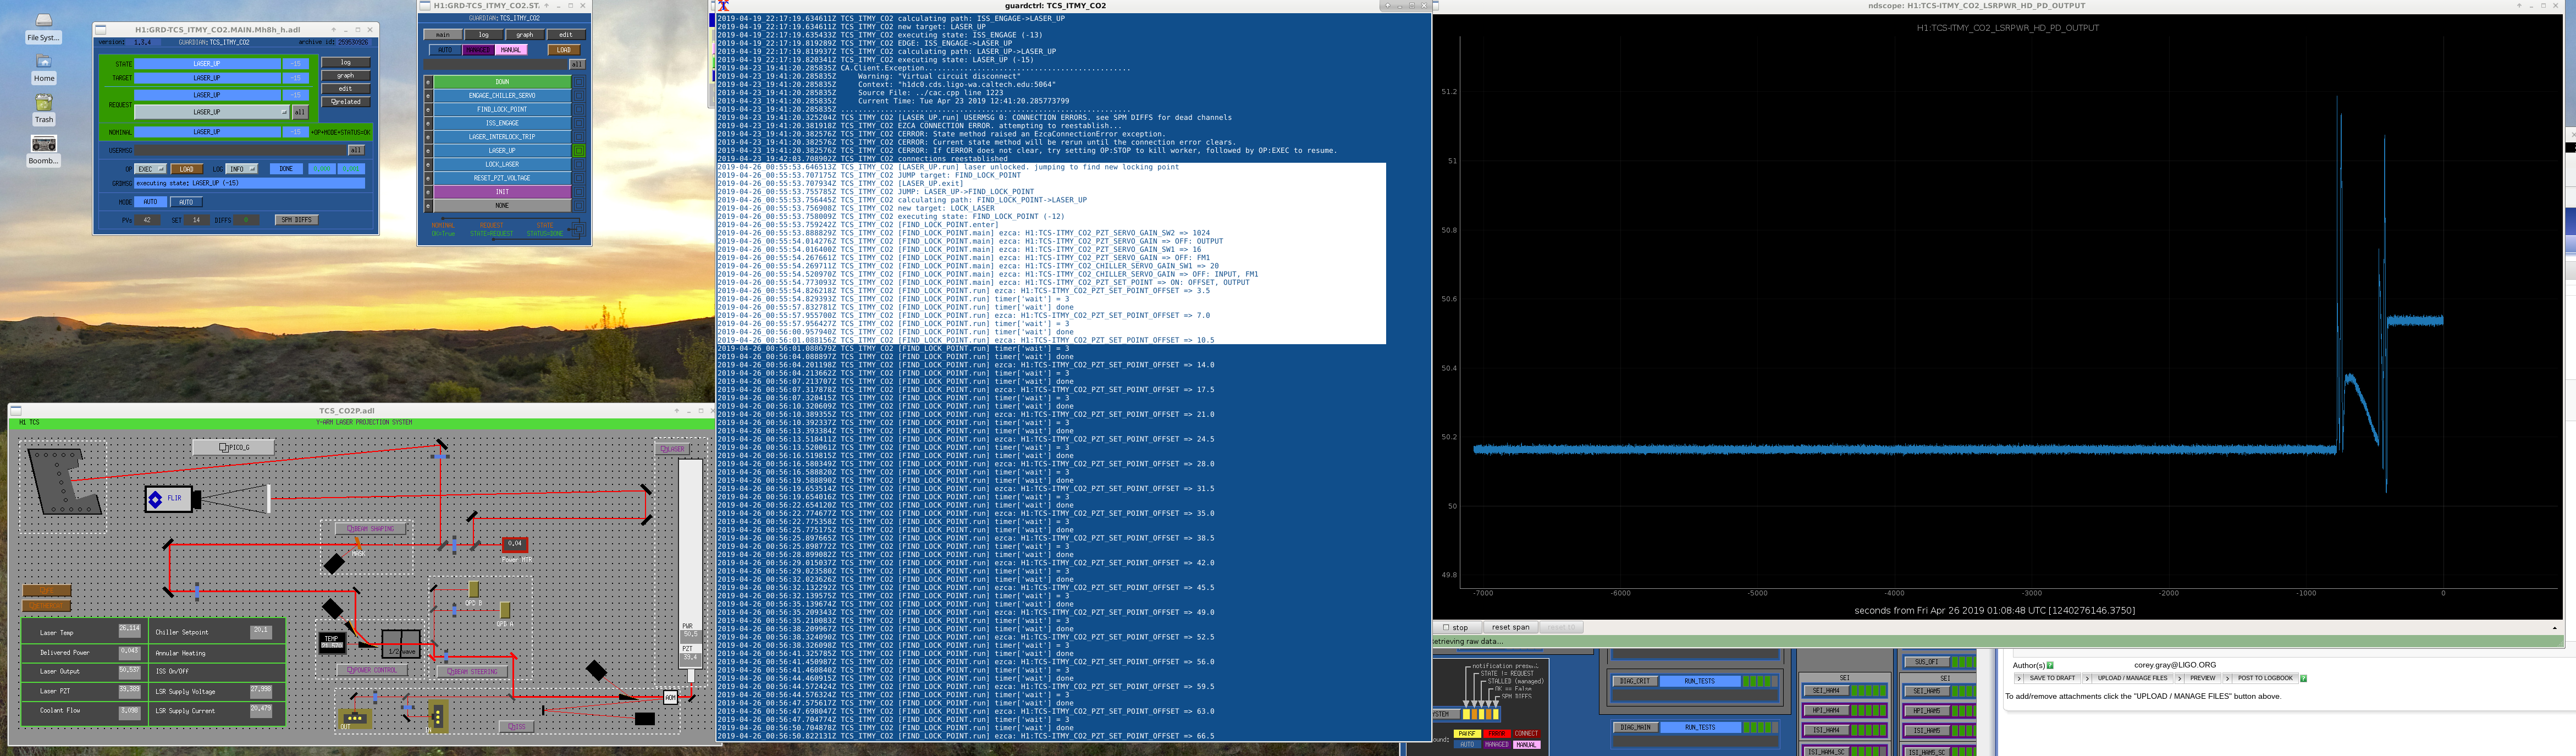
This is normal. When the CO2 laser goes to reacquire lock, it will scan with its PZT to find a point where it has good buildup. This point changes from lock to lock due to a variety of reasons, so it's possible to have slightly different powers from the laser itself. [[abs(50.16 - 50.54)/50.16 = 0.76% change]]
Not too big of a deal since we control the power down stream anyway.
J. Driggers, J. Kissel, L. Sun

Today, during the calibration measurement time, we've done the following:
(1) Tuned the calibration line heights such that the uncertainty of each line is now roughly 0.2%.
    2019-04-17_TuningCalibrationLineAmplitudes_Uncertainty.png shows the time series of the uncertainty for all calibration lines over many hours before and after the line amplitude change -- the middle section is where they were turned off for the standard suite of calibration sweeps; before they were at their former value, after they were at their current value.

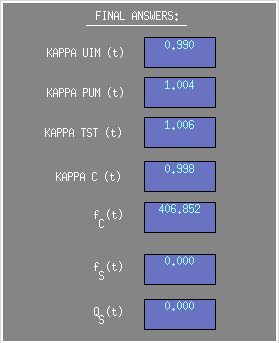
(2) We realized the discrepancy between GDS production of kappa_C (the relative optical gain correction) and f_cc (the cavity pole frequency) and CAL-CS was because in the heat of battle yesterday, we neglected to update the value of the necessary one clock-cycle delay to 410.3 Hz in the PCAL DEMOD -- i.e. it errantly remained as the delay value at the former calibration line frequency at ~331 Hz. Fixing this error returned the time-dependent correction factors to the expected values from the reference model: kappa_C = 1.00 +/- 0.01, and f_cc = 410.6 +/- a few Hz (as opposed to the brief period yesterday between after the calibration line frequencies and now, where the cavity pole was reporting in the 425 Hz region, and the optical gain correction was reporting 0.97).
    2019-04-17_FixingPCALDEMODPhase_410Hz_Fixes_TDCFs.png shows a screenshot of the current values.

(3) We gather a collection of broad-band PCAL injections, as well as the standard sensing function sweeps.
Times of broad-band PCAL injections: 2019-04-17 20:13:20 UTC for ~2 minutes, and again at Apr 17 2019 20:15:31 UTC.
    /ligo/svncommon/CalSVN/aligocalibration/trunk/Runs/O3/H1/Measurements/FullIFOSensingTFs
        2019-04-17_H1_DARM_OLGTF_SS_5to1100Hz_15min.xml
        2019-04-17_H1_PCAL2DARMTF_BB.xml
        2019-04-17_H1_PCAL2DARMTF_SS_5t1100Hz_10min.xml
The data remains remarkably consistent with the reference model (see 2019-04-17_H1_sensingFunction_mcmcModel_vs_measurement.pdf ).
We've stacked all the recent sensing function measurements without correcting for time dependence to form an estimate of the frequency dependent, time-independent systematic erro with a Gaussian process regression, and it shows the same consistency (see 20190416_ref_model_H1_sensingFunction_GPR_on_AllSensingMeasurements.pdf)

More details to come.
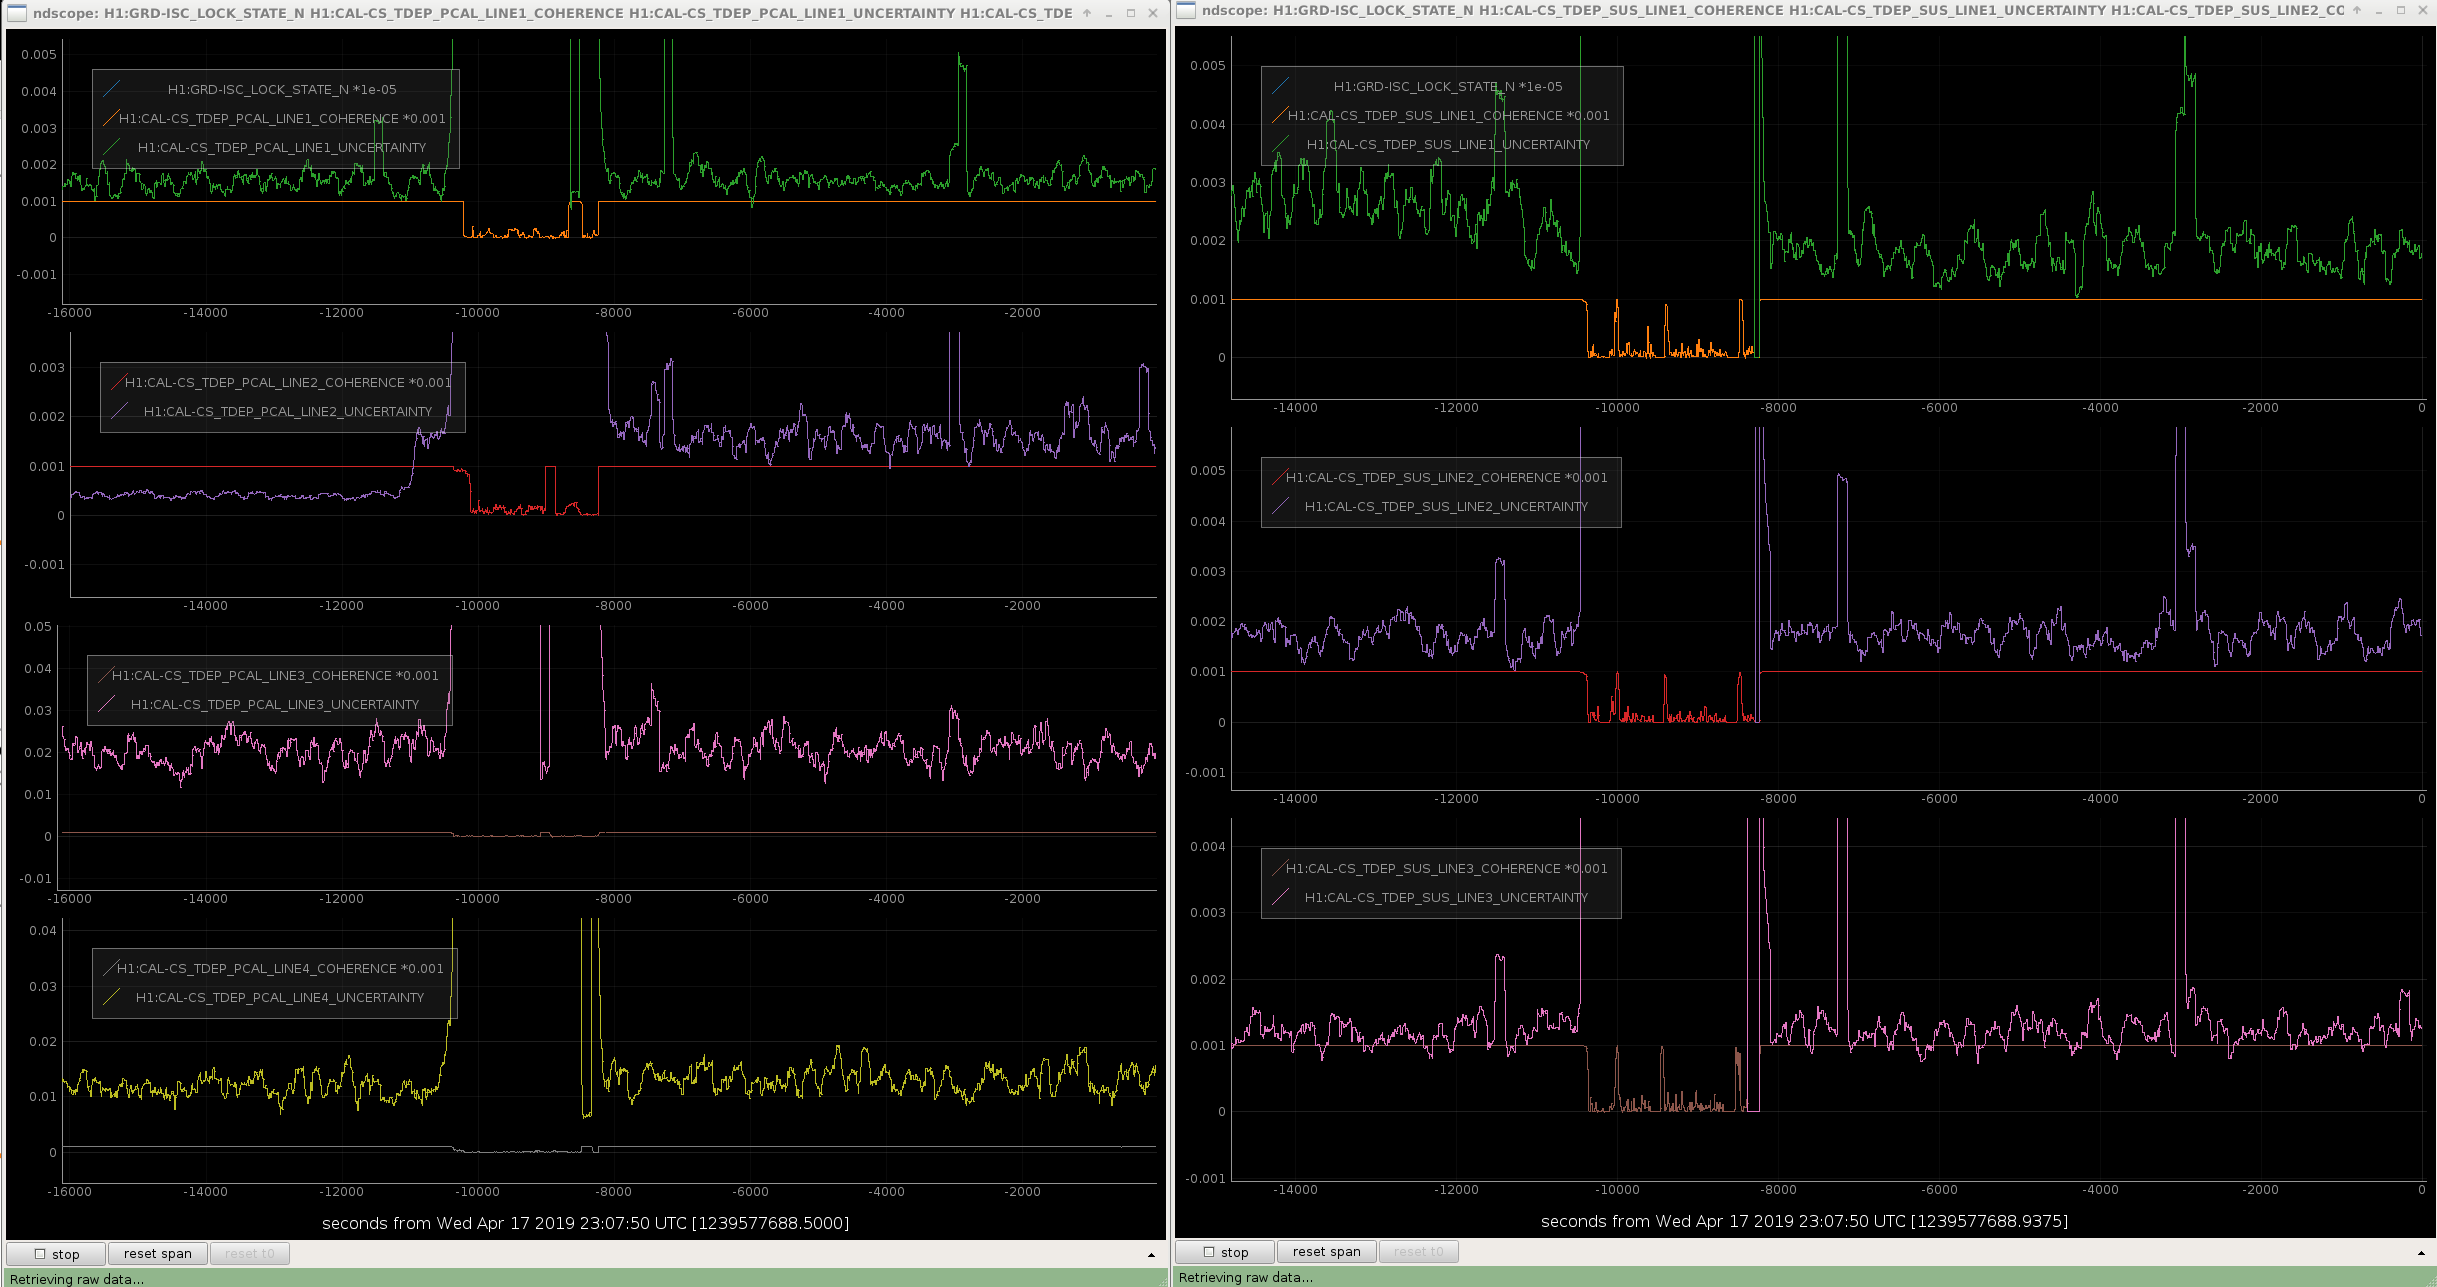
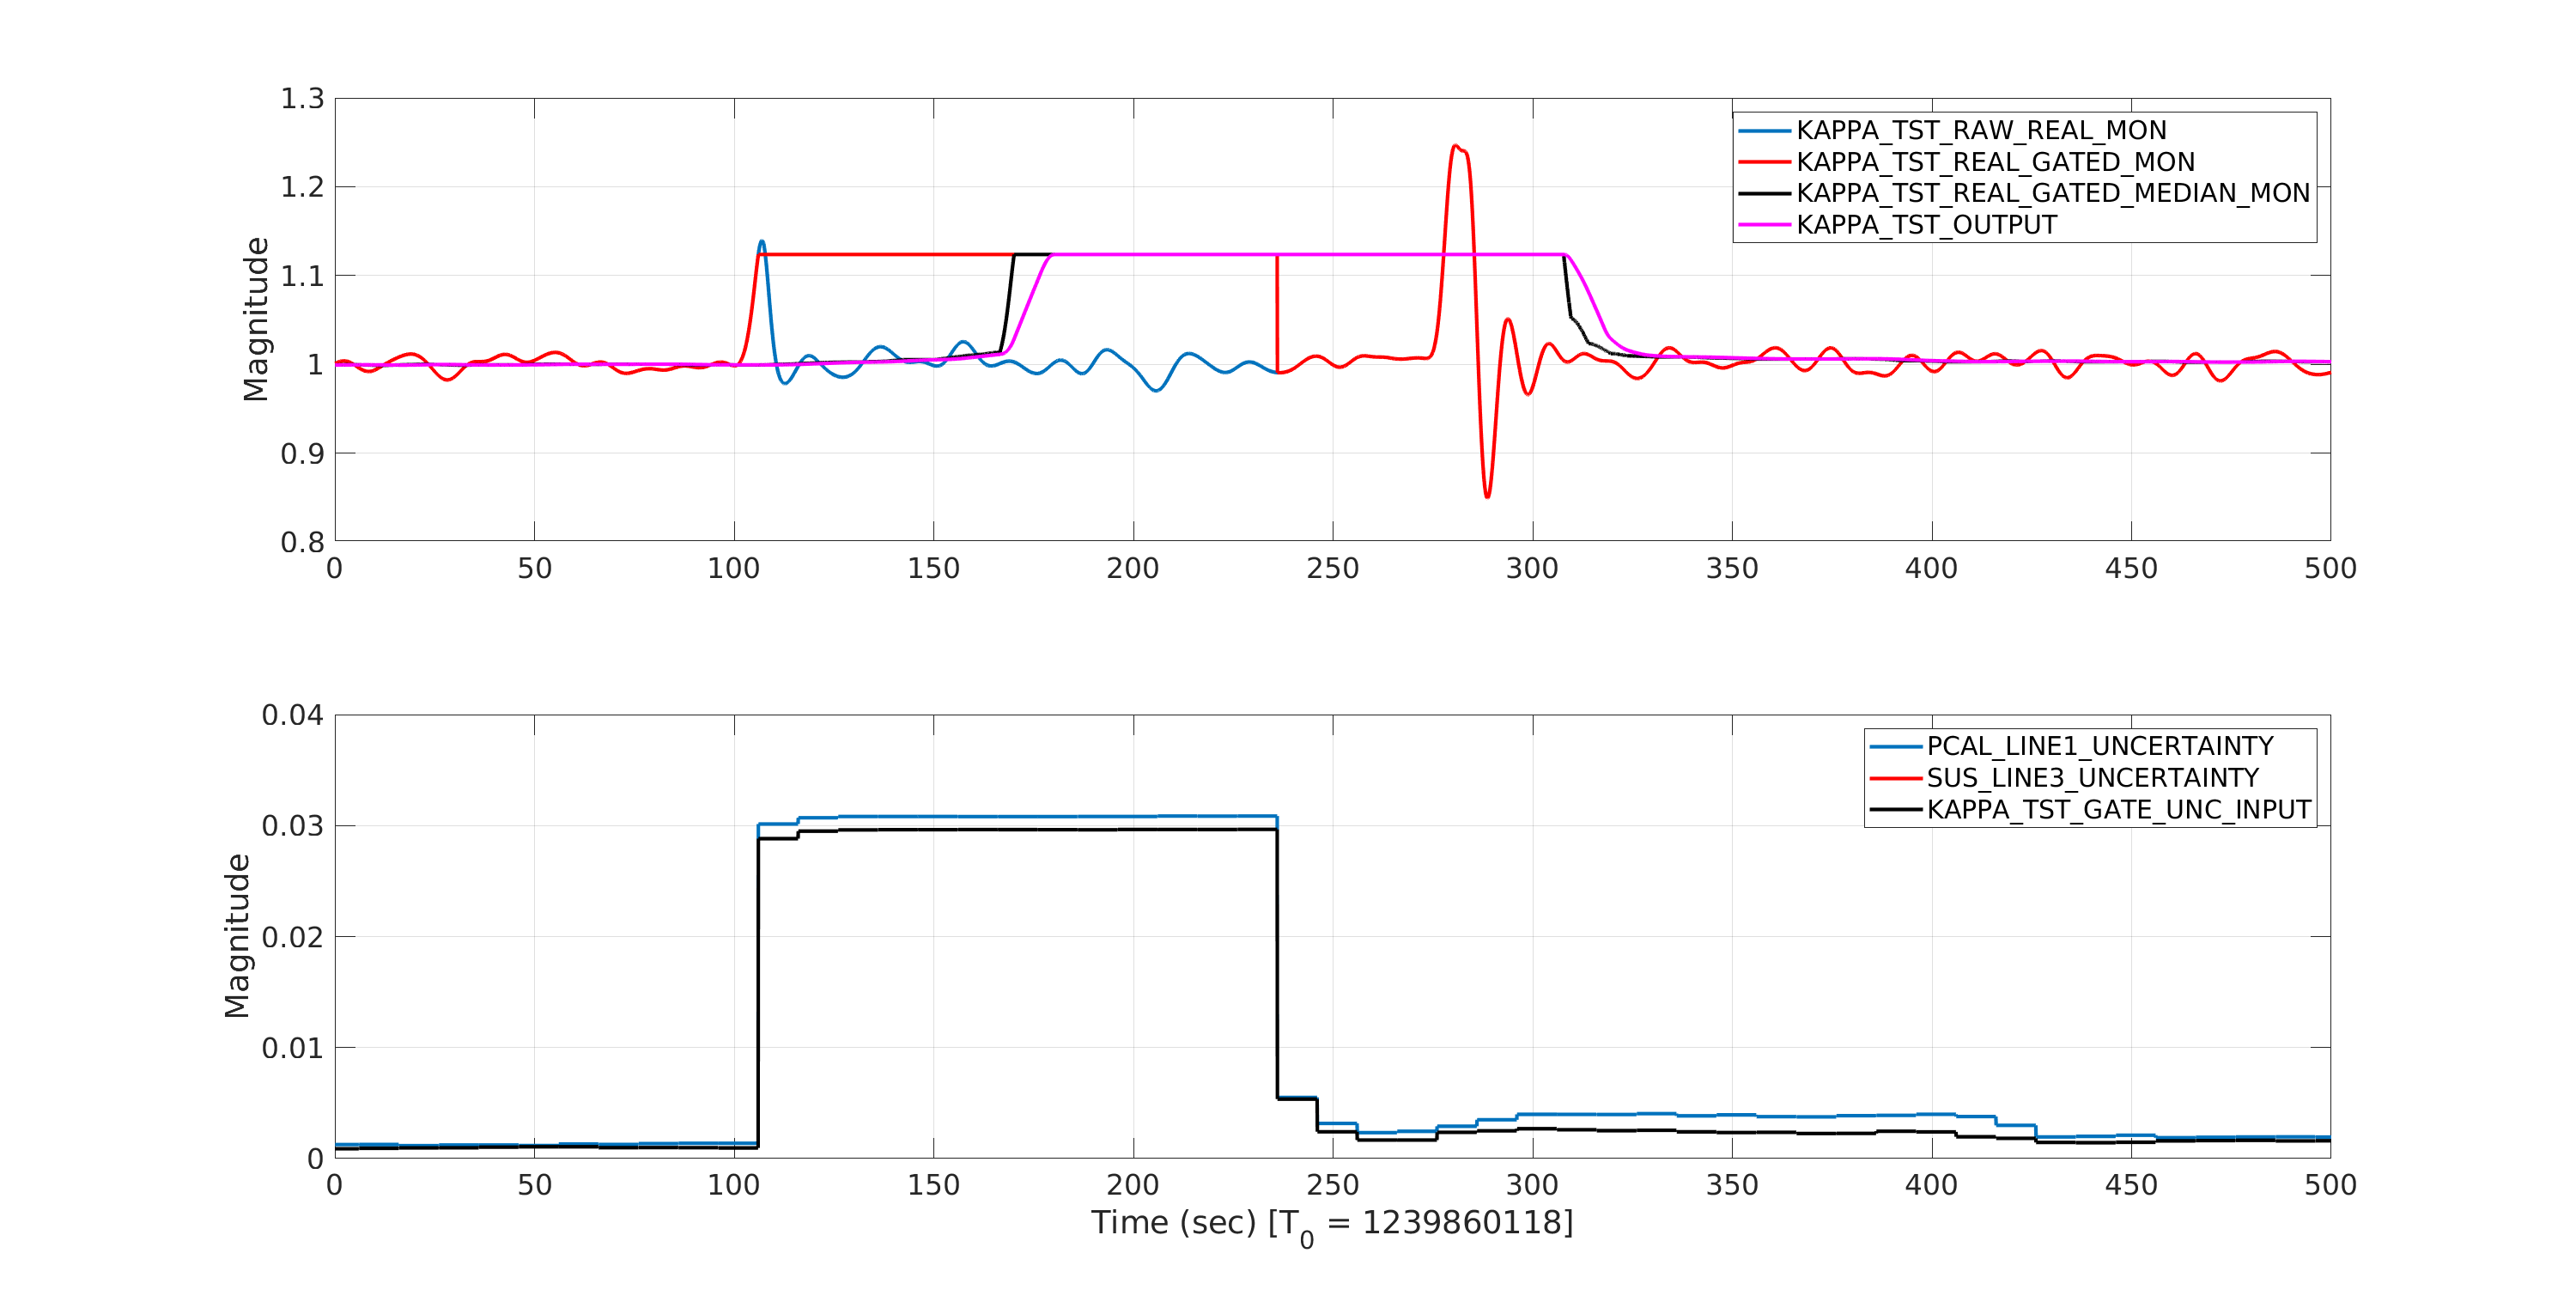
Here is a look at one of the excursion that happened in the front-end estimation of kappa_tst (first one seen in this summary page). The attached plot show various estimations of kappa_tst that happens in the front-end. It also show uncertainty estimation in the calculation of calibration line ratios. We see that when the uncertainty in the estimation of calibration line ratios exceeds set threshold of 0.02, it triggers the gating function. Since the glitch happened to be in the DARM_ERR (IFO) both PCAL_LINE1/DARM_ERR and TST/DARM_ERR ratios get uncertainties higher than 0.02 as in this case. The KAPPA_TST_GATE_UNC_INPUT which is finally used, according to model, supposed to be maximum of the two uncertainties but in this case it is the minimum of the two (KAPPA_TST_GATE_UNC_INPUT is on top of SUS_LINE3_UNCERTAINTY). Since it is still larger than 0.02, gating is triggered. However the gated kappa_tst values don't make any sense. It supposed to be avoid the excursion in the raw kappa_tst but it seems to change the level values of kappa_tst. This function need to checked (this is a user defined c function block). The signals after that make sense.
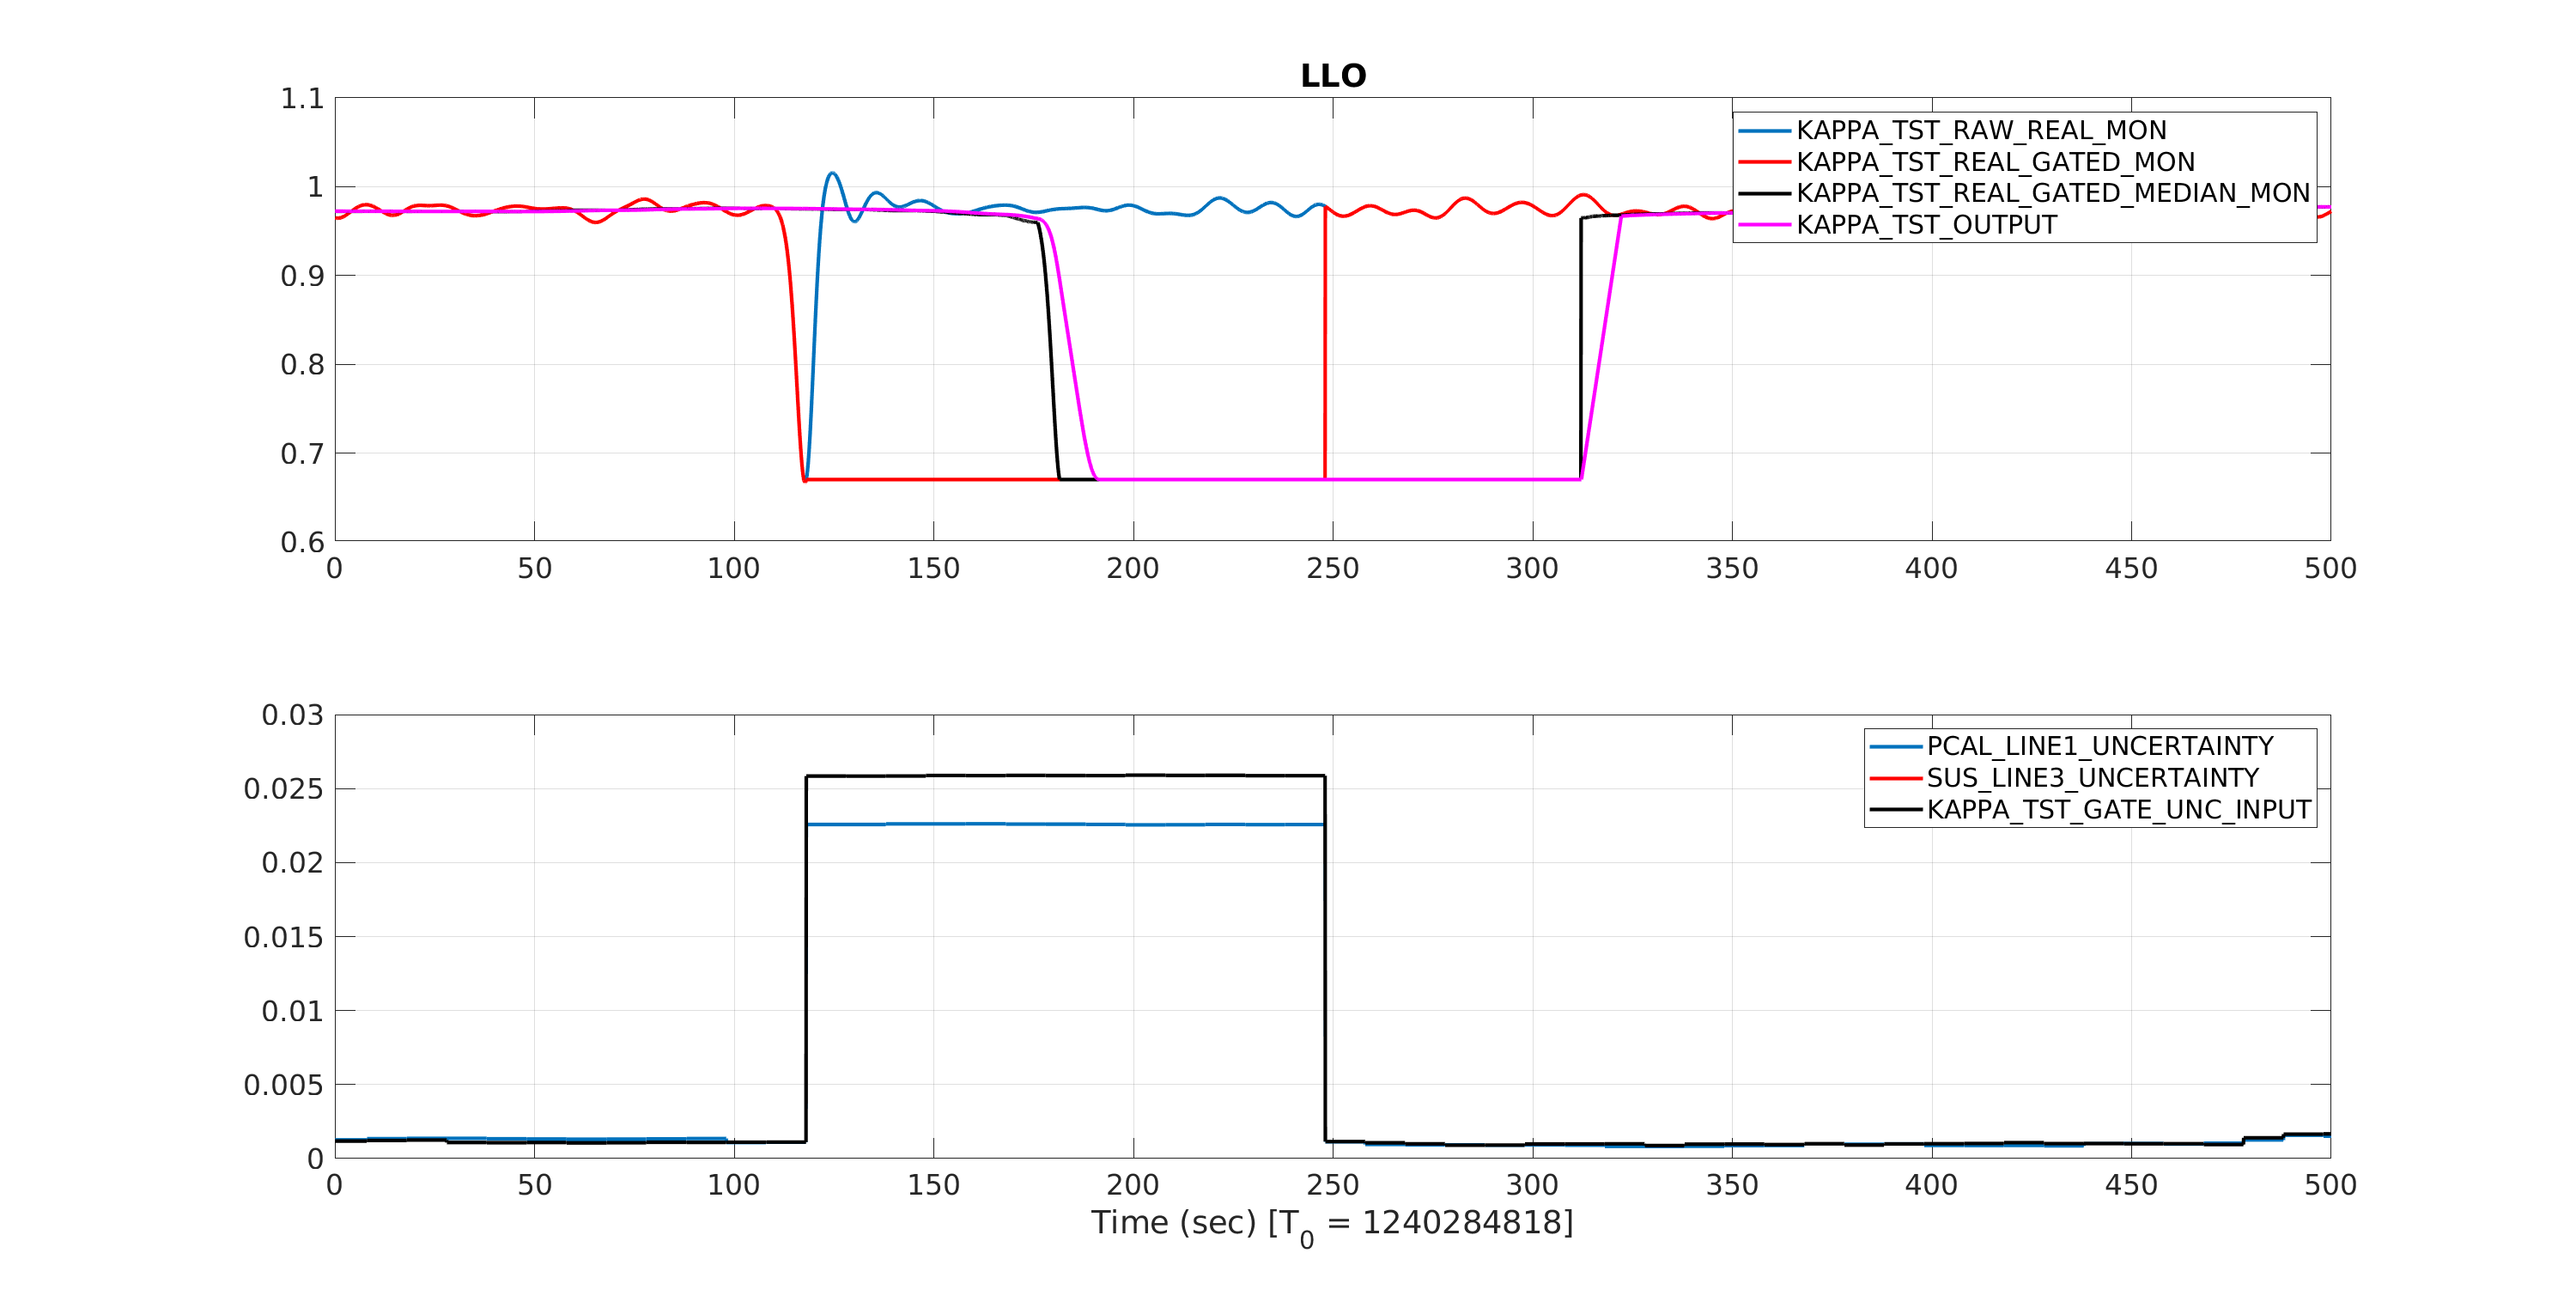
Similar plot for LLO which also show similar problem with gating function block.
Turns out the switch blocks used were defaulting to a logic comparison of >= 0 instead of > 0.  Which means the first input was always being passed.  I'll update this in the common CAL_CS_MASTER.mdl file and we should be able to push that next Tuesday.

The gating issue is a bit trickier.  As far as I can tell the gate is doing what its supposed to do.  At the time the uncertainty rises above threshold, it freezes then and there as shown in Shivaraj's plots.  The problem is, since the uncertainty calculation is basically on a cadence of 10 seconds, there's a 10 second gap between the demodulated low pass starting to respond to a large excursion and the

I think this means we need to put 10 seconds (or maybe a touch longer) buffer between the kappa value input to the gate, so that the coherence corresponds represents the data coming in instead of data that came in during the last 10 seconds.  A 163840 or so sample ring buffer is doable, but I'll have to modify a C code user block to do so.
