TITLE: 04/09 Owl Shift: 07:00-15:00 UTC (00:00-08:00 PST), all times posted in UTC
STATE of H1: Commissioning
INCOMING OPERATOR: Travis
SHIFT SUMMARY:
LOG:
8:43 SQZ_MANAGER guardian takes IFO out of OBSERVE, typo needs
13:05 GRB
14:45 Got verbal notification to run PEM injection script, Phillippe showed me where it lives, so we ran it
Laser Status:
Front End Power is 31.76W (should be around 30 W)
70W Output Power is 69.63W
Front End Watch is GREEN
70W Watch is GREEN
PMC:
It has been locked 1 days, 11 hr 6 minutes (should be days/weeks)
Reflected power = 10.21Watts
Transmitted power = 53.89Watts
PowerSum = 64.1Watts.
FSS:
It has been locked for 0 days 19 hr and 11 min (should be days/weeks)
TPD[V] = 3.009V (min 0.9V)
ISS:
The diffracted power is around 2.3%
Last saturation event was 0 days 19 hours and 12 minutes ago (should be days/weeks)
Possible Issues:
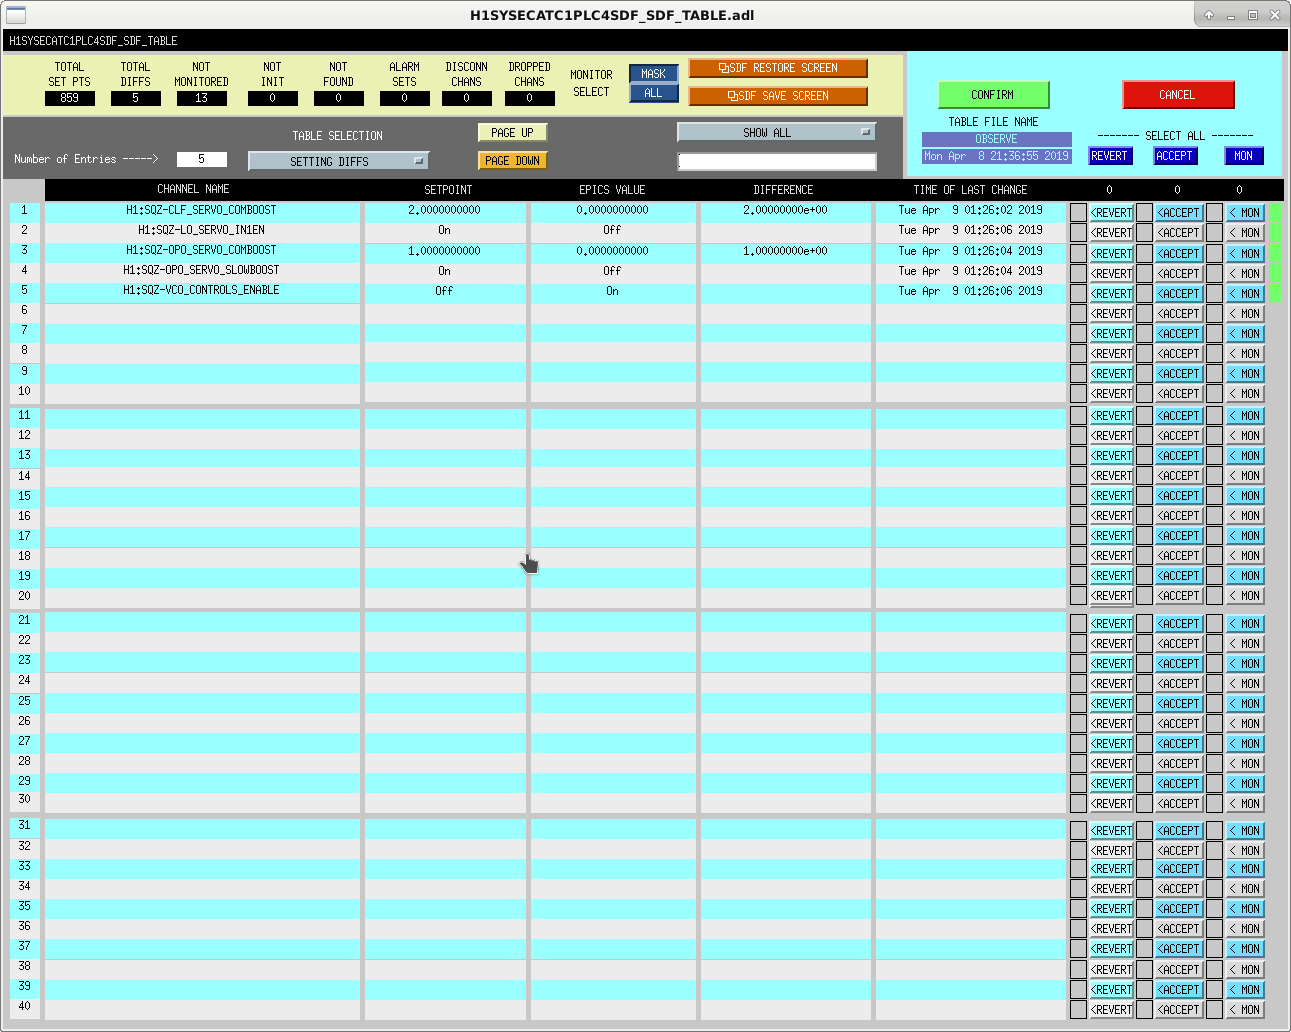
We were just kicked out of OBSERVE by an error in the squeezer guardian. There are ECATC1PLC4 errors (first screen shot) and the SQZ_MANAGER is complaining about an error, but it looks like another typo in a state name. The log has this as the last few lines before the first error:
2019-04-09_04:36:00.627746Z SQZ_MANAGER MODE: MANAGED
2019-04-09_04:36:00.630705Z SQZ_MANAGER MANAGER: assigned: ISC_LOCK
2019-04-09_08:26:01.821216Z SQZ_MANAGER [SQUEEZING.run] Unstalling SQZ_SHG
2019-04-09_08:26:02.444636Z SQZ_MANAGER [SQUEEZING.run] Unstalling SQZ_CLF_LR
2019-04-09_08:26:04.655168Z SQZ_MANAGER [SQUEEZING.run] Unstalling SQZ_OPO_LR
2019-04-09_08:26:04.775252Z SQZ_MANAGER [SQUEEZING.run] OPO unlocked, turning off SQZ ASC
2019-04-09_08:26:04.776589Z SQZ_MANAGER [SQUEEZING.run] ezca: H1:SQZ-ASC_WFS_SWTCH => 0
2019-04-09_08:26:04.777483Z SQZ_MANAGER [SQUEEZING.run] ezca: H1:SYS-MOTION_C_BDIV_C_CLOSE => 1
2019-04-09_08:26:04.778570Z SQZ_MANAGER [SQUEEZING.run] ezca: H1:GRD-SQZ_LO_LR_REQUEST => DOWN
2019-04-09_08:26:04.779165Z SQZ_MANAGER W: ERROR: state returned unknown jump state: LOCK_OPO_DUAL_RESONANCE
2019-04-09_08:26:04.831804Z SQZ_MANAGER ERROR in state SQUEEZING: see log for more info (LOAD to reset)
In the guardian there is no state called LOCK_OPO_DUAL_RESONANCE, but there is a state called LOCKING_OPO_DUAL_RESONANCE. Looks like a typo on line 88.
After fixing that, SQZ_MANAGER seems happy again, but there is still an SDF diff LO_SERVO_COMBOOST, setpoint is zero, epics value is 2, but the range seems to have recovered? I'm accepting to get back to observing.
Thanks Jim.
The LO SERVO board should have 2 boosts on, so I'm not sure why the setpoint in SDF would have been set to not have boosts on.
The error you got was a typo, thanks for fixing it. Yesterday Nutsinee and I made some changes to the way the squeezer guardians check for locklosses and respond to them, this typo was left over from that. It looks like the squeezer lost lock again, probably related to the mode hopping problems we've been having since Friday.
TITLE: 04/09 Eve Shift: 23:00-07:00 UTC (16:00-00:00 PST), all times posted in UTC
STATE of H1: Observing at 109Mpc
INCOMING OPERATOR: Jim
SHIFT SUMMARY: 11hrs lock. Squeezer knocked out of observing, clearing the SQZ ASC enabled it to relocked.
LOG: Nothing to report
Out from 0424-0437 UTC
Squeezer lost lock and would not relock. Cheryl was here and noticed that the SQZ ASC output was large. We cleared these and then it relocked without issue.
Had to accept a boost to get back to Observing, see atteched.
Locked for almost 8hrs at 110Mpc. Microseism is still trending down. Violins seem to be stable.
Nutsinee Daniel
Here is a trend over the past 10 days showing how well the the power stabilization servo for the green pump beam is working. The OPO reflected power is kept constant at 0.945 mW. However, the normalized OPO transmitted power seems to vary by ~15%—not super grandiose.
TITLE: 04/08 Day Shift: 15:00-23:00 UTC (08:00-16:00 PST), all times posted in UTC
STATE of H1: Observing at 109Mpc
OUTGOING OPERATOR: Jeff B
CURRENT ENVIRONMENT:
Wind: 8mph Gusts, 5mph 5min avg
Primary useism: 0.11 μm/s
Secondary useism: 0.34 μm/s
QUICK SUMMARY: Rainy day observing with a 3hr lock.
While preparing a new H1EPICS_DAQ.ini file for tomorrow's maintenance (to add the missing h1edc daq check sum counter and status) the h1edc went into a 0x2000 DAQ STATUS. The status was in this state between 13:52 (when a new H1EDC.ini file was generated) and 13:56 PDT (when original file was reverted). I cannot get these times with more accuracy because its this STATUS channel I was adding to the DAQ.
Trending several slow channels which follow the changed channels in H1EDC.ini show no VAL problems. Greg is checking the slow channels' DAQ status in the frames during this time period.
Because of this issue I have turned off the auto-generation of the GRD ini and EDC ini files on h1fescript0. I've opened FRS12685.
The CFC flag for h1edc is latched in its Orange state due to these changes. This will be greened up at the next opportunity.
Unfortunately H1 was in observe mode during this time. Greg has confirmed that all channels belonging the h1edc (dcuid=52) were marked as 0x2000 (configuration change) in the frame. I have confirmed that all the data is good through this period, it was just marked with a non-zero status.
To summarize for DetChar:
All external EDCU channels (H1EDC.ini) were incorrectly marked with a non-zero status, data is actually good and should be used.
First frame: H-H1_R-1238791936-64.gwf [Apr 08 2019 20:51:58 UTC]
Last frame: H-H1_R-1238792192-64.gwf [Apr 08 2019 20:56:14 UTC]
18:59 (11:59) Lost lock 5 seconds after "LSC Servo Board Split Voltage High" message.
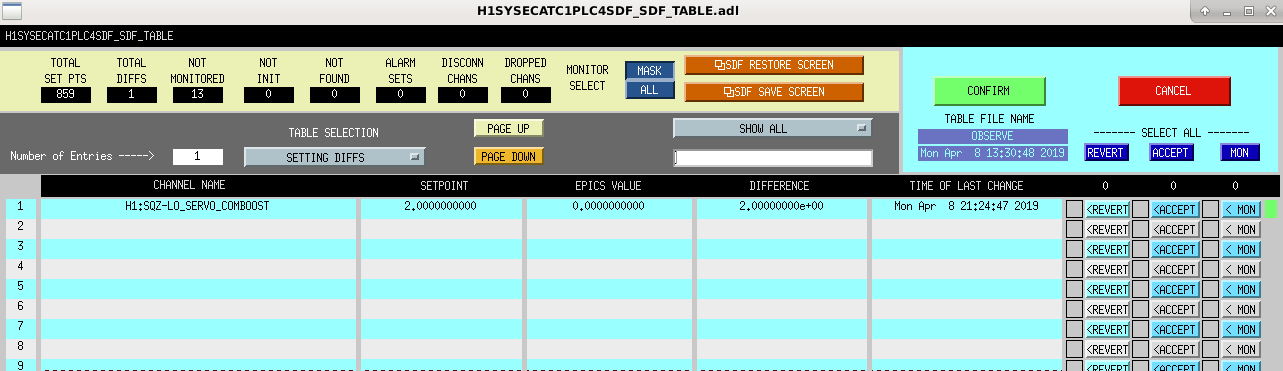
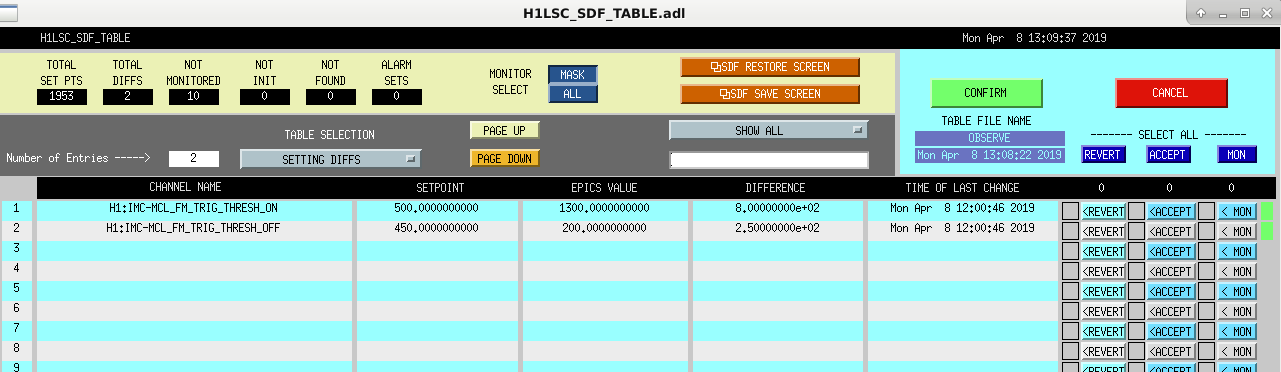
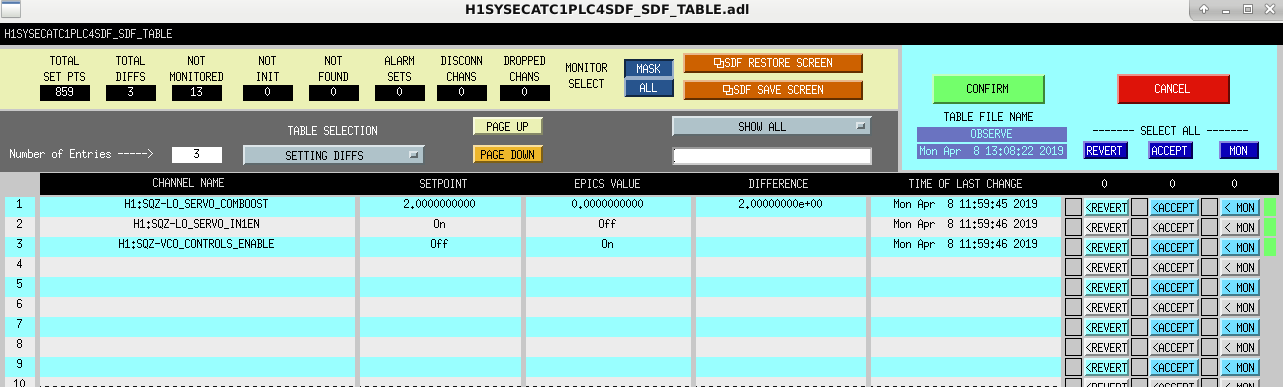
Relocking went well. Accepted the SDF Diffs in the attached files. Back to NLN at 20:08 (13:08). Back into Observing at 20:30 (13:30) after Nutsinee fixed Squeezer problem.
Following the install of the external EDCU (h1edc) last Tuesday 2nd April, it had reported no errors all week until 04:45 Sunday PDT, and again at 04:30 Monday PDT. We have accrued 6 errors so far.
A reminder that when we first tested h1edc we were getting CRC errors at a rate of every few seconds until we delayed the mx_stream data send on h1susauxh34 by 1mS.
Jeff B reminded me that the SDF_OVERVIEW MEDM still has a white (invalid) entry for the removed h1odcmaster model. I've removed this entry from the MEDM.
Mostly a good first half of the shift. Dropped out of Observing from 15:41 (08:41) to 15:44 (08:44) for Squeezer issue. Took the opportunity to damp ETM-Y Mode2 violin mode. Lost lock at 18:59 (11:59) 5 seconds after "LSC Servo Board Split Voltage High" message. In the process of relocking.
IFO dropped out of Observing for Squeezer problem. ETM-Y violin mode has been ringing up since yesterday morning. This AM it was 4.02 (starting into yellow zone). Took advantage to apply -2.0 gain of damping. Mode is coming down nicely. Out of Observing at 15:41 (08:41) Switch to DAMPING_ON_SIMPLE at 15:42 (08:42) Switch back to DAMPING_ON_DC at 15:43 (08:43) Back to Observing at 15:44 (08:44)
Here is a Bruco scan using a LDVW default settings, with max frequency 200 Hz (plots only go up to 200 Hz, but webpage has info above 200 Hz): https://ldas-jobs.ligo.caltech.edu/~ldvw/bruco/evan.goetz/H1-CAL-DELTAL_EXTERNAL_DQ_2019-04-07-04.00.00-180/results/ Some notable features (some different compared with Gabriele's last Bruco in late March): - Lots of coherence 5-20 Hz with OMC-DCPD_NULL_OUT_DQ - Second channel with lots of coherence in 5-20 Hz band and the ~35 Hz calibration lines is very frequently ASC-AS_A_RF45_Q_SUM_OUT_DQ - Some regions with marginal coherence (~0.45) with PEM-EX_MAG_EBAY_SUSRACK_Z_DQ
Thanks Evan,
The first two channels (NULL and AS 45 SUM) are just witnessing DARM, so they should probably be added to the excluded list for BRUCO.
The magnetometer could be picking up the DARM signal being sent to the suspensions, but I am not sure.
Just realized that DIAG_MAIN has been flashing messages that the HWS code has stopped. They were so brief I had to look in the log: 2019-04-07_01:23:59.022623Z DIAG_MAIN [RUN_TESTS.run] USERMSG 0: HWS: HWS ETMY code stopped 2019-04-07_01:55:22.025647Z DIAG_MAIN [RUN_TESTS.run] USERMSG 0: HWS: HWS ETMX code stopped 2019-04-07_01:59:59.028707Z DIAG_MAIN [RUN_TESTS.run] USERMSG 0: HWS: HWS ITMY code stopped 2019-04-07_05:07:38.016456Z DIAG_MAIN [RUN_TESTS.run] USERMSG 0: HWS: HWS ETMY code stopped 2019-04-07_05:13:36.027085Z DIAG_MAIN [RUN_TESTS.run] USERMSG 0: HWS: HWS ETMX code stopped 2019-04-07_05:43:37.025772Z DIAG_MAIN [RUN_TESTS.run] USERMSG 0: HWS: HWS ITMY code stopped 2019-04-07_07:13:21.025773Z DIAG_MAIN [RUN_TESTS.run] USERMSG 0: HWS: HWS ITMX code stopped 2019-04-07_07:18:26.014392Z DIAG_MAIN [RUN_TESTS.run] USERMSG 0: HWS: HWS ITMX code stopped 2019-04-07_08:31:50.012318Z DIAG_MAIN [RUN_TESTS.run] USERMSG 0: HWS: HWS ETMX code stopped 2019-04-07_08:51:17.019917Z DIAG_MAIN [RUN_TESTS.run] USERMSG 0: HWS: HWS ETMY code stopped 2019-04-07_09:27:15.028043Z DIAG_MAIN [RUN_TESTS.run] USERMSG 0: HWS: HWS ITMY code stopped 2019-04-07_11:12:11.026664Z DIAG_MAIN [RUN_TESTS.run] USERMSG 0: HWS: HWS ITMX code stopped 2019-04-07_11:50:04.023291Z DIAG_MAIN [RUN_TESTS.run] USERMSG 0: HWS: HWS ETMX code stopped 2019-04-07_12:34:56.023720Z DIAG_MAIN [RUN_TESTS.run] USERMSG 0: HWS: HWS ETMY code stopped
Luckily, the HWS code is okay. The test in DIAG_MAIN was looking to see if H1:TCS-{}_HWS_LIVE_ACQUISITION_GPSTIME was static for longer than 5 seconds. That seems to be much too short, so I bumped it up to 60 seconds.
Good catch Patrick.