Displaying reports 42541-42560 of 88682.Go to page Start 2124 2125 2126 2127 2128 2129 2130 2131 2132 End
Reports until 16:16, Friday 15 March 2019
H1 General
jeffrey.bartlett@LIGO.ORG - posted 16:16, Friday 15 March 2019 (47567)
Ops Day Shift Summary
Ops Shift Log: 03/14/2019, Day Shift 15:00 – 23:00 (08:00 - 16:00) Time - UTC (PT)
State of H1: Locked at NLN, with 29.9w, range is 98.9Mpc
Intent Bit: Commissioning
Support: Jenne
Incoming Operator: N/A
Shift Summary: This morning had some difficulty moving past DARM_TO_RF, and the X-Arm ALS was glitching. Both problems were resolved and we relocked with relative ease. The IFO is in the hands of the commissioning team.     


Activity Log: Time - UTC (PT)
15:00 (08:00) Start of shift
17:15 (10:15) Marc – Going to Mid-X to look for parts
18:14 (11:14) Marc – Back from Mid-X
18:42 (11:42) Kyle – Going to Mid-Y
18:59 (11:59) Kyle – Back from Mid-Y
19:15 (12:15) Locked at NLN, 30w, 99.0Mpc
20:10 (13:10) Nutsinee – Going into the LVEA to the HAM6 area
20:45 (13:45) Robert & Co. – Doing PEM injections (
21:45 (14:45) Gerardo – Going to Mid-Y to turn off vacuum equipment
22:10 (15:10) Gerardo – Back from Mid-Y
23:00 (16:00) End of Shift


H1 SEI
jim.warner@LIGO.ORG - posted 14:55, Friday 15 March 2019 (47559)
EY T240 in BRS enclosure a little noisier than Ground STS

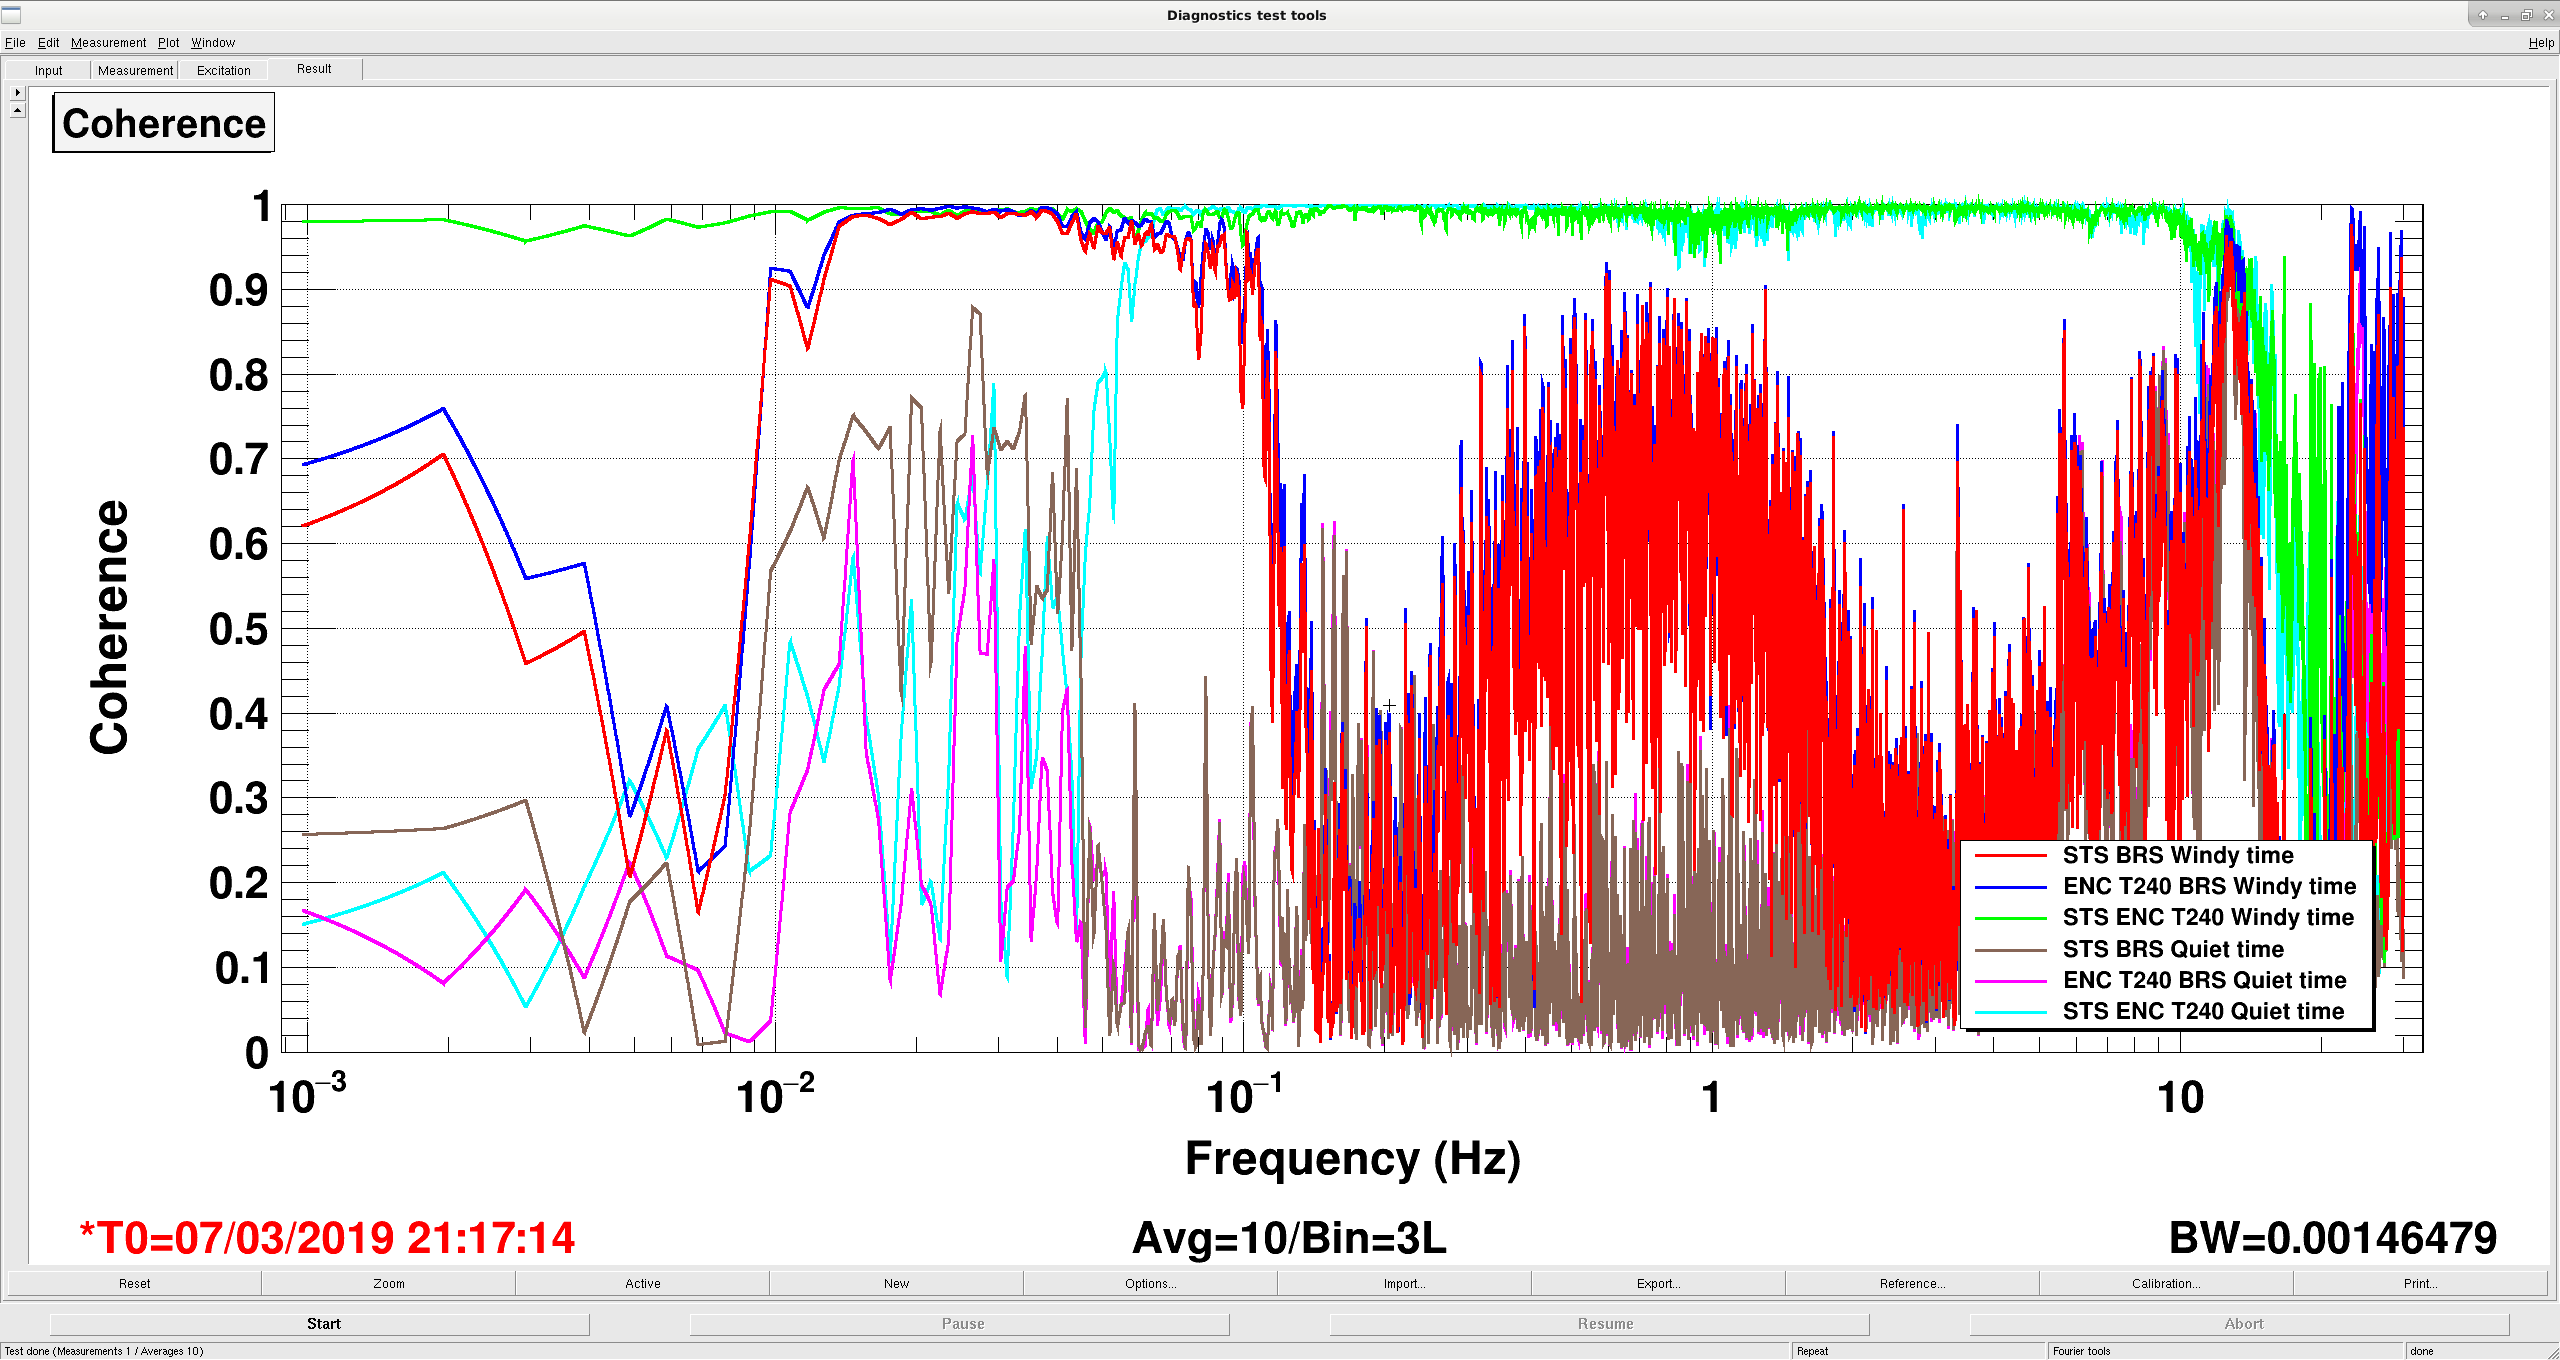
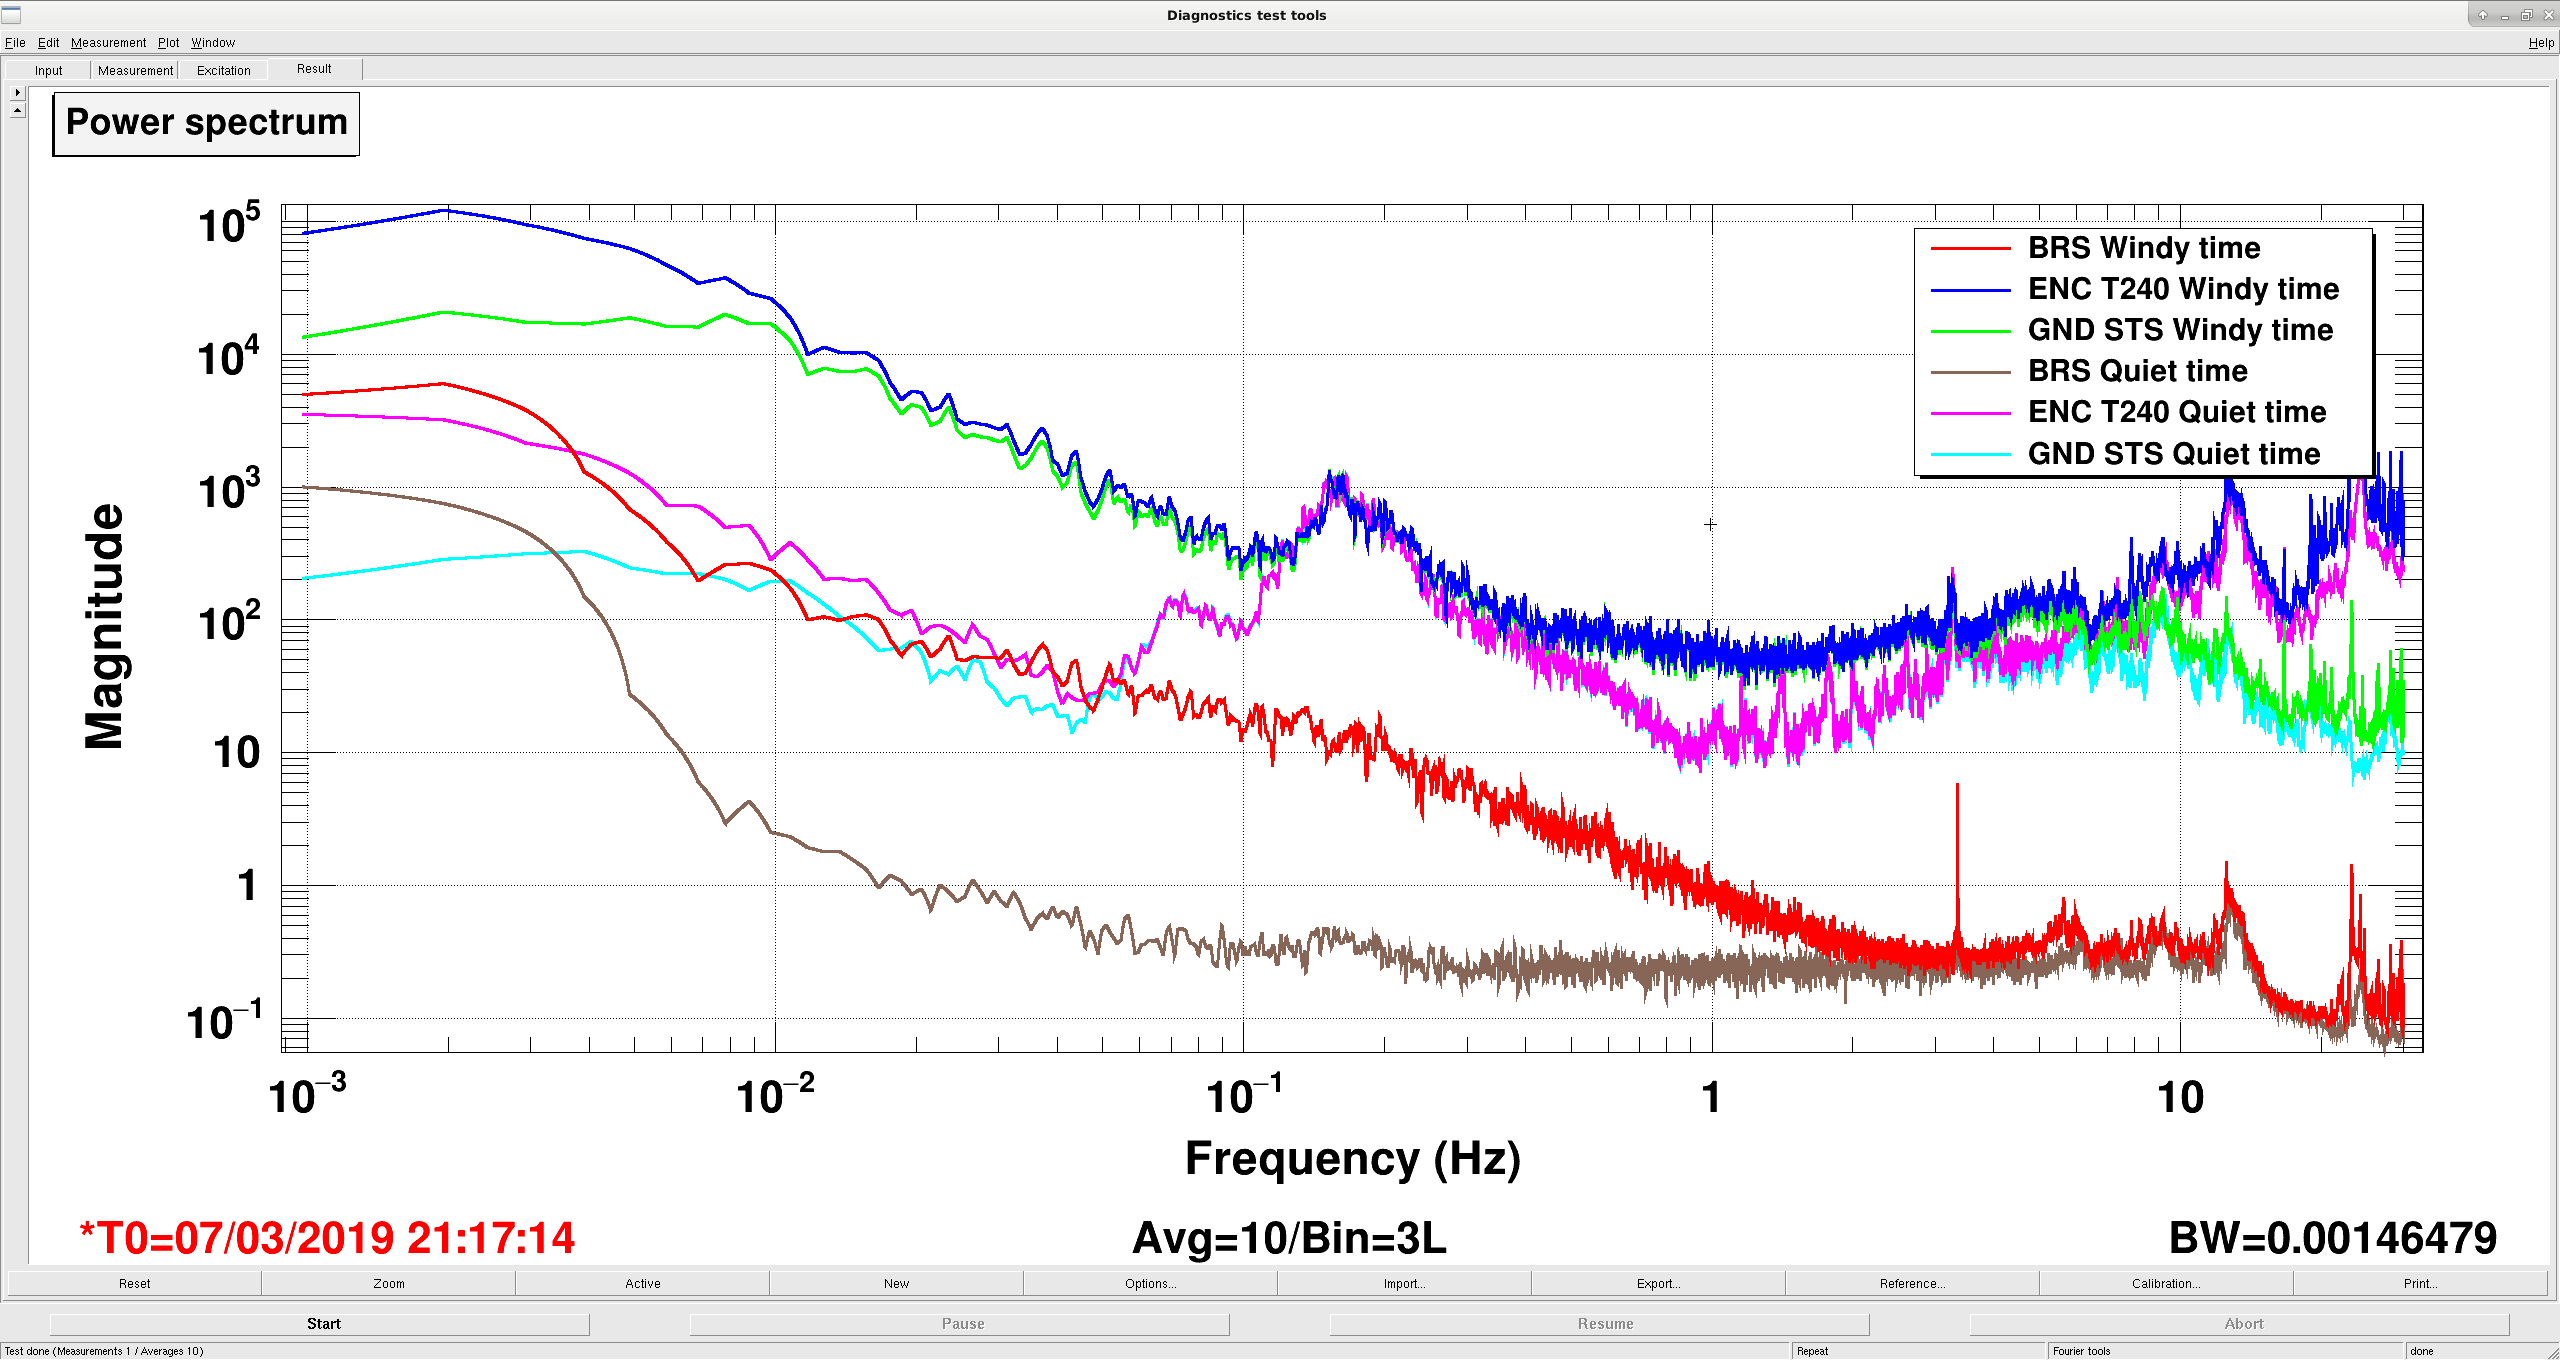
A while ago Robert helped me resurrect the T240 in the BRS enclosure at EY, which we want to see if we can use to get better subtraction from the BRS during windy times. Right now, it seems like the T240 sees more low frequency noise than the ground seismometer we currently have on the ground outside the BRS box, during both a quiet time last night and during 30mph winds on the 7th. First plot shows the asds during both times. Red, dark blue and bright green are during the windy time, dark green, pink and light blue are during the quiet time. For both times, the T240 in the enclosure shows more noise noise below .1 hz than the ground STS. It could be that there is more temperature variation for that seismometer or it's platform. During the quiet time, this extra noise probably wouldn't be a performance issue, if we used this sensor for feedforward, but I haven't looked at the effect  on the isi controls during windy time

But the coherence with the BRS is slightly better, shown in the second image. The red line on the second plot is the coherence during the windy time between the BRS and the ground STS, the dark blue line is the coherence from the enclosure seismometer with the BRS, and most places the blue line is slightly higher than the red. It is also interesting to compare the bright green and light blue lines, which are the coherence between the two seismometers during the two different times. I'm a little surprised how much coherence there is between the seismometers during the windy time (bright green line), I kind of thought we "knew"  the coherence lengths for tilt were too short for that much coherence. This seems to be true for the light blue line, which is the coherence between the seismometers during the quiet time.

Images attached to this report
H1 SEI
jeffrey.bartlett@LIGO.ORG - posted 13:38, Friday 15 March 2019 (47565)
Weekly ISI CPS Noise Spectra Checks (FAMIS #8351)
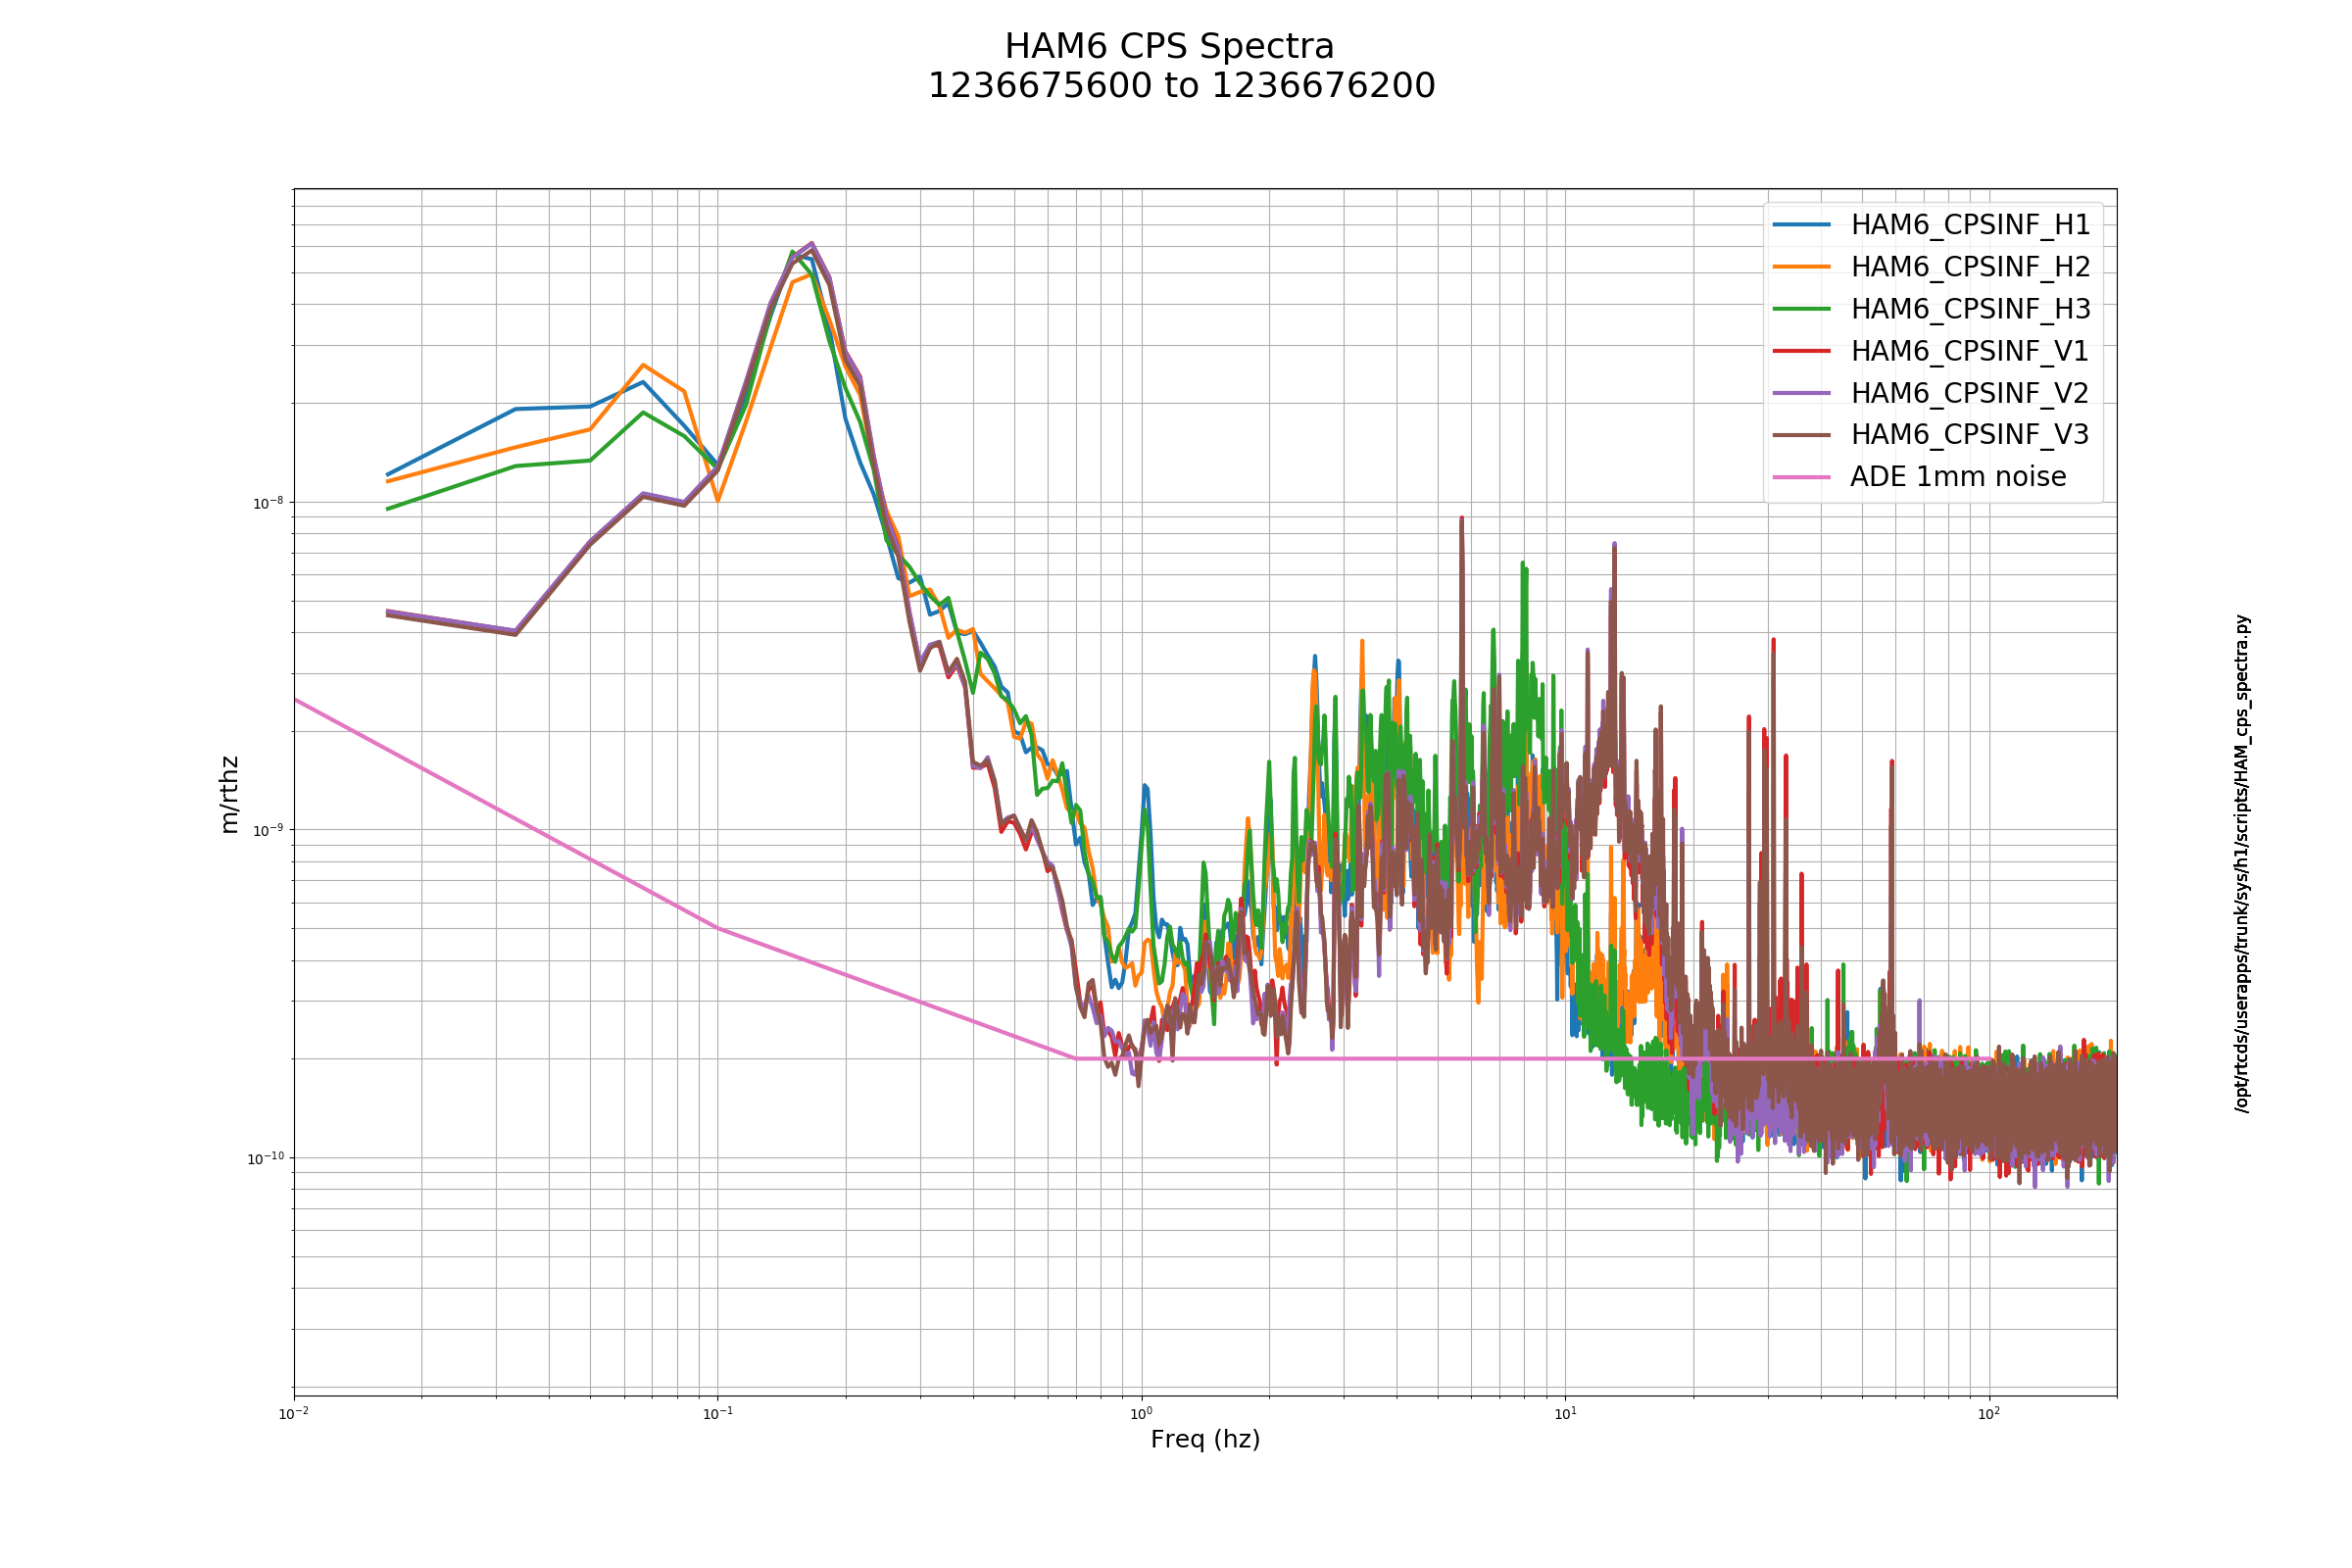
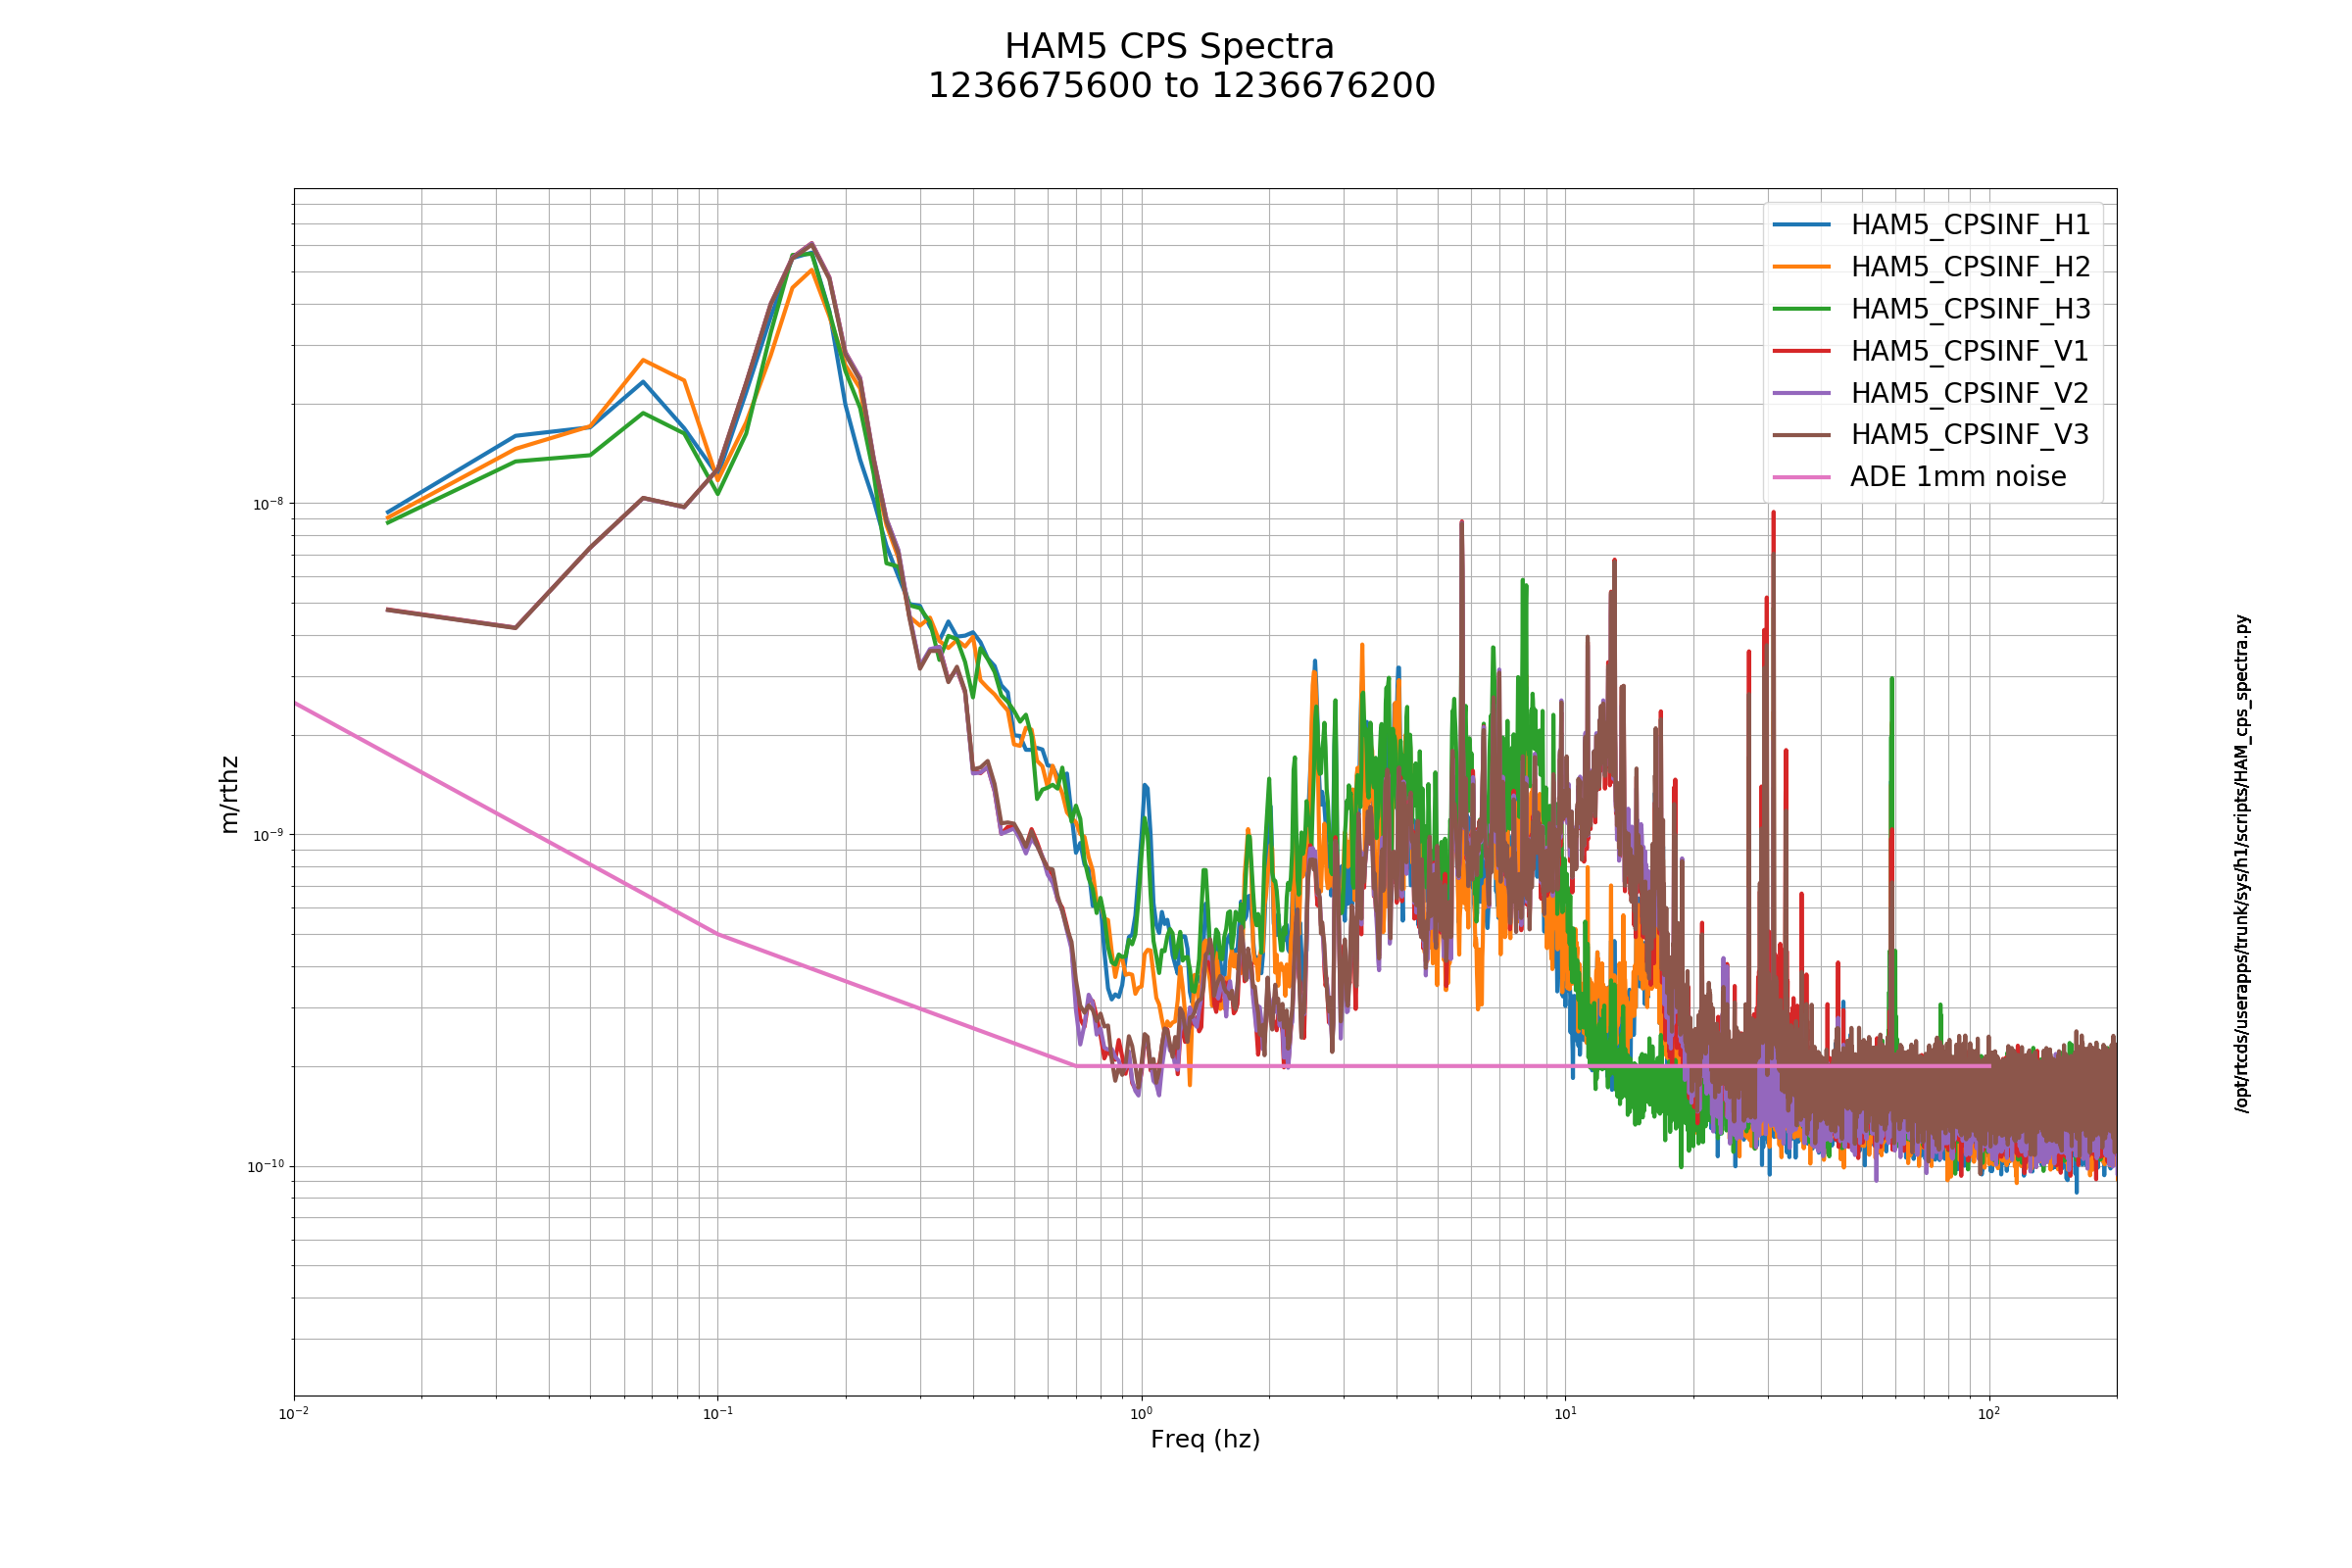
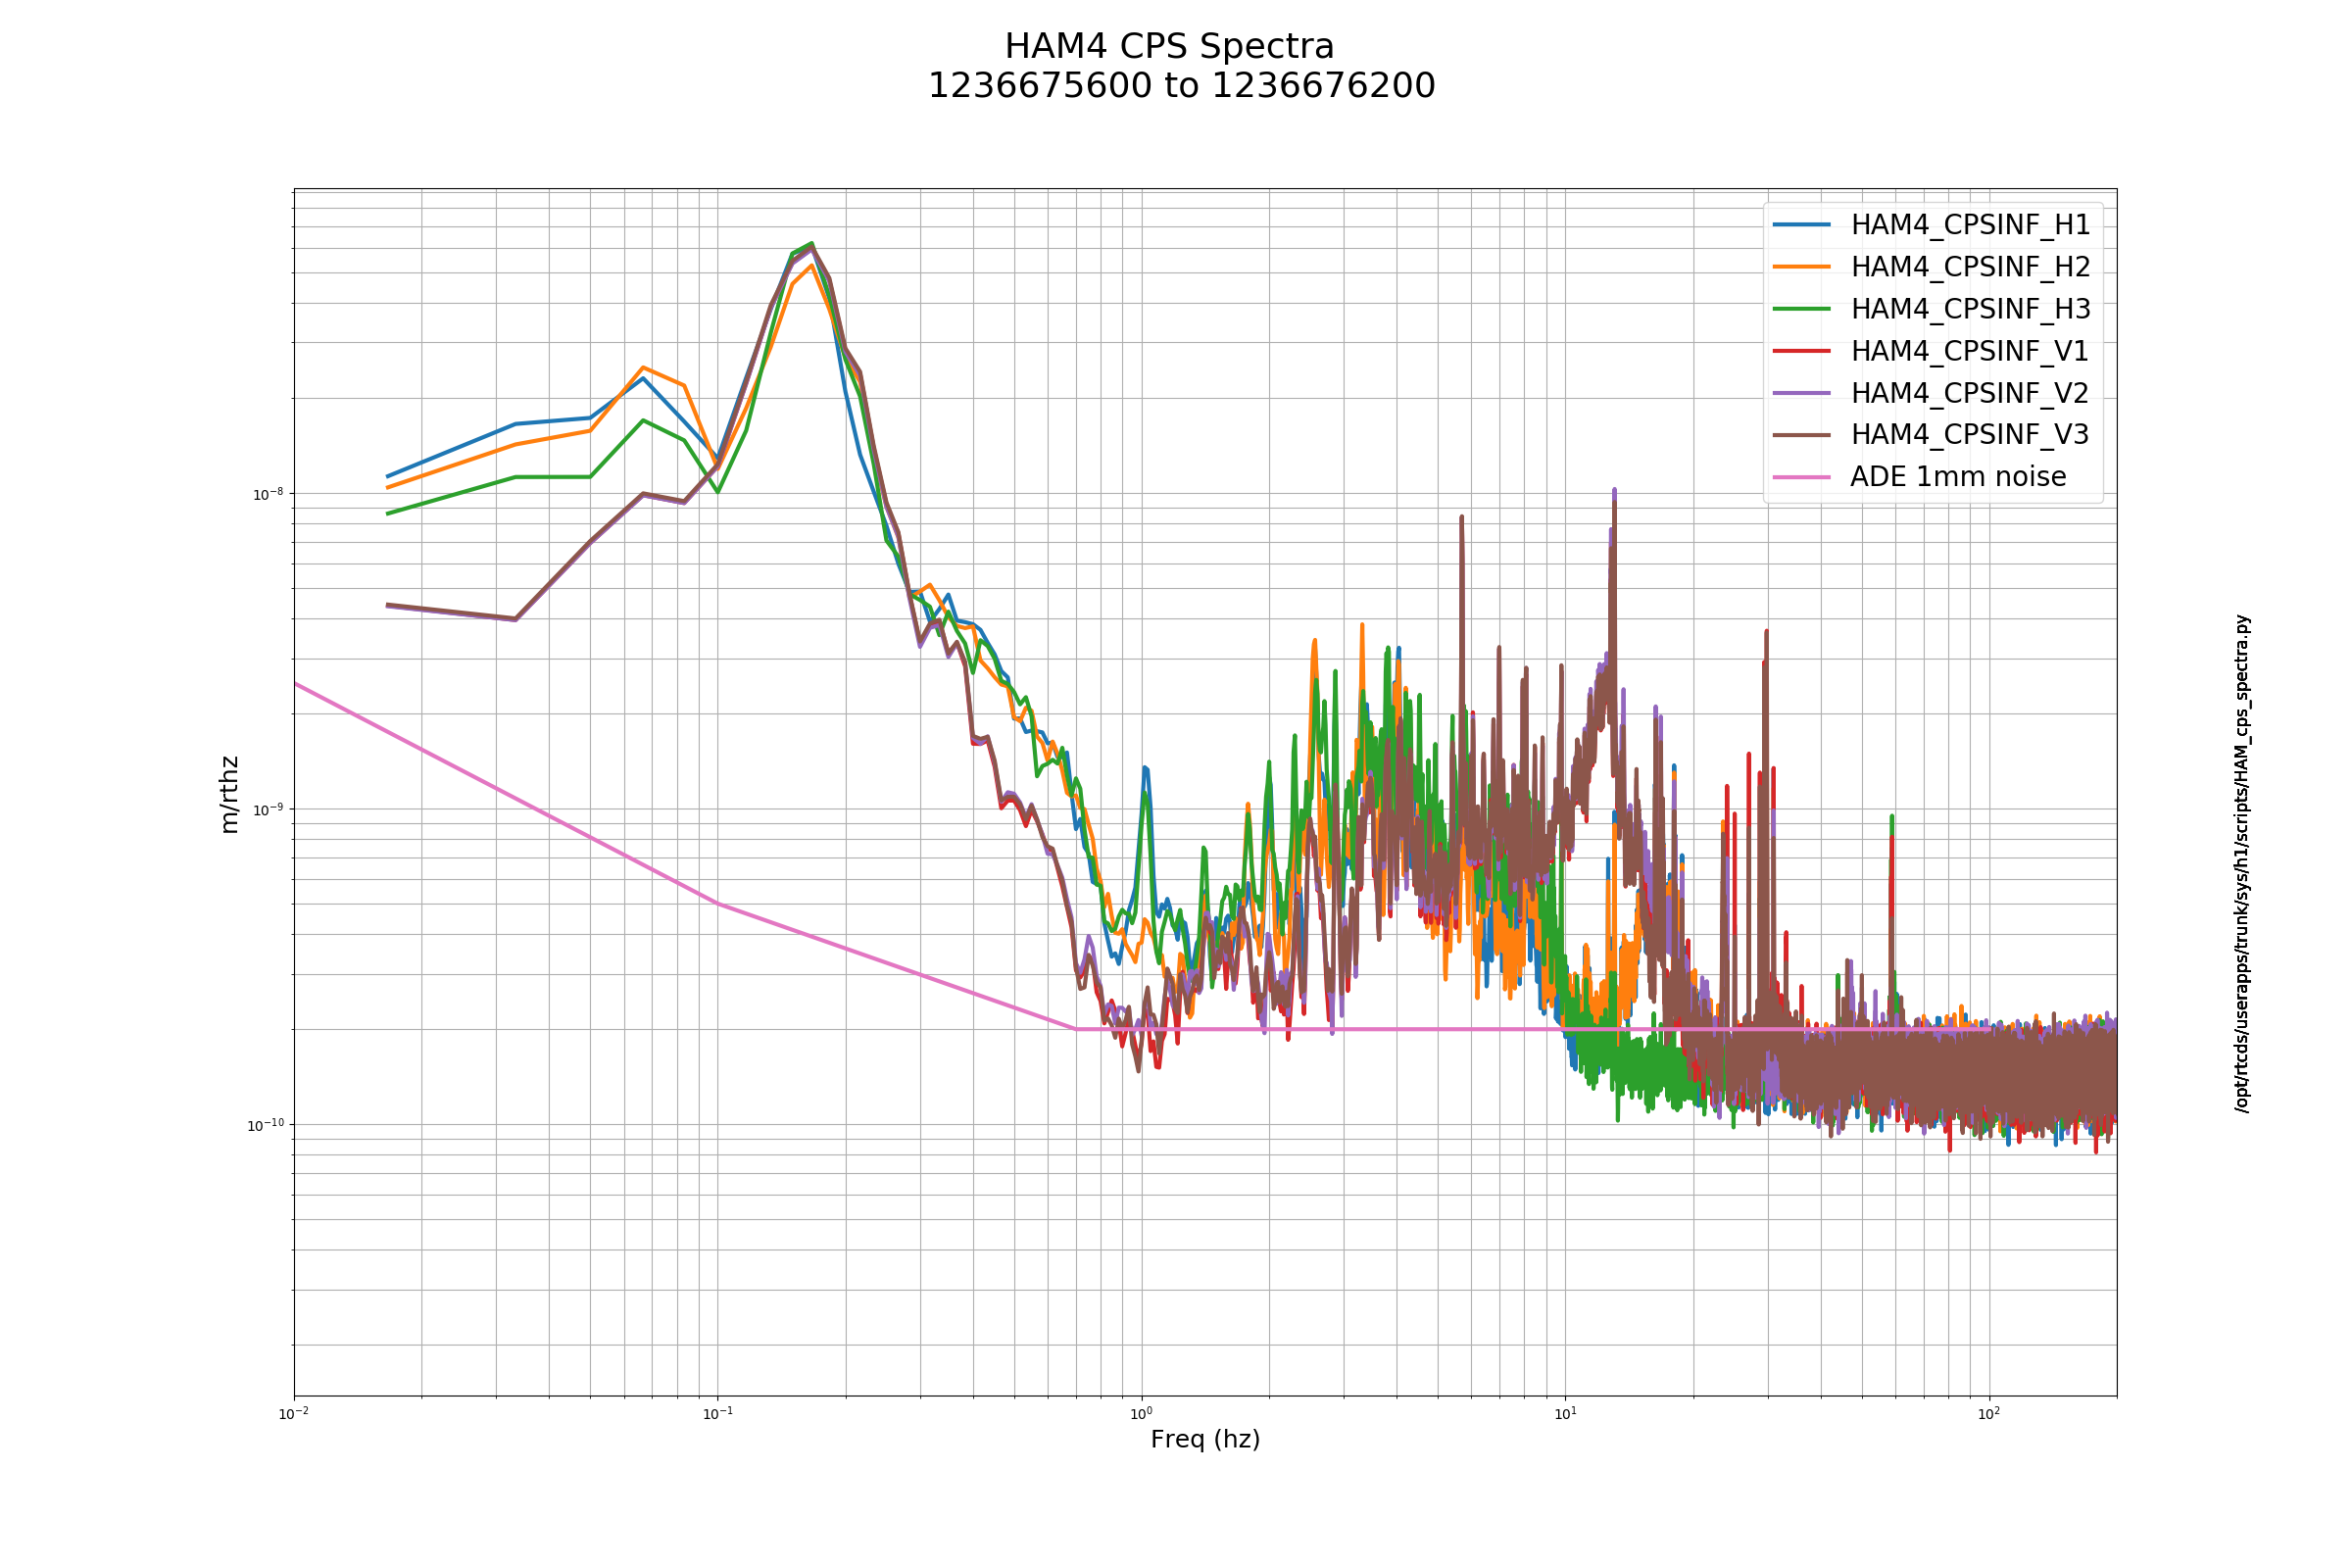
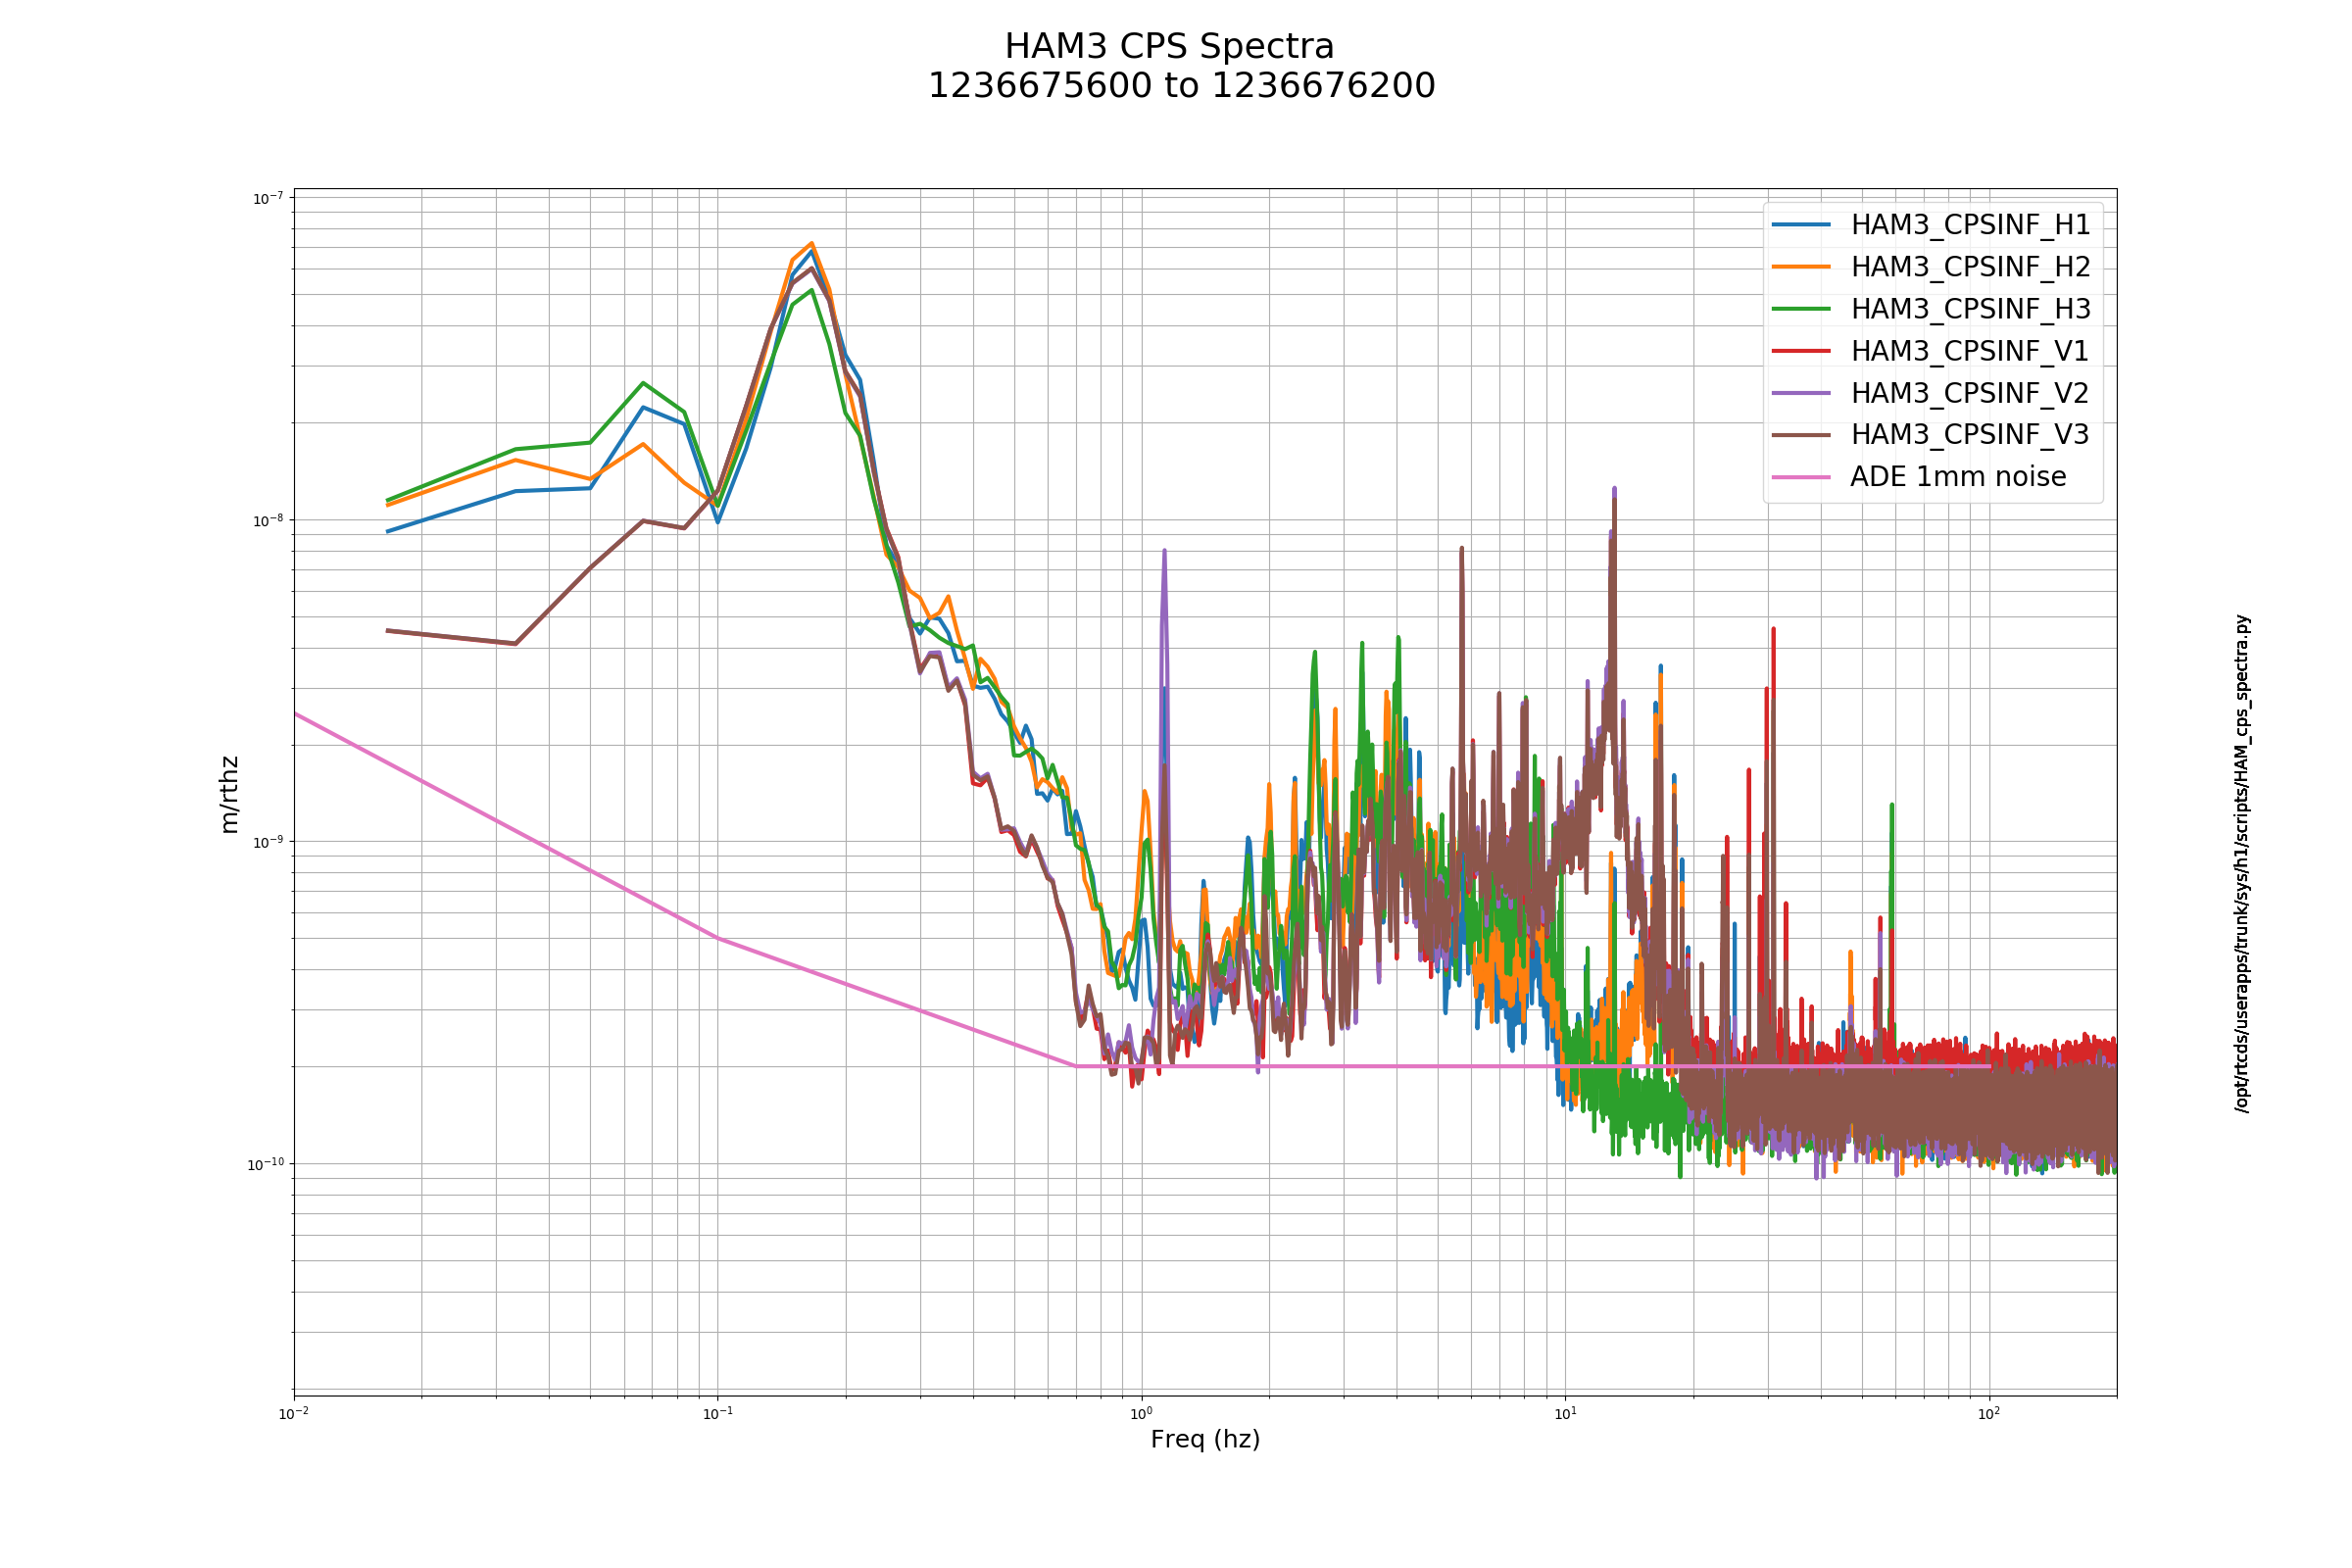
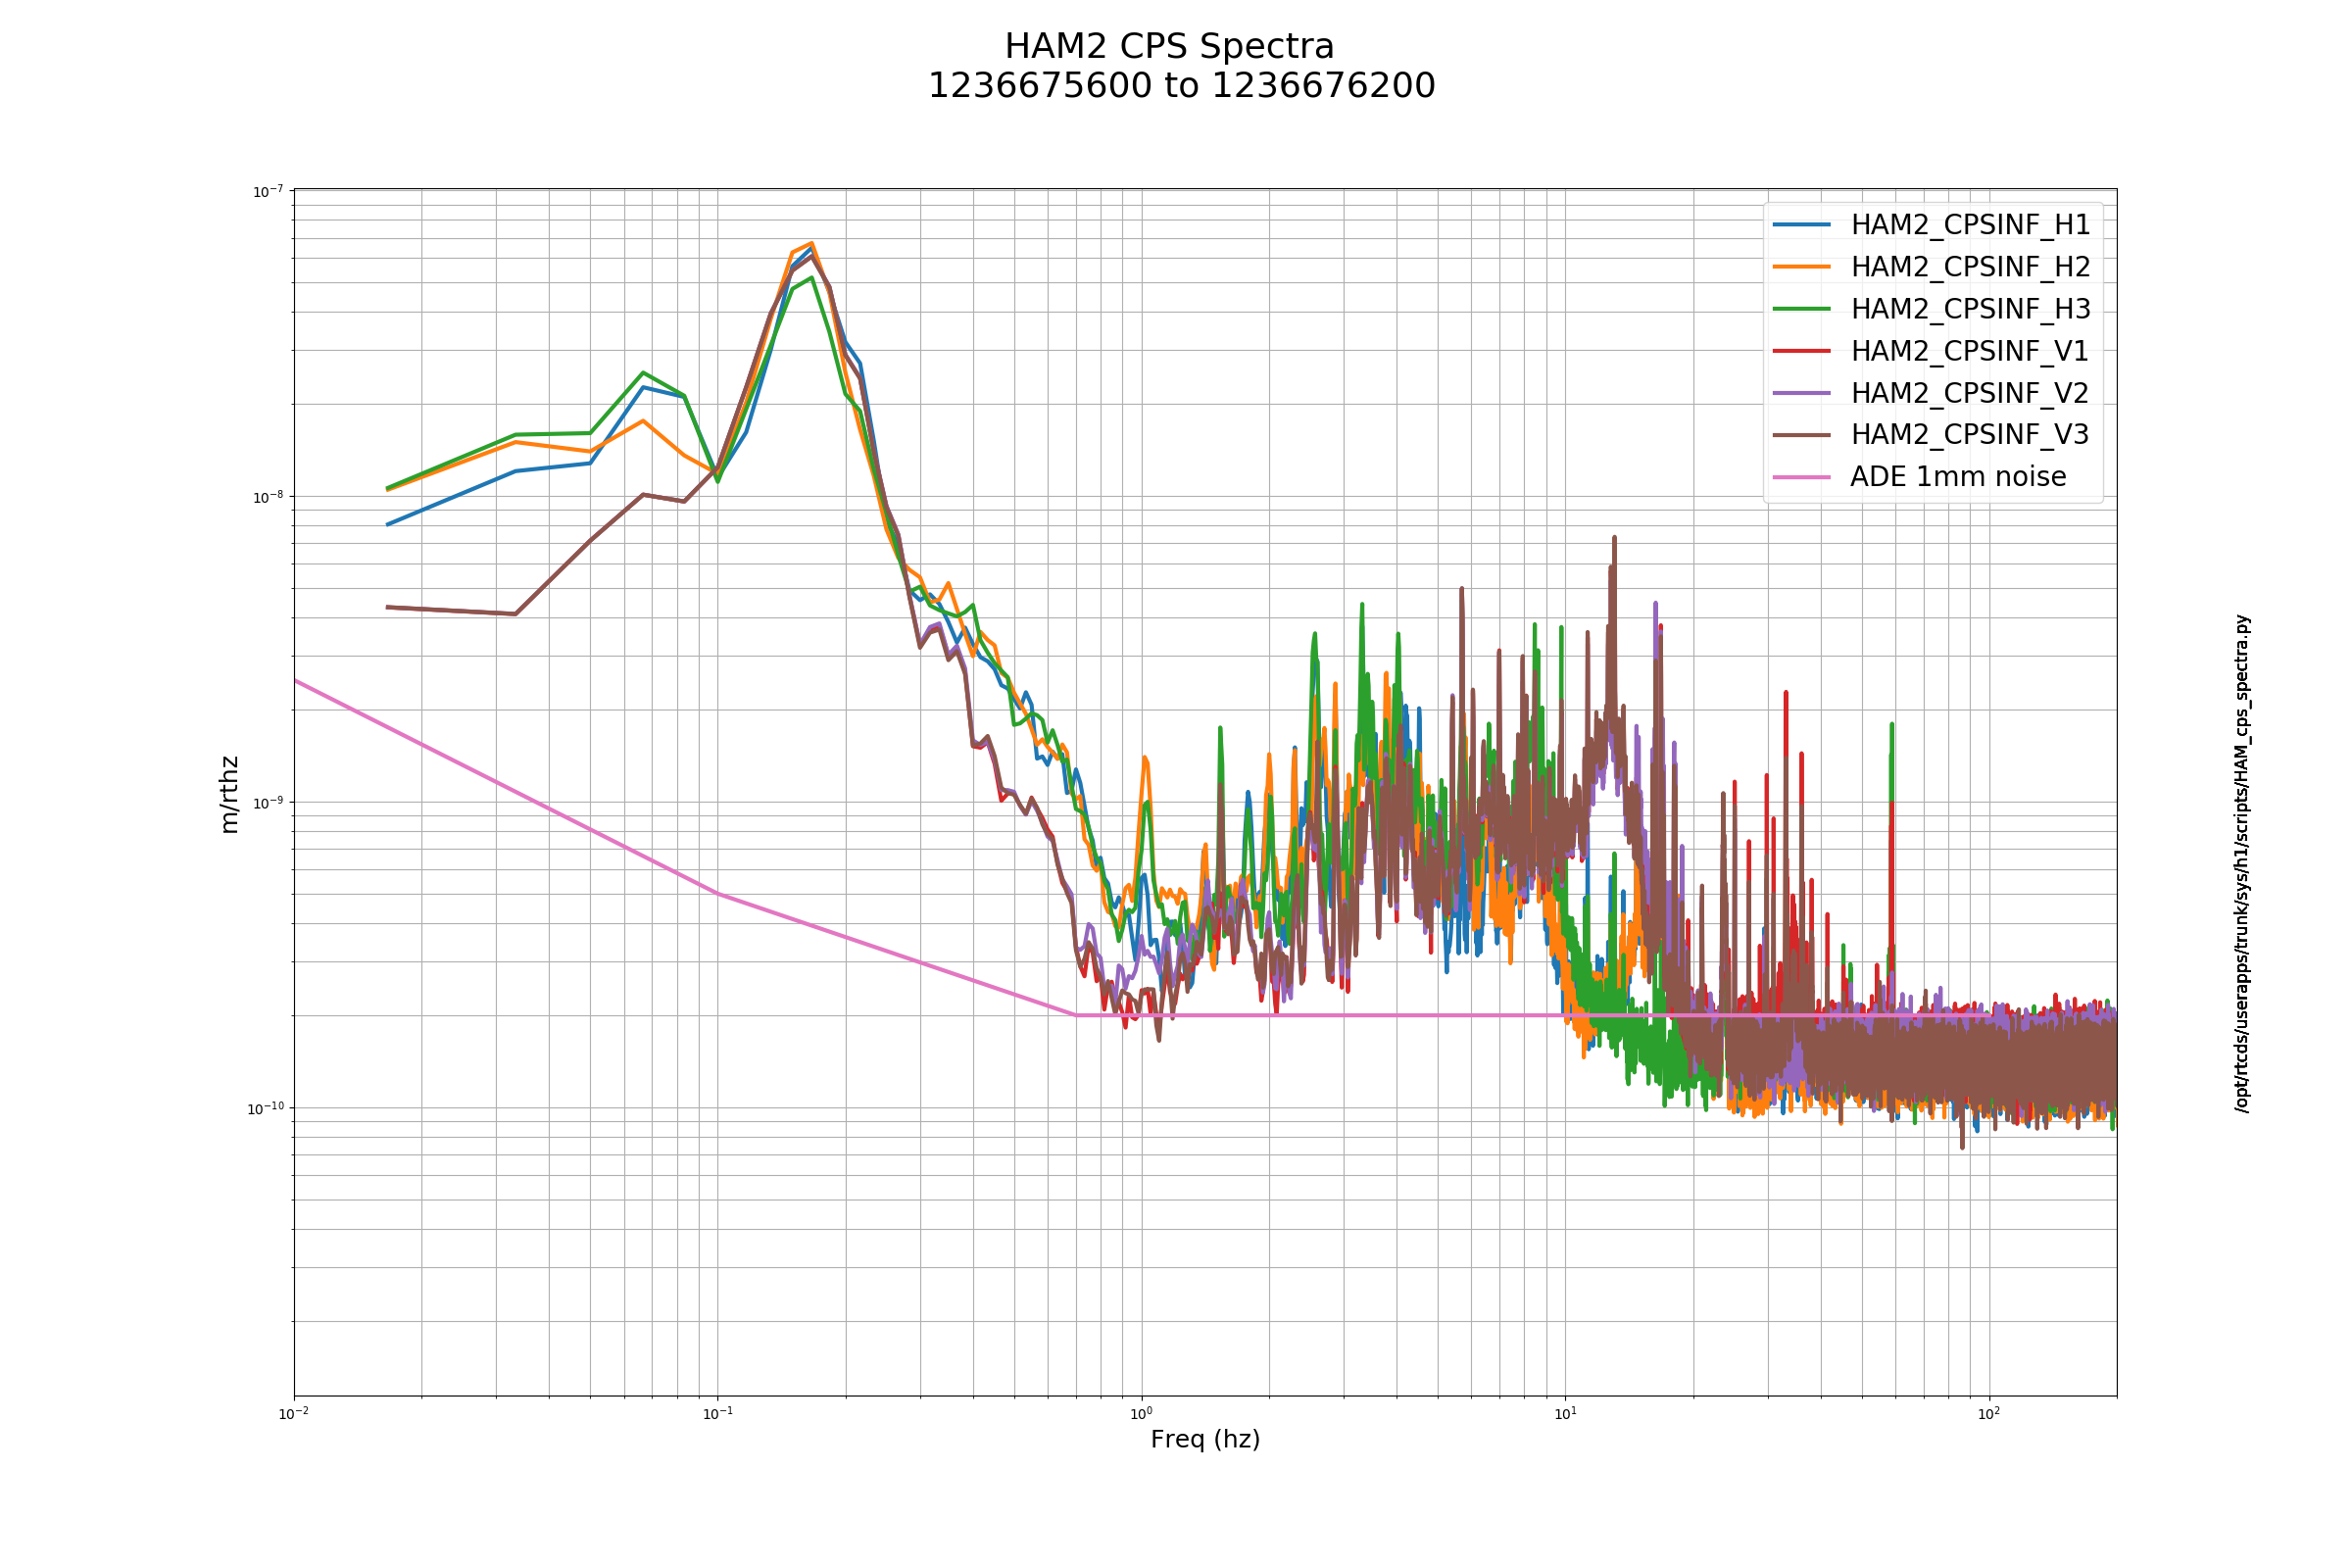
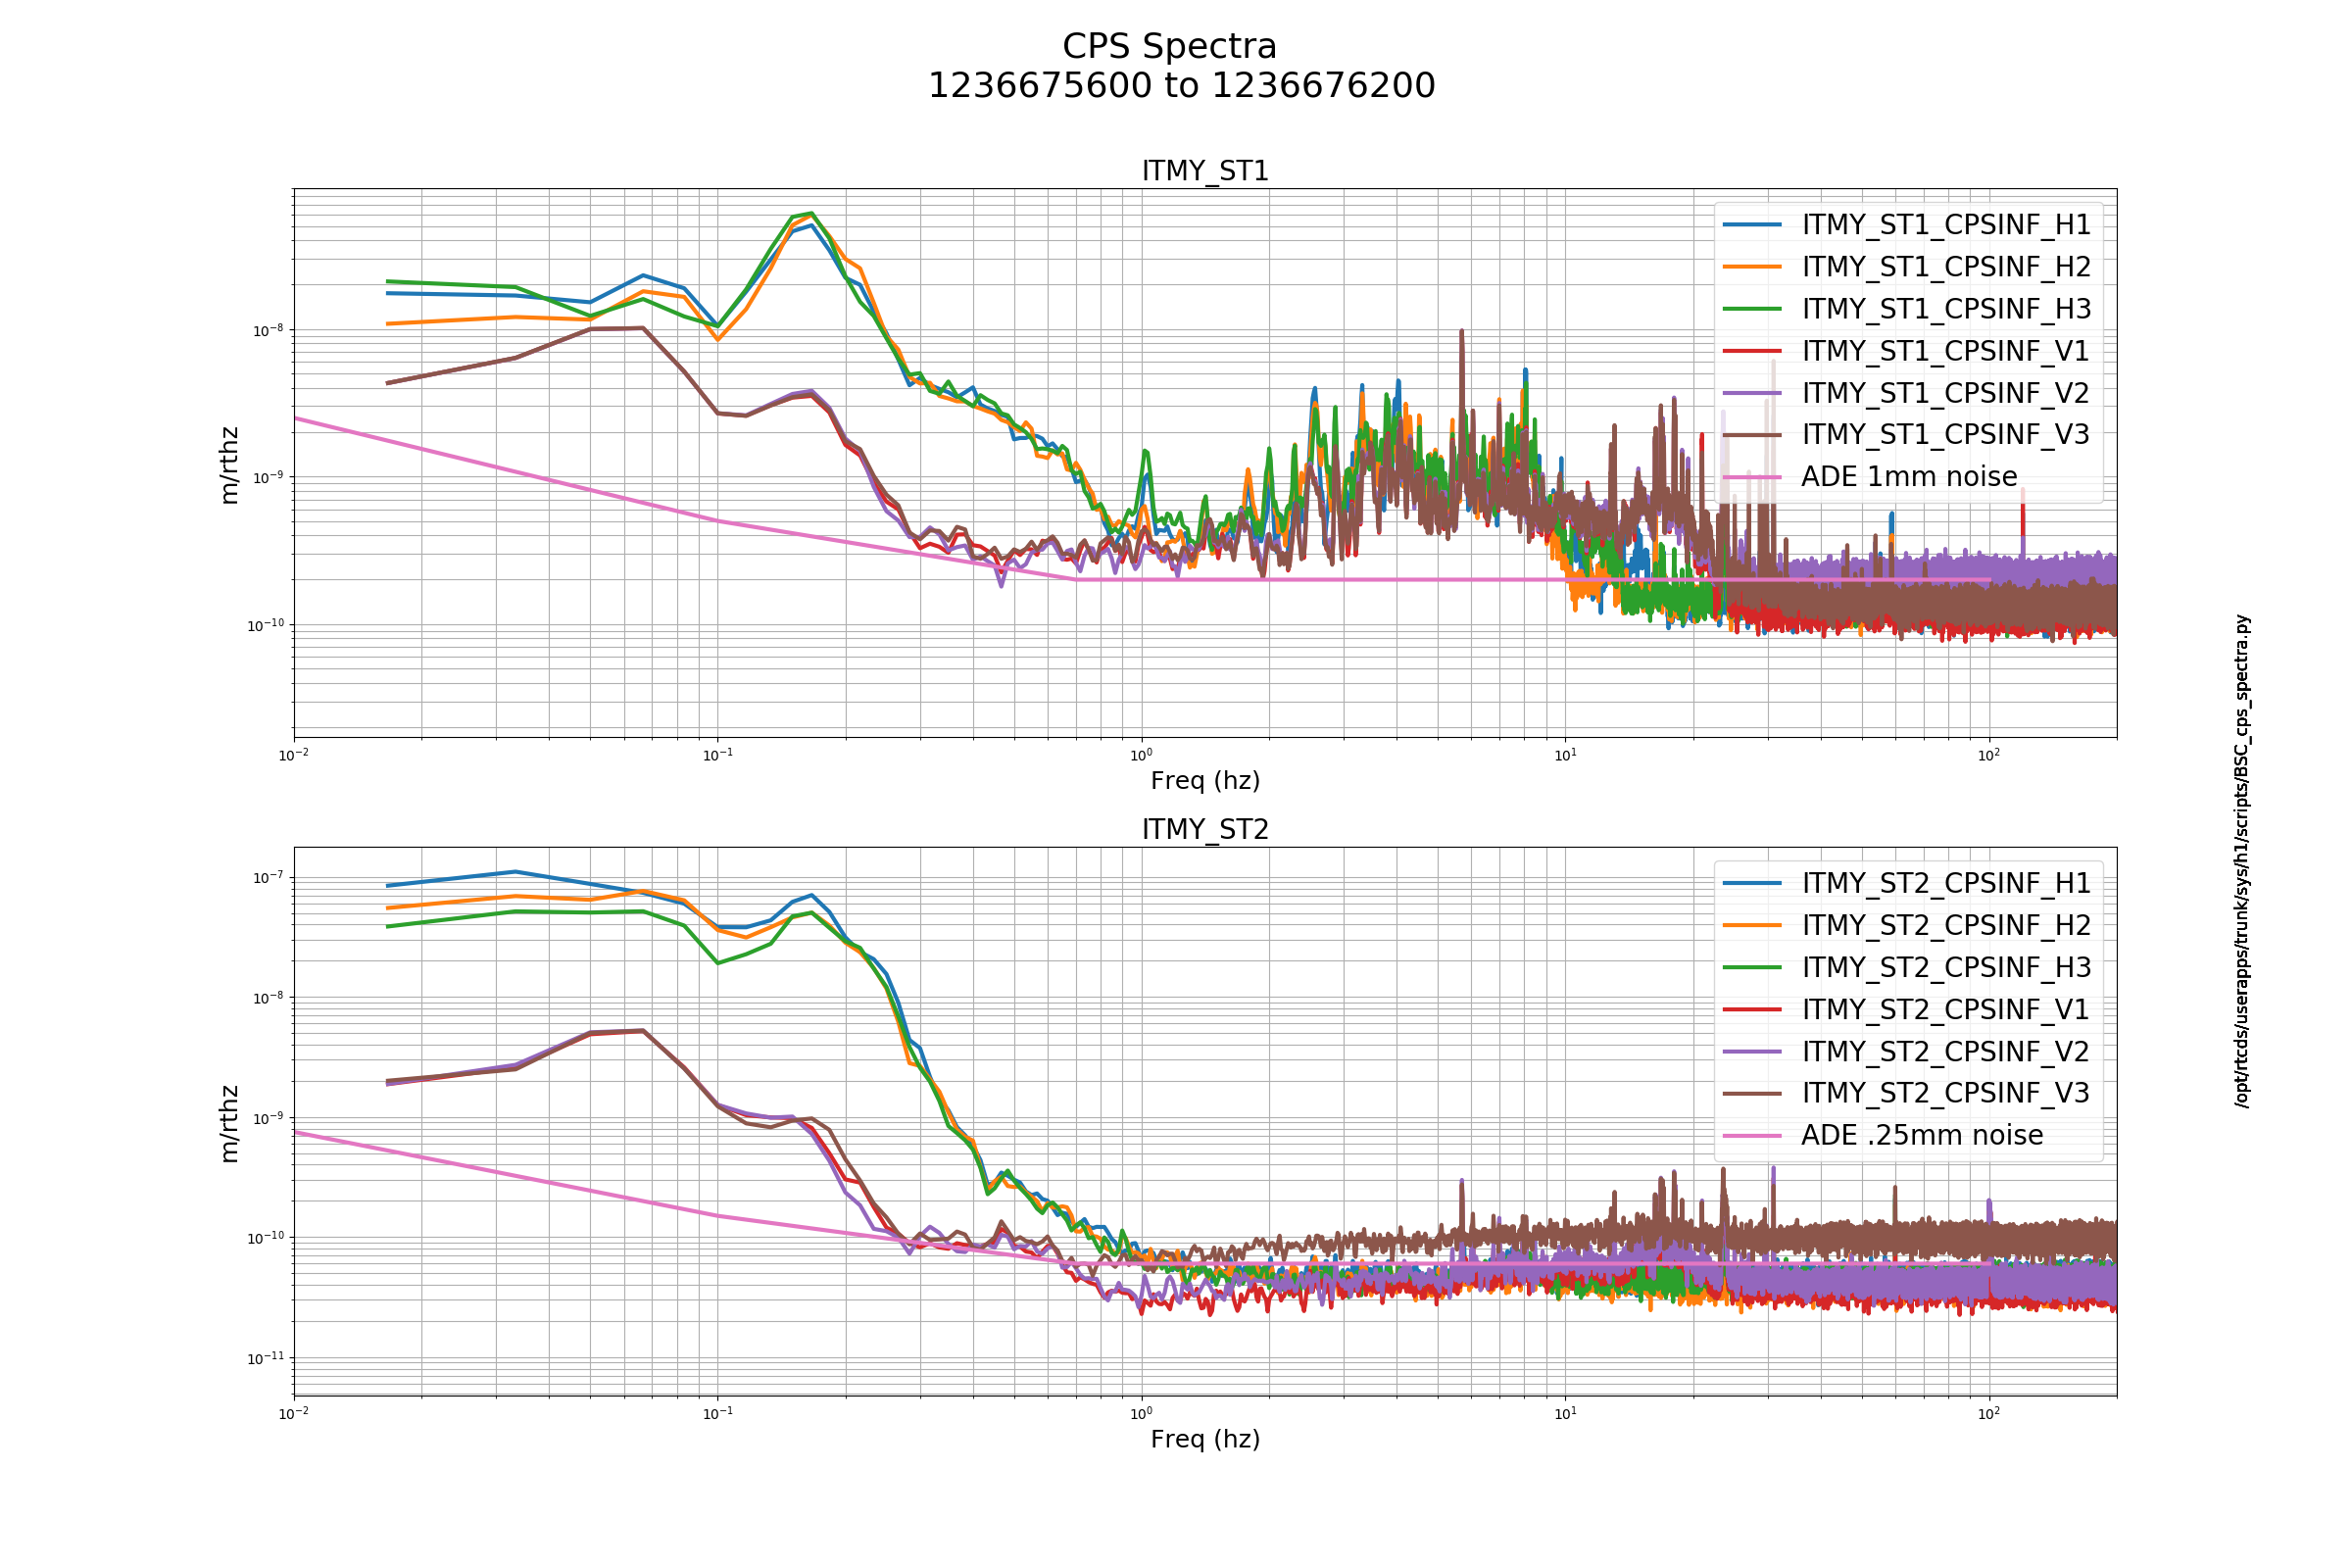
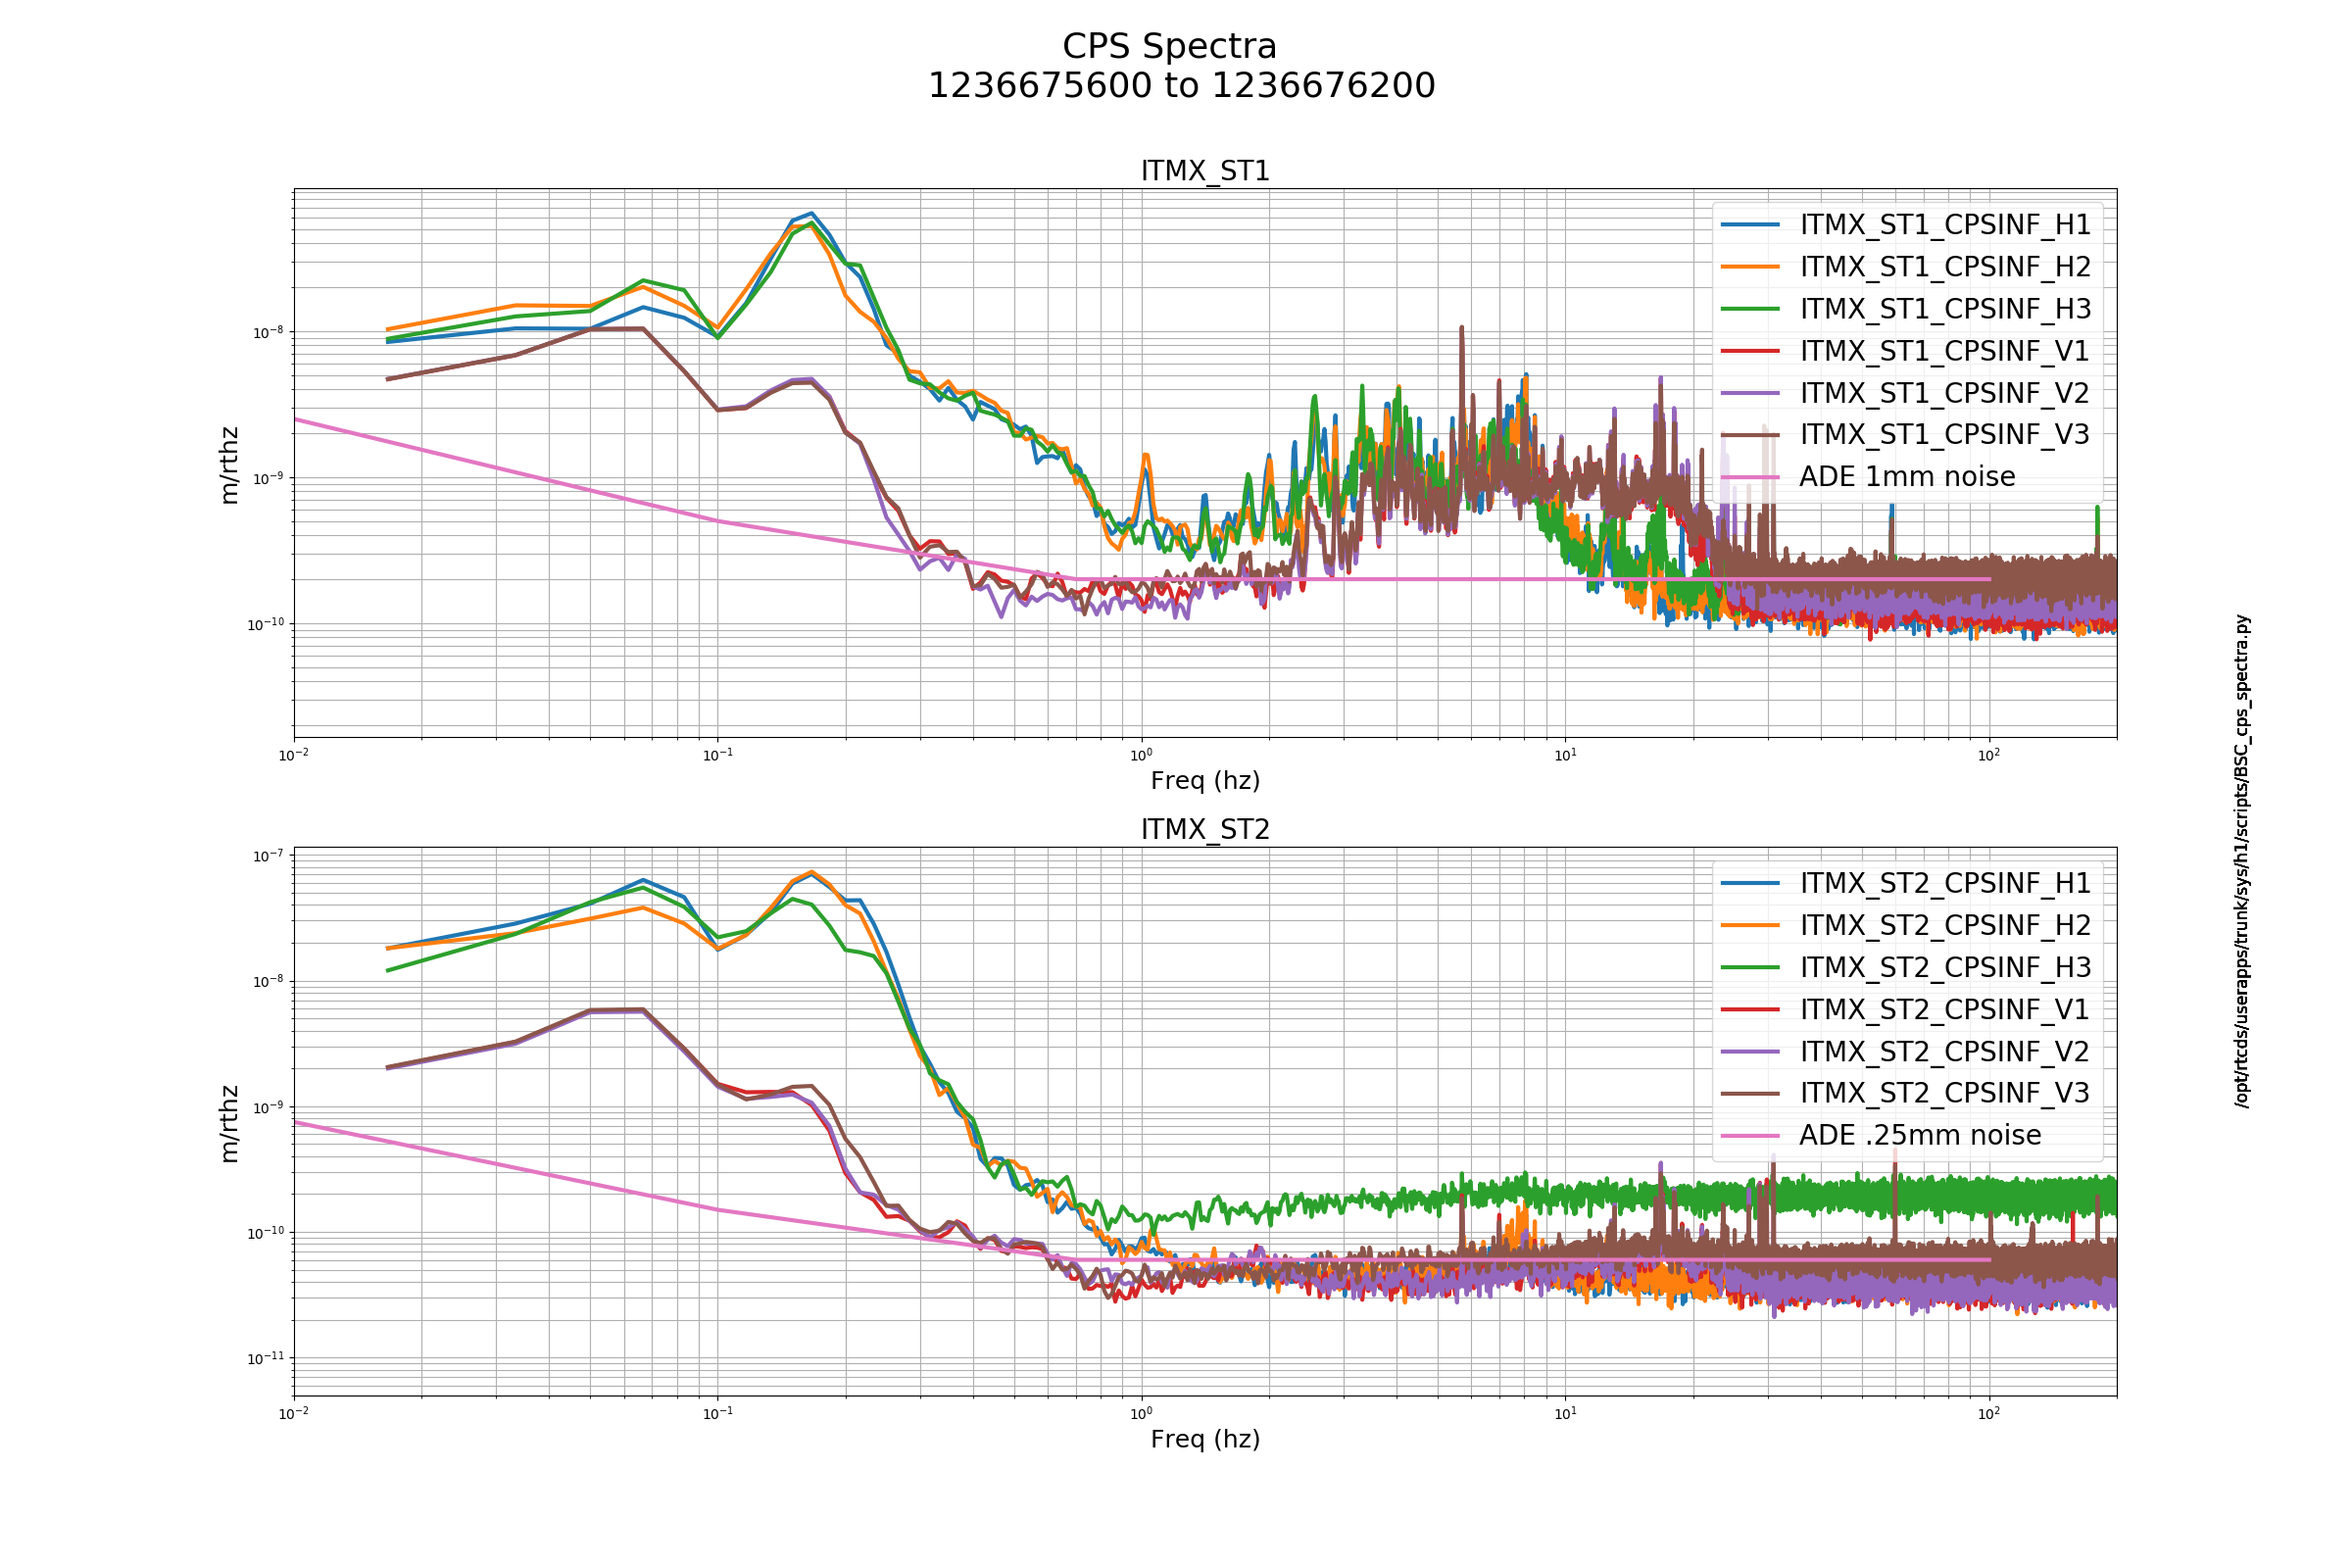
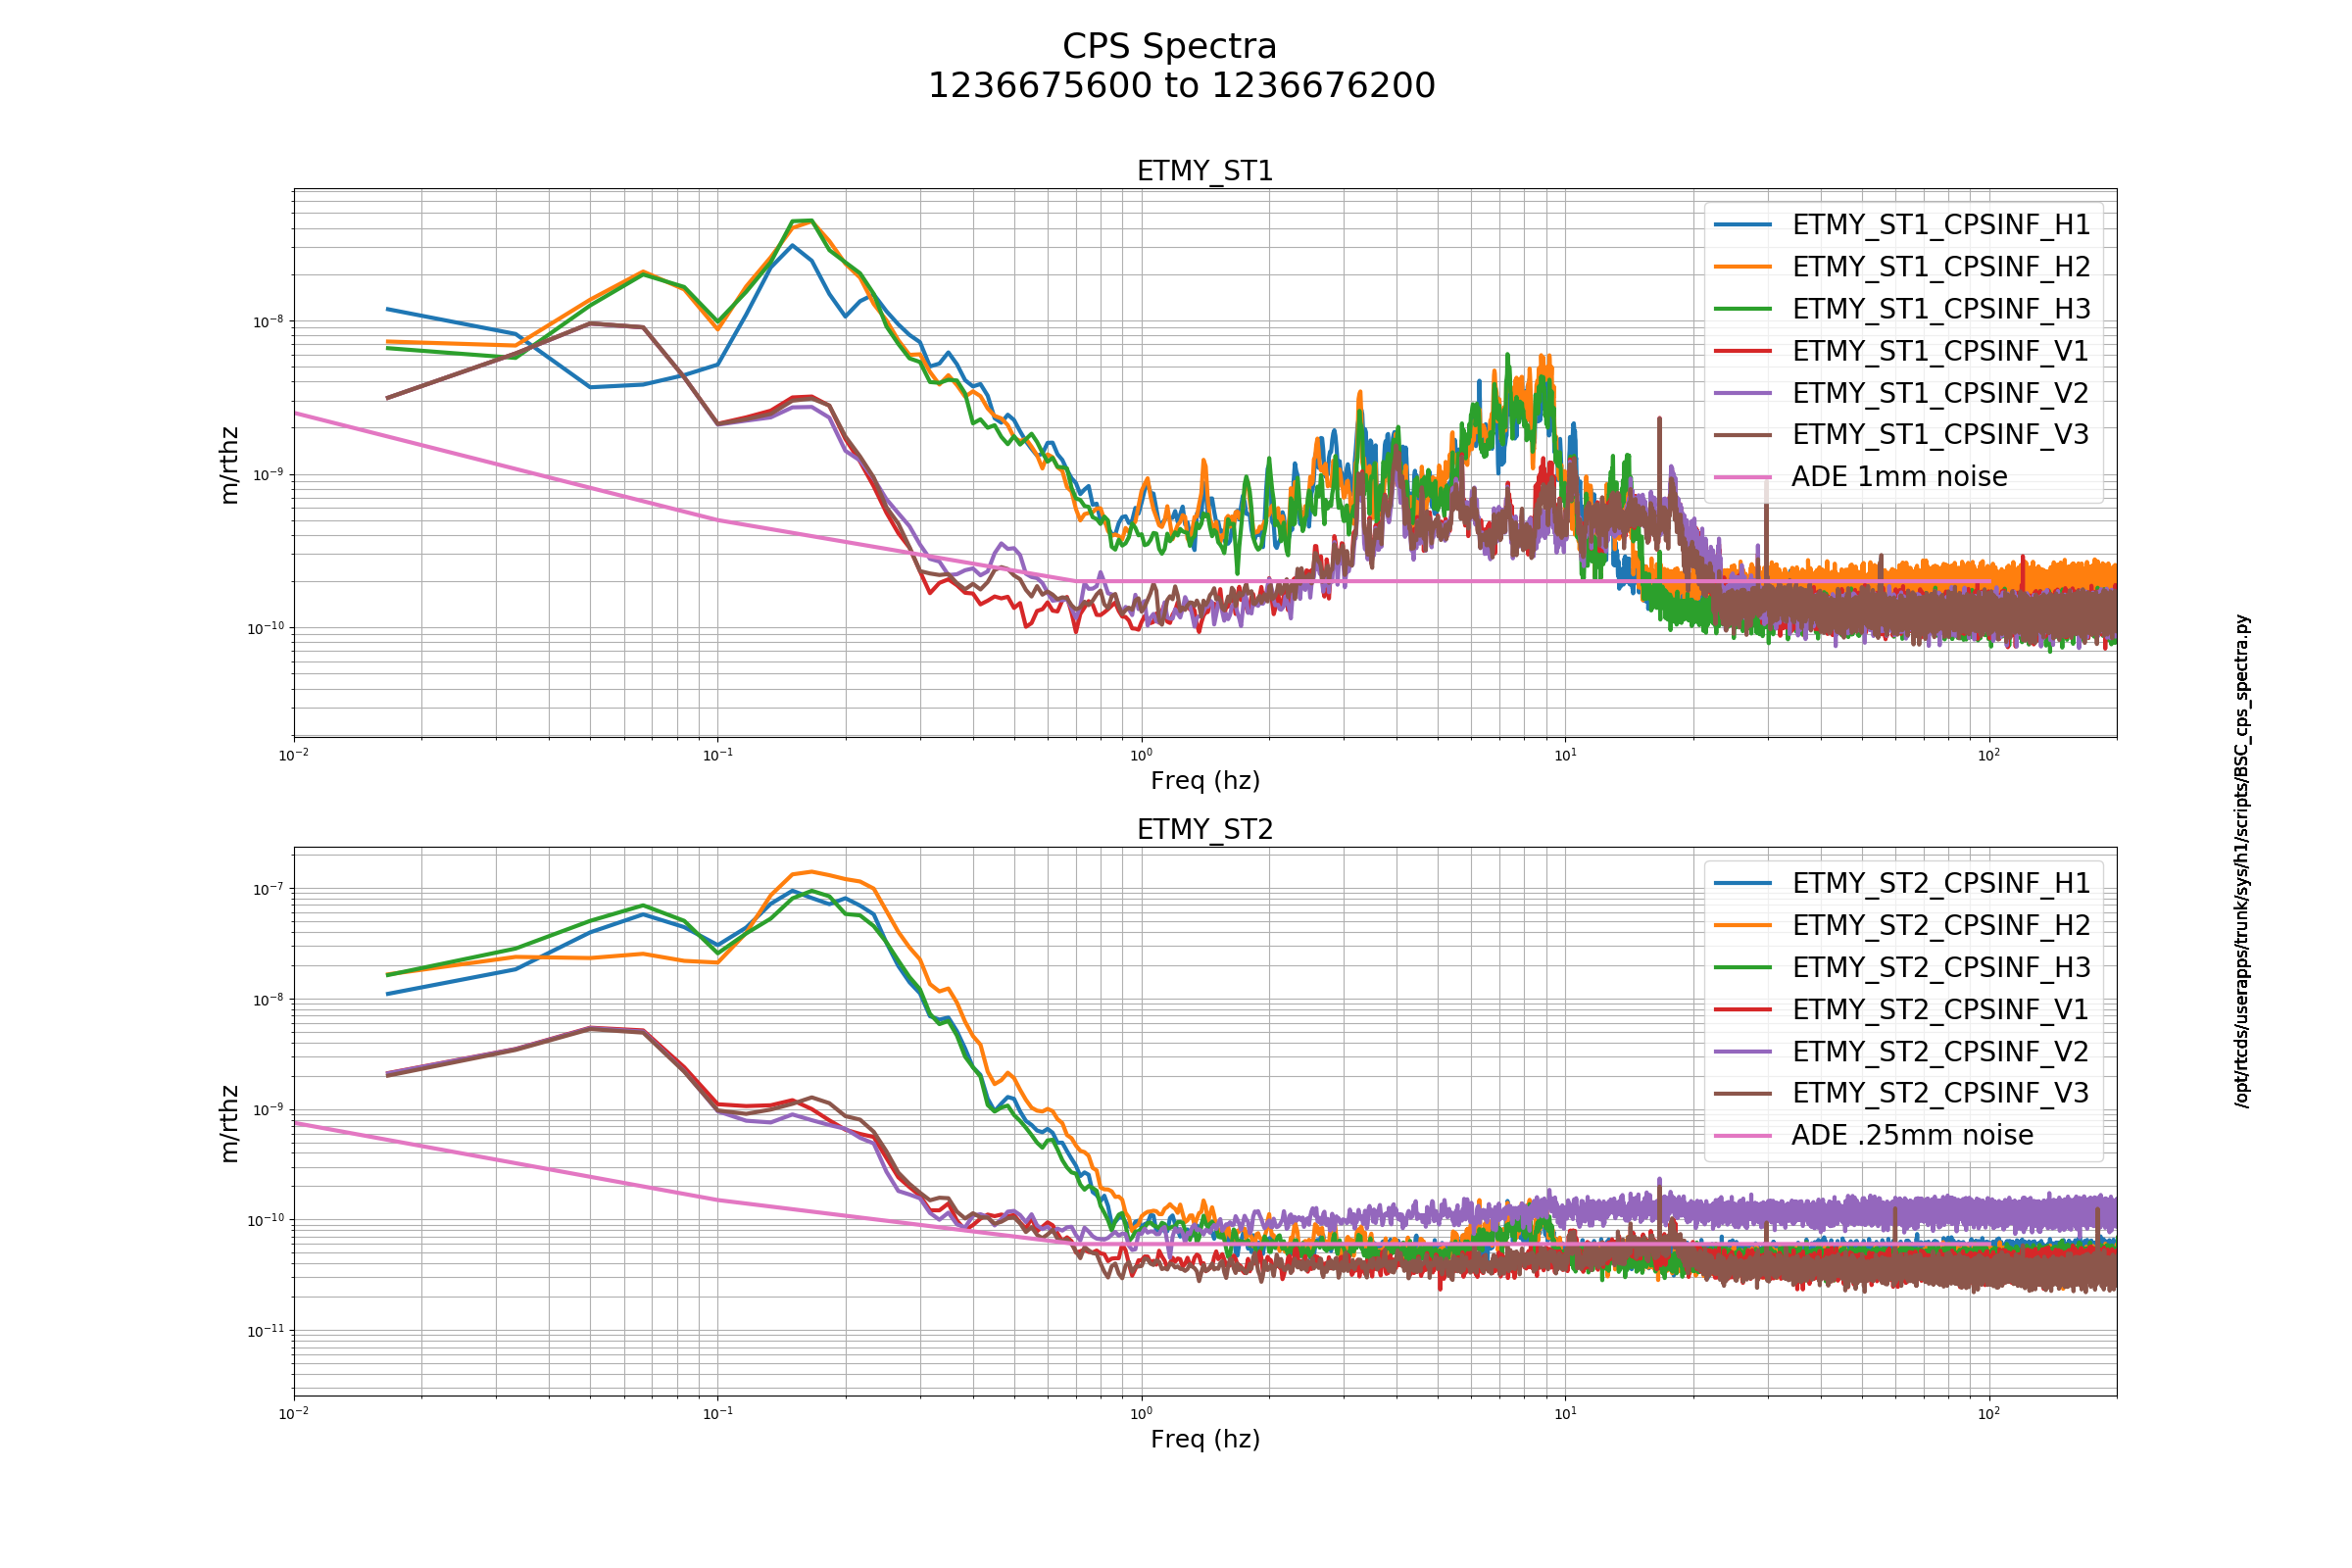
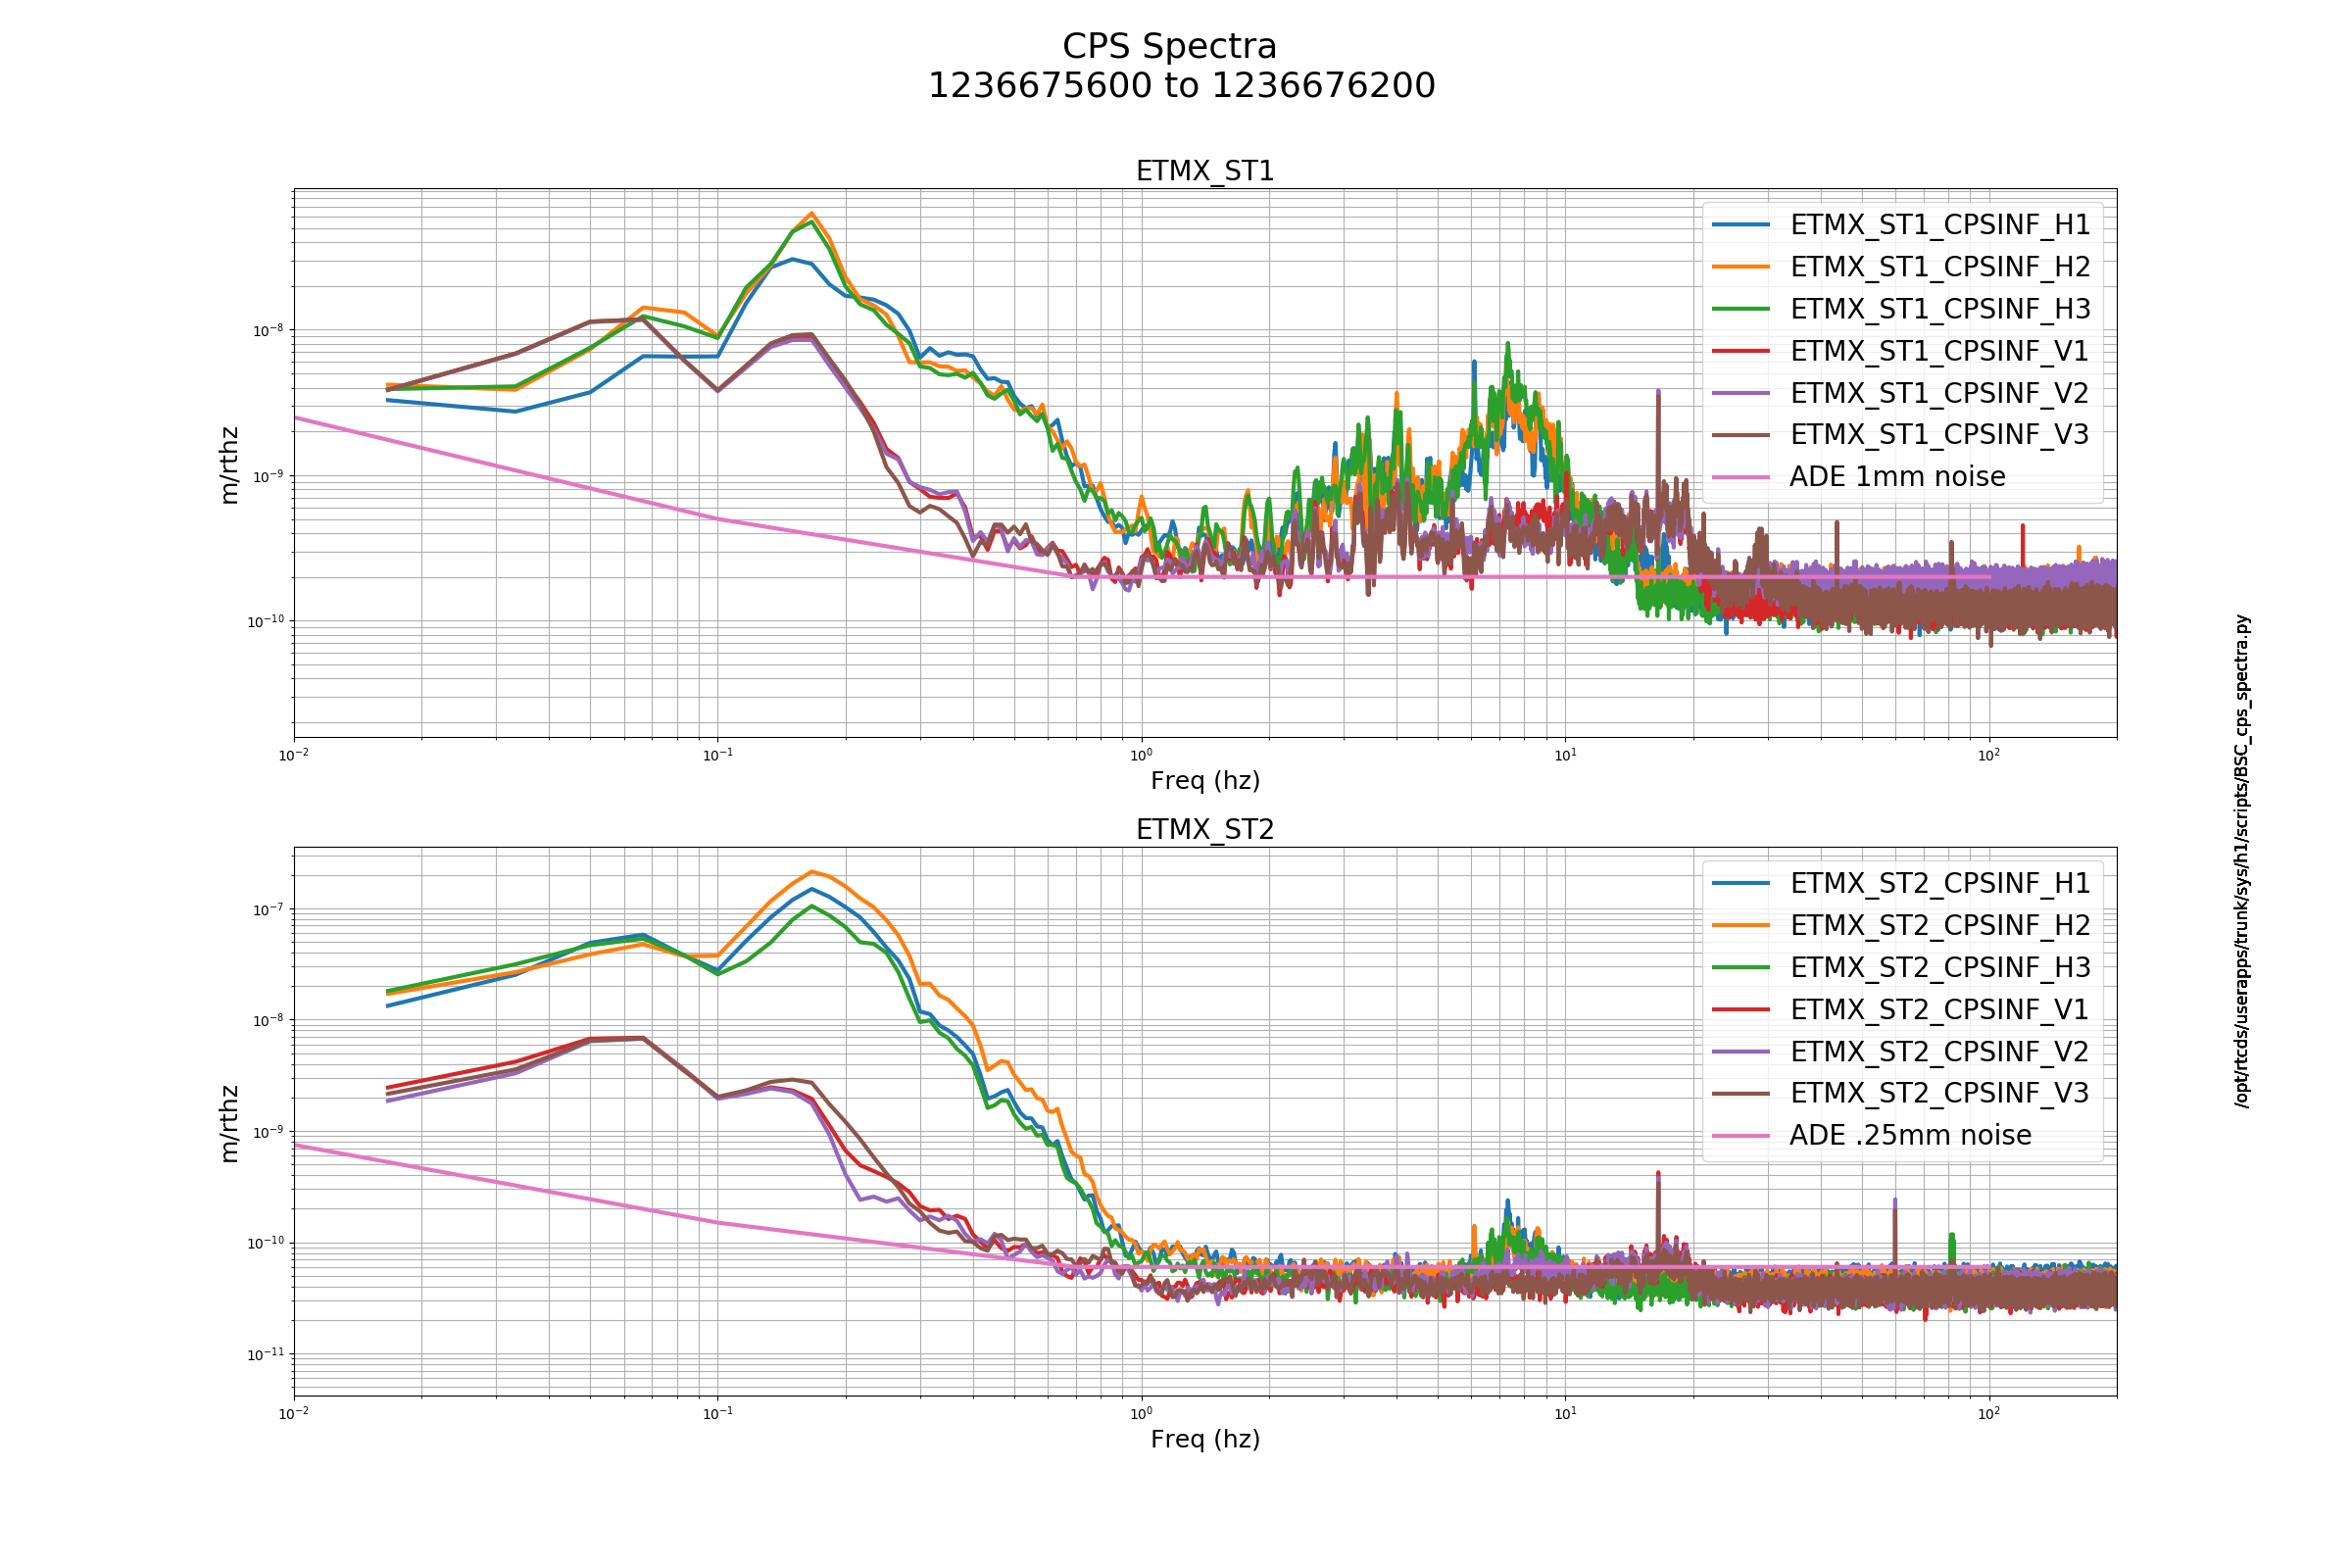
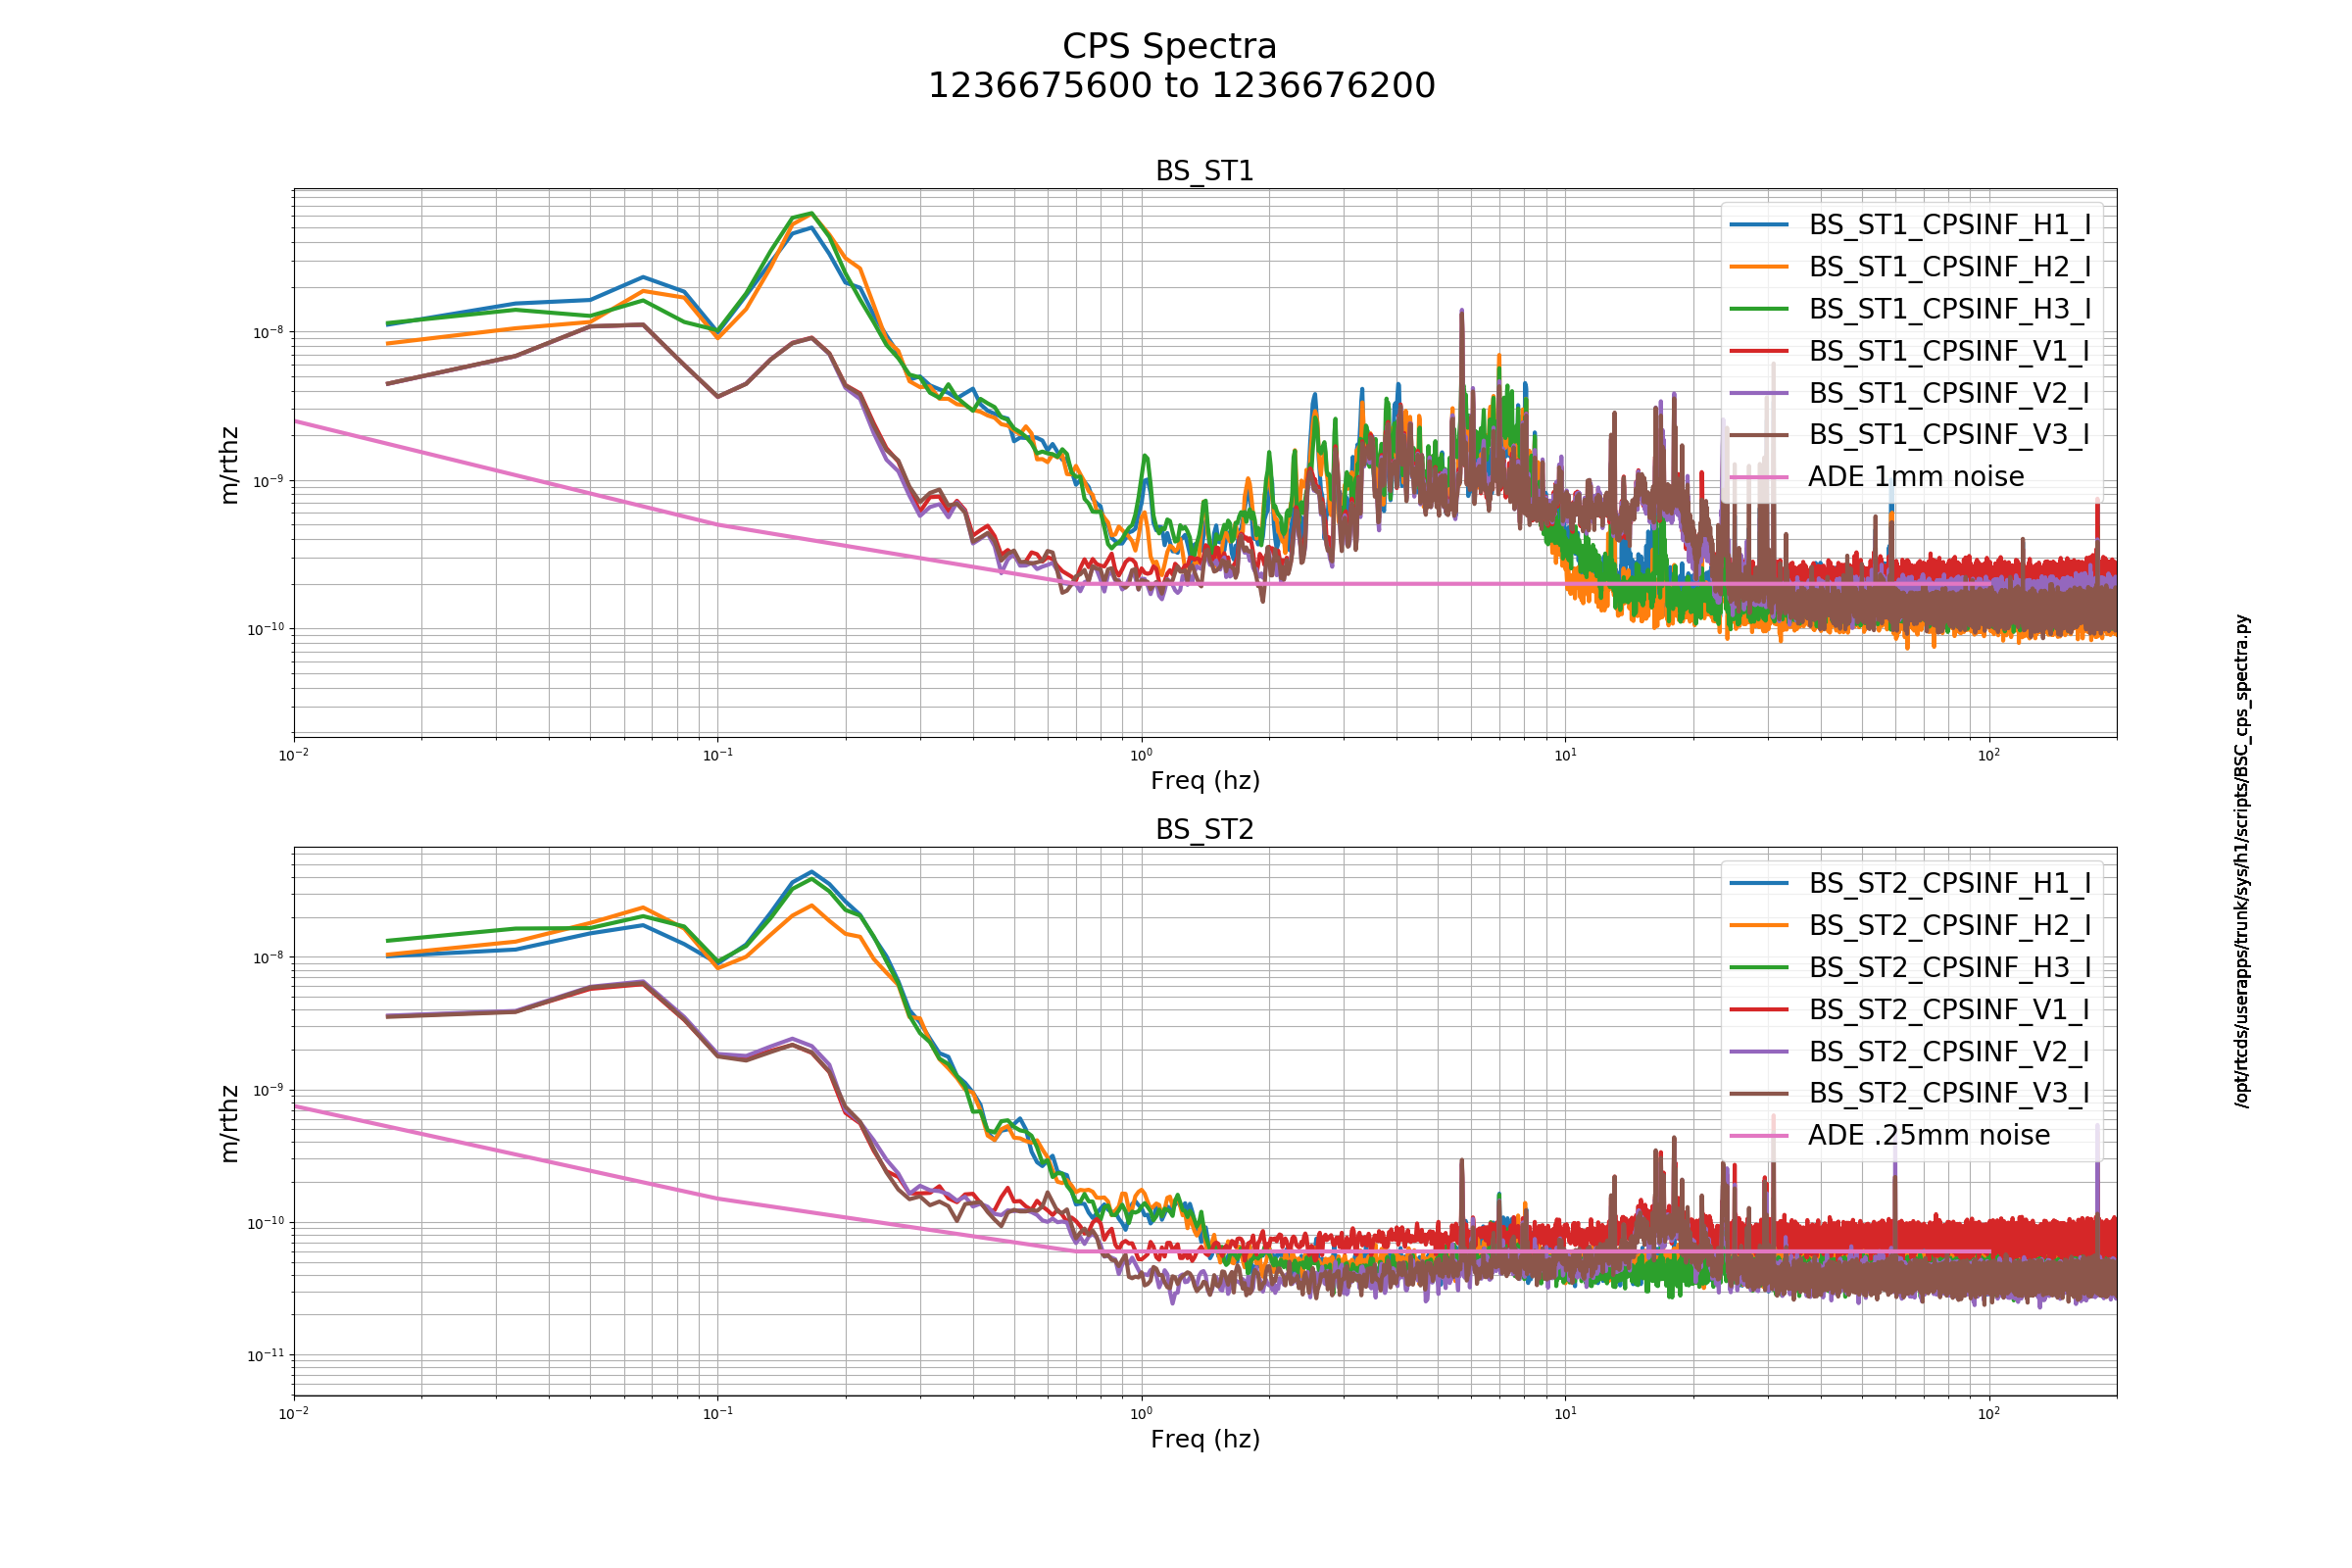
   Attached below are the CPI noise spectra plots. All the HAM look OK. ITMX_ST2_CPSINF_H3, ITMY_ST2_CPSINF_V2, ETMY_ST2_CPSINF_V2 are elevated on the BSC plots.  
Images attached to this report
H1 ISC
gabriele.vajente@LIGO.ORG - posted 12:08, Friday 15 March 2019 - last comment - 03:18, Saturday 16 March 2019(47563)
Scattered light from OMC motion: no evidence anymore

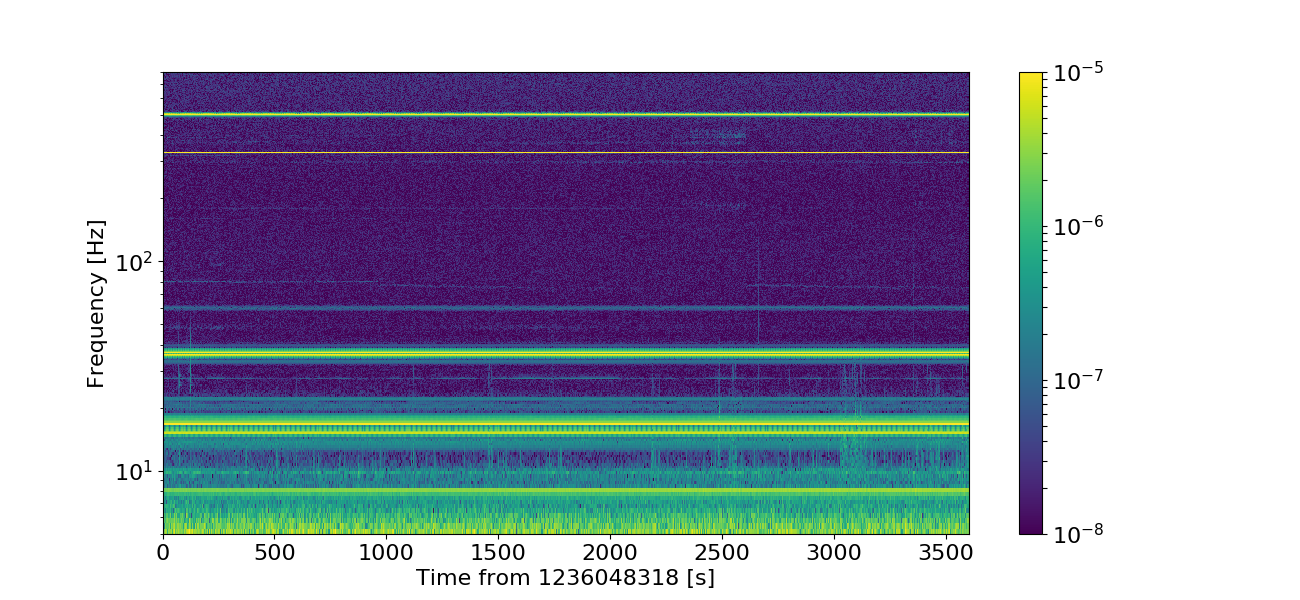
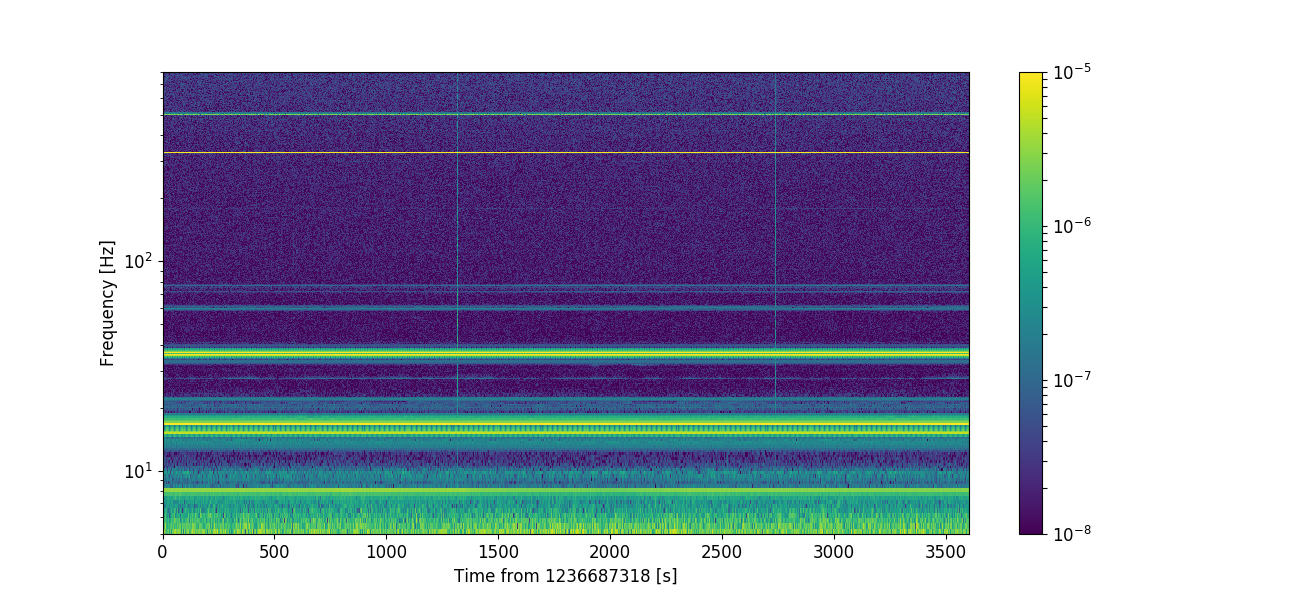
I compared spectrograms of CAL-DELTAL_EXTERNAL_DQ from an old lock when there was evidence of scattered light from OMC motion (47399, 2019-03-07 18:45:00 PST, 2019-03-08 02:45:00 UTC) with spectrograms from last night (2019-03-15 05:15:00 PDT, 2019-03-15 12:15:00 UTC, GPS: 1236687318).

In brief: there's no more evidence of scattered light noise at low frequency, see the comparison of the spectrograms below (left old, right new)


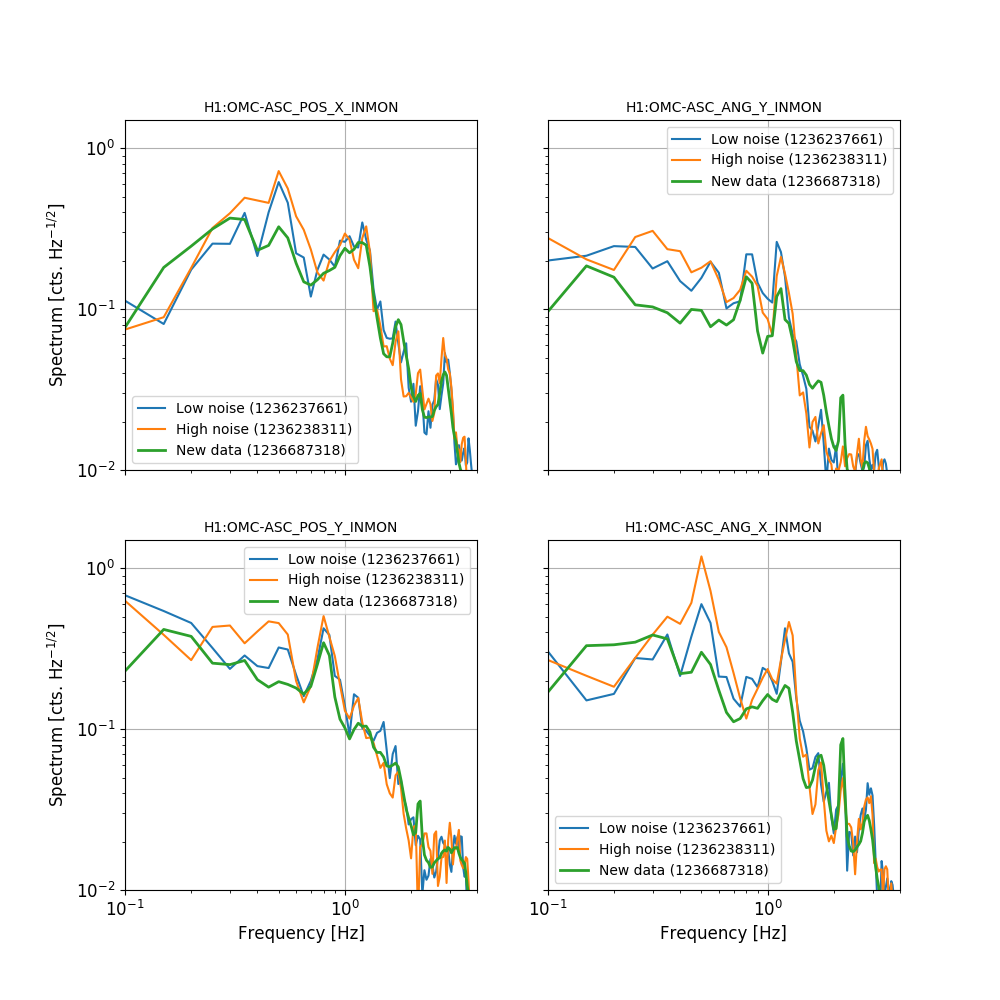
This might eb due to the fact that the OMC ASC signals all show much less motion. Below: high and low noise are two periods where there was high or low scattered light noise (correlated with OMC ASC motions), and new data is from last night. The OMC ASC signals move much less last night. This is probably due to the improvements described in 47488.


Images attached to this report
Comments related to this report
georgia.mansell@LIGO.ORG - 03:18, Saturday 16 March 2019 (47580)

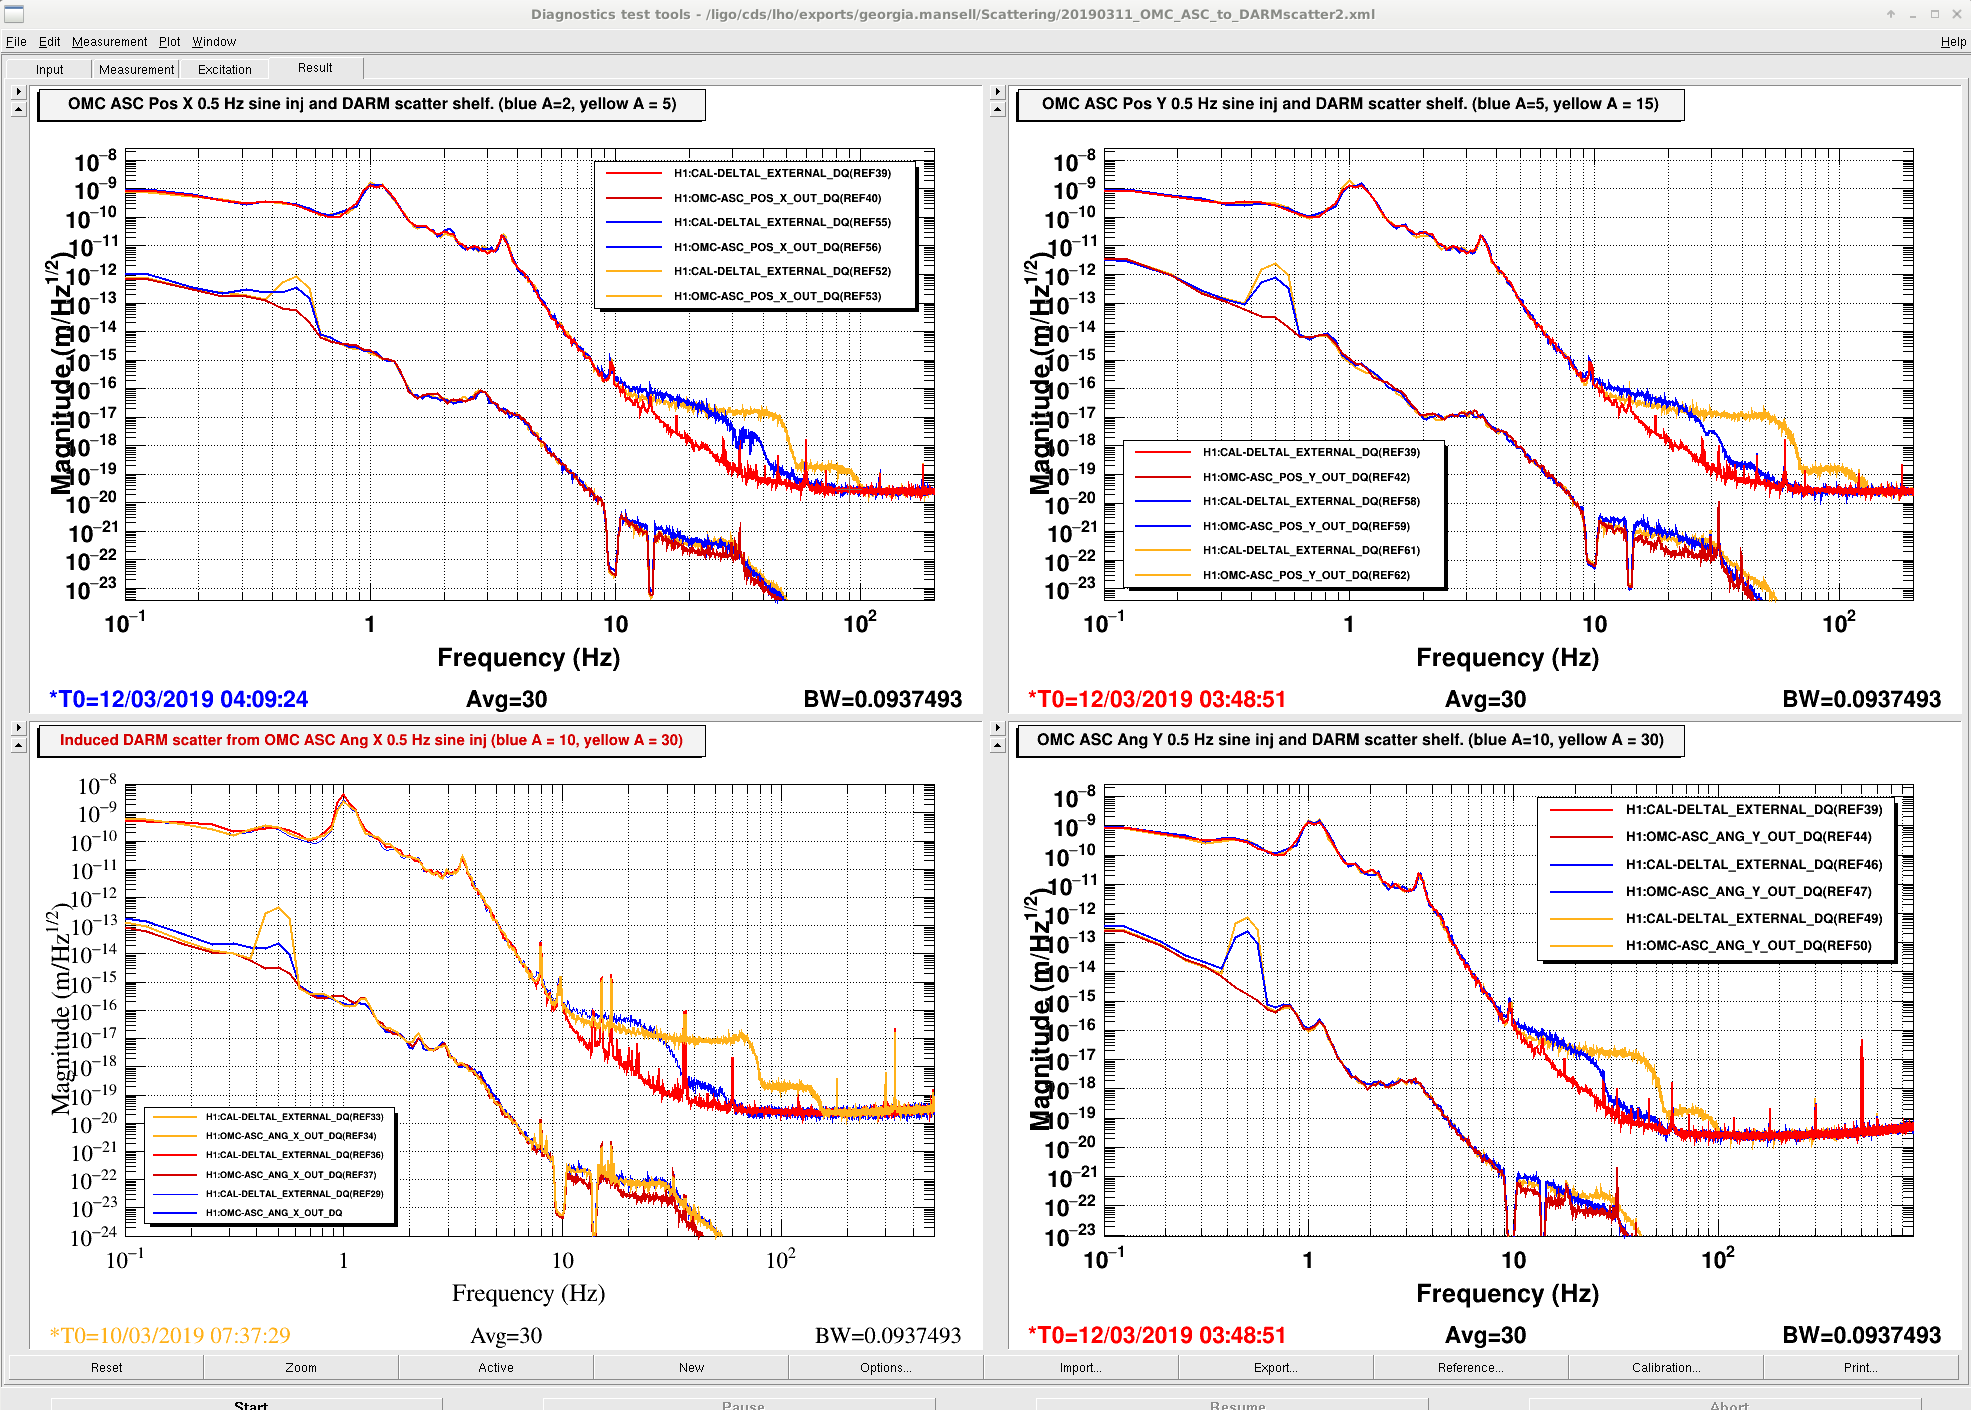
Craig, Georgia

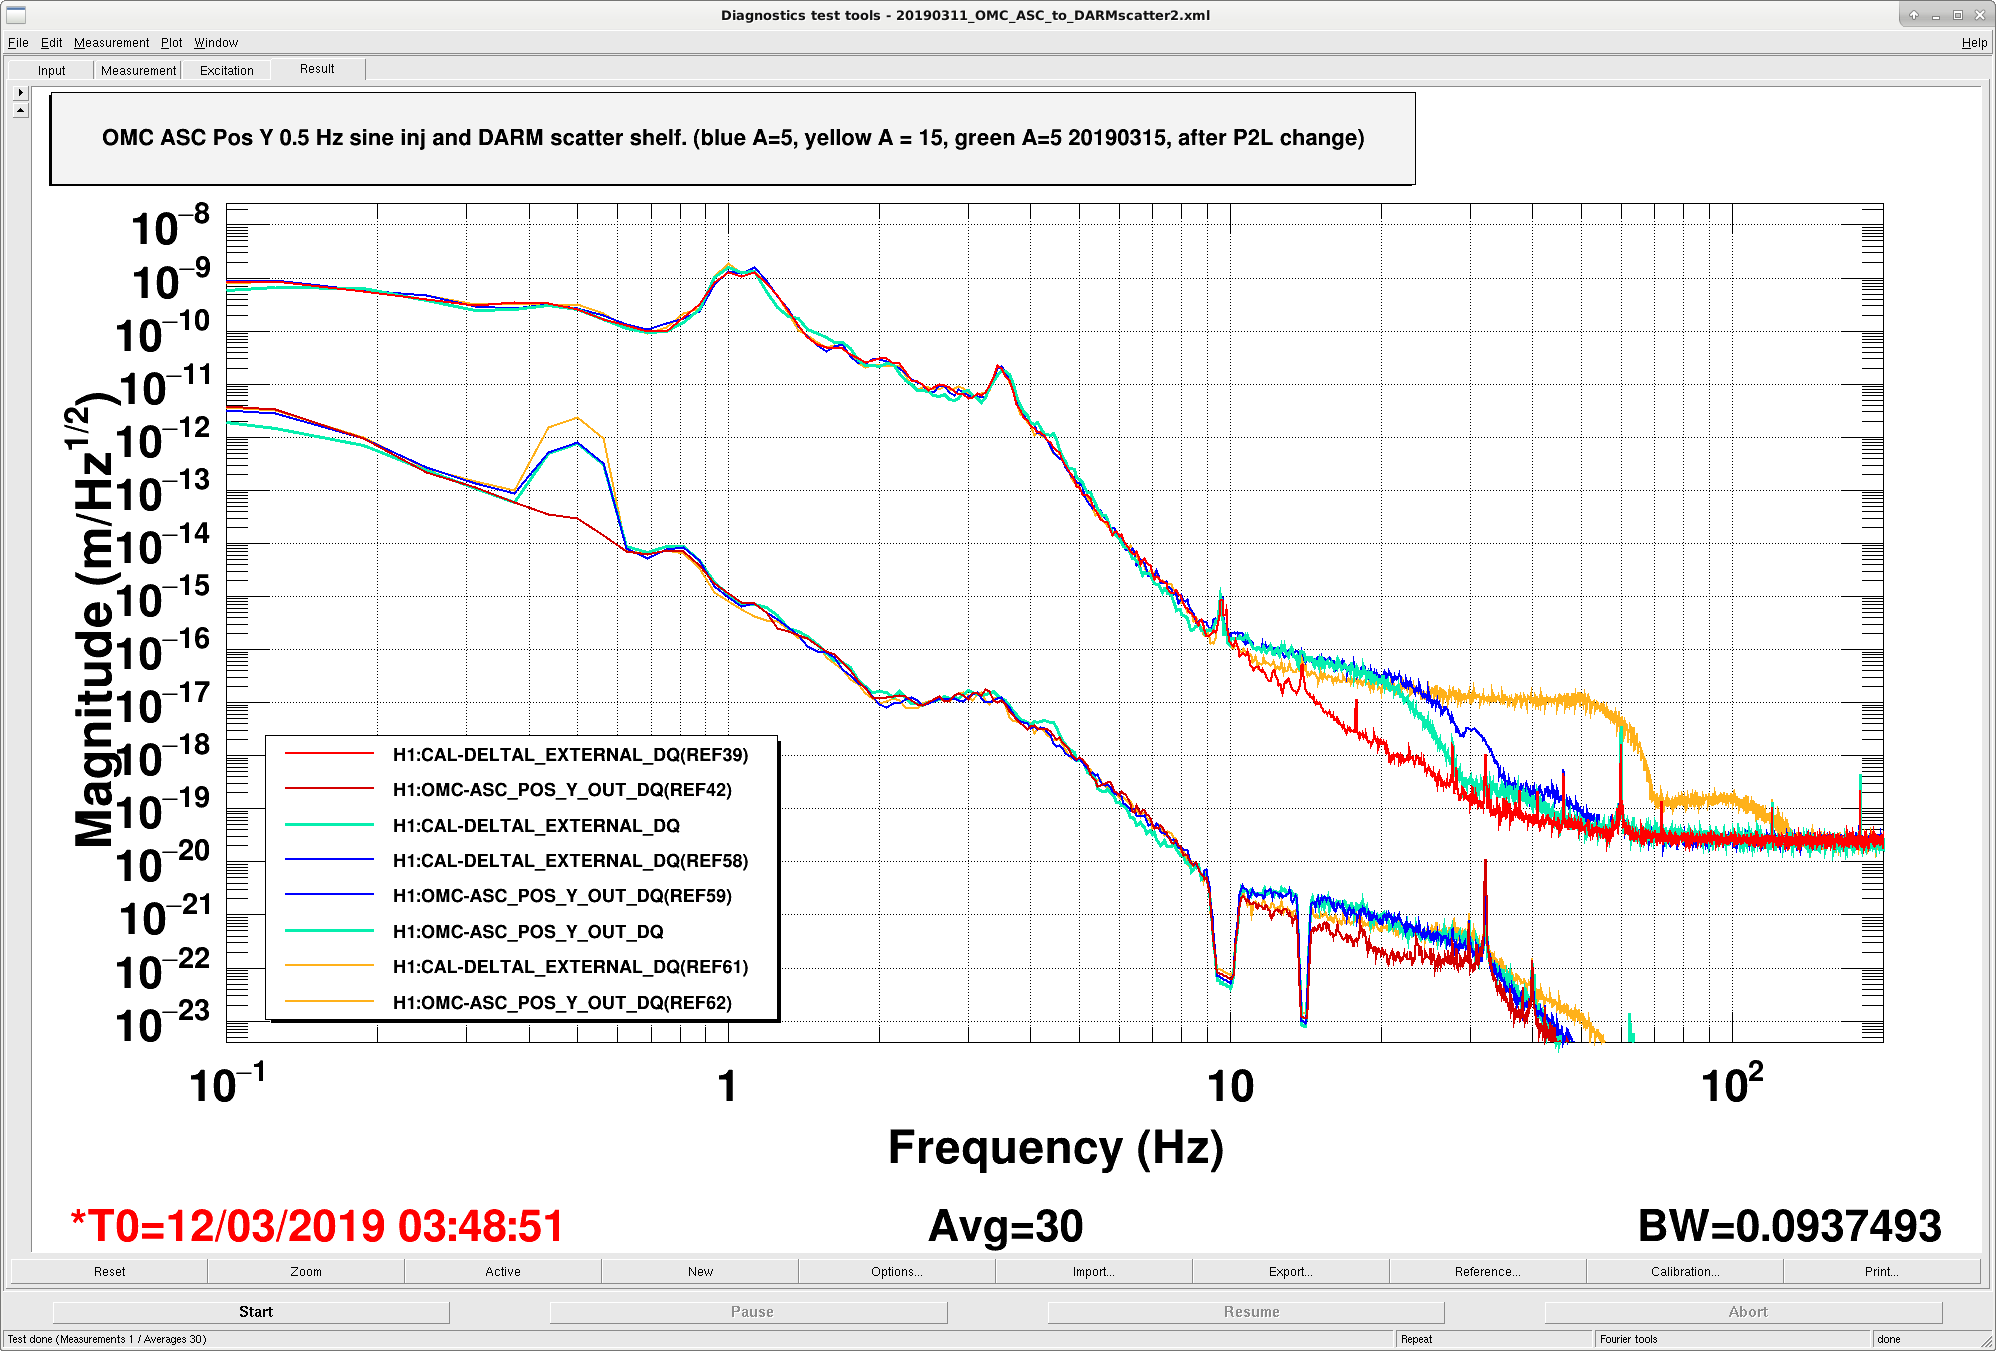
We re-ran a couple of the OMC ASC 0.5Hz injections, to check if updating the OMC A2L changed the coupling between the ASC and DARM as well as reducing the noise in the ASC as reported above by Gabriele.

Attached plot is the same as the top right shown here, the new green trace is the same excitation as the blue ran today. There is a slight difference in the middle fringe but broadband this excitation couples the same to DARM as before the OMC A2L change.

We ran the larger (A=15) excitation on POS_Y and the coupling looked identical to the orange trace, i.e. no change with the A2L change. We also ran these excitations on the POS_X degree of freedom and saw the same behaviour - identical coupling for the large excitation and similar-but-slightly-reduced for the small excitation.

Images attached to this comment
H1 SQZ (SQZ)
nutsinee.kijbunchoo@LIGO.ORG - posted 12:02, Friday 15 March 2019 - last comment - 12:52, Friday 15 March 2019(47562)
A Quick SQZ Loss Estimate

Sheila, Nutsinee

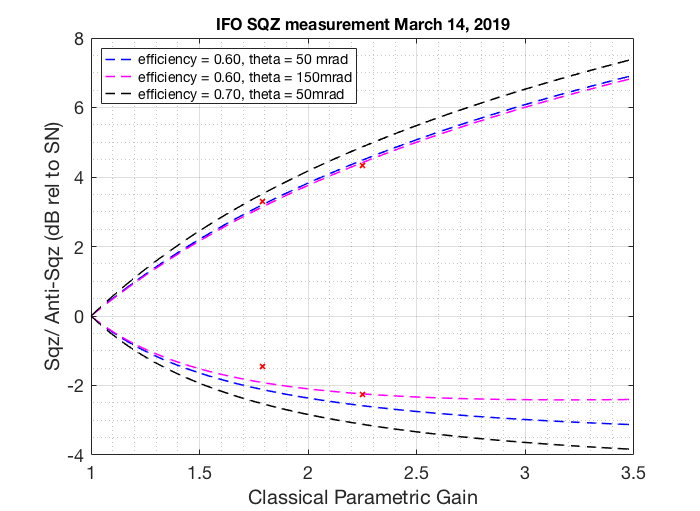
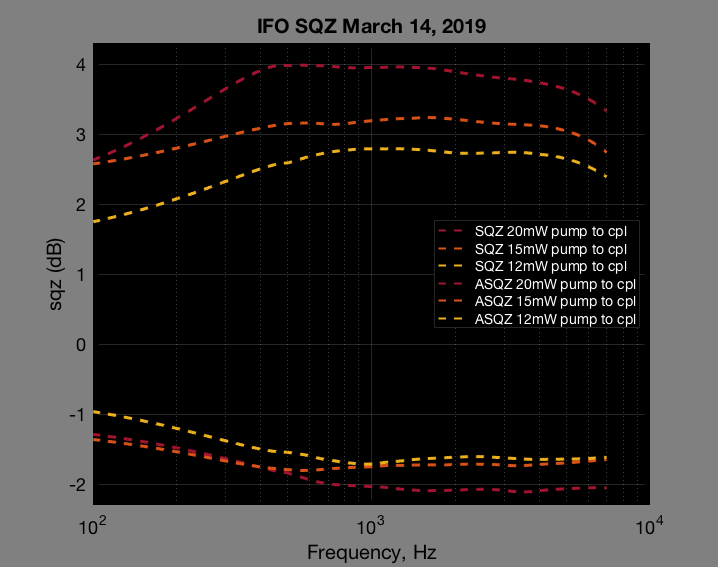
Here I plot a quick couple of data points from yesterday's measurement. A more detail analysis will come later (extracting sqz/asqz from higher averages DARM spectrum and fitting with the Monte Carlo). These sqz/asqz data points were acquired using the 10s average blrms around 1.65kHz. The loss of 40% fits the measurement pretty well (same as Livingston). We need more non linear gain to accurately determine the phase noise.

Images attached to this report
Comments related to this report
nutsinee.kijbunchoo@LIGO.ORG - 12:52, Friday 15 March 2019 (47564)

Attached a sqz/asqz vs. frequency plot.


Images attached to this comment
H1 ISC
jenne.driggers@LIGO.ORG - posted 10:57, Friday 15 March 2019 (47560)
Locking notes - ALS X glitches; 74.75 Hz frequency line makes it impossible to lock.
H1 General
jeffrey.bartlett@LIGO.ORG - posted 10:03, Friday 15 March 2019 (47558)
Ops Day Shift Transition
Ops Shift Transition: 03/15/2019, Day Shift 15:00 – 23:00 (08:00 -16:00) - UTC (PT)
State of H1: Unlocked
Intent Bit: Locking
Weather: Forecast for partly cloudy today with temperatures into the mid 40s. Winds are calm.
Primary 0.03 – 0.1Hz: 0.09um/s
Secondary 0.1 – 0.3Hz: 0.2mu/s
Outgoing Operator: N/A
Quick Summary: The IFO was unlocked at the start of shift. After two locking attempts ran an initial alignment. IFO was regularly breaking lock at DARM_TO_RF. Holding the IFO at LOCKING_ARMS_GREEN. There is glitching in the X-Arm Green. Commissioners are looking into the issue.     
H1 TCS (TCS)
daniel.brown@LIGO.ORG - posted 06:21, Friday 15 March 2019 - last comment - 22:43, Saturday 16 March 2019(47555)
SR3 heater test round three

Dan, Danny, Alexei

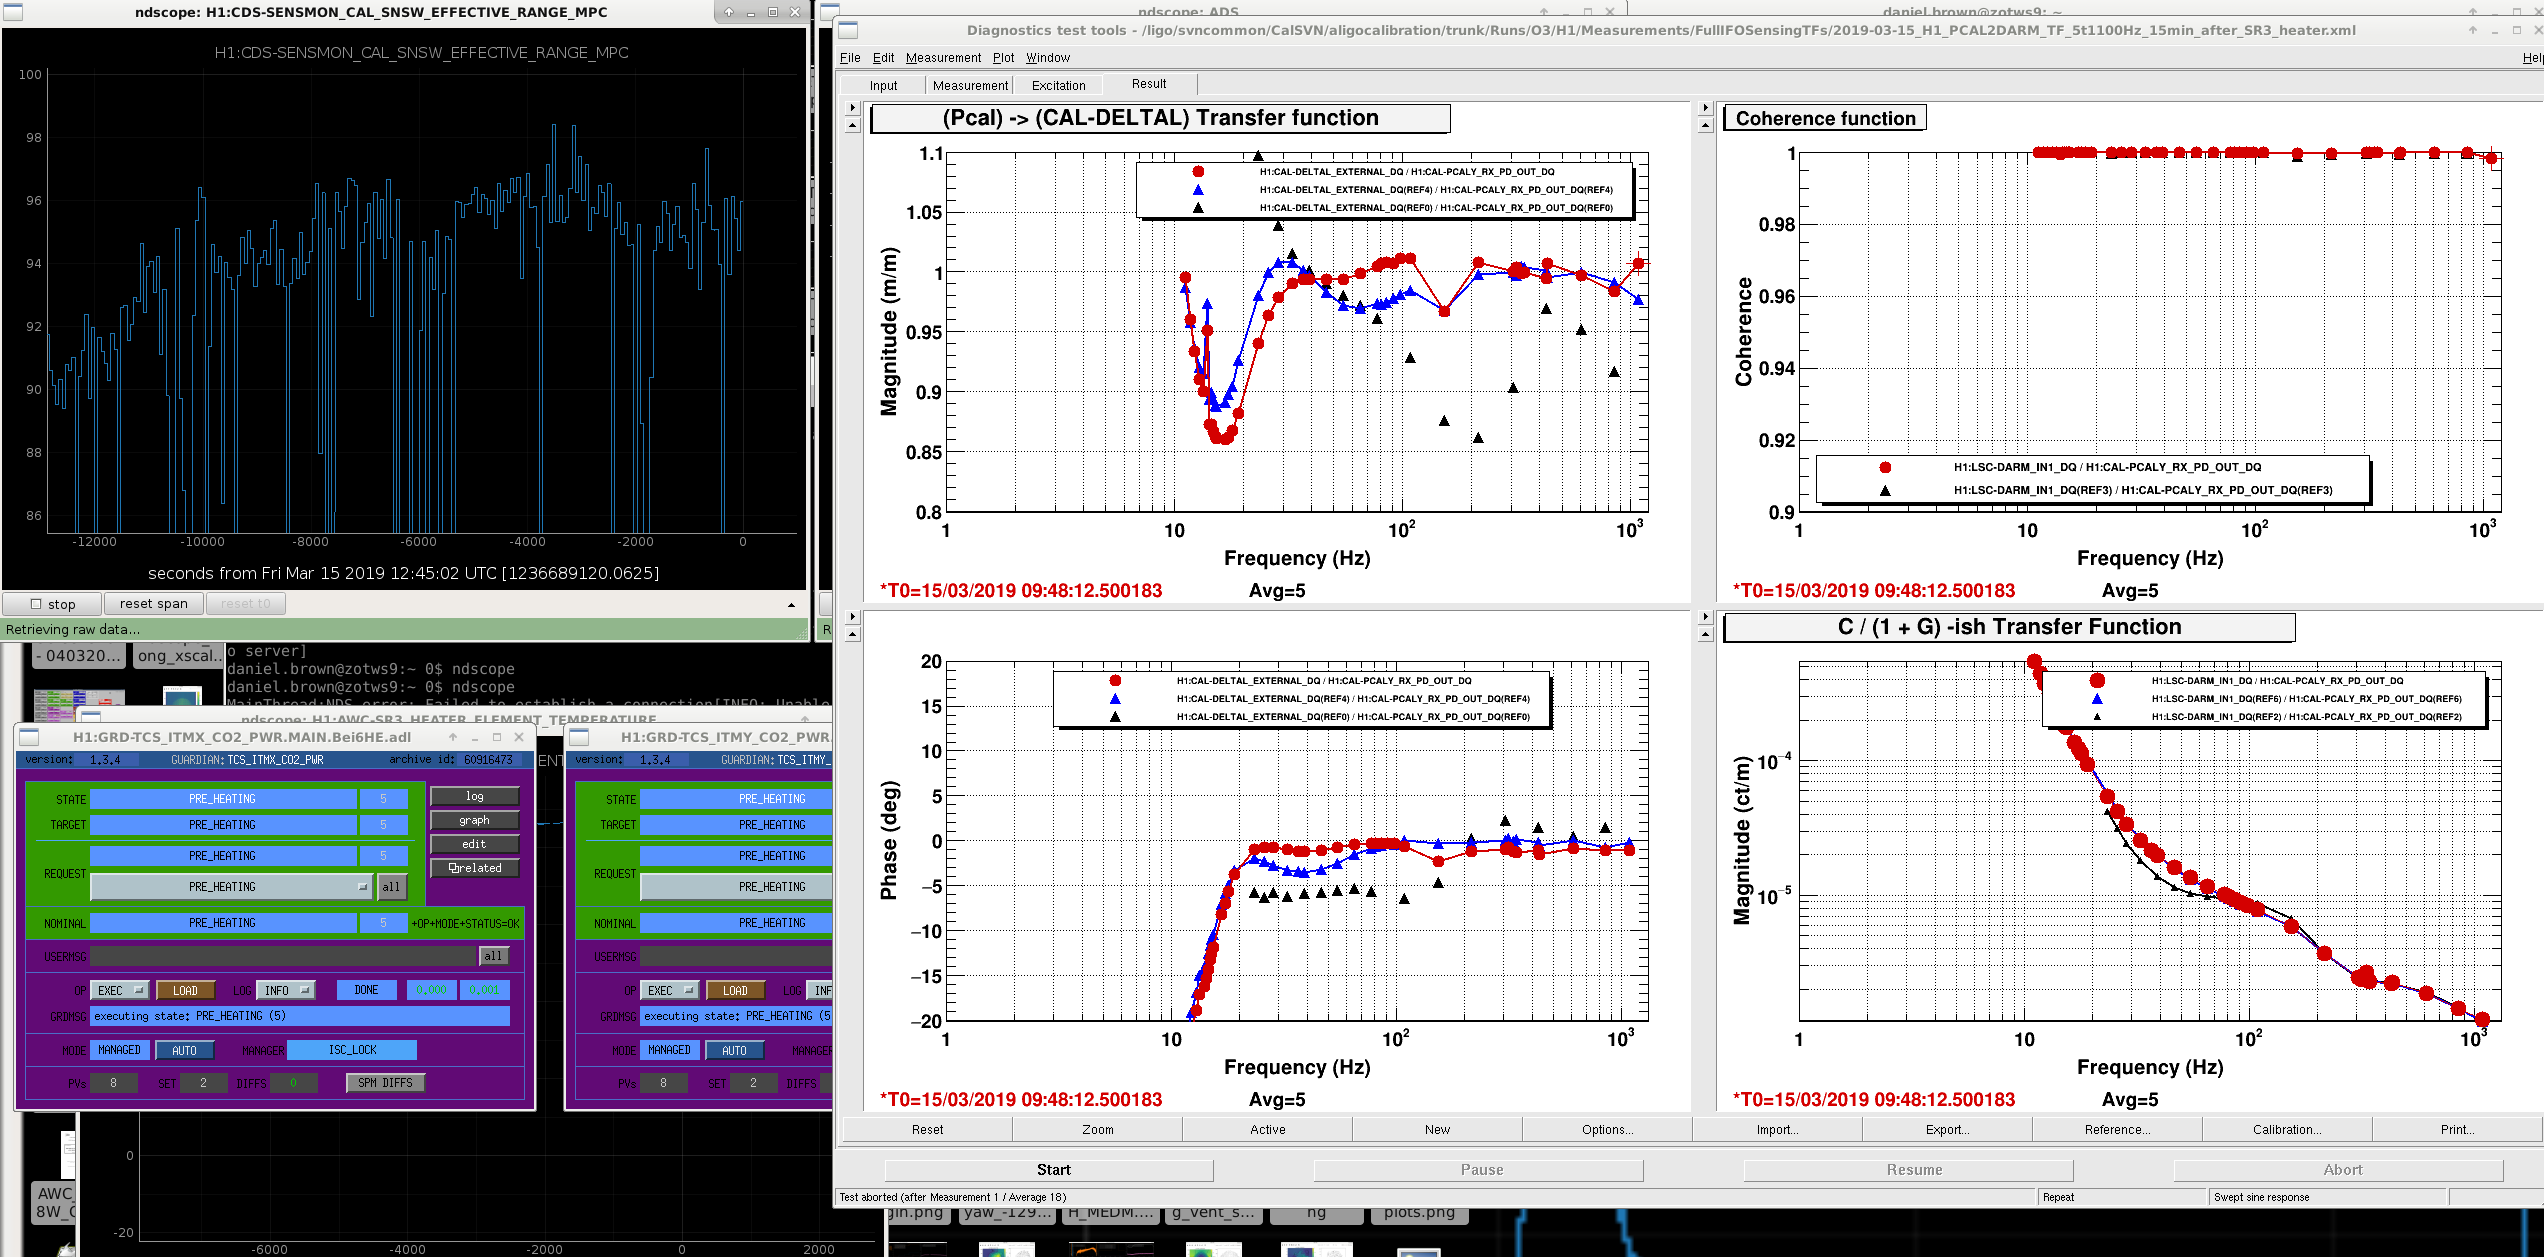
Tonight we powered up the SR3 heater again to 0.5W5W, we took a cal sweep before and after and can see it actually has a reasonable change (red with SR3, blue before SR3).

Once we had thermalised we tried some common CO2 increases, it didn't made a small improvement in PRG and arm power at the start but it didn't help with much more. I then zeroed CO2Y and dropped CO2X steadily to 0.2W. The range stayed fairly constant throughout all this but the arm powers and PRG got worse for most CO2 changes. I was adjusting the SRC1 offsets to try and maximise the cavity pole as we went along, there were some CO2 values giving higher kappa_c for the same cavity pole frequency.

The SR3 heater has been switched off and the CO2s have been set back to nominal. SRC1 offsets set back to zero. We're sat ~96Mpc up from 88Mpc before SR3, although given the calibration change I'm not sure what this range increase actually ends up being.

All this work was done from 1236673000 to 1236690900 if people are looking through the data during this time.


Images attached to this report
Comments related to this report
daniel.brown@LIGO.ORG - 06:33, Friday 15 March 2019 (47556)

And as soon as we stood up to leave we had a lock loss. There doesn't seem to be any obvious culprit for it.

daniel.brown@LIGO.ORG - 22:43, Saturday 16 March 2019 (47590)

I did a rough rescaling of DARM from the pcal sweeps above and recomputed the range. Doing this we go from 96.4 to 98.3 Mpc with the SR3 heater on.

H1 SQZ (PEM)
sheila.dwyer@LIGO.ORG - posted 01:25, Friday 15 March 2019 - last comment - 08:38, Friday 15 March 2019(47551)
some squeezer acoustic coupling tests, attempt at seeding and backscatter check

Robert, Sheila, Nutsinee

Better alogs will be coming with details, but earlier this evening we spent some time doing squeezing tests.  From about 20:50 UTC to 23:50 UTC (including time when IFO unlocked and was relocked), Nutsinee did measurements of squeezing and anti-squeezing for three different nonlinear gains.  

From 23:50 UTC Dick went into the CER to do a couple of tests, the IFO lost lock during this time.  

After relocking Robert and I did some test of the acoustic coupling from ISCT6.  Robert has more details, but some main points are:

We attempted to do the measurement where we offset the squeezer laser frequency from the PSL to see the two lumps in darm from backscatter and seeding.  The squeezer laser is moving too much relative the the PSL to do this measurement.  We could probably make this better by implementing the IMC VCO FF, or if we used a pick off that isn't in the ref cav path as they do at LLO we wouldn't have as much motion.  

Comments related to this report
robert.schofield@LIGO.ORG - 08:38, Friday 15 March 2019 (47557)

Figure attached showing coupling variation with different squeezer settings

Non-image files attached to this comment
H1 DetChar (DetChar, ISC)
craig.cahillane@LIGO.ORG - posted 18:22, Thursday 14 March 2019 - last comment - 11:03, Friday 15 March 2019(47542)
Added Intensity, Frequency, and 9 MHz Intensity Lines at around 74 Hz
Dan Brown, Craig

We are injecting lines into the DARM spectrum as follows:

Intensity: 76.4 and 3250 Hz
Frequency: 74.7 and 4500 Hz
9 MHz AM:  72.3 Hz
Comments related to this report
jenne.driggers@LIGO.ORG - 11:03, Friday 15 March 2019 (47561)

The Frequency line made it impossible to lock :( 

I disabled the common mode board excitation input, and we're back on track, almost locked.  I still see a giganto line from the other 2 excitations however.

H1 ISC
anamaria.effler@LIGO.ORG - posted 18:20, Thursday 14 March 2019 - last comment - 15:11, Friday 15 March 2019(47541)
DARM coherence with PZT1 MON

Keita, Anamaria

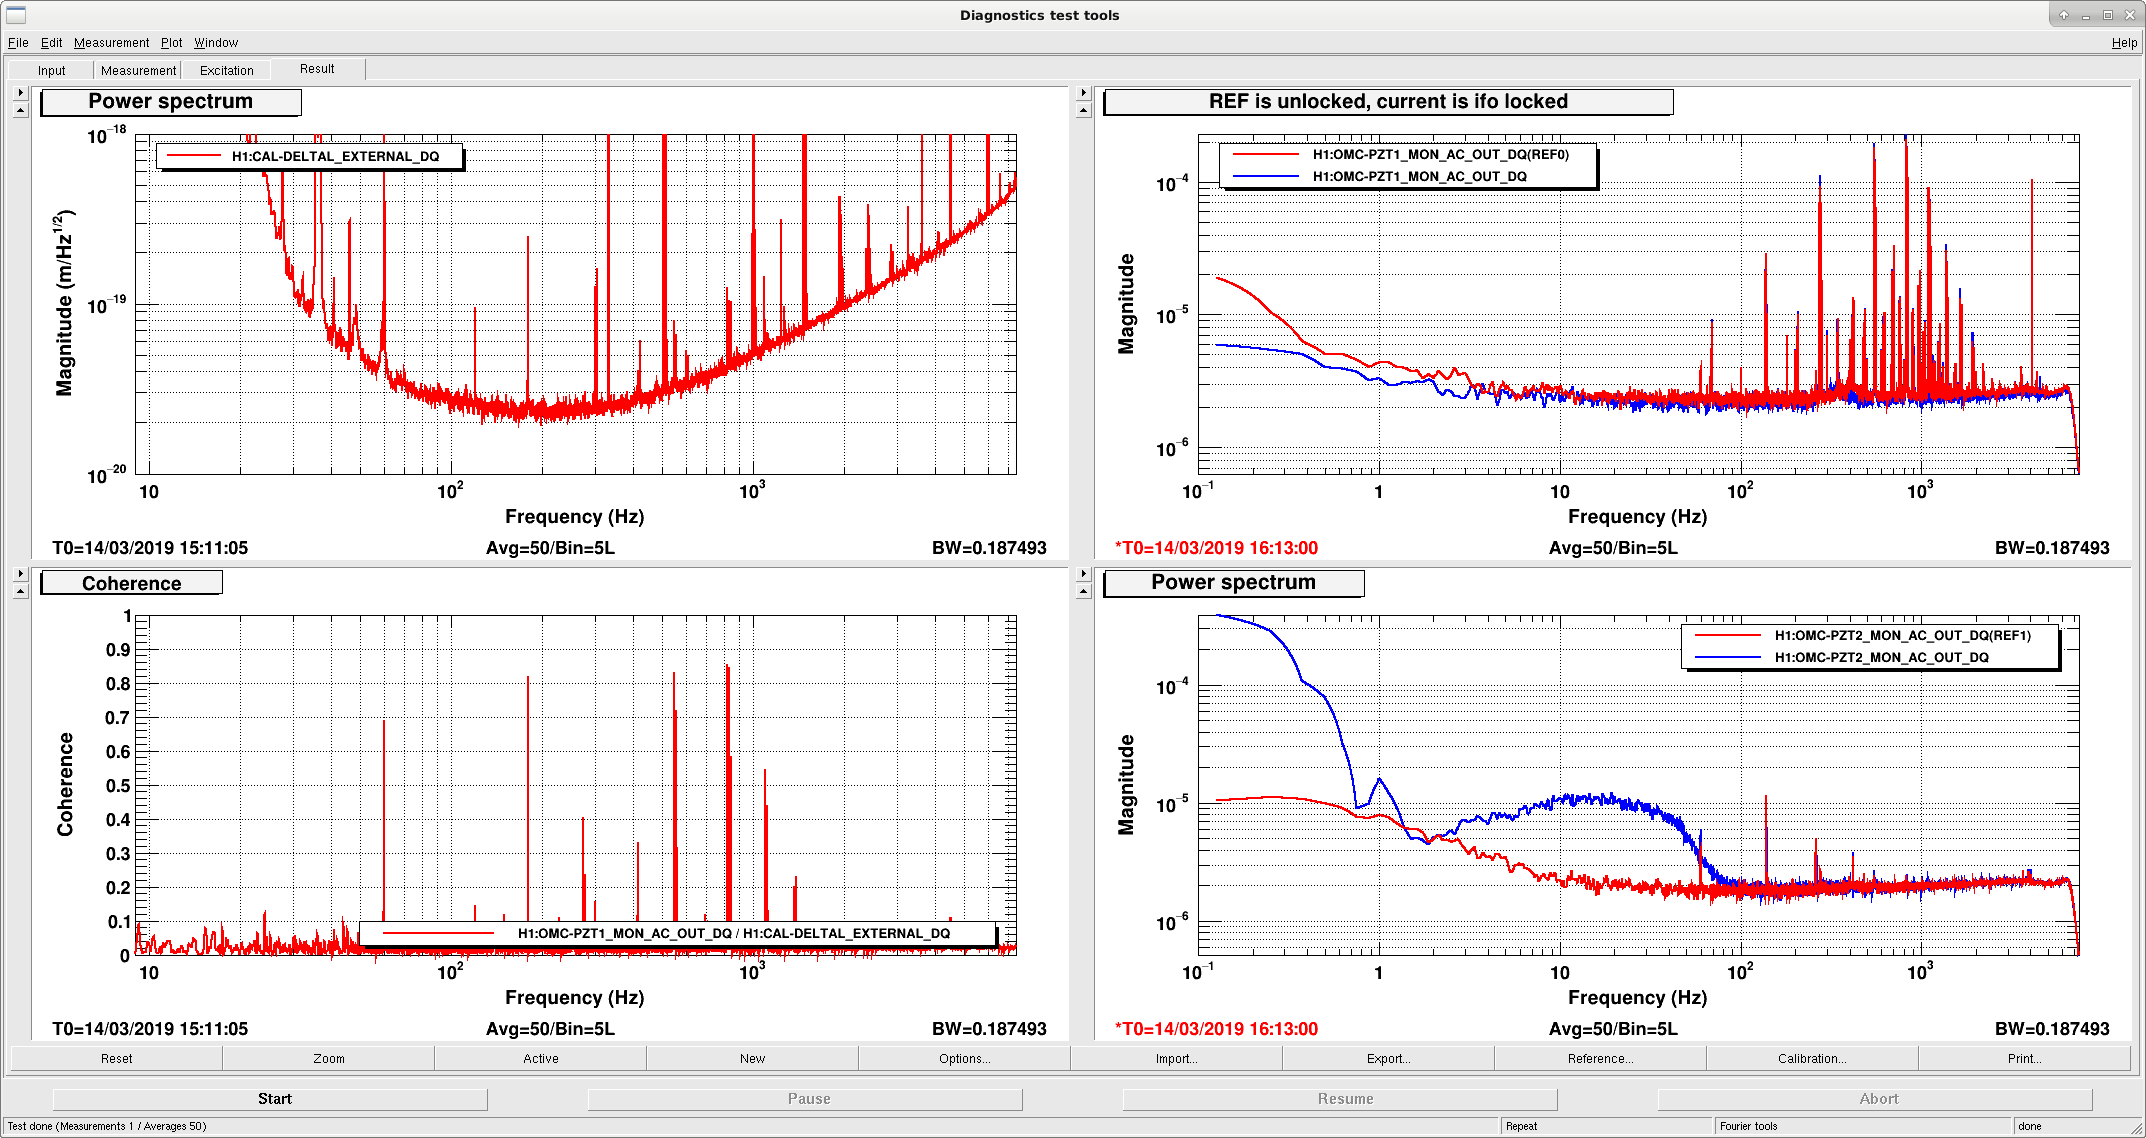
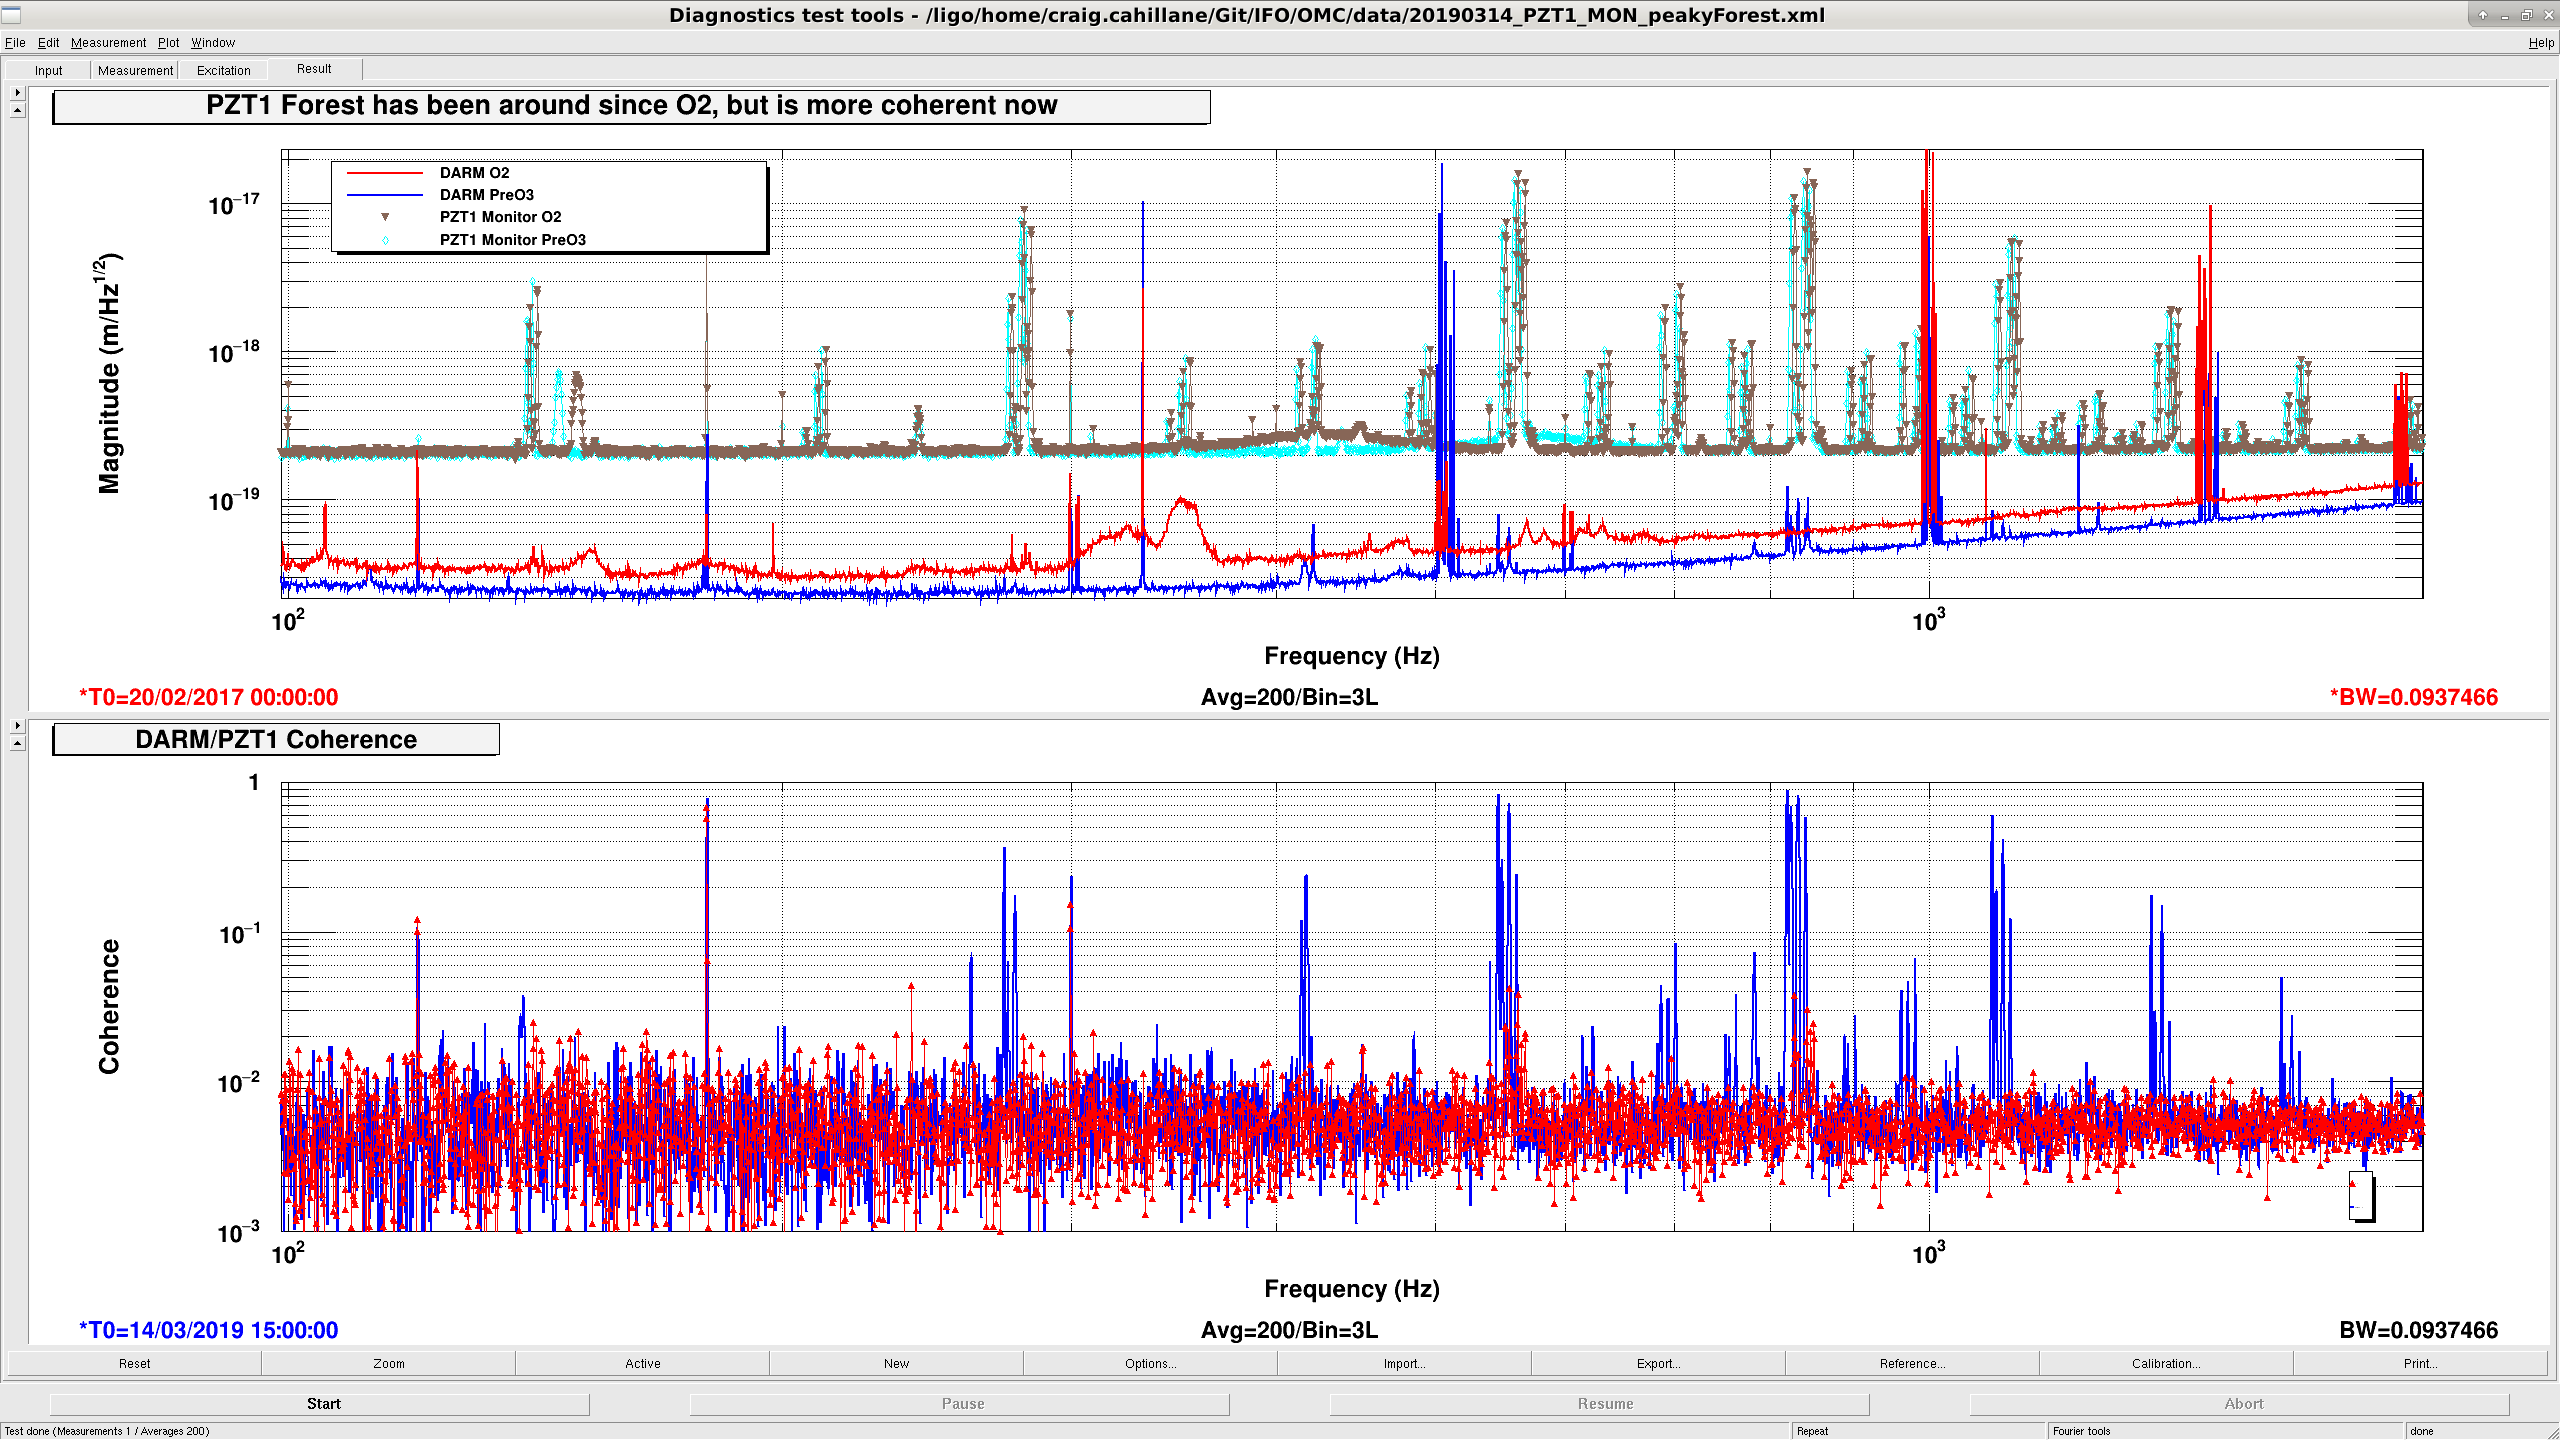
Following the work on pick-up on the PZT electronics at LLO, we find that there is coherence between PZT1 MON and DARM at various peaks! And PZT1 MON is so noisy that the noise is larger that the dither peak at 4.1k.

We would like to add toroids to these signals as soon as possible and will carefully check tightening of cables.

Images attached to this report
Comments related to this report
rich.abbott@LIGO.ORG - 20:00, Thursday 14 March 2019 (47546)
We have been discussing the relative merit of a ground isolation process for the OMC similar to that done in the end ESD system.  Up-votes for such an activity would bolster our case.
anamaria.effler@LIGO.ORG - 01:11, Friday 15 March 2019 (47550)DetChar

Craig, Anamaria

We looked around at the HAM6 rack, we saw nothing amiss. We turned off the pico driver while we were there.

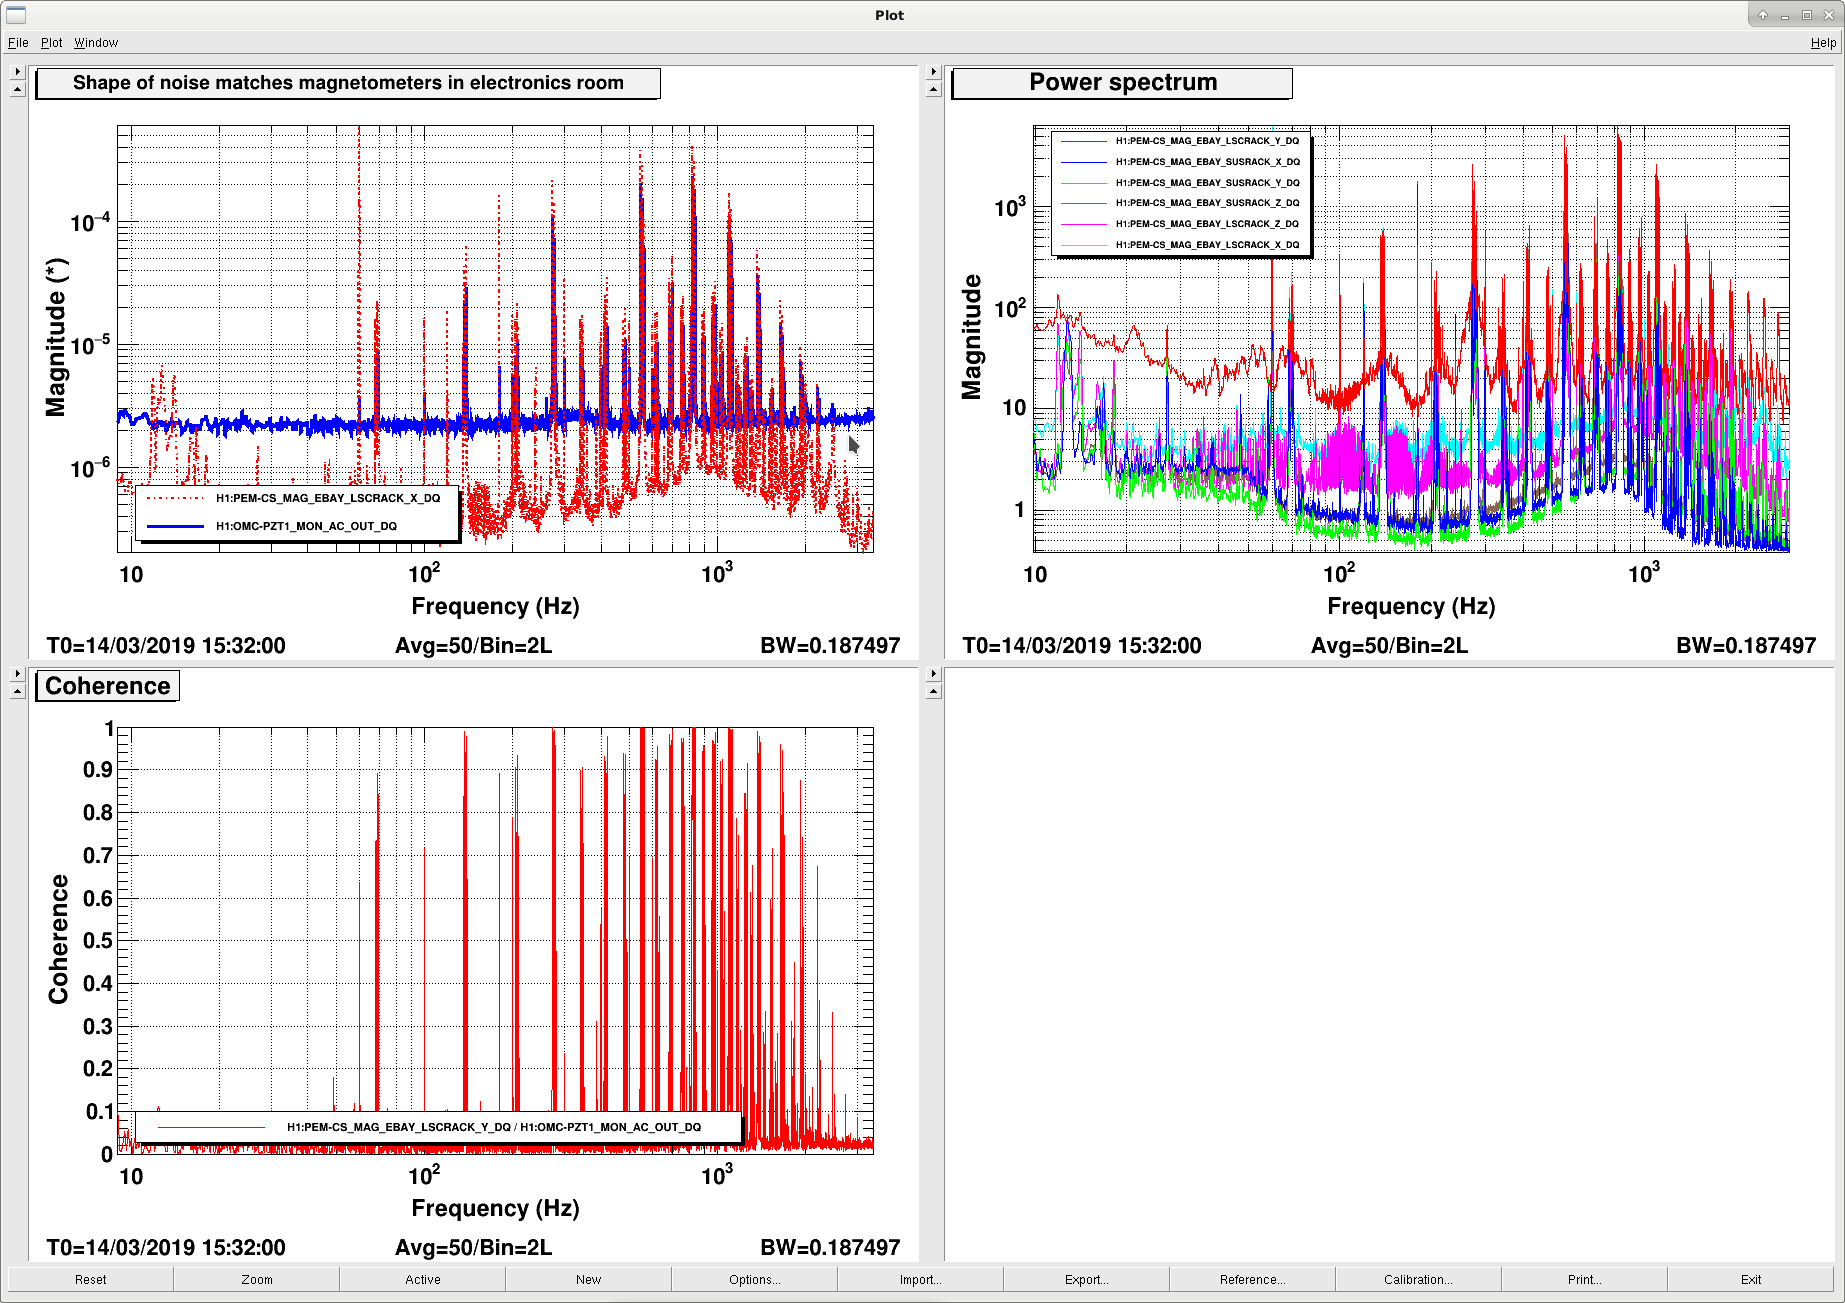
The OMC PZT signal is coherent with magnetometers, especially the ones in the electronics room (EBAY). This noise dominates all the EBAY magnetometers. We should be able to find the source in there.

The coupling seems to come and go from lock to lock, but the PZT noise has been there since at least O2 (Craig will post a plot).

It would be good if someone could look at the behavior of these peaks (the coherent ones from the main post plot) in DARM over the past few weeks/months.

Images attached to this comment
craig.cahillane@LIGO.ORG - 01:43, Friday 15 March 2019 (47552)
As Anamaria says, the PZT1 monitor forest of peaks has been there since O2.  
The noise in PZT1 MON has not changed levels very much, but somehow the coupling is worse now: we see strong coherence with DARM and PZT1 in some locks.  We do not understand the nature of the coupling.  
Today we flipped some switches on the fast shutter chassis to with no changes apparent in the PZT1 noise.
Images attached to this comment
anamaria.effler@LIGO.ORG - 15:11, Friday 15 March 2019 (47566)

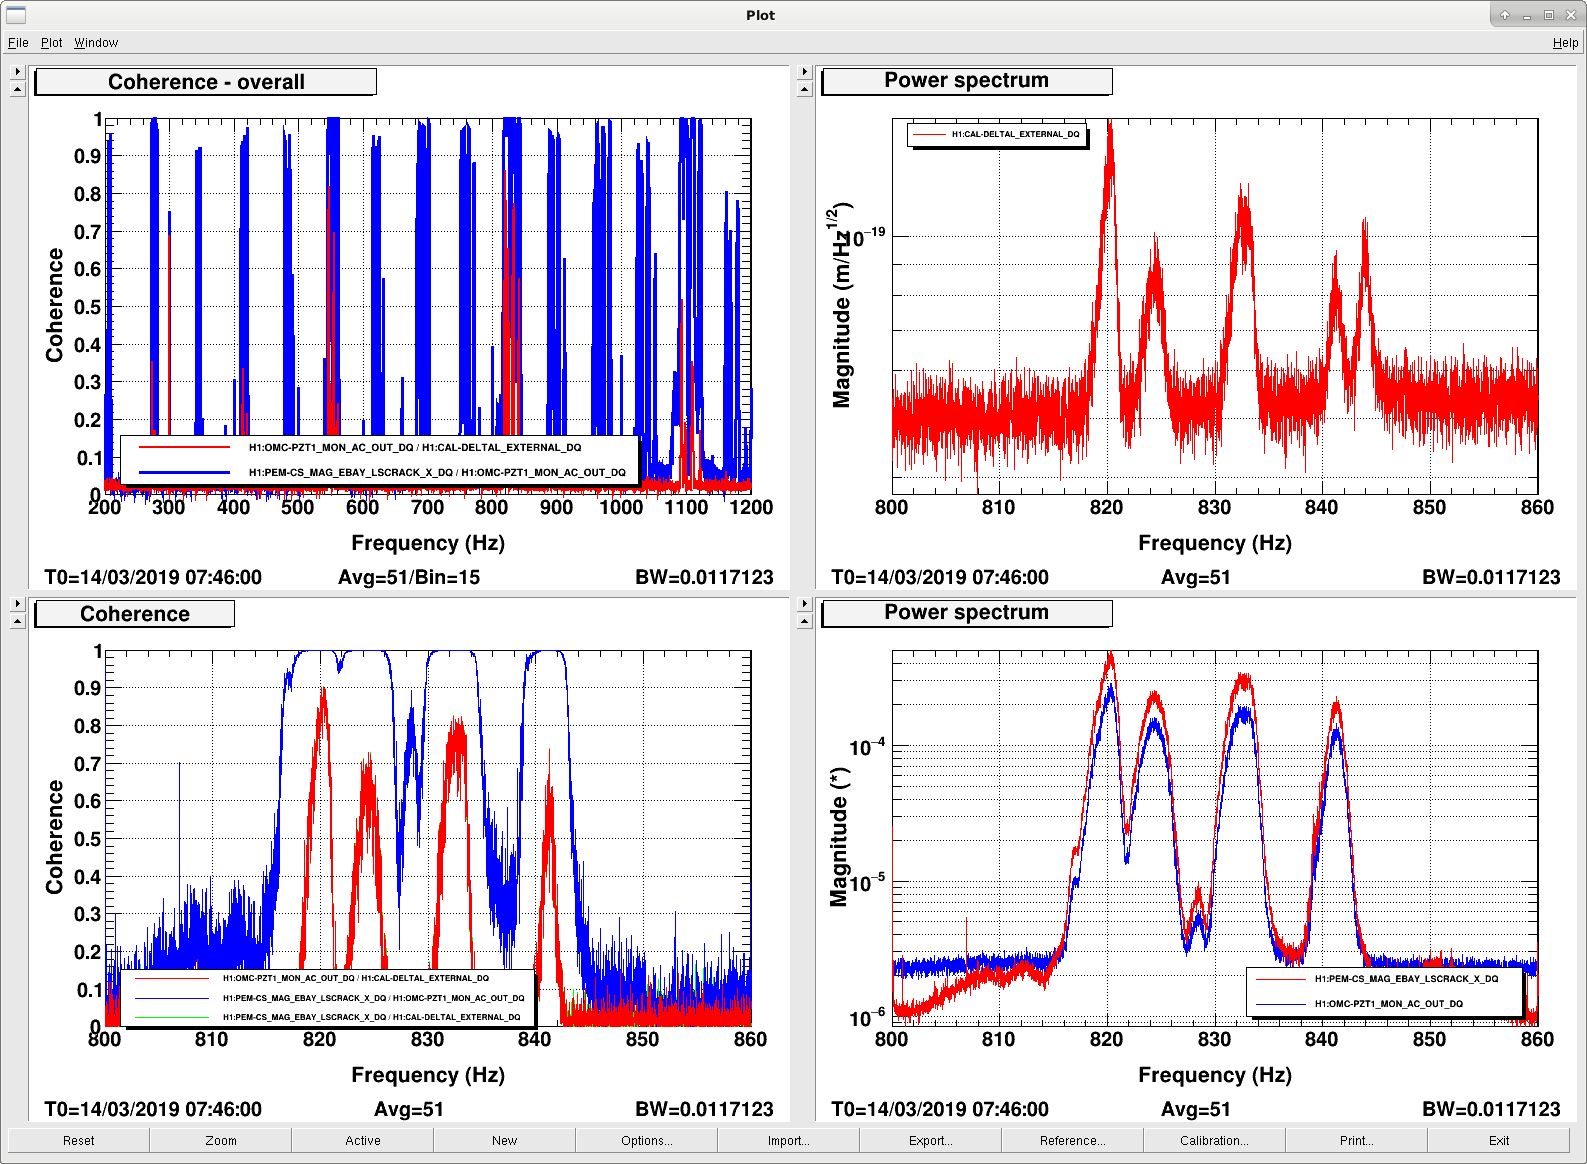
To clarify, there is noise in DARM at approximately 70 Hz harmonics, and they are coherent. I zoom in here on the top 3 coherences around 550, 820 and 1100 Hz. But sometimes there's a bit of coherence as low as 280 Hz.

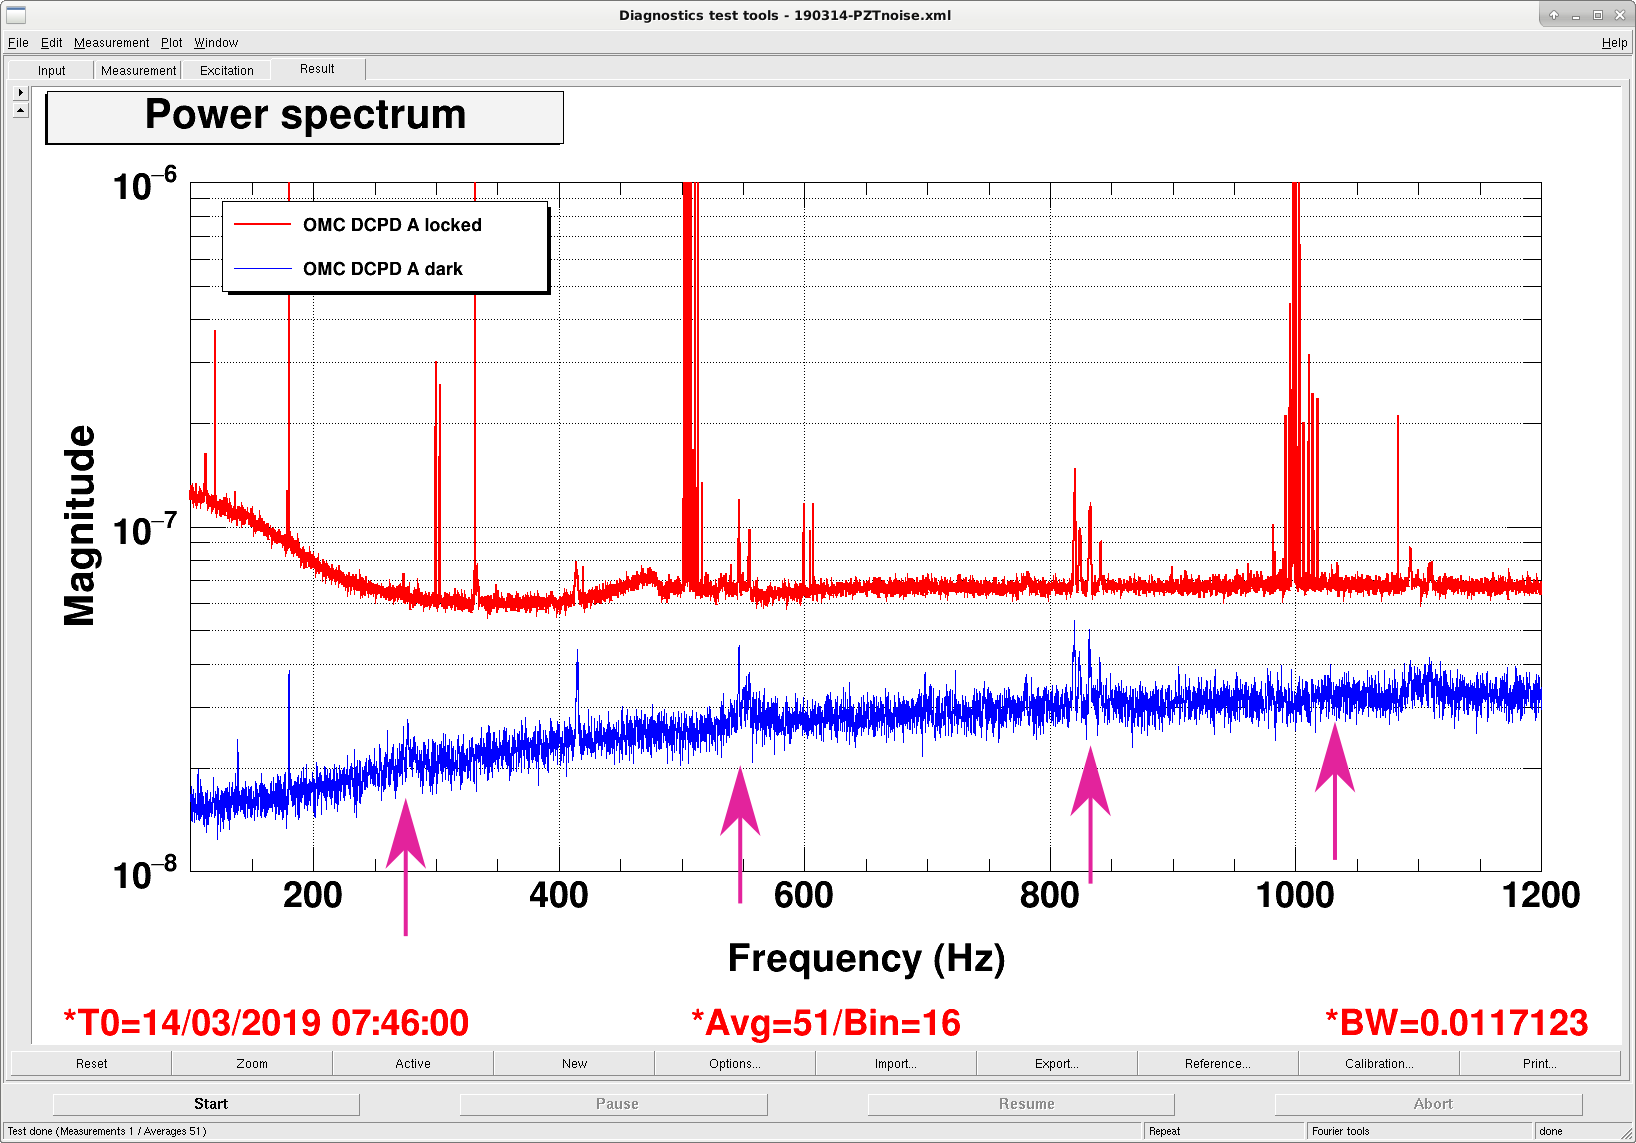
A second observation is that some of the peaks are visible in the DCPDs when unlocked.

Images attached to this comment
H1 CAL (CAL)
craig.cahillane@LIGO.ORG - posted 23:37, Wednesday 13 March 2019 - last comment - 06:40, Tuesday 19 March 2019(47515)
Cal good to 2% from 25 to 1000 Hz, within 10% from 15 Hz up
Keita, Sheila, Craig

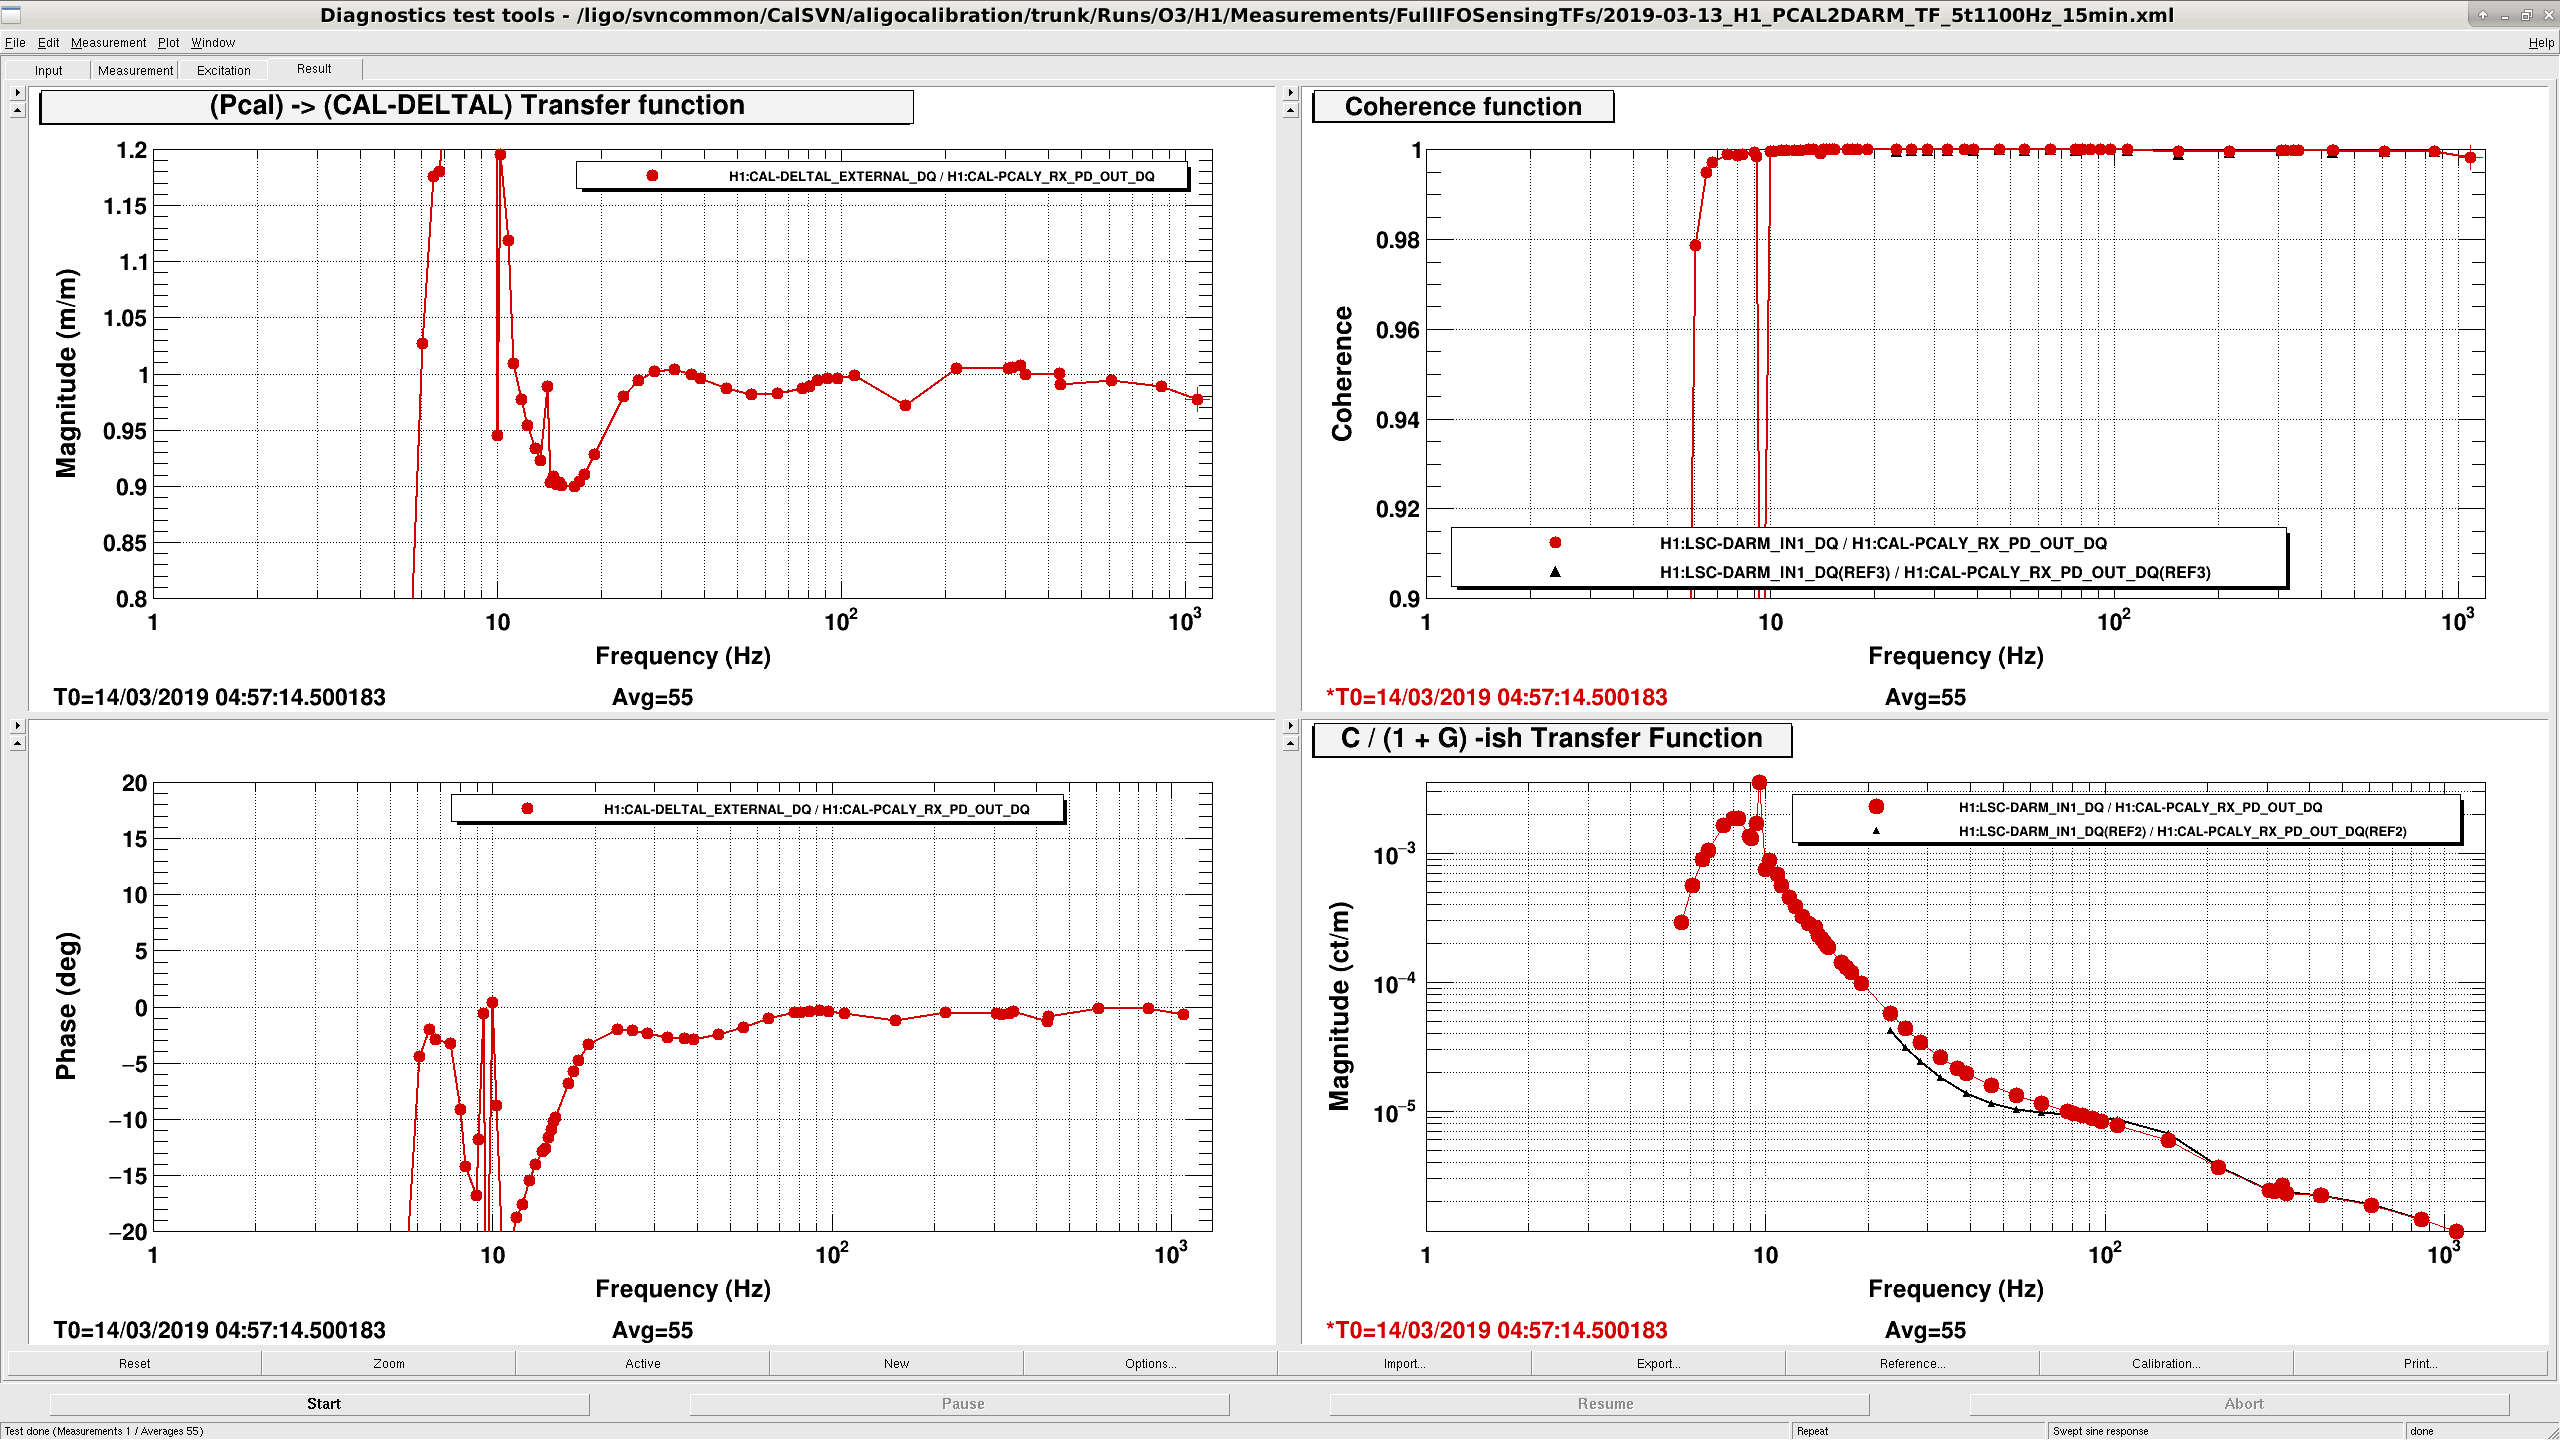
We were confused about why my sign flip on the front end UIM stage helped flatten out the PCAL to DARM TF from last night.  Keita and I checked all the front end calibration filters, and things seemed to make sense without a sign flip.  We also injected some white noise during a lockloss and took a TF from CAL CS LOCK L3 IN1 to the calibrated outputs for each stage: H1:CAL-CS_DARM_ANALOG_ETMX_L{1,2,3}_OUT, as well as the summed total H1:CAL-CS_DARM_CTRL_DELAY_IN1, and compared this to Sheila's DARM model: the models matched well, and no sign flip seemed necessary.  
This seems like a good method of verifying the front end calibration, the template is too big to attach but is exists at /ligo/home/controls/craig.cahillane/Calibration/FrontEndDARMCalibrationCheck.xml

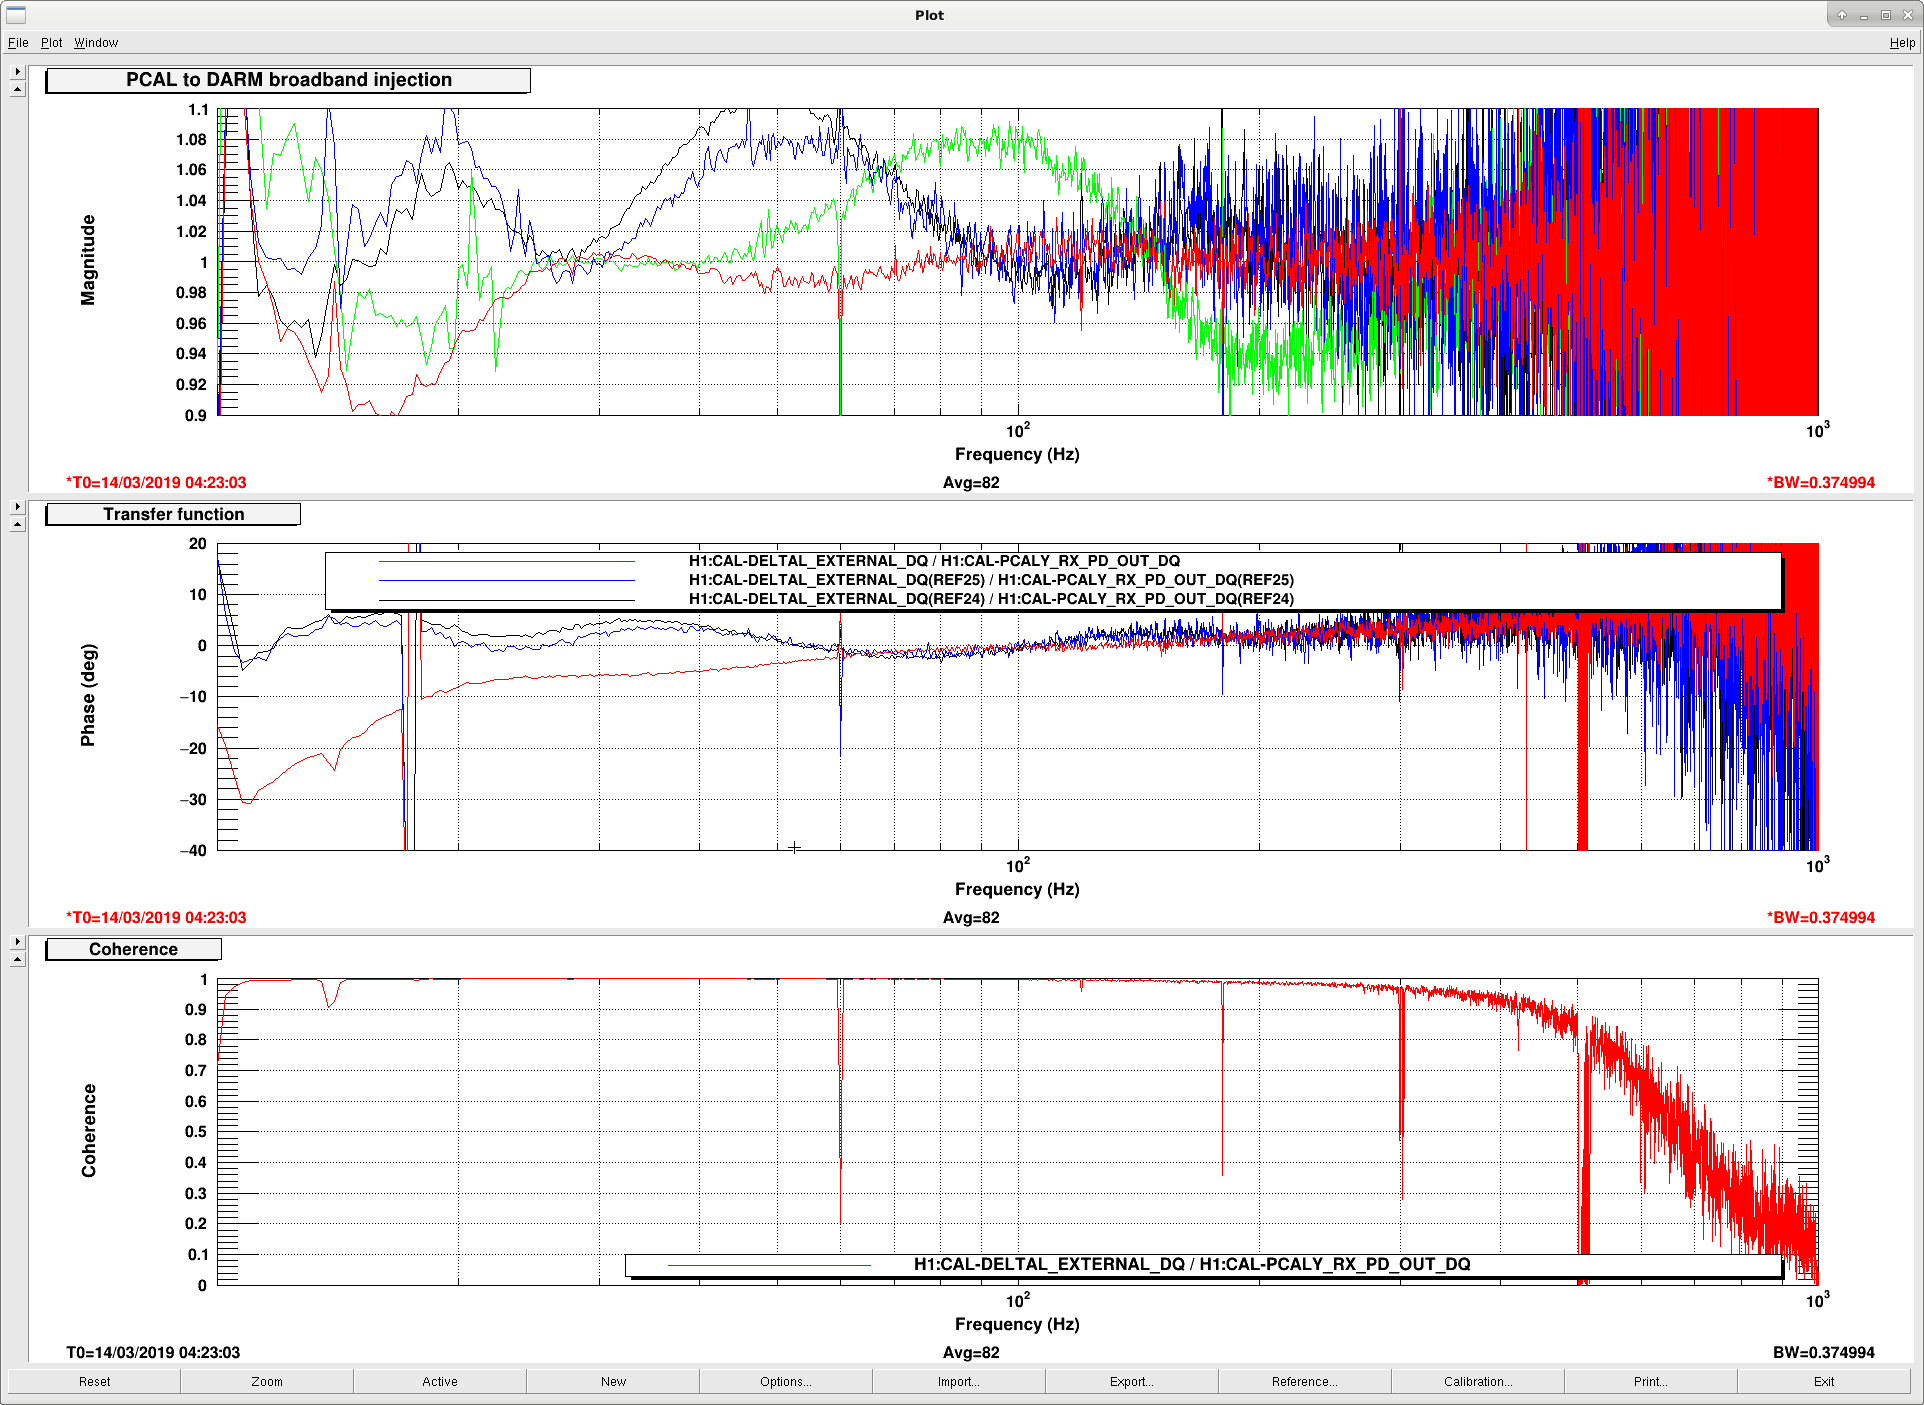
We reset all front end gains to 1.0 and remeasured PCAL to DARM.  Things were good to 2% from 25 Hz to 1000 Hz using the sensing function fit from yesterday and Jeff's actuator gains from here.  We decided to leave the front end calibration here, even though it underestimates DARM meters at 20 Hz by 10%, because the 20 Hz region doesn't have a huge effect on our reported BNS range.  We recognize that this will be a problem for overestimating BBH range, but given the good match at higher frequencies this is the best calibration we have.  
Images attached to this report
Comments related to this report
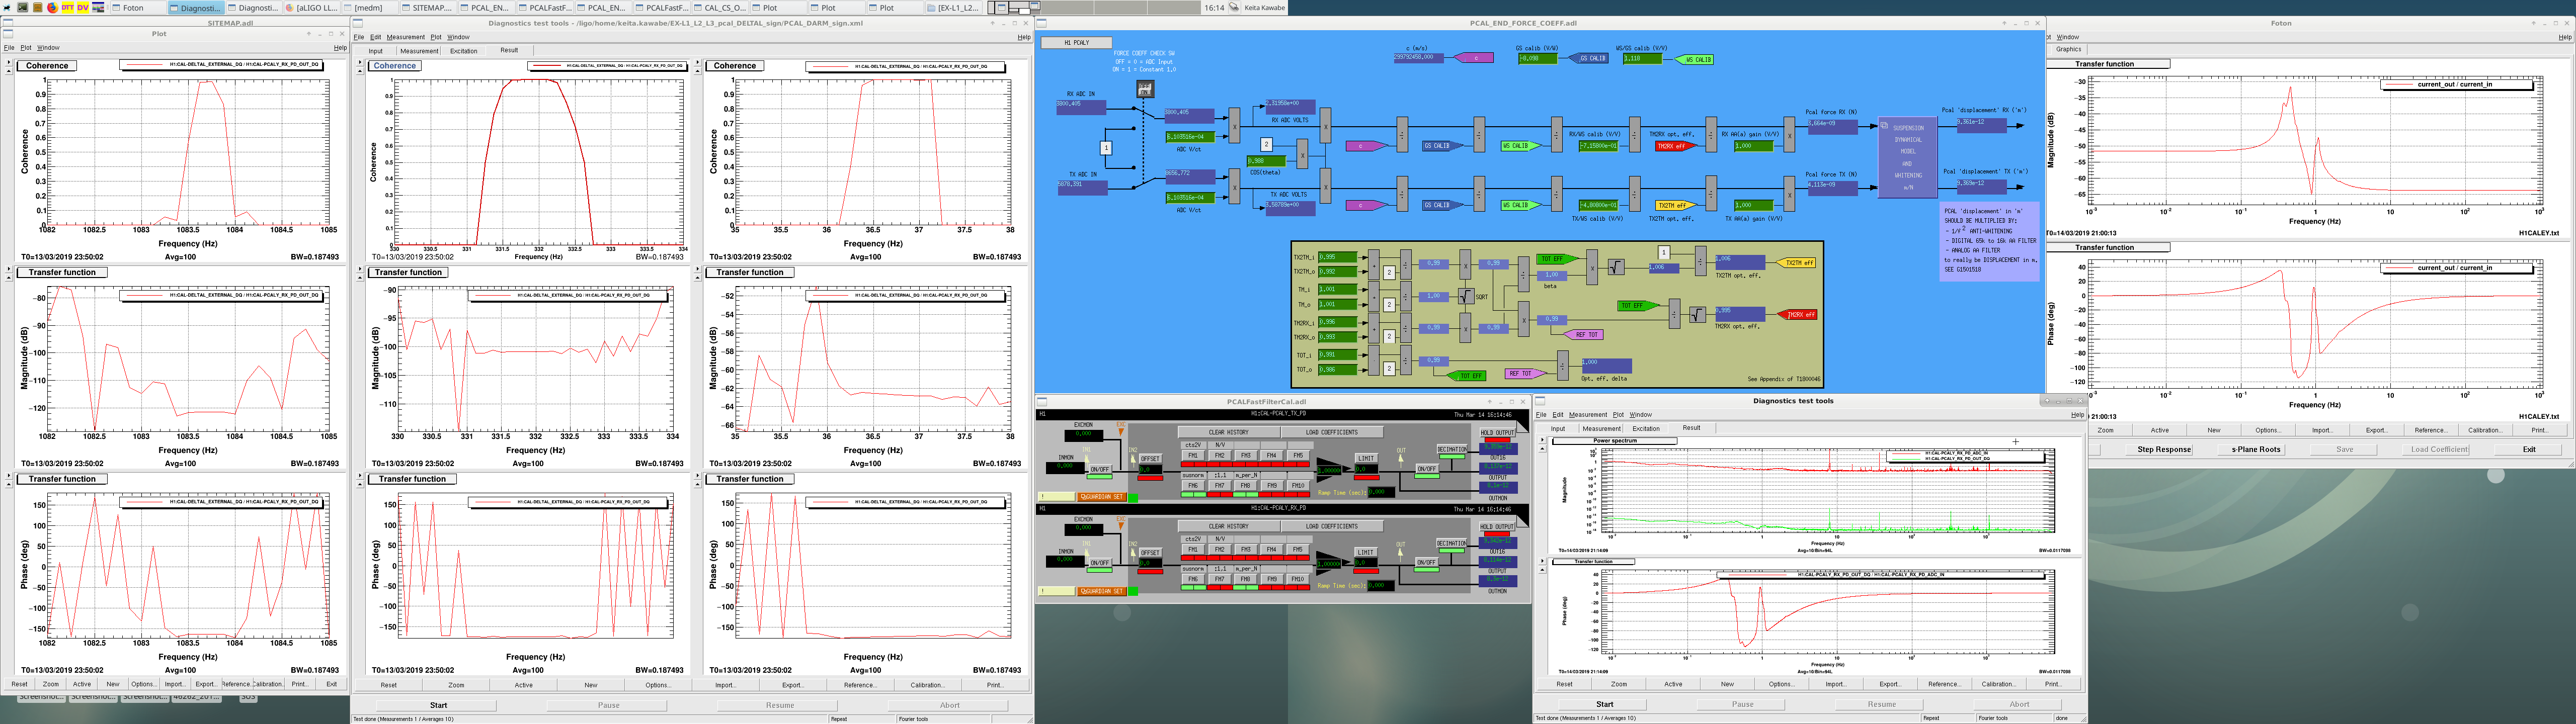
keita.kawabe@LIGO.ORG - 16:56, Thursday 14 March 2019 (47519)CAL

Overall calibration sign is incorrect for H1:CAL-DELTAL_EXTERNAL_DQ.

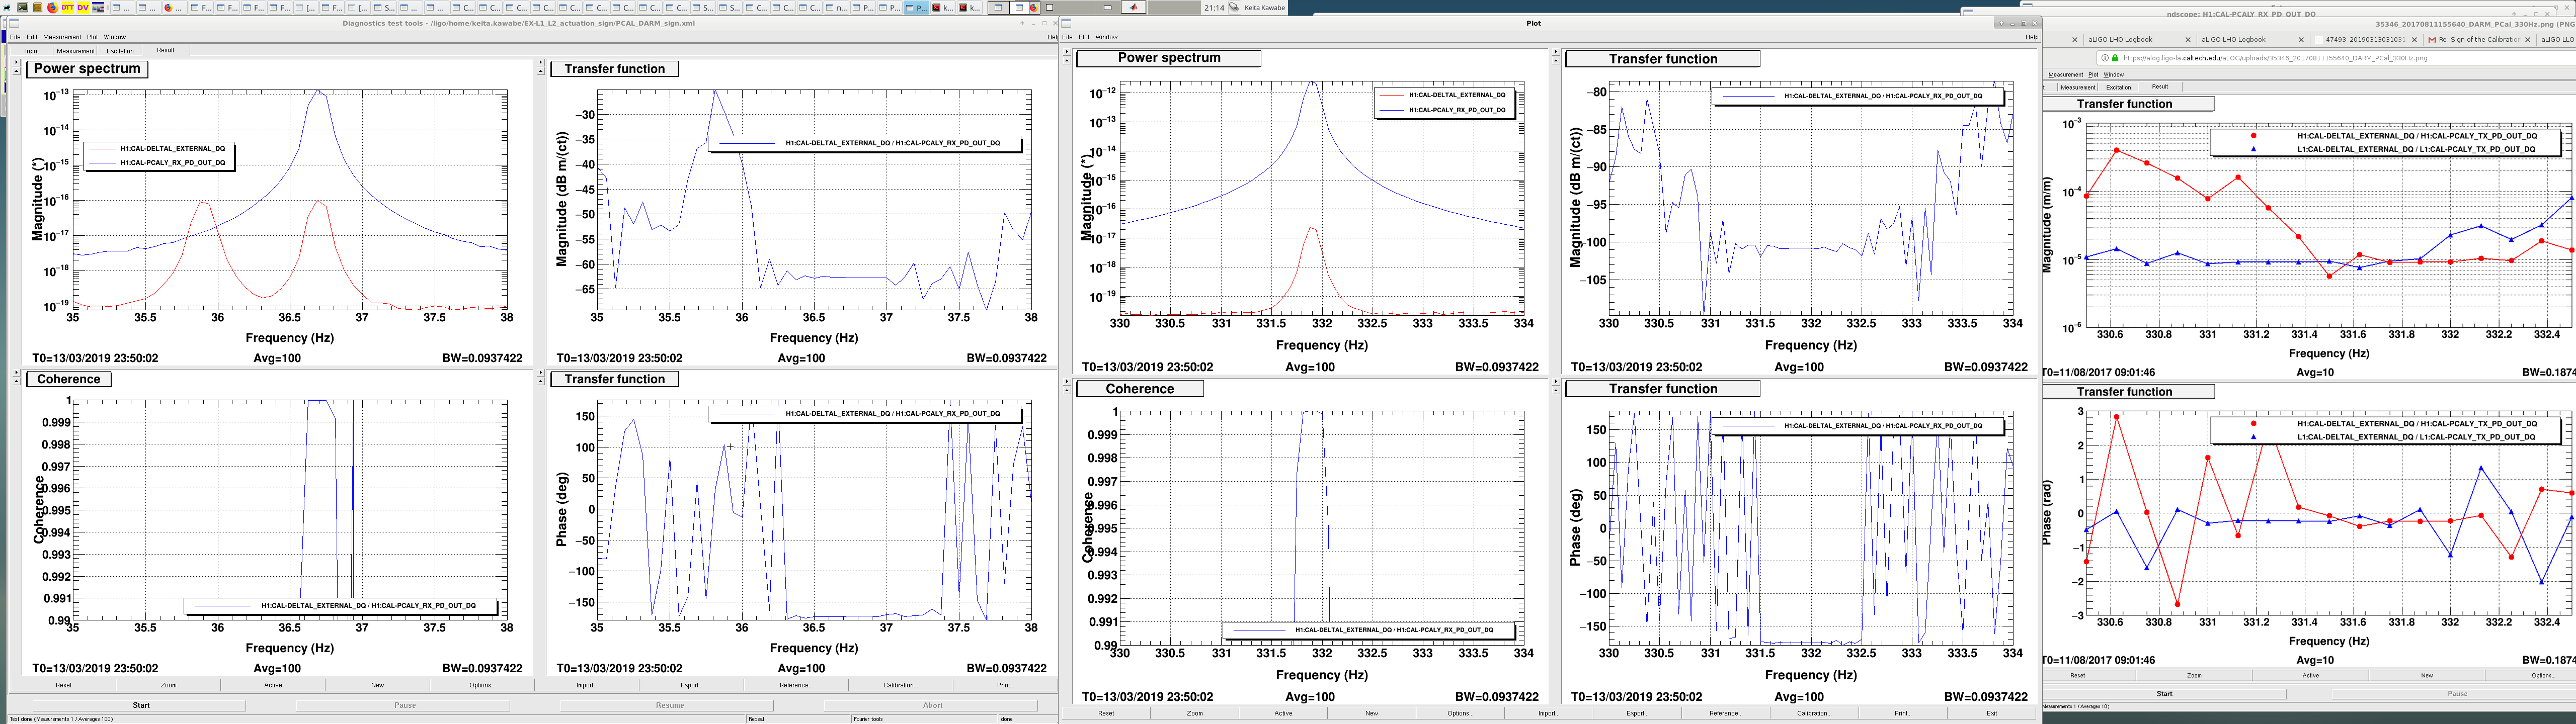
In the attached, left half shows the Pcal_X_RX_PD_OUT_DQ to DELTAL_EXTERNAL_DQ transfer function at three PCALY calline frequencies. DELTAL_EXTERNAL_DQ is calibrated in meters using H1DARMFOM dtt template, but I removed two 1Hz poles from PCAL_X_RX_PD so that basically it becomes the scaled power (positive means more power).

See how the phase of the TF is close to -180 deg at all three callines. This means that the overall sign of DELTAL channel is wrong. During O2, the same measurement showed tha both L1 and H1 were at ~0deg, which is the indication of correct sign (LLO alog 35346). This measurement is quite conclusive and that's the reason why we used this for LIGO and VIRGO calibration sign review in O2.

Incorrect sign is not because Craig did something, it has been like that for quite some time.


Let me explain the idea behind the measurement.

Let the Pcal power be P and the actuation function of Pcal be A such that the change in the Y arm length is

dY=AP.

LIGO-VIRGO sign convention is

dL=dX-dY

where positive dX or dY means longer X or Y arm.

The measured transfer function is

dL/P = (-dY)/P = -AP/P = -A.

Since Pcal pushes EY toward ERMY, A is positive at DC (i.e more power makes Y arm longer), but at frequencies much larger than the highest pendular resonance the test mass response is that of a free mass, so A is negative at e.g. ~36Hz and ~312Hz.

Therefore, if the sign of calibration is correct, power to DELTAL transfer function  -A is positive, i.e. the phase is zero, not -180 deg.

Now, PCAL TX (transmitter) and RX (receiver) power channels are calibrated in a funny unit where the complex suspension response is embedded in the RX channel calibration itself (but only in part) as a calibration filter. That filter is shown in the foton (attached rightmost). Important thing is that DC phase as well as the phase for f>30Hz or so are both basically zero degree (phase=-3.2deg at 36Hz). In this sense, for f>30Hz, RX_PD_OUT is just a scaled version of the power. We know that the channel goes positive when there is light on the PD, goes zero when no light, so positive signal means more power.

RX_PD_OUT(f<0.01Hz or f>15Hz) = C*P

dL/RX_PD_OUT = dL/P/C where C is a positive number.

The measured quantity is just dL/P divided by a positive number.

Therefore, if the sign of calibration is correct, phase of RX_PD_OUT to DELTAL transfer function is zero, not -180 deg.

I could in principle do the same analysis using the channel without any calibration, e.g. CAL-PCALY_RX_PD_ADC_IN but this is not DQ channel so I cannot look back, which is inconvenient.

We're trying to get help from JeffK (who is not at the site) and JoeB to learn how to correct the sign in a calibration-mode-friendly way.

Images attached to this comment
jeffrey.kissel@LIGO.ORG - 12:31, Thursday 14 March 2019 (47533)
Great work, team!
keita.kawabe@LIGO.ORG - 21:11, Thursday 14 March 2019 (47544)

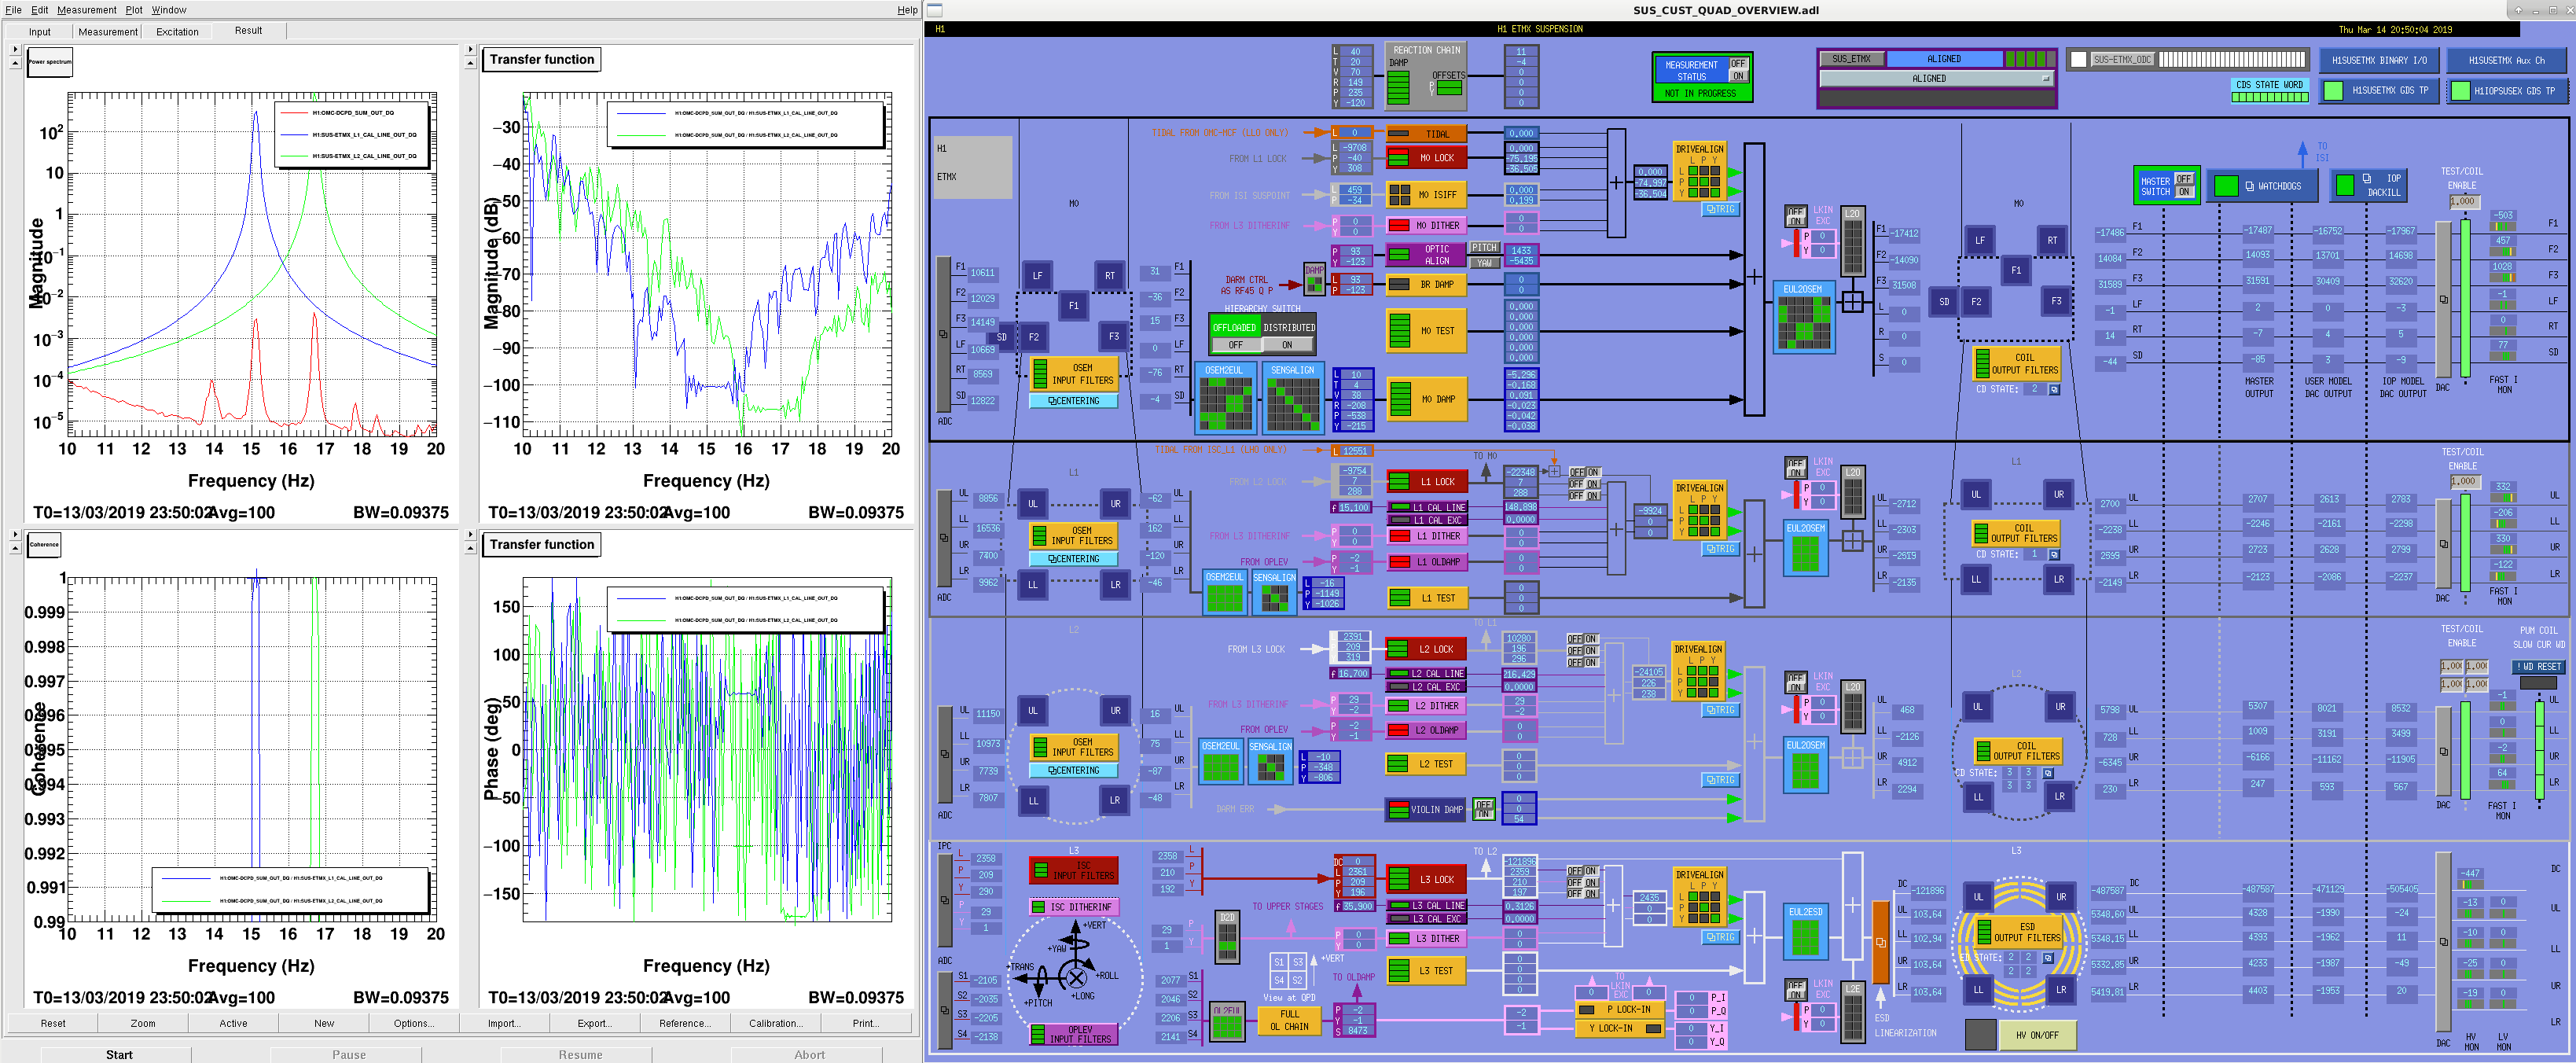
We also measured the relative sign of EX L1 and L2 using ~16Hz callines on Wednesday.

L1 cal line is at 15.1Hz and L2 cal line at 16.7Hz. Since they're right next to each other, it's really easy to make a relative phase comparison of this path. By comparing this measurement with the calibration model we can establish if the relative sign of L1 and L2 actuation model is correct. Our conclusion was that it used to be correct, got incorrect when Craig flipped the L1 sign. That's one of the reasons why we decided to change the L1 sign back.


Let the actuation function from H1:SUS-ETMX_L1_DRIVEALIGN_L_IN to the displacement of the mass be A1, and from L2 to the displacement be A2.

15.1Hz is close enough to 16.7Hz, so DARM OLTF G at 15.1Hz is almost the same as at 16.7Hz. The same thing could be said for the sensing function C too. Because of this, the callines will show up as an error signal as

error=A1*L1calline*C/(1+G)+A2*L2calline*C/(1+G)=(A1*L1calline+A2*L2calline)*C/(1+G).

Transfer functions from L1 and L2 calline to the error signal are

TF1=error/L1calline = A1*C/(1+G)

TF2=error/L2calline = A2*C/(1+G).

If we make the ratio of the two, we'll get the ratio of the actuation function regardless of the sensing and OLTF.

TF1/TF2=A1/A2.

Getting back to the actual measurement (attached left), phase of the Measured transfer function from L1 to DCPD-SUM at 15.1Hz was 58.9 deg, -173.6deg for L2.

phase(TF1/TF2)=phase(A1/A2)=58.9-(-173.6)=232.5deg (measured).

You can use any signal in the sensing path as an error signal, in this measurement I'm using DCPD_SUM. I'm using H1:SUS-ETMX_L1_CAL_LINE_OUT_DQ etc. and L1calline and L2calline, which are directly added to H1:SUS-ETMX_L1_DRIVEALIGN_L_IN etc.


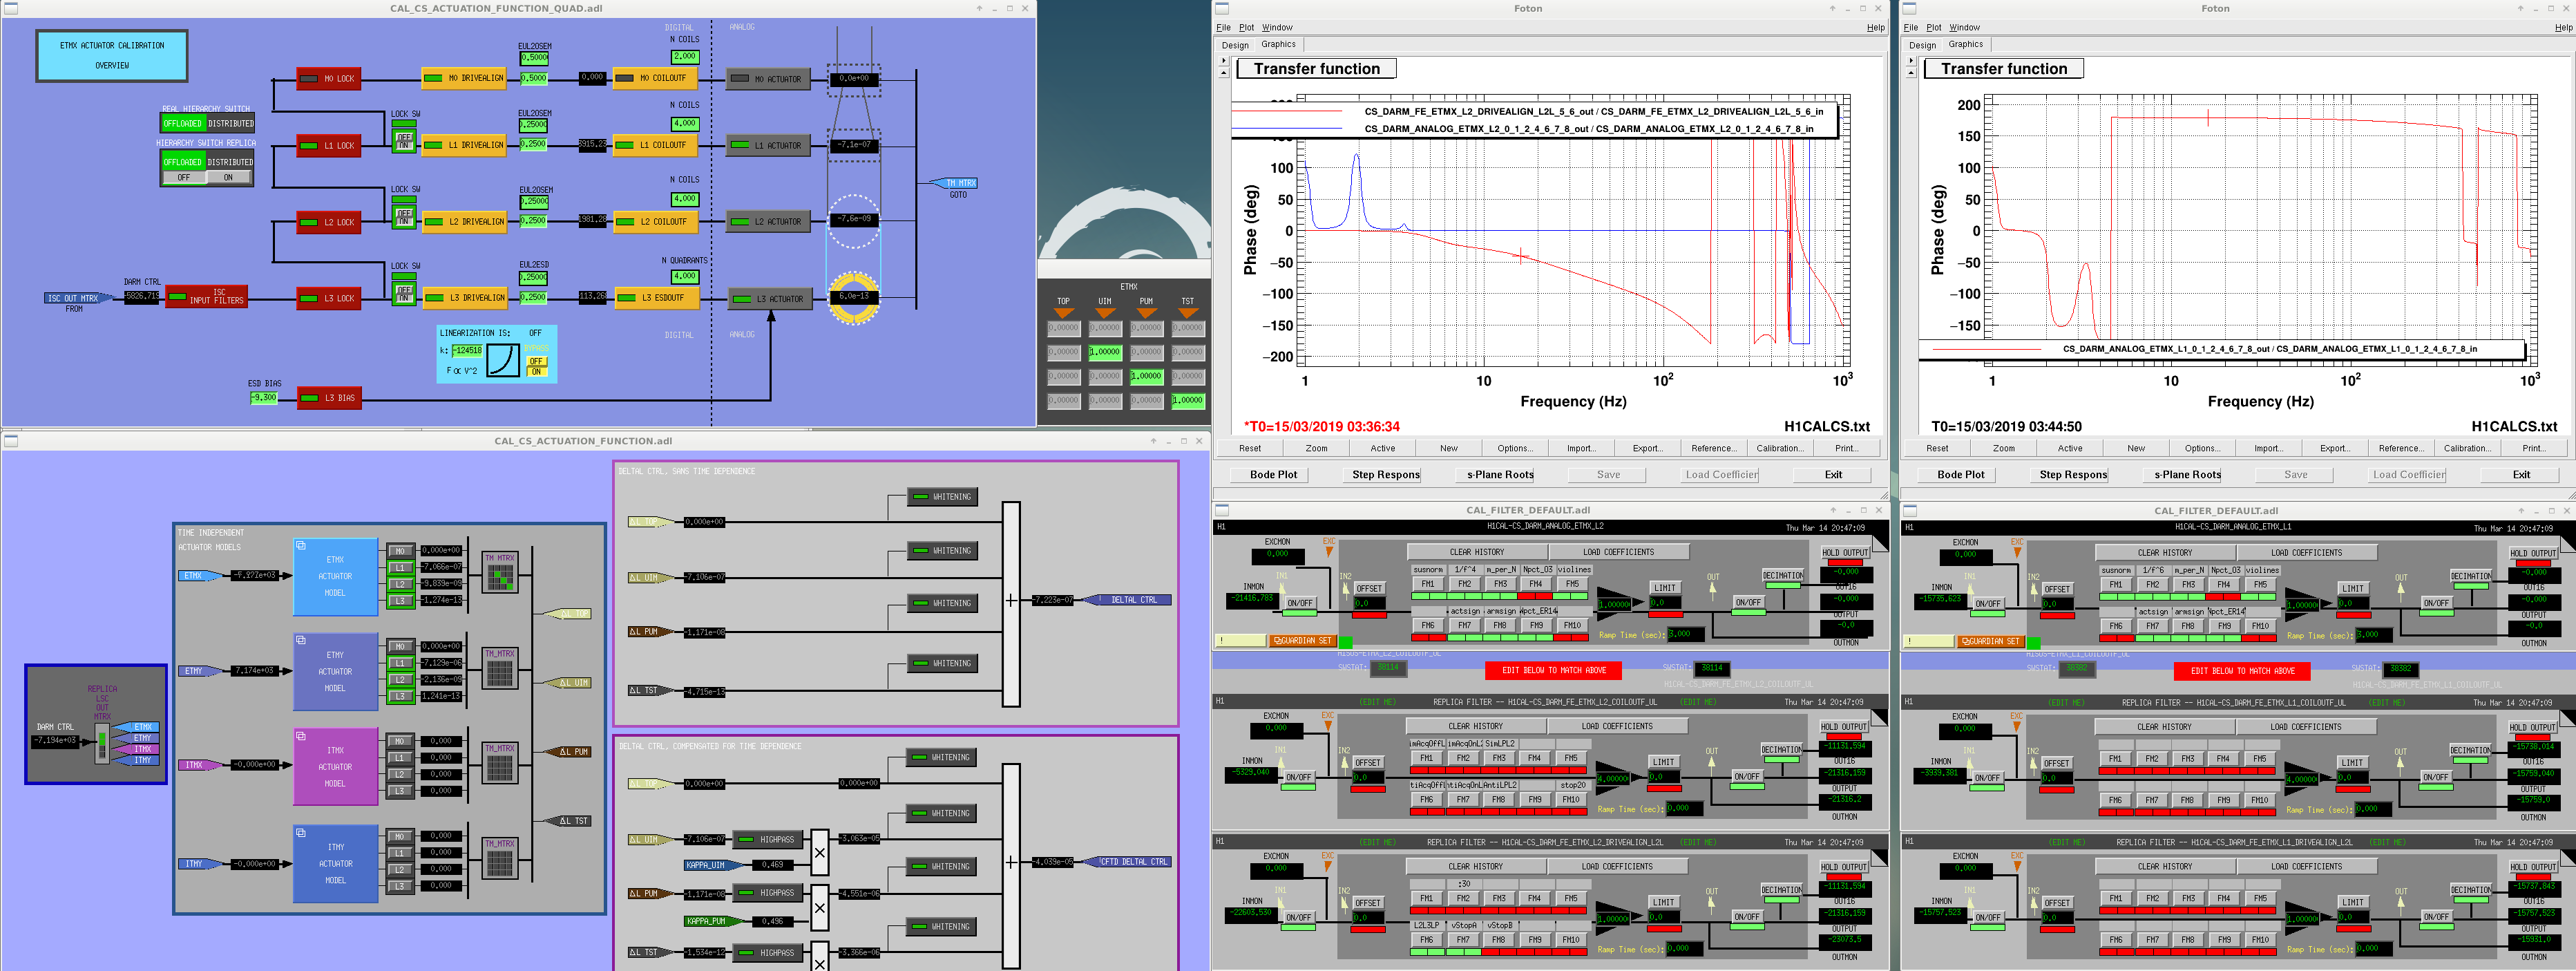
OTOH if you look at the calibration model actuation path, A1 and A2 are the product of three filter modules (DRIVEALIGN, COILOUTF and another one called ANALOG that represents the suspension response in analog world), output matrix that mixes  L1 and L2 ANALOG output, and some digital gains. All of these are shown in the 2nd attachment (all gains are positive in this screenshot which represent the status now, but when Craig "flipped the L1 gain" H1:CAL-CS_DARM_ANALOG_ETMX_L1_GAIN was set to -1 rather than 1).

As shown in foton and filter screen shot, ETMX L2 drivealign L2L is -40.7deg at 16Hz, H1:CAL-CS_DARM_FE_ETMX_L2_COILOUTF is just a pass through, and ANALOG_ETMX_L2 was 0 deg, so the total is -40.7deg.

L1 drivealign is a pass through, coiloutf is a pass through, and ANALOG_ETMX_L1 is about 179.1 deg at 16Hz, so the total is 179.1deg.

phase(TF1)=179.1deg

phase(TF2)=-40.7deg

phase(TF1/TF2)=219.8 deg (model).

Comparing the model and measurement, it seems to agree well, which means that the sign of L1 path relative to L2 is correct now.

(But it was not the case when H1:CAL-CS_DARM_ANALOG_ETMX_L1_GAIN was set to -1 because phase(TF1) in the model was -0.9deg due to additional 180 degrees, so the model didn't make sense.)

Images attached to this comment
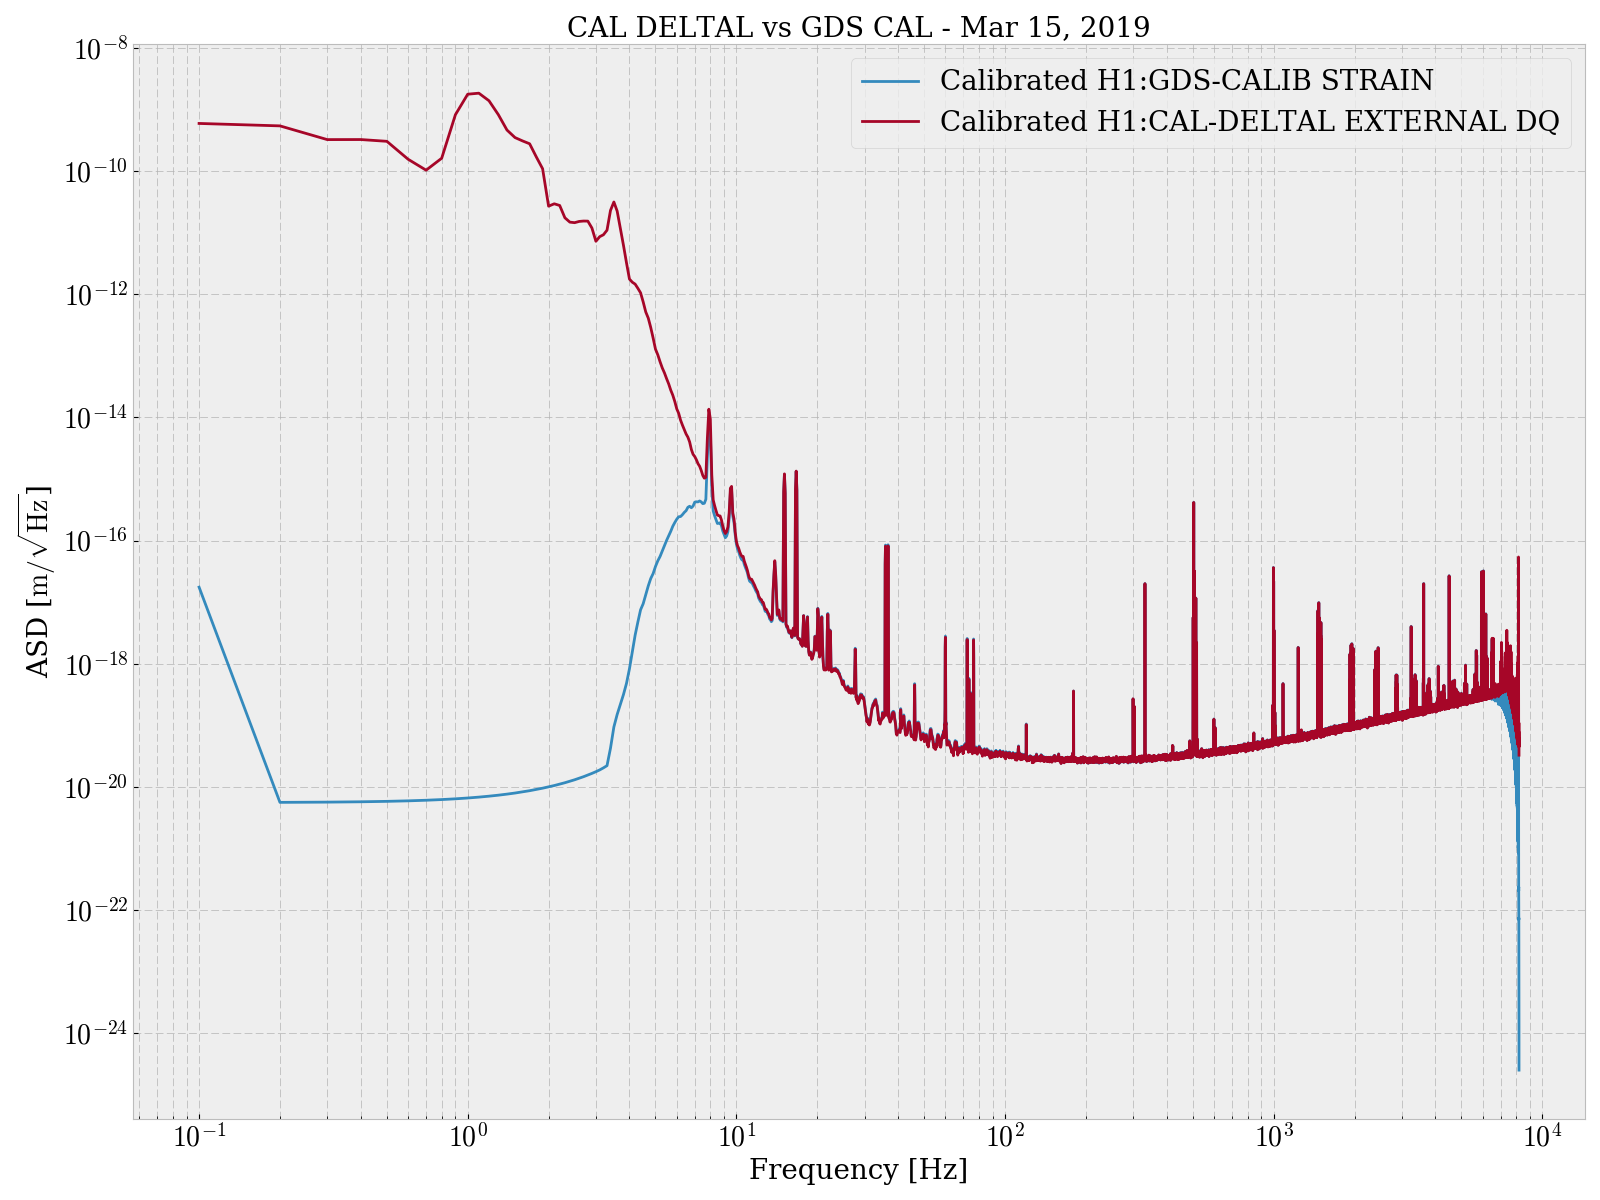
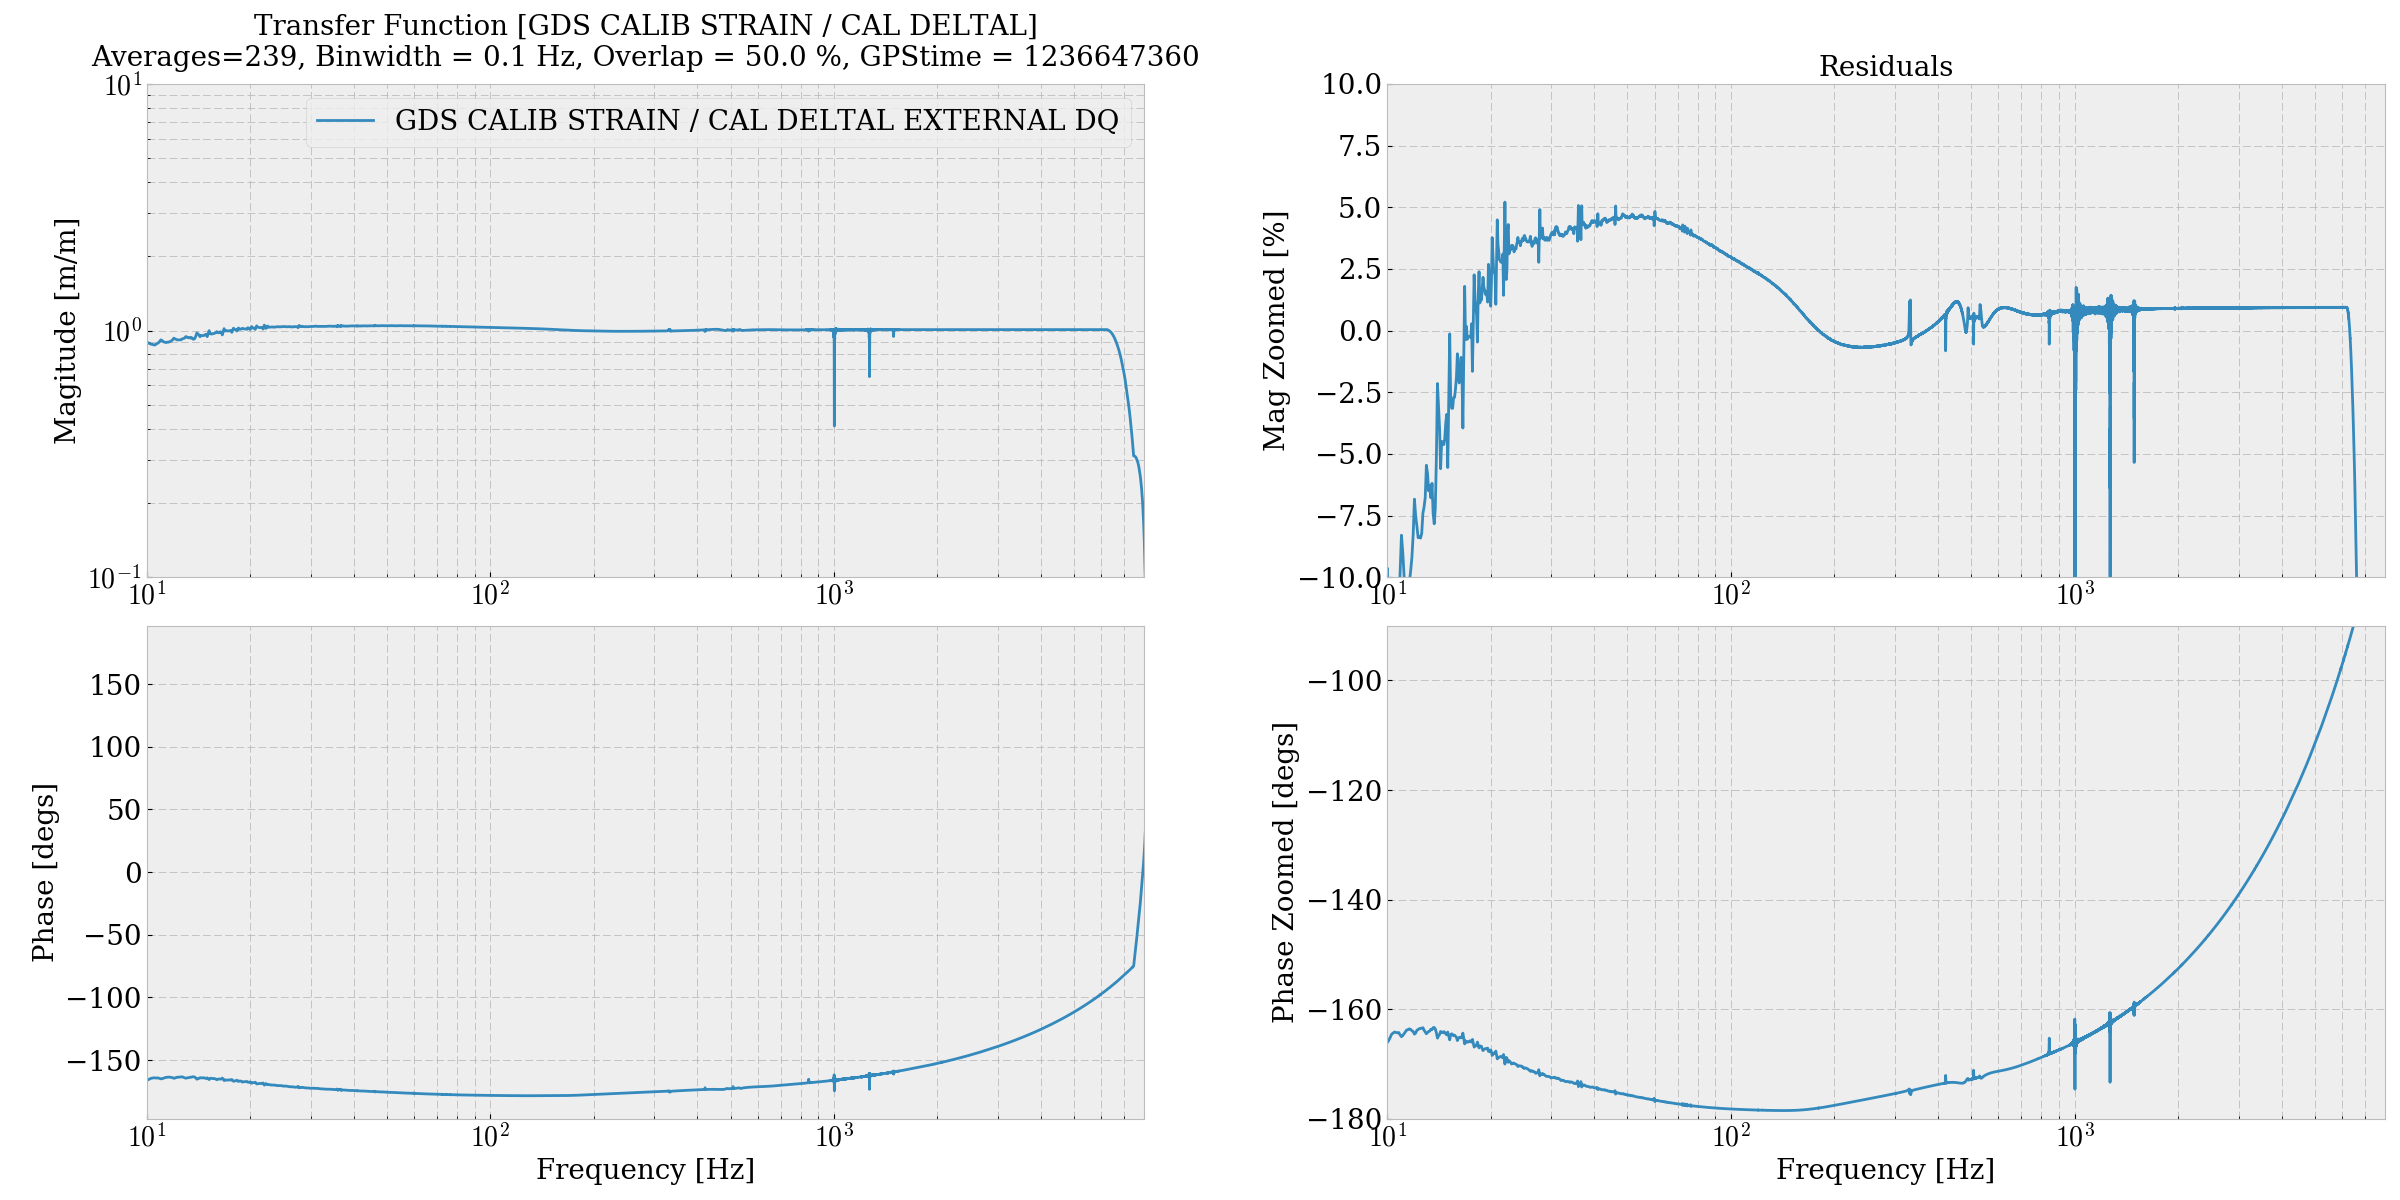
craig.cahillane@LIGO.ORG - 02:39, Friday 15 March 2019 (47553)
Here is a comparison of the ASD, TF, and uncalibrated time series between GDS CALIB STRAIN and CAL DELTAL EXTERNAL.

The calibration applied to GDS CALIB STRAIN was just a multiplication by L = 3994.5 m.  The calibration applied to CAL DELTAL EXTERNAL is attached as .txt: this is what is in the DARM FOM currently.  These calibrations are applied to both the ASD and TF plot.  
There appears to be around -170 degrees between GDS CALIB STRAIN / CAL DELTAL EXTERNAL DQ.  


Images attached to this comment
Non-image files attached to this comment
keita.kawabe@LIGO.ORG - 17:30, Friday 15 March 2019 (47570)

Oh sorry I attached slightly wrong file for sign-flip measurement. This is what I wanted to show.

Images attached to this comment
keita.kawabe@LIGO.ORG - 06:40, Tuesday 19 March 2019 (47652)

Test of DTT calibration for DELTAL (suspicious).

Since there was still some possibility that the DTT calibration was wrong, I asked JoeB to do the same measurement using LLO template but somehow he couldn't reliably pull the H1 data when he tried. I did it on my own following JoeB's advice.

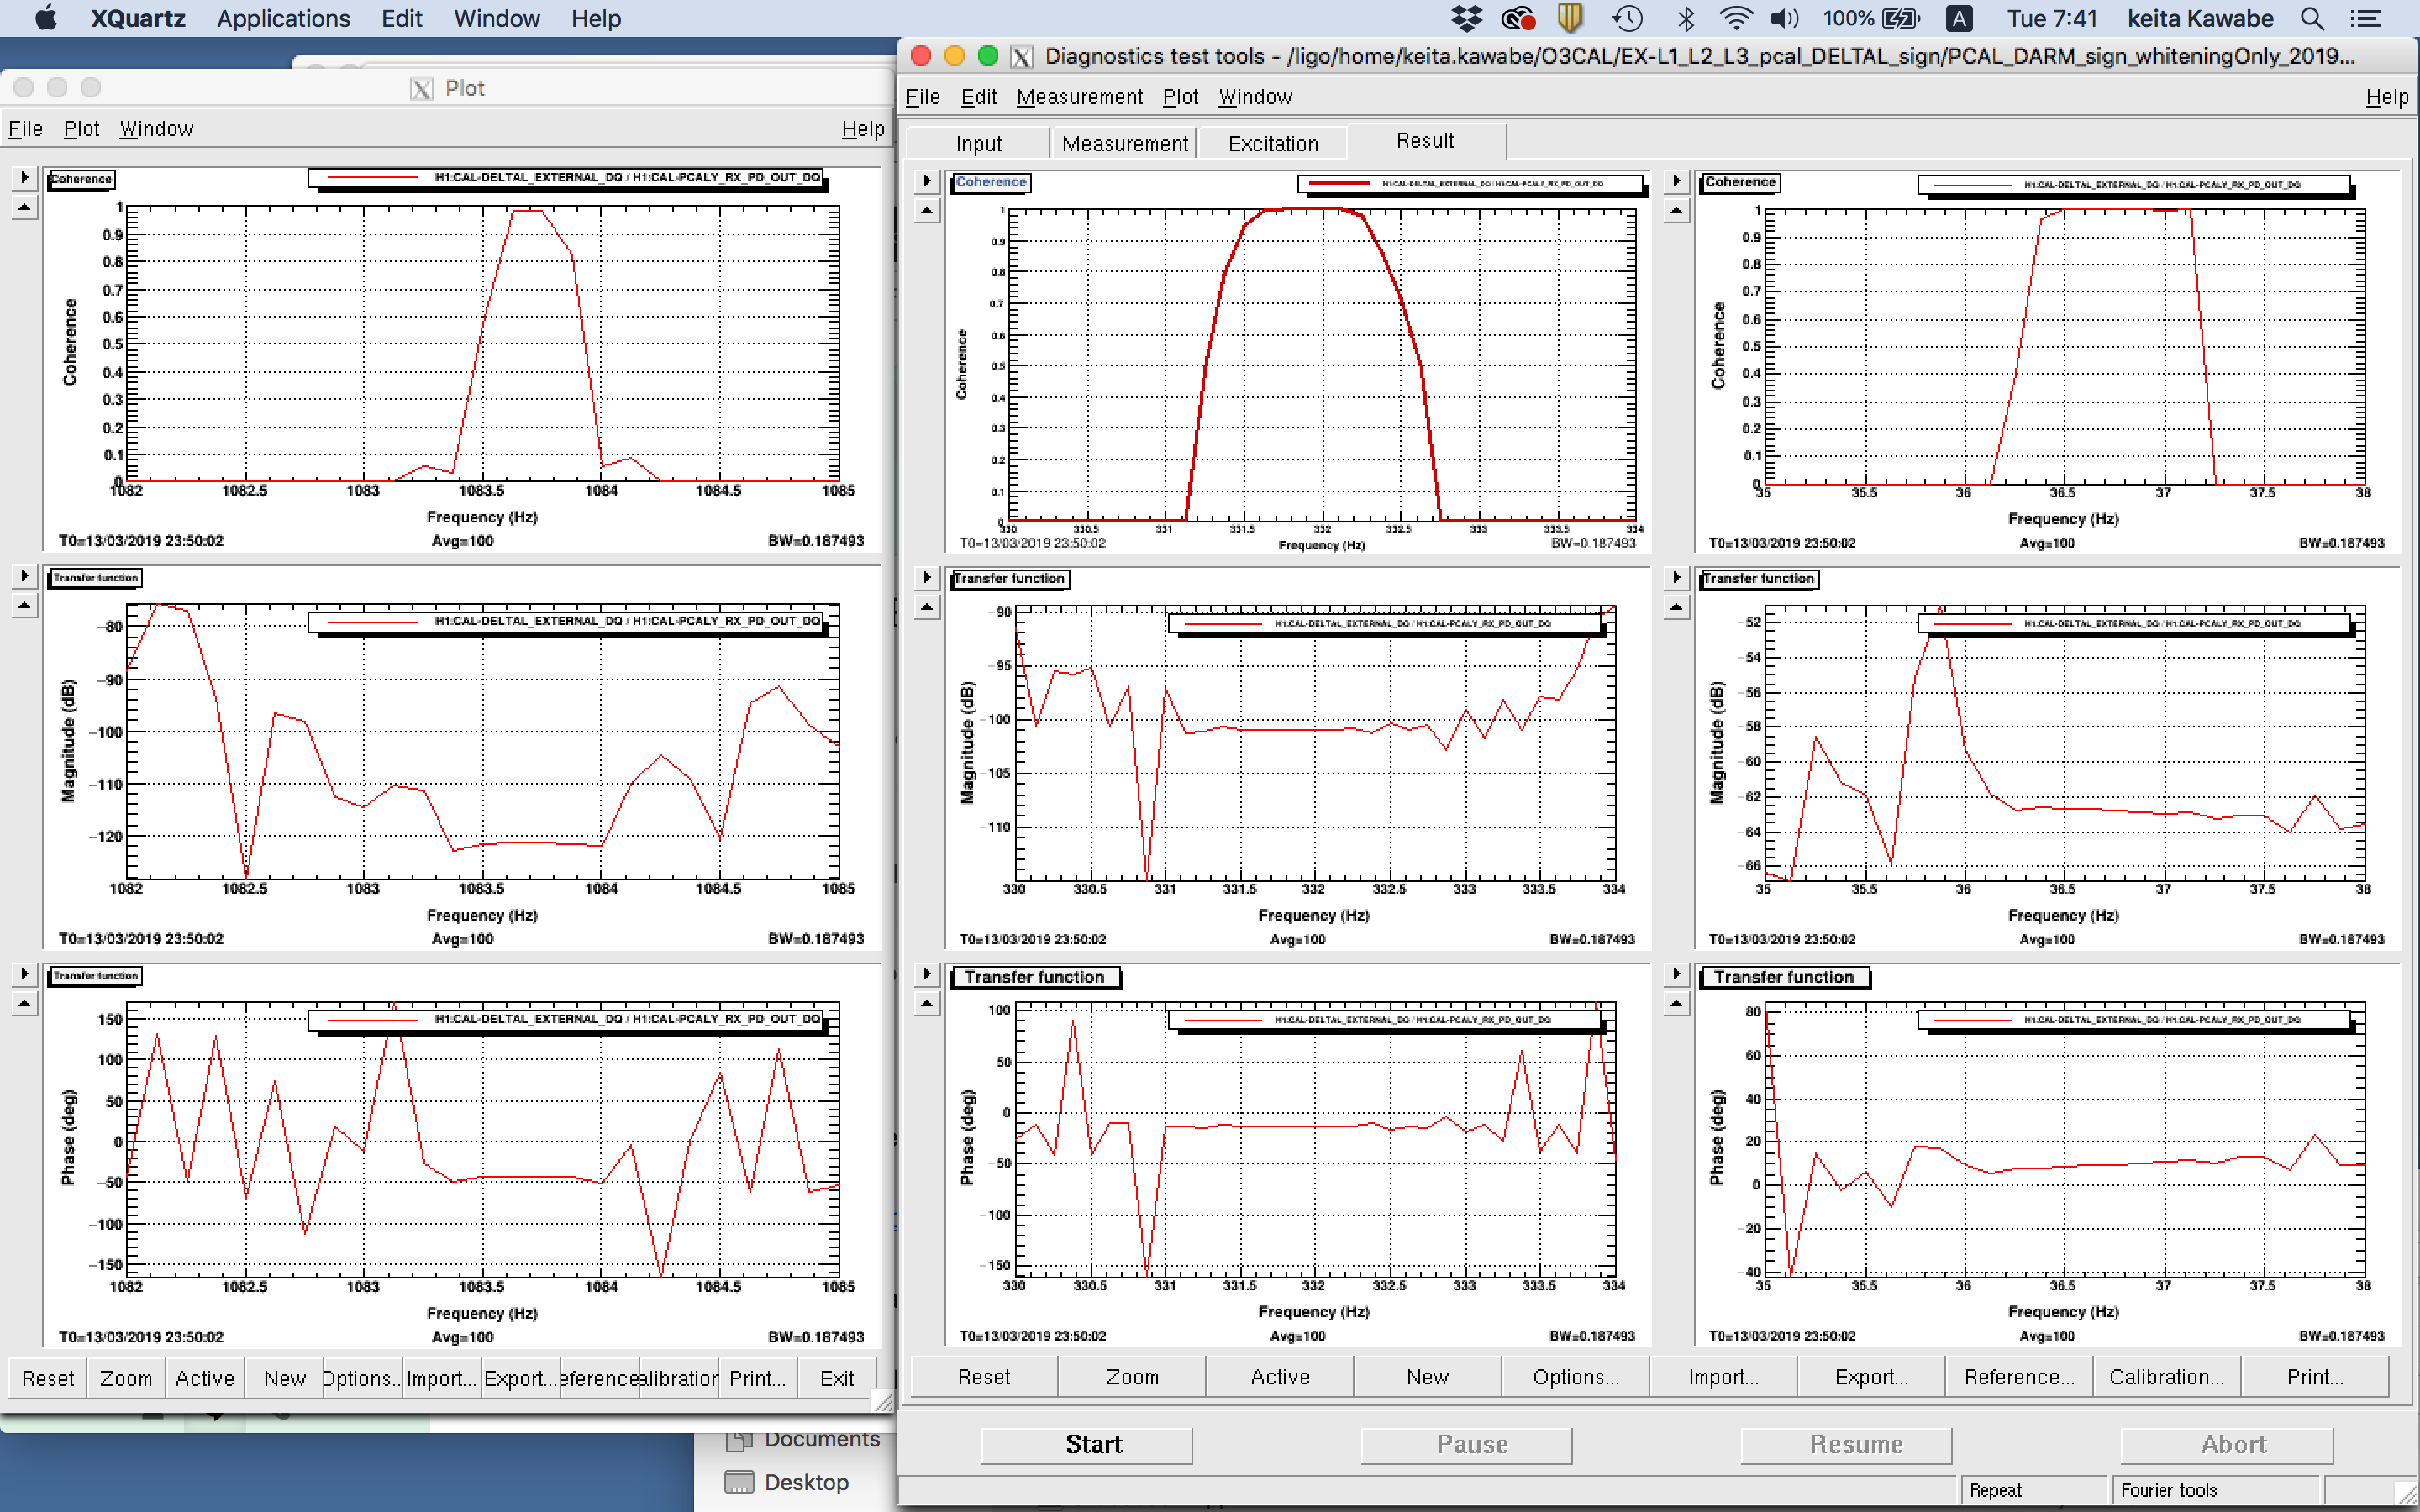
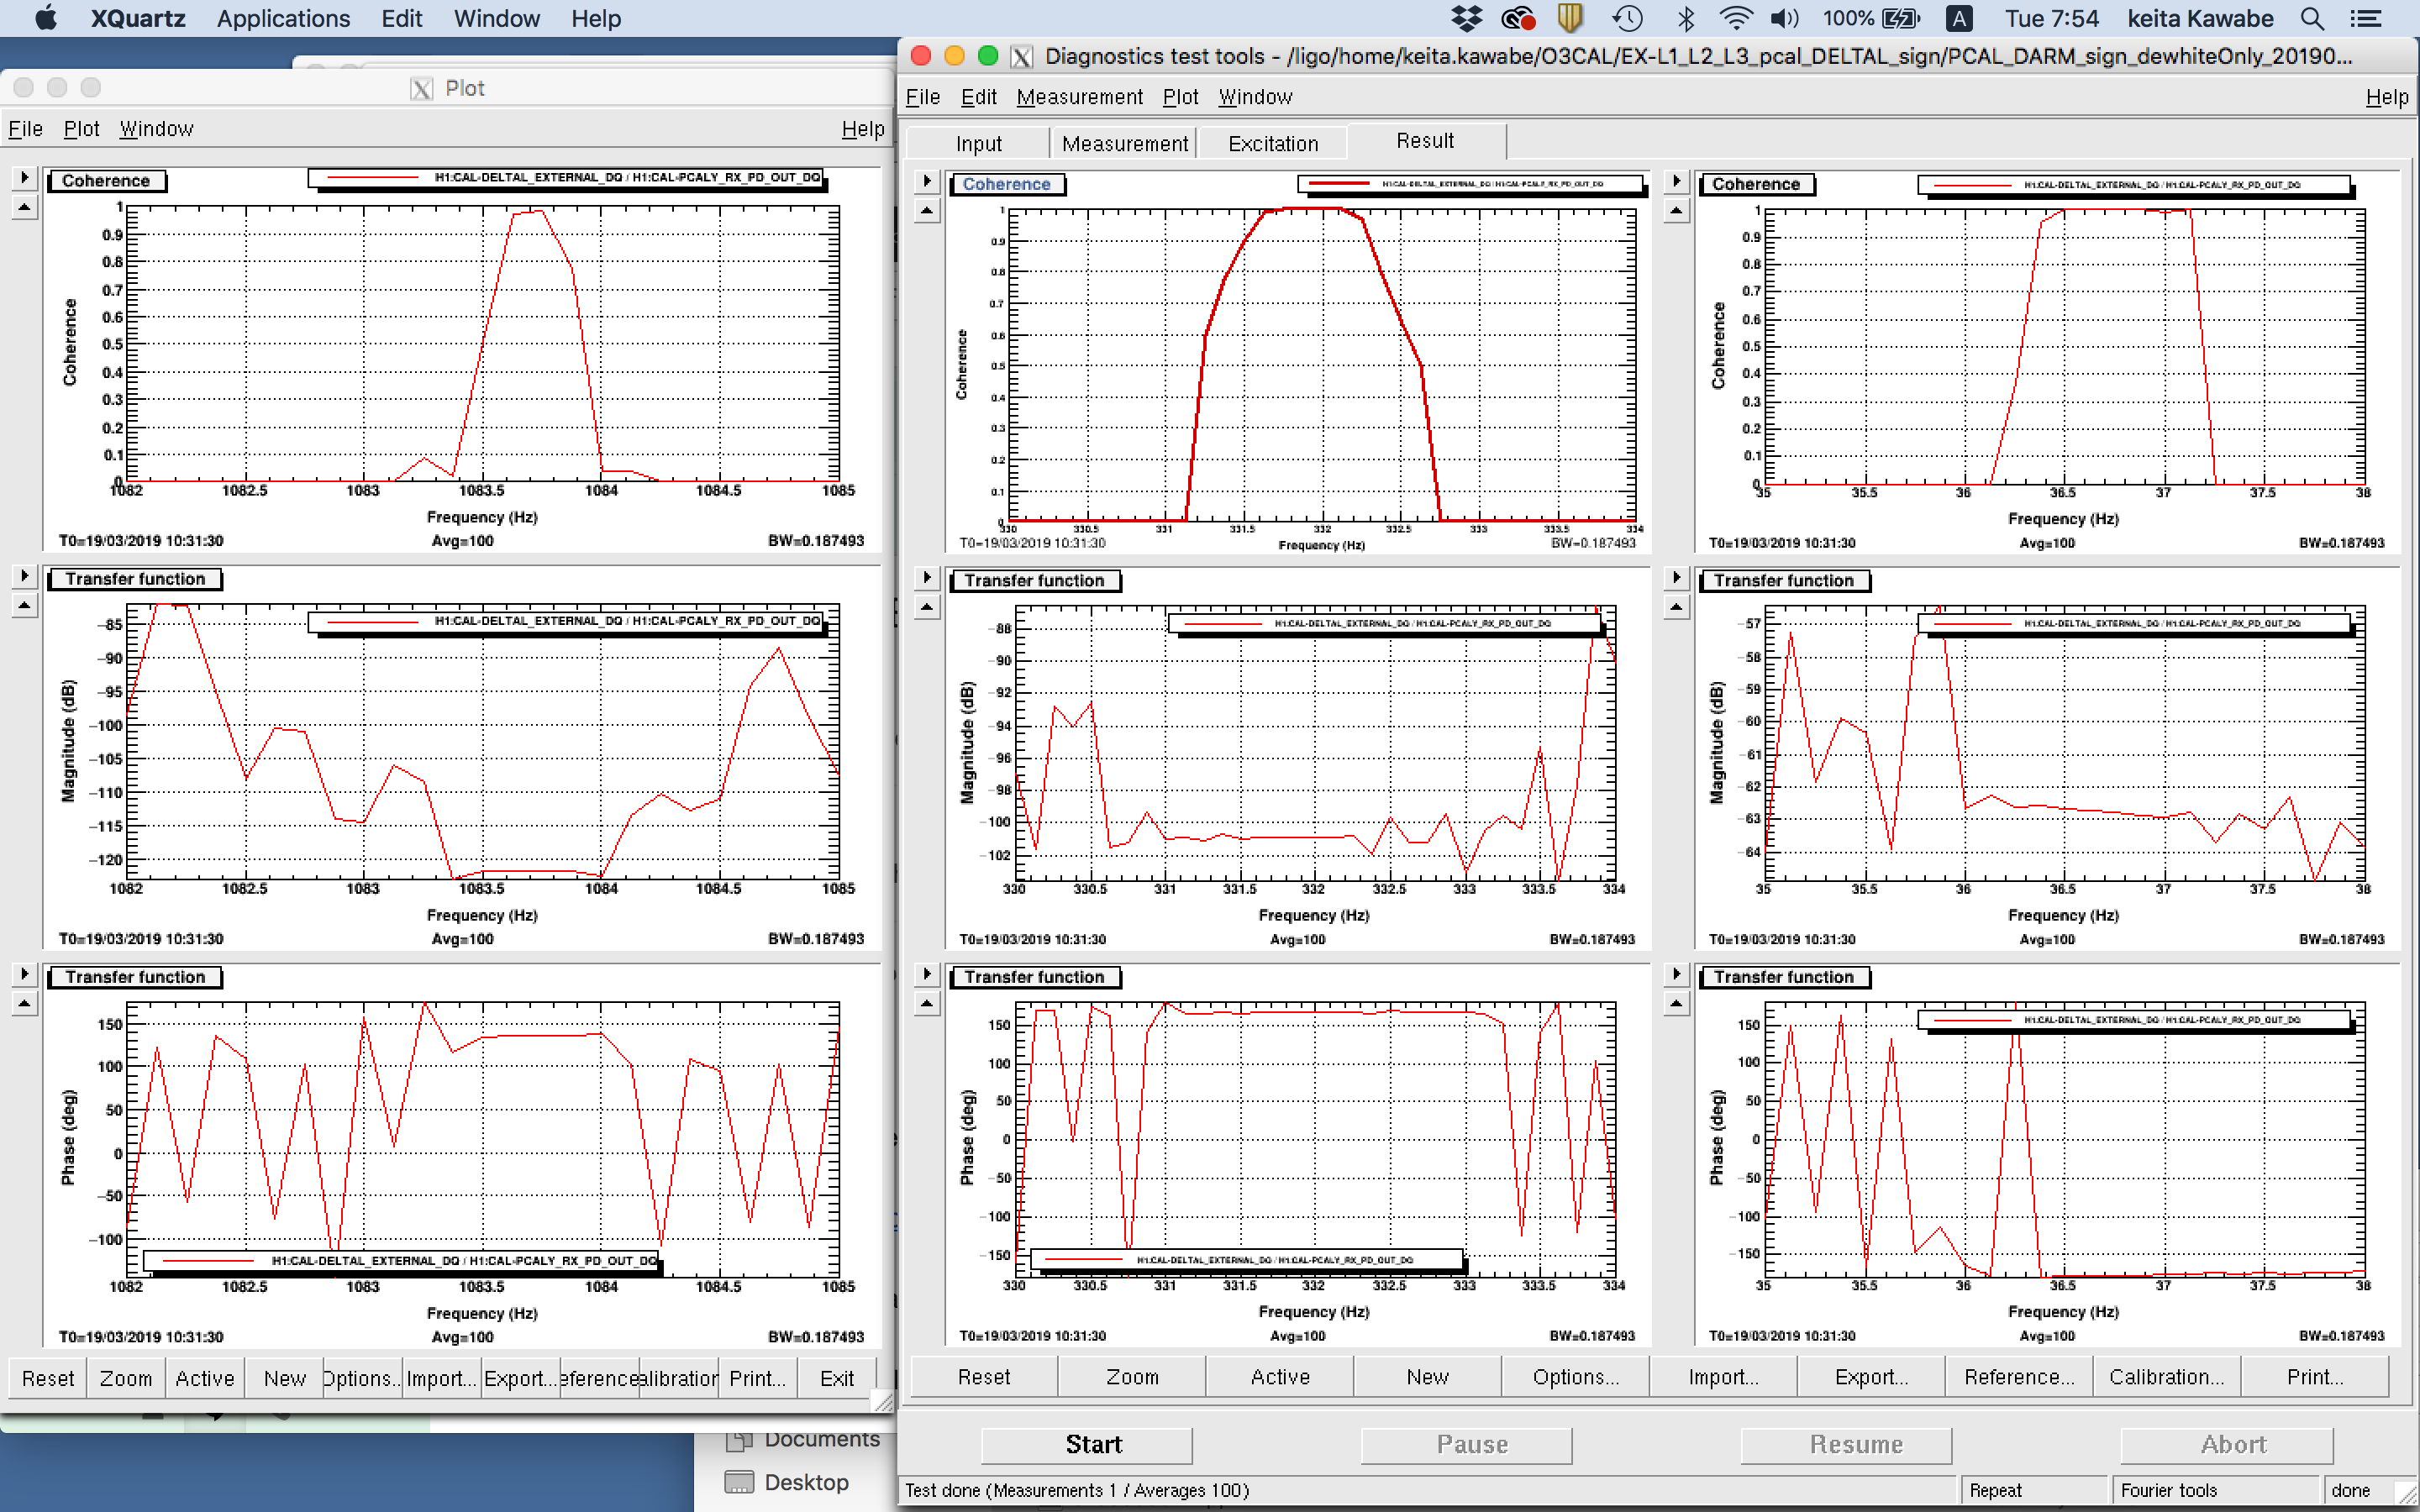
I removed the DTT calibration from LHO DARM FOM template, and put 6 pairs of [z,p]=[30,0.3] as dewhitening. This should be good enough. For Pcal I didn't change anything from my previous measurement (i.e. remove DTT calibration which was two poles at 1Hz, and just used the gain of 1 as the calibration).

The result shows that the sign was actually correct before we put the overall sign flip in (first attachment), and got incorrect after the overall sign flip (second).

The DTT templates were saved as

/ligo/home/keita.kawabe/O3CAL/EX-L1_L2_L3_pcal_DELTAL_sign/PCAL_DARM_sign_dewhiteOnly_20190313235002.xml

/ligo/home/keita.kawabe/O3CAL/EX-L1_L2_L3_pcal_DELTAL_sign/PCAL_DARM_sign_dewhiteOnly_20190319103130.xml

I have no idea how DTT template calibration is officially generated, so this could still be an intended behavior. Investigation continues.

Images attached to this comment
H1 SQZ (SQZ)
nutsinee.kijbunchoo@LIGO.ORG - posted 23:35, Wednesday 13 March 2019 - last comment - 01:03, Friday 15 March 2019(47518)
SQZ loss measurement with a single sideband CLF

Sheila, Daniel, Nutsinee


Late alog, but here it is!


Quick conclusion: 25.3% loss calculated from measured 3MHz transimpedance and single sideband transmission during full IFO lock. I forgot to set the oscillascope to 50Ohms impedance when I took the measurement of RF in Vpk so that's where most of the uncertainty would come from (after correcting it by a factor of 2).


Details: To measured the transimpedance we bounce the beam of the ITMY (PR2, SR2 misaligned). We first scanned CLF single sideband (crystal temperature moved away from nlg region but optimized for co-resonance) with 24dB whitening on the OMC DCPD on. Then we locked the OMC and took note of the current read by the DCPD SUM (without 24dB whitening). Using the transimpedance at DC (400Ohms), Vrms measured off RF in (the one that goes into the common mode board, this is to avoid 23dB attenuation) and the 3MHz transmission of 0.1 (using the OMC cavity pole of 0.3MHz) we calculated the transimpedance at 3MHz to be 659.5Ohms.


Z_rf = V_rf_rms/sqrt(I_clf*I_cr)


Then during the full lock, using 20mA for DCPD sum current and Vrms of the 3MHz RF in measured on the floor we calculated CLF current:

Iclf = (1/Icr)*(V_ifo_rms/Z_rf)^2 

Using the DCPD responsivity of 0.858 A/W we calculated the loss to be 23.5%. The factor of 10 to correct for OMC transmission has been included. So this is the amount of loss we have between OPO -> SRM -> OMC input. 


The code used for this calculation is attached.


Non-image files attached to this report
Comments related to this report
sheila.dwyer@LIGO.ORG - 01:03, Friday 15 March 2019 (47540)

Nutsinee, Sheila

We had another look at the transimpedance and loss from these single sideband measurements.

To summarize the measurement:

In single bounce off ITMY we measured 13mA of carrier  (Ic) through the OMC after running both AS and OMC alignment loops and offloading them.  With the OPO temperature detuned so that we have only a single sideband of CLF, we adjusted ZM1/2 to align the squeezer to the OMC, turned up the OMC whitening to 24dB, and measured 1.21uA of CLF power.  We then locked the OMC on the carrier, injected the single sideband at 3MHz from the squeezer, and measured -18.6dBm of 3MHz on the demod . 

Finding Transimpedance:

  • Using an OMC Finesse of 390 and FSR of 261MHz, the transmission of the OMC for the 00 mode at 3.125 MHz is 1/(1+(2*Fin*sin(pi*3e6/FSR)/pi)^2) = 1.1% of the transmission on resonance (the factor of 10 above was an error).  So the peak photo current we expect at 3 MHz is sqrt(Ic*Iclf*0.011) = 13.4uA. 
  • After the OMC transimpedance amp, there is a split off chassis that amplifies the 3MHz signal from the DCPDs, D1700376.  The test report that we have found is E1700363, which reports a gain of 19.7dB for 3 MHz, so the -18.6dBm measured at the demod is 3.8mV peak of 3MHz signal out of the transimpedance amp.  
  • The transimpedance at 3MHz is then 287 Ohms.  
  •  Koji's measurement is roughly consistent with this. 

Estimating loss:

  • With the OPO temperature detuned so we have no nonlinear gain and only a single 3 MHz sideband, Nutsinee measured 0.757uW of 3MHz on SQZT6.  With the interferometer locked, Nutsinee measured at the demod 117.6mV pp with the scope in high impedance mode, which means the peak voltage out of the transimpedance amp was 3 uV once we take into account the 19.7dB gain of the 3MHz pick off chassis.  Using the transimpedance from the first measurement, we have a peak photo current at 3 MHz of 10.6uA.
  • Using the DC photo current of 20mA, and the photodiode responsivity of 0.858A/W, this implies that there was 7.1 nW of 3MHz single sideband reaching the OMC DCPDs during the measurement.  
  • Using the 1.1% transmission of the OMC for the 00 mode at 3MHz, we get an efficiency of 76.5% for the propagation of the 3MHz sideband from the beam diverter to the 00 mode arriving at the OMC.  

Loss budget:

This 76.5% efficiency sounds similar to the efficiency calculated above, but that is because two errors are roughly canceling (overestimating the transmission of the OMC at 3MHz and leaving out the gain of the 3MHz pick off chassis).  

H1 ISC
jonathan.richardson@LIGO.ORG - posted 18:46, Wednesday 13 March 2019 - last comment - 16:58, Friday 15 March 2019(47501)
A Python-based live noise budgeting tool

[Jon, Jamie, Chris, Craig]

Summary

We've developed and installed a new Python tool for budgeting IFO noise: aligoNB. At its core, this package contains Python translations of the Matlab scripts used to generate H1 noise budgets. However, it also significantly extends our noise-budgeting abilities:

Several examples illustrating the different ways this tool can be used are shown below.

Using the code

In general, the code is executed from the command line with a budget argument (either "H1" or "L1") and one or more option flags configuring properties of the budget. The full usage can be printed to the terminal by executing the help command:  $ aligonb -h

Examples

1. Generate a live-updating noise budget

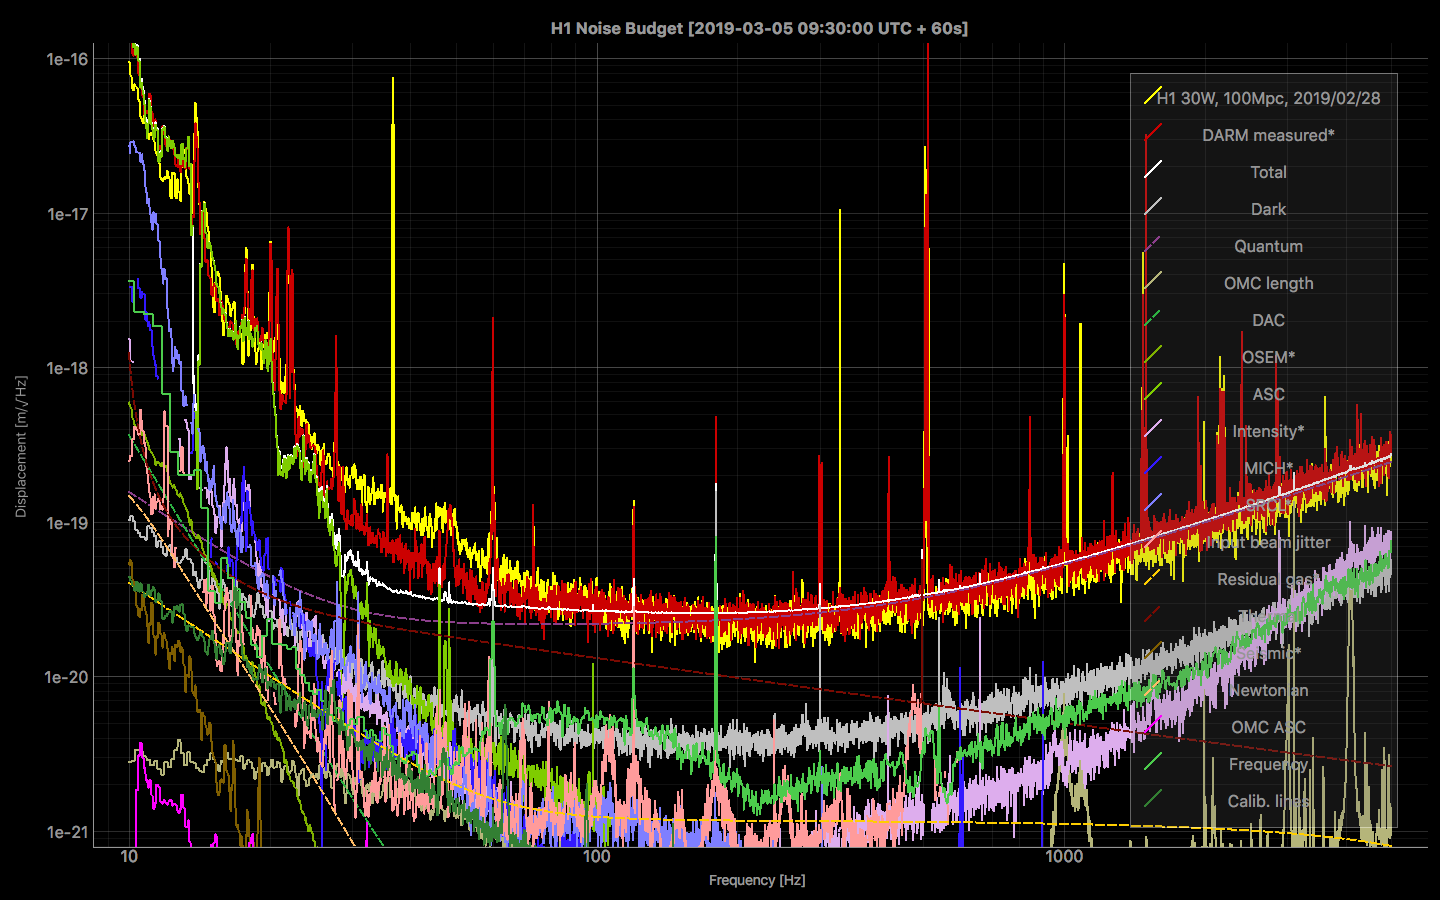
$ aligonb H1 --online

launches a window displaying the online (current) noise budget. By default, the traces auto-update every 3 seconds. The update interval can be changed by providing a numerical argument in seconds immediately after the --online flag.
2. Generate a static budget from a specific time

$ aligonb H1 --time 1235813418 --span 60

similarly generates a static budget for data in the GPS time range 1235813418 to 1235813418+60 seconds. If no time arguments are provided, the time range defaults to that of the last H1 noise budget.

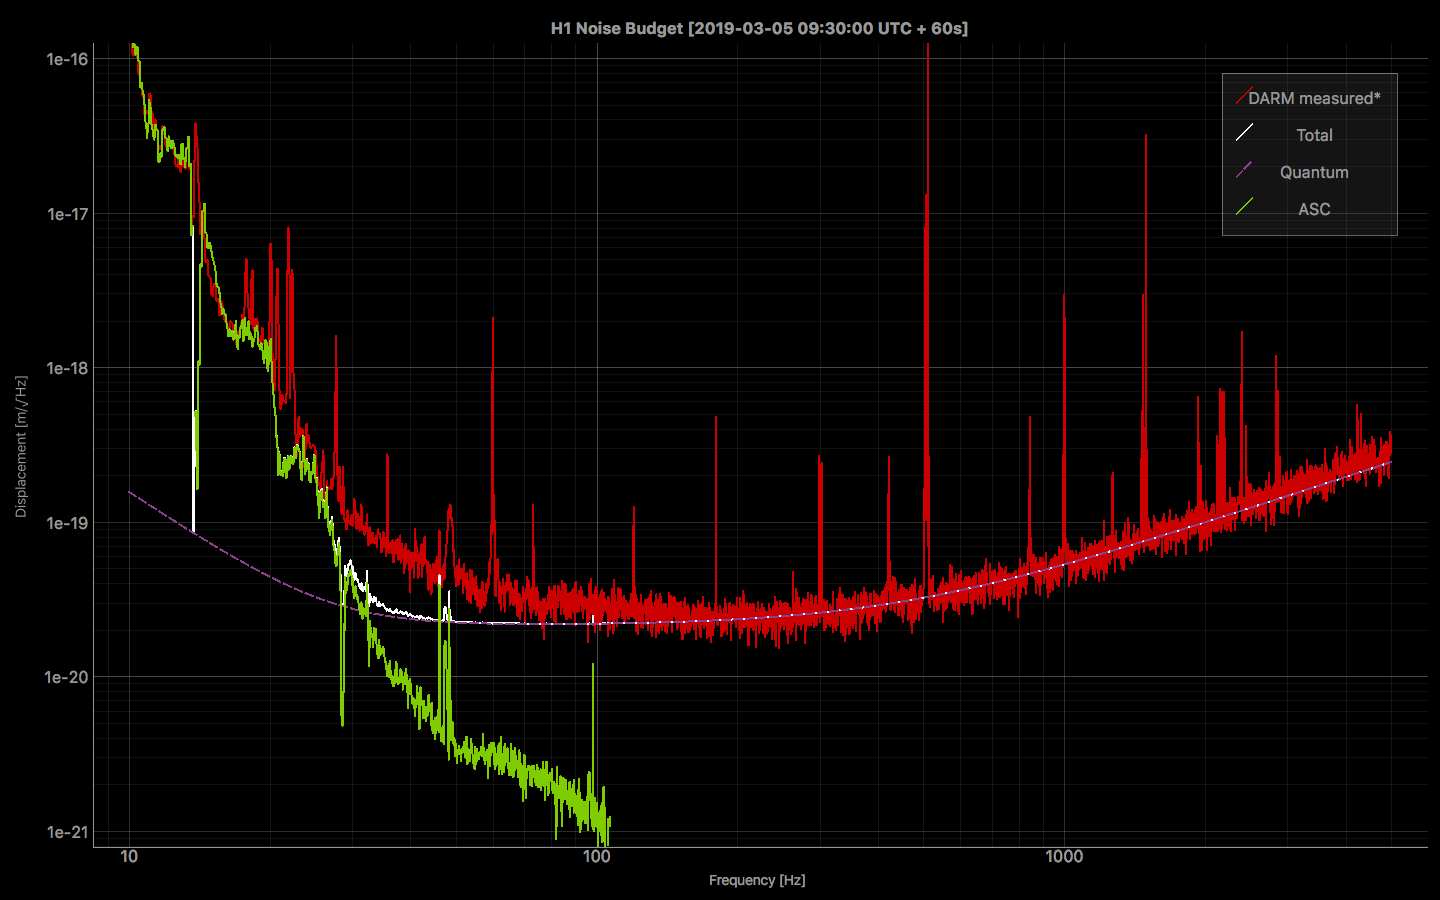
3. Include only specific noise terms in the budget

$ aligonb H1 DARMMeasured Quantum ASC

generates a budget consisting of only the Quantum and ASC noise terms. The noise terms are separated by spaces and can be arbitrarily many.
4. List all available noise terms

$ aligonb H1 -l

prints the full list of available H1 noises to the terminal:

H1
H1.ClosedLoopSensing
H1.Dark
H1.Quantum
H1.Quantum.ClosedLoopSensing
H1.Quantum.Shot
H1.Quantum.RadiationPressure
H1.OMCLength
H1.DAC
H1.OSEM
H1.ASC
H1.ASC.CHARDPit
H1.ASC.CHARDYaw
H1.ASC.DHARDPit
H1.ASC.DHARDYaw
H1.ASC.MICHPit
H1.ASC.MICHYaw
H1.ASC.PRC2Pit
H1.ASC.PRC2Yaw
H1.ASC.CSOFTPit
H1.ASC.DSOFTPit
H1.ASC.SRC2Pit
H1.ASC.SRC2Yaw
H1.Intensity
H1.MICH
H1.SRCL
H1.InputJitter
H1.InputJitter.InputJitterPit
H1.InputJitter.InputJitterYaw
H1.ResidualGas
H1.Thermal
H1.Thermal.SuspensionThermal
H1.Thermal.CoatingBrownian
H1.Seismic
H1.Newtonian
H1.OMCASC
H1.OMCASC.OMCPosX
H1.OMCASC.OMCPosY
H1.OMCASC.OMCAngX
H1.OMCASC.OMCAngY
H1.Frequency
H1.CalLines
H1.CalLines.PCALY
H1.CalLines.PCALX
*H1.DARMMeasuredRef0
*H1.DARMMeasured

Noise terms beginning with an asterisk are reference traces, and are not included in the calculated noise total. Noise terms containing sub-components (e.g., H1.InputJitter.InputJitterPit and H1.InputJitter.InputJitterYaw) can be sub-budgeted as described below.

5. Generate a noise sub-budget

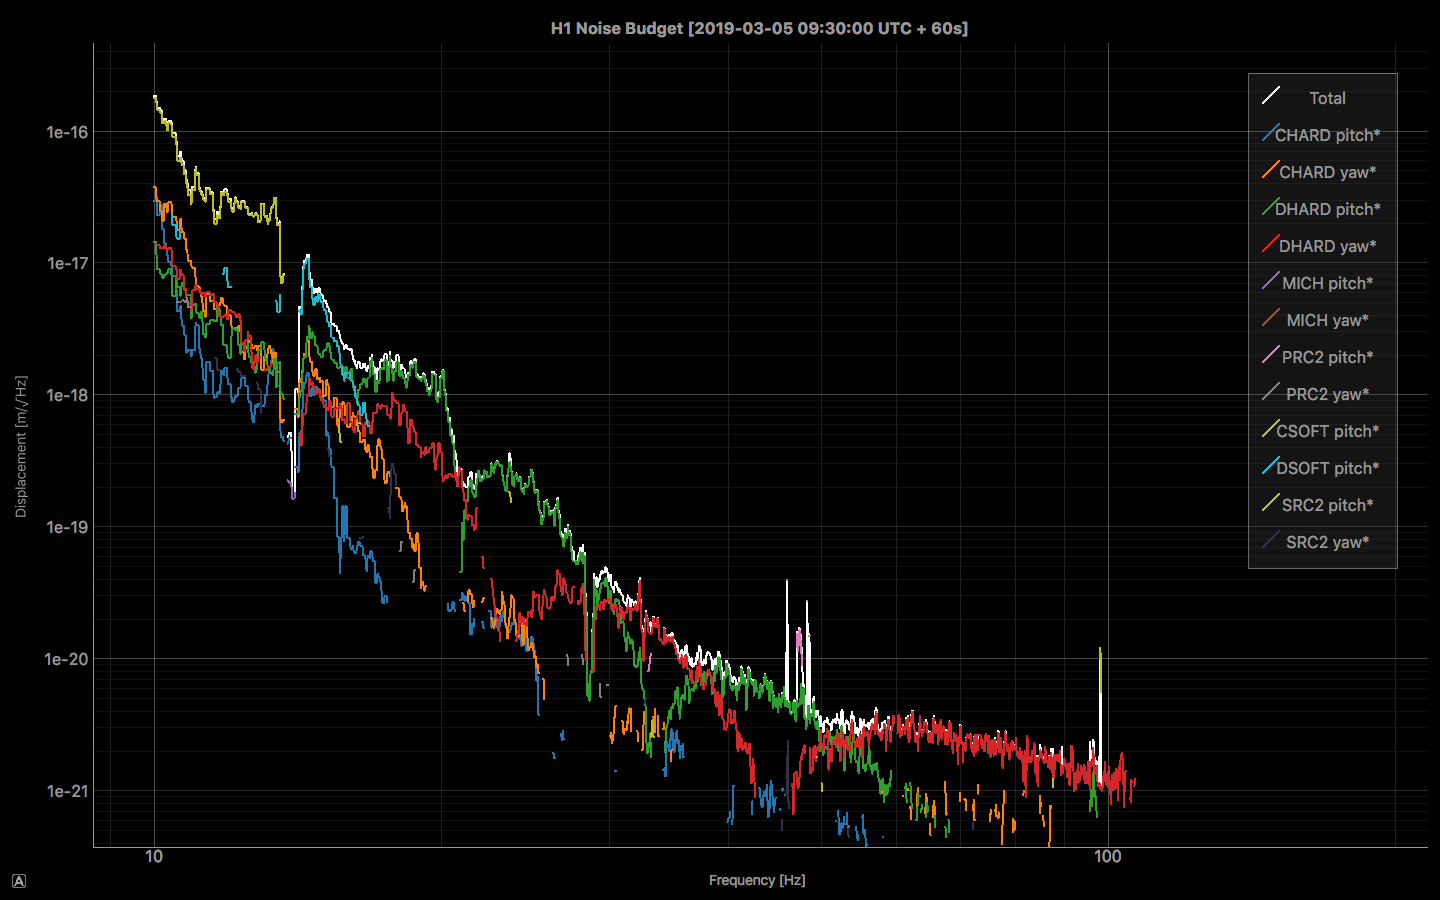
$ aligonb H1.ASC

generates the budget of sub-terms which make up the ASC noise. In this case, the sub-terms are the contributions from each angular degree of freedom. Sub-budgets can be generated for any noise term which has sub-components defined (these can be identified using the  $ aligonb H1 -l  command described above).
Developing the code

Location and organization

Anyone working with the noise budget is welcome to edit the code as necessary. The code base is located at /ligo/gitcommon/Noisebudget/aligonb.

Relative to this directory, the file ./aligoNB/H1/budget.py contains the noise and budget class definitions. New noise terms can be defined here following the convention of the existing terms, and the new class name should be added to the list of noises inside the H1 class. Existing noise terms can also be modified as needed.

When a budget is generated, each noise class has three methods that are executed sequentially:

The most common workflow is to load a measured coupling from file using load(), pull NDS witness-channel data using update(), and finally apply the coupling to the data using calc(). The methods are broken up this way to prevent static data from having to be reloaded every time a live budget updates. The load() method is called only once initially, while update() and calc() are called at every update.

The code is under git version control (https://git.ligo.org/NoiseBudget/aligoNB). We ask that any changes be pushed back to this central repository so that a master copy can be maintained. The issue tracker can be used to report bugs and to request new functionality.

Work in progress

Jamie is continuing to develop an improved user interface which will enhance the appearance of the plotting. He is also adding binary NS inspiral range information to the plots. Craig is working with Gabriele to implement an estimator of the total scatter noise, which will be a new addition to the H1 budget. Jon will work on producing an analogous Python translation of the LLO budget.

Images attached to this report
Comments related to this report
rich.abbott@LIGO.ORG - 20:34, Wednesday 13 March 2019 (47513)
That is an unbelievably cool tool.  Just beautiful.
jameson.rollins@LIGO.ORG - 22:29, Wednesday 13 March 2019 (47516)

Couple of additional notes:

  • I've added a script that will synchronize the measured couplings from the legacy location in simple-noise-budget into the new aligoNB location:
$ /ligo/gitcommon/NoiseBudget/aligoNB/aligoNB/H1/sync-couplings

Be sure to git commit and push the updated couplings after synching.

  • Users should never need to override the update() method for our usage here.  The included plotter handles fetching the NDS data running the base update method to make the data available to the calc() method in the self.nds_data attribute.
  • Please report issues to the issue tracker:
  • The current online plotter puts a bit of a heavy load on the NDS server, so we probably don't want to run too many of them simultaneously.  I'm working on a more efficient version that will be available soon.
jameson.rollins@LIGO.ORG - 16:58, Friday 15 March 2019 (47568)

The --online plotting option has been disabled until further notice.

The prototype online plotting method was implemented in a crude and inefficient way, and seemed to be triggering instability in the NDS1 server.  I've disabled it until I can implement a more efficient method.

H1 ISC (ISC)
hang.yu@LIGO.ORG - posted 13:38, Monday 11 March 2019 - last comment - 08:07, Friday 15 March 2019(47433)
Quadratic A2L decoupling

It seems that we could enhance our A2L decoupling by including the quadratic terms such as DH_P(t) * CS_P(t) when doing offline noise subtraction.

Please see the attached plot for an example. 

Details:

Note that a2l noise in t-domain is given by 

    dL(t) = dy(t) * dTheta(t),

where dy is the spot position and dTheta is the angular motion of a mirror. In the online A2L feedforward (as done in the SUS L2 stage), we do

    dL_ff(t) = dy(DC) * dTheta(t),

i.e., subtracting the dominating 'linear' coupling. The dither locking basically does the same thing as it servos dy(DC) to a fixed value. 

On the other hand, we also have

    dy(t) ~ dy/dTheta * dTheta( t - t_delay),

where dy/dTheta is a constant determined completely by the cavity's geometry. For the off-resonance 01/10 modes, the delay time is on the order

    t_delay ~ 2L/c ~ 3x10^{-5} sec,

which is effectively 0 for the A2L coupling we are interested in. 

As a result, it suggests that the A2L noise will contain terms like 

    dL(t) ~ dTheta(t)**2,

in the time domain. 

The argument above suggests that in the offline data cleaning, in addition to include the linear ASC terms, such as DH_P(t), we can also include quadratic terms that are the products of ASC outputs in the time-domain, e.g., DH_P(t) * CS_P(t). 

In the attached plot, the blue trace is the calibrated DARM ('GDS-CALIB_STRAIN') at gps: 1236207018 + [0, 2048] sec. I took 8 sec of data per fft and 50% overlap, thus 511 averages in total.

In the orange trace is the DARM after removing all the linear ASC coupling using a freq-domain MISO-coherence-based subtraction. We don't see any significant improvement over the noise, which is as expected as the soft dithering loops should zero the linear coupling. 

In the green trace, we further include quadratic ASC outputs and again do the freq-domain MISO-coherence analysis. This seems to improve the subtraction in the 10-30 Hz band where the ASC noise dominates.

The caveat is that the subtraction done so far are all in the freq-domain. I haven't tested how-well a t-domain Wiener filter could reproduce the result. More importantly, due to the amount of clean lock stretches available, we haven't checked how stationary the quadratic coupling is from one time to another. 
Nevertheless, the initial result seems promising, and including those quadratic terms should not be technically hard in the offline subtraction. 

Non-image files attached to this report
Comments related to this report
hang.yu@LIGO.ORG - 08:07, Friday 15 March 2019 (47527)ISC

Gabriele, Hang

Gabriele pointed out that the f-domain subtraction using coherence could easily lead to over subtraction, as the finite amount of average could over-estimate the coherence. For example, the improvement above 30 Hz in the previous attached plot could hardly be real as the ASC noise should have been rolled off there. 

We thus looked at a longer data stretch of 10240 sec (~ 3 hrs; 5 times what we used in the previous study) starting at gps 1236511818. Again we use 8 sec per fft and 50% overlaps, and therefore 2559 averages. This should mitigate the errors due to finite averaging.  The result is attached to this entry. 

In the first plot we show the DARM noise spectra before and after subtracting the linear/quadratic ASC channels.

In the second plot we present the largest contributions' projection to DARM (ranked by the contribution at 25 Hz).

In the last one we compute the SISO coherence between [CH_Y(t)xCS_P(t)] and DARM as a sanity check for result plotted in the second figure. 

===================================================================================

Some conclusions based on the plot:

    1. We still see a significant (visible by eyes) improvement in the 15-30 Hz band by including the quadratic terms such as DH_P(t) x CS_P(t). The level of noise reduction is roughly comparable to what we had in the previous entry in this band. 

    2. Below 20 Hz the dominating nonlinear correction comes from [CH_P(t) x DH_P(t)] which is more or less expected. On the other hand, the largest contribution at 25 Hz is from [CH_Y(t) x CS_P(t)]. This is a bit surprising. Nonetheless, we also looked at the SISO coherence and saw a similar amount of projection to DARM. Thus the coupling should be real. It suggests that we may have large P/Y and C/D cross-coupling simultaneously.

    3. Above 30 Hz, the quadratic subtraction matches the linear subtraction. This should be viewed as a reduction in the systematic error in our approach. 

    4. In the 10-15 Hz band, even linear subtraction can still improve the noise performance. This is an indication that in addition to the geometrical a2l coupling (that is freq independent), we also have a path of angle->power->length coupling (that scales ~ 1/f^2 and thus is visible only at low frequencies; this path also cannot be subtracted by the dithering soft loop which handles only the geometrical one). This is consistent with the previous observations that as we decreased the dithering frequency (thus locking pt was more biased by the radiation P effect), the ASC->DARM coupling got worse at ~20 Hz.

Non-image files attached to this comment
Displaying reports 42541-42560 of 88682.Go to page Start 2124 2125 2126 2127 2128 2129 2130 2131 2132 End