Displaying reports 42601-42620 of 88682.Go to page Start 2127 2128 2129 2130 2131 2132 2133 2134 2135 End
Reports until 16:03, Wednesday 13 March 2019
H1 General
jeffrey.bartlett@LIGO.ORG - posted 16:03, Wednesday 13 March 2019 (47505)
Ops Day Shift Summary
Ops Shift Log: 03/13/2019, Day Shift 15:00 – 23:00 (08:00 - 16:00) Time - UTC (PT)
State of H1: Locked at NLN
Intent Bit: Maintenance
Support: Jenne, Sheila
Incoming Operator: N/A
Shift Summary: The recovery from the 16:23 lock loss was difficult due to the SR3 heater being on at the lockloss. Tried relocking with the heater still on without success. Turned off the SR3 heater and after things cooled down and several rounds of alignment adjustments and relocking attempts, the IFO relocked at NLN, with a range of around 85.7. Turned the IFO back to the commissioning team.       
 
Activity Log: Time - UTC (PT)
15:00 (08:00) Start of shift
15:35 (08:35) Robert – In LVEA for PEM injections near HAM6
15:55 (08:55) Kara – Going into the LVEA for PEM injections
15:58 (08:58) Nutsinee – Going to HAM6 area for PEM injections
16:23 (09:23) Lockloss
18:37 (11:37) Nutsinee – Out of the LVEA
19:50 (12:50) Robert, Kara – Out of the LVEA
21:00 (14:00) Dick – Into CER to check equipment for pending work
21:10 (14:10) Dick – Out of the CER
22:20 (15:20) Relocked at NLN
23:00 (16:00) End of Shift


H1 ISC
gabriele.vajente@LIGO.ORG - posted 14:43, Wednesday 13 March 2019 (47503)
An attempt at a model of scattered light

My goal was to see if we can build a consistent model of the scattered light noise coming from OMC ASC motion, based on Georgia's injections (47446). Hopefully the A2L improvement described by Jenne (47488) will mitigate the problem.

For future reference, below the times of 0.5 Hz line injection:

'ANG_X': [1236416153, 1236416985, 1236416435, 1236416612],
'ANG_Y': [1236398014, 1236398260],
'POS_X': [1236398867, 1236398529],
'POS_Y': [1236399517, 1236399737],
'quiet': [1236422949]

The model is the same I used in 47423, but this time I used a linear combination of all four OMC ASC signals ('H1:OMC-ASC_ANG_X_INMON', 'H1:OMC-ASC_ANG_Y_INMON', 'H1:OMC-ASC_POS_X_INMON', 'H1:OMC-ASC_POS_Y_INMON') as the witness for the scatterer motion. So we have four k coefficients and two f coefficients:

where x_i are the OMC signals, "band-passed" ad 0.5 Hz as described in 47423

I considered two possible approaches to the fit of the parameter model:

  1. treat every injection separately, and fit the optimal parameters independently for each of them
  2. fit the same parameters to all injections simultaneously

In both cases I did not include the quiet time in the fit.

Fit each injection separately

The plot below shows the best fit of the scattered light model above for each injection separately. You can see that the model fits all injections quite well, but the optimal parameter in each case are quite different. In all cases it seems the largest contribution to building the witness channel comes from H1:OMC-ASC_POS_X_INMON. But the value of the k coefficient that converts the witness to scatterer motion varies a lot, as well as the coupling coefficients f_1 and f_2. The blue curve is DARM, the orange curve is the modeled scattered light noise. The parameters for each fit are listed in the box in each plot.
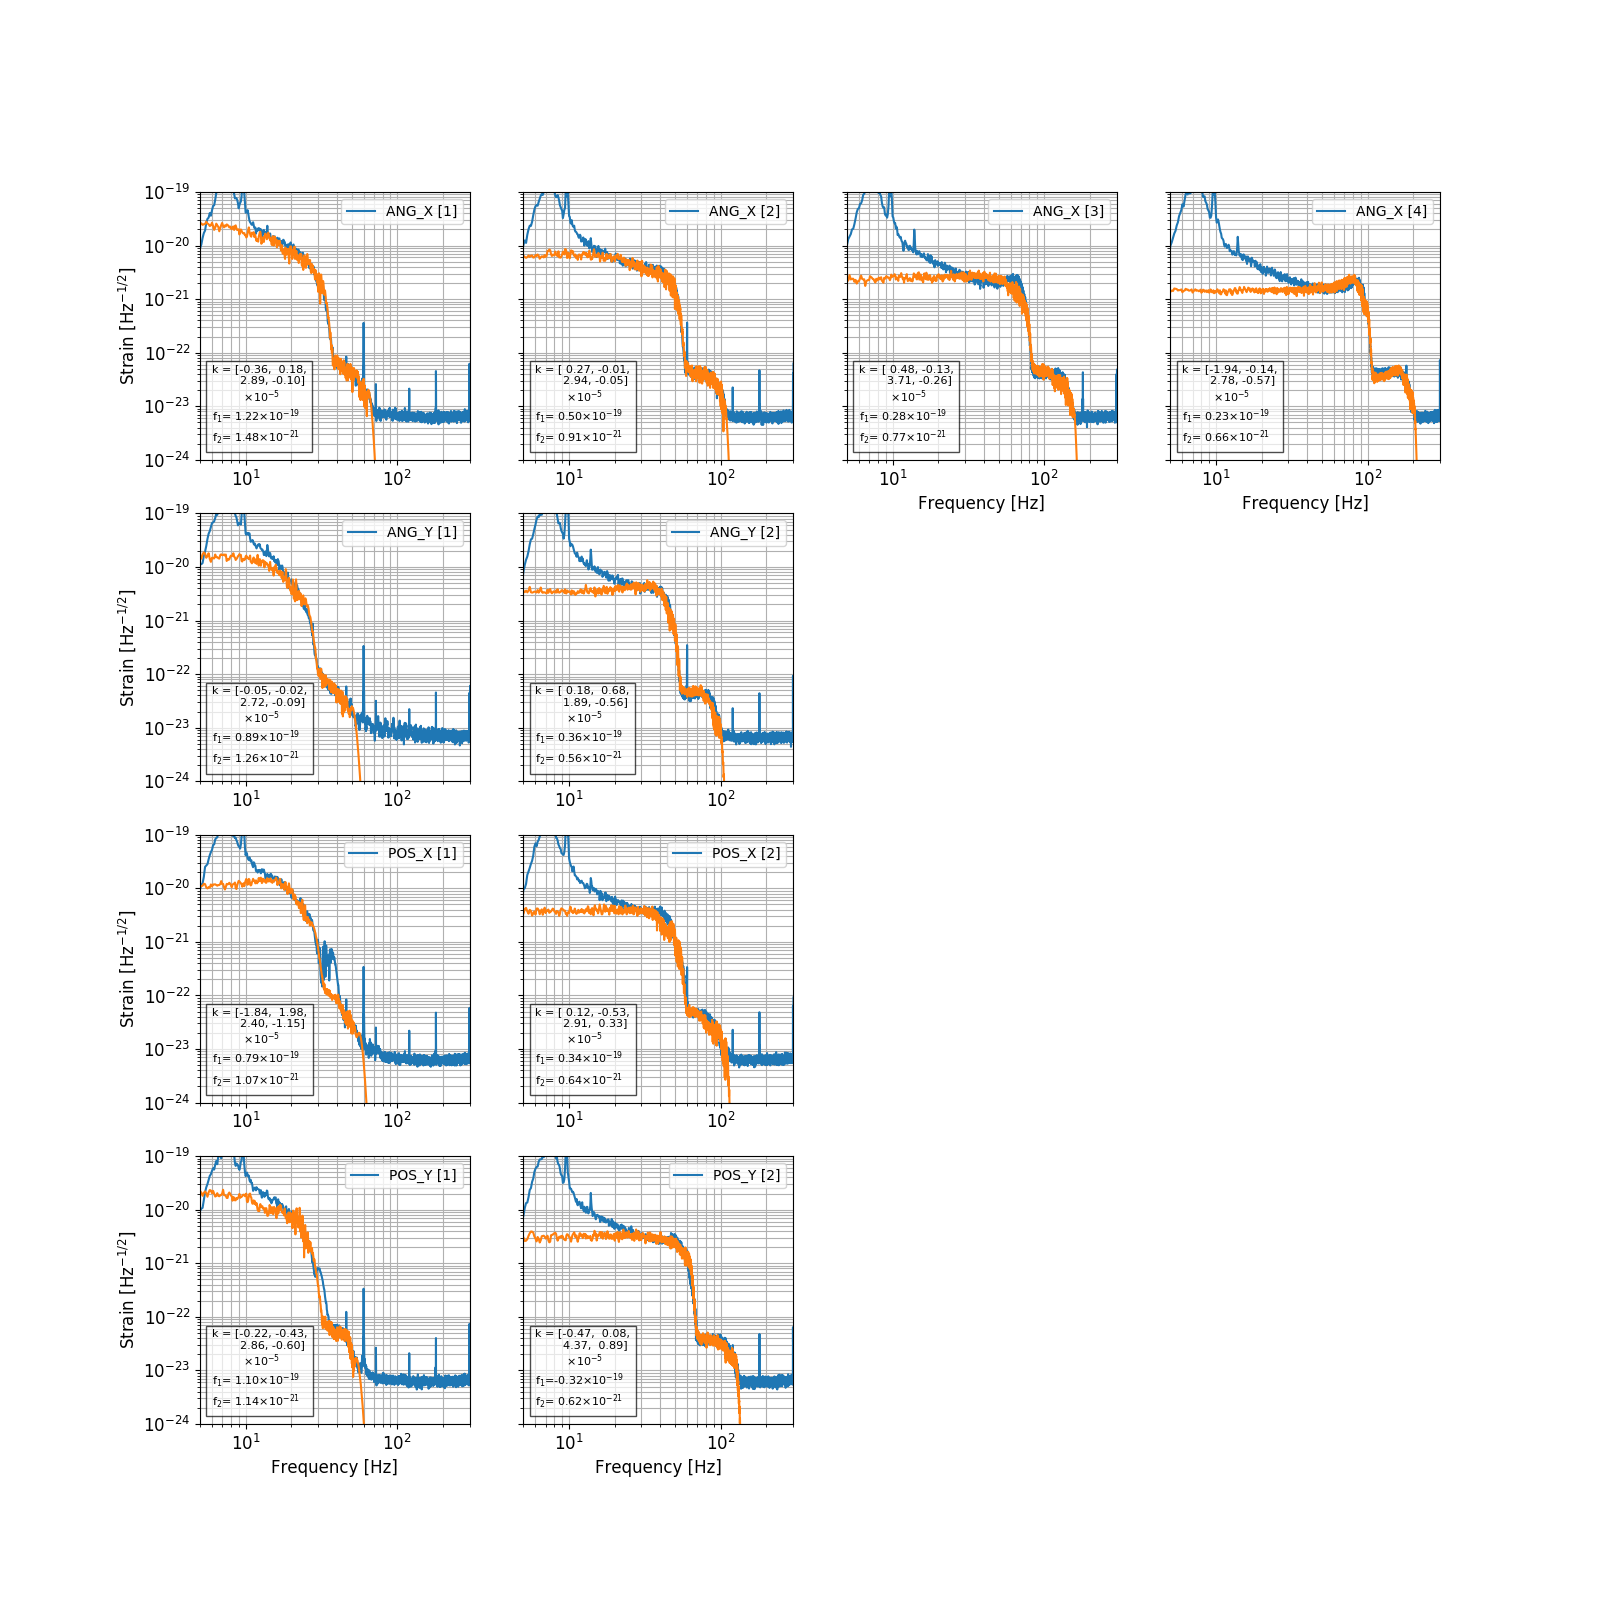
 

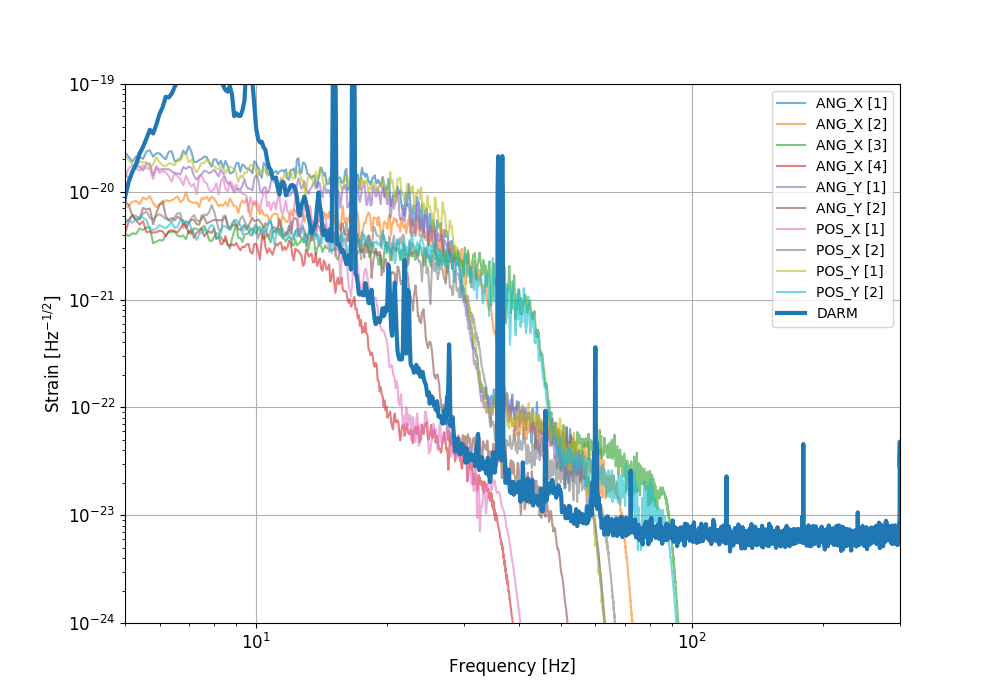
Applying each of these fit parameters to the quiet period gives us a busy plot, that shows how most of the fits overestimate the noise in the quiet case.
 

Fitting all injections all together

Assuming that the same scattering physics applies to all the injections (even if they're along different directions and separated by hours), we can force the fit to use the same parameters for all injections. The results are shown below. Now the very last plot shows the projection for the quiet time using the best parameters. The POS injections are fit well, while the ANG injections aren't that good. At least with these parameters (shown in the plot) the quiet time projection isn't overestimated anymore. 
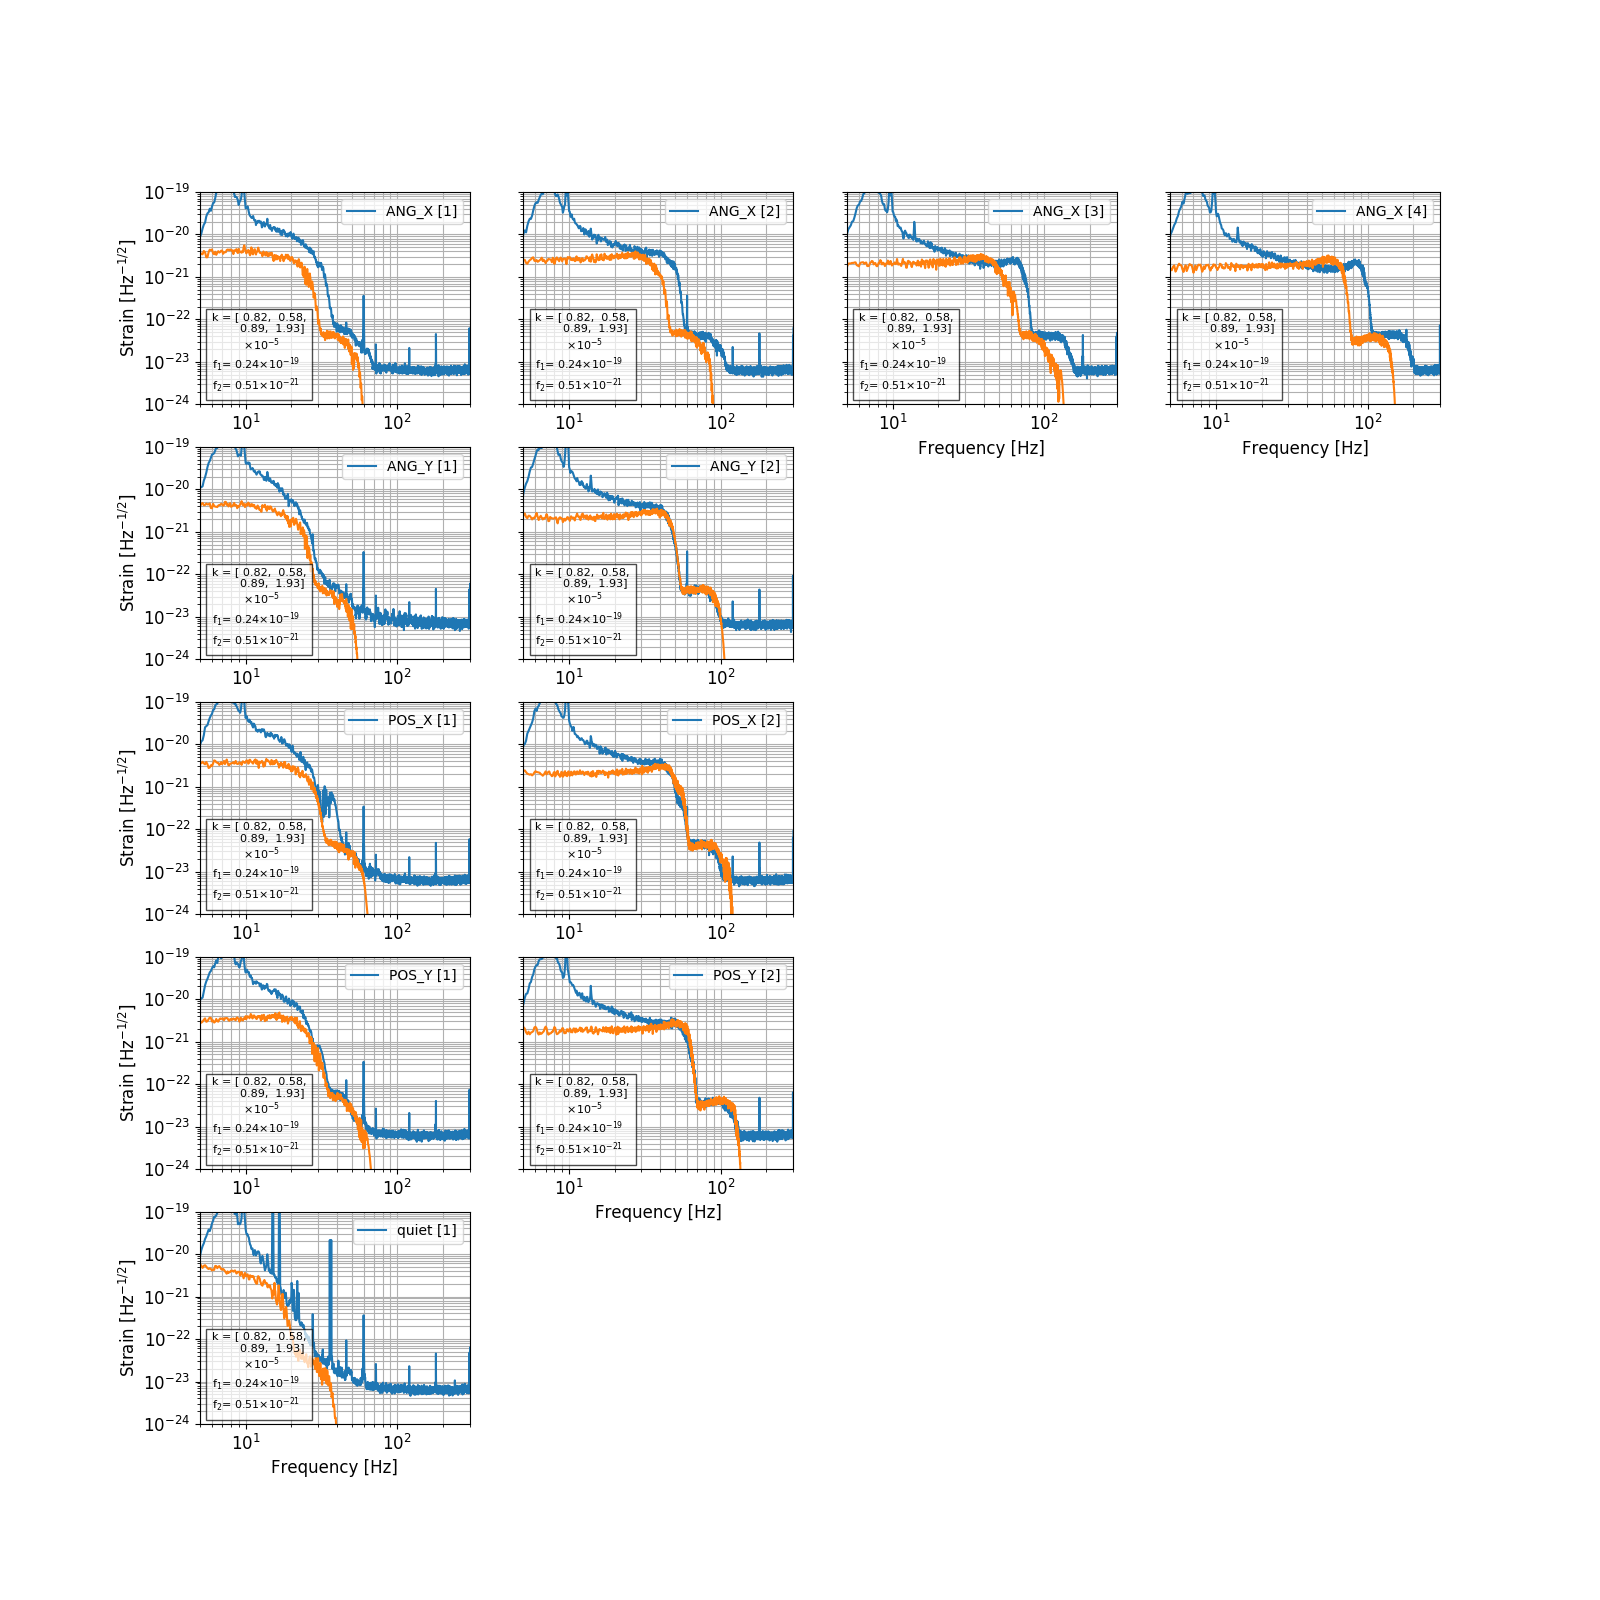
 

I also tried other approaches, like allowing the per-filtering of the OMC signals to be a parameter (both as a band-pass Butterworth or a generic second order stage), without any more success than the global fit above.

In any case, it seems safe to assume that in normal operation, scattered light from OMC ASC motion is close to the measured sensitivity.

Some thoughts on why the same model parameters don't work for all injections

  1. the up-conversion physics might be different from simple beam scattering: for example there can be a modulation that comes from clipping
  2. maybe the OMC ASC sensors are good only at some frequencies, or we need to account for frequency dependent pre-shaping, for example due to the ASC loops
  3. we haven't quite found the right witness sensor: maybe when we shake the OMC ASC we are inducing a motion of the real thing, but we don't have a good measurement of what that is

 

Images attached to this report
H1 CDS
patrick.thomas@LIGO.ORG - posted 13:52, Wednesday 13 March 2019 (47502)
Beckhoff communication errors at end X
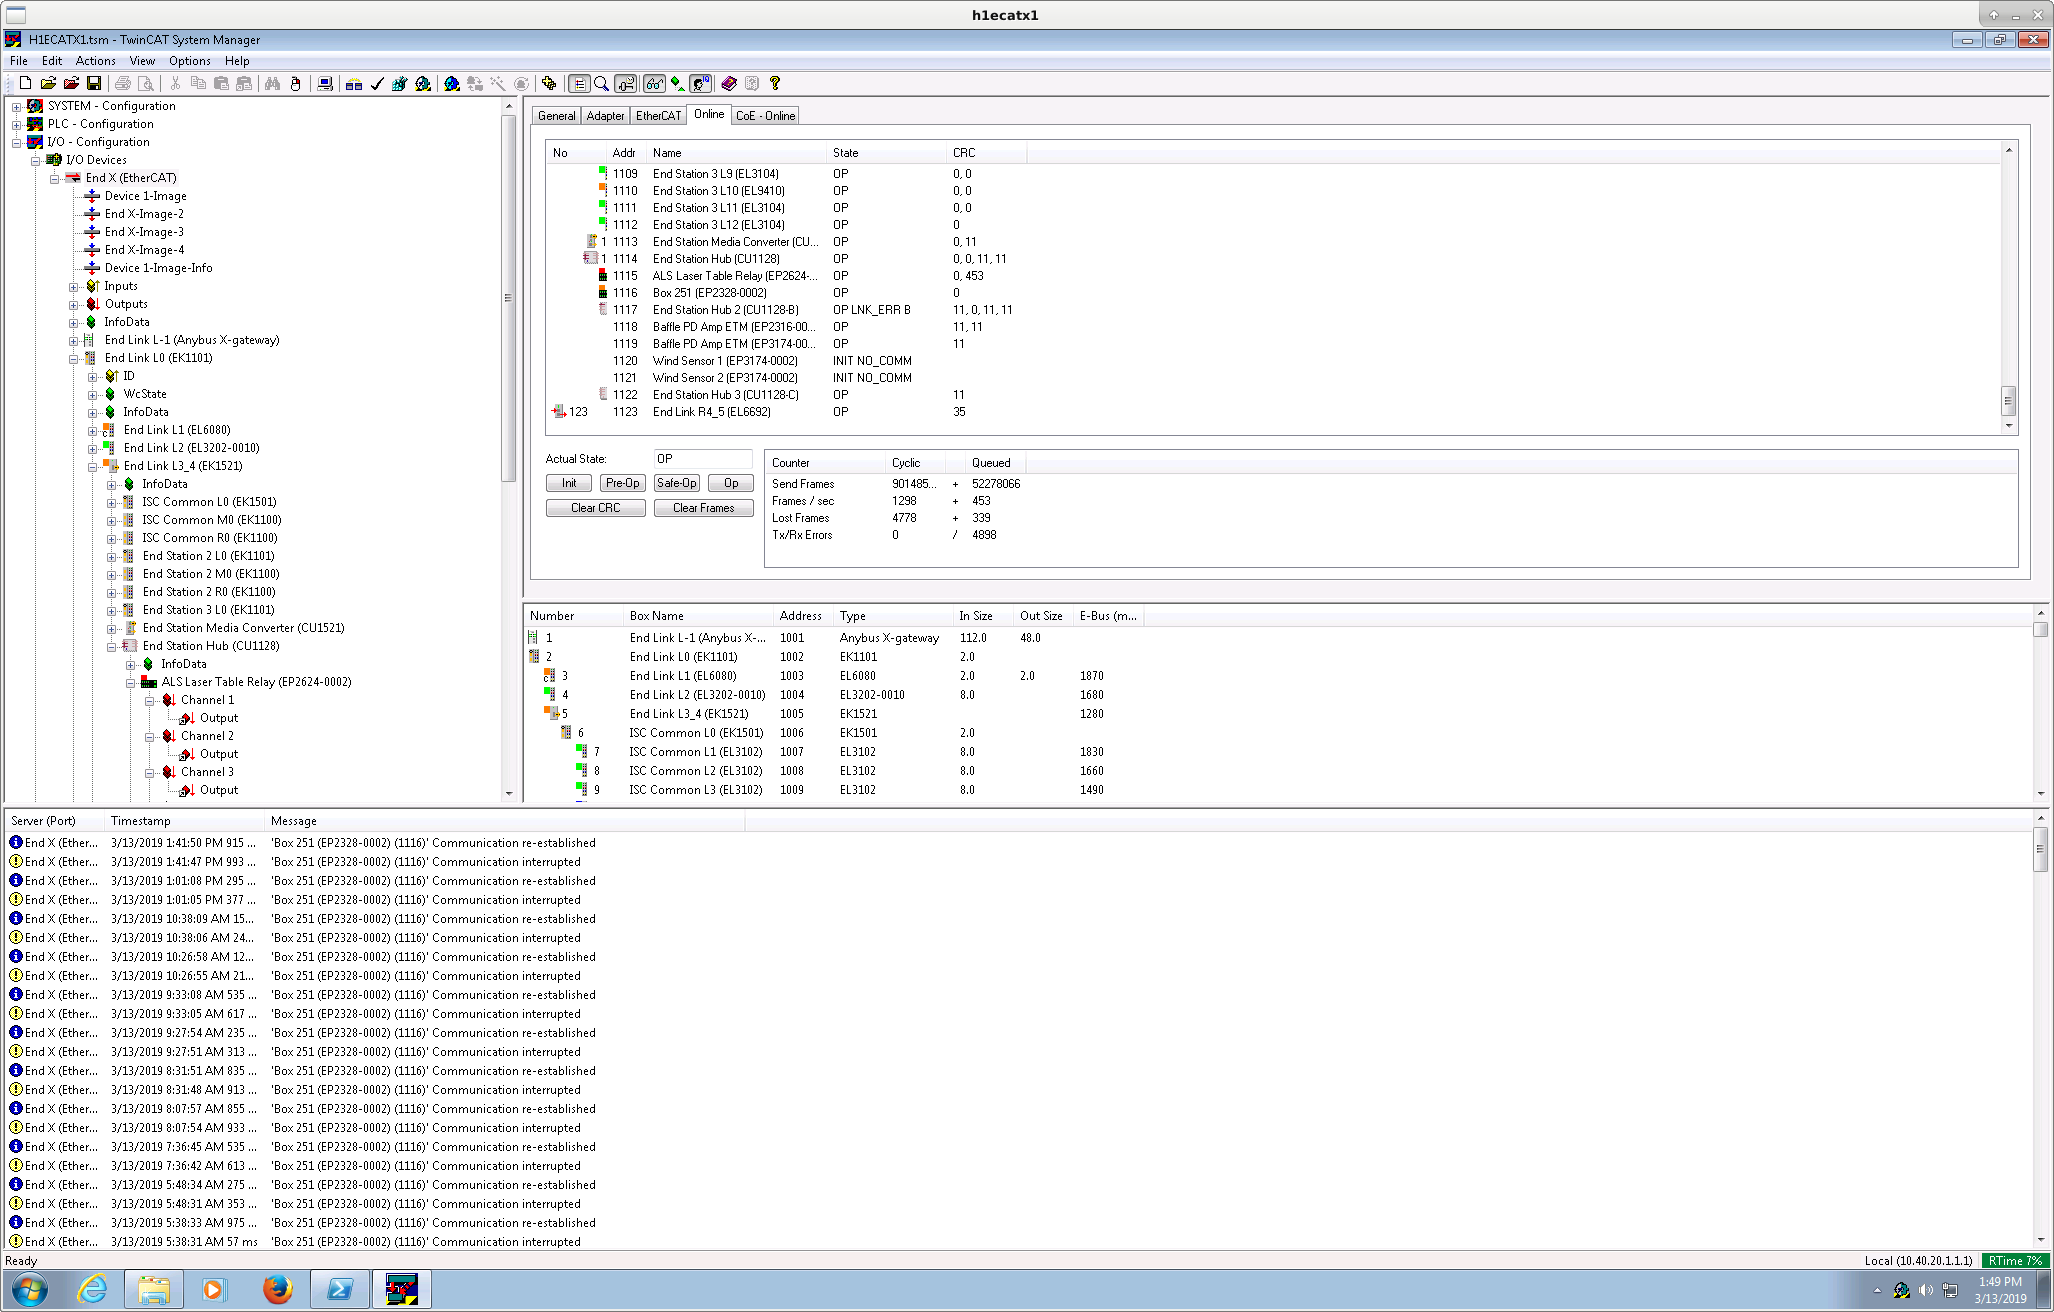
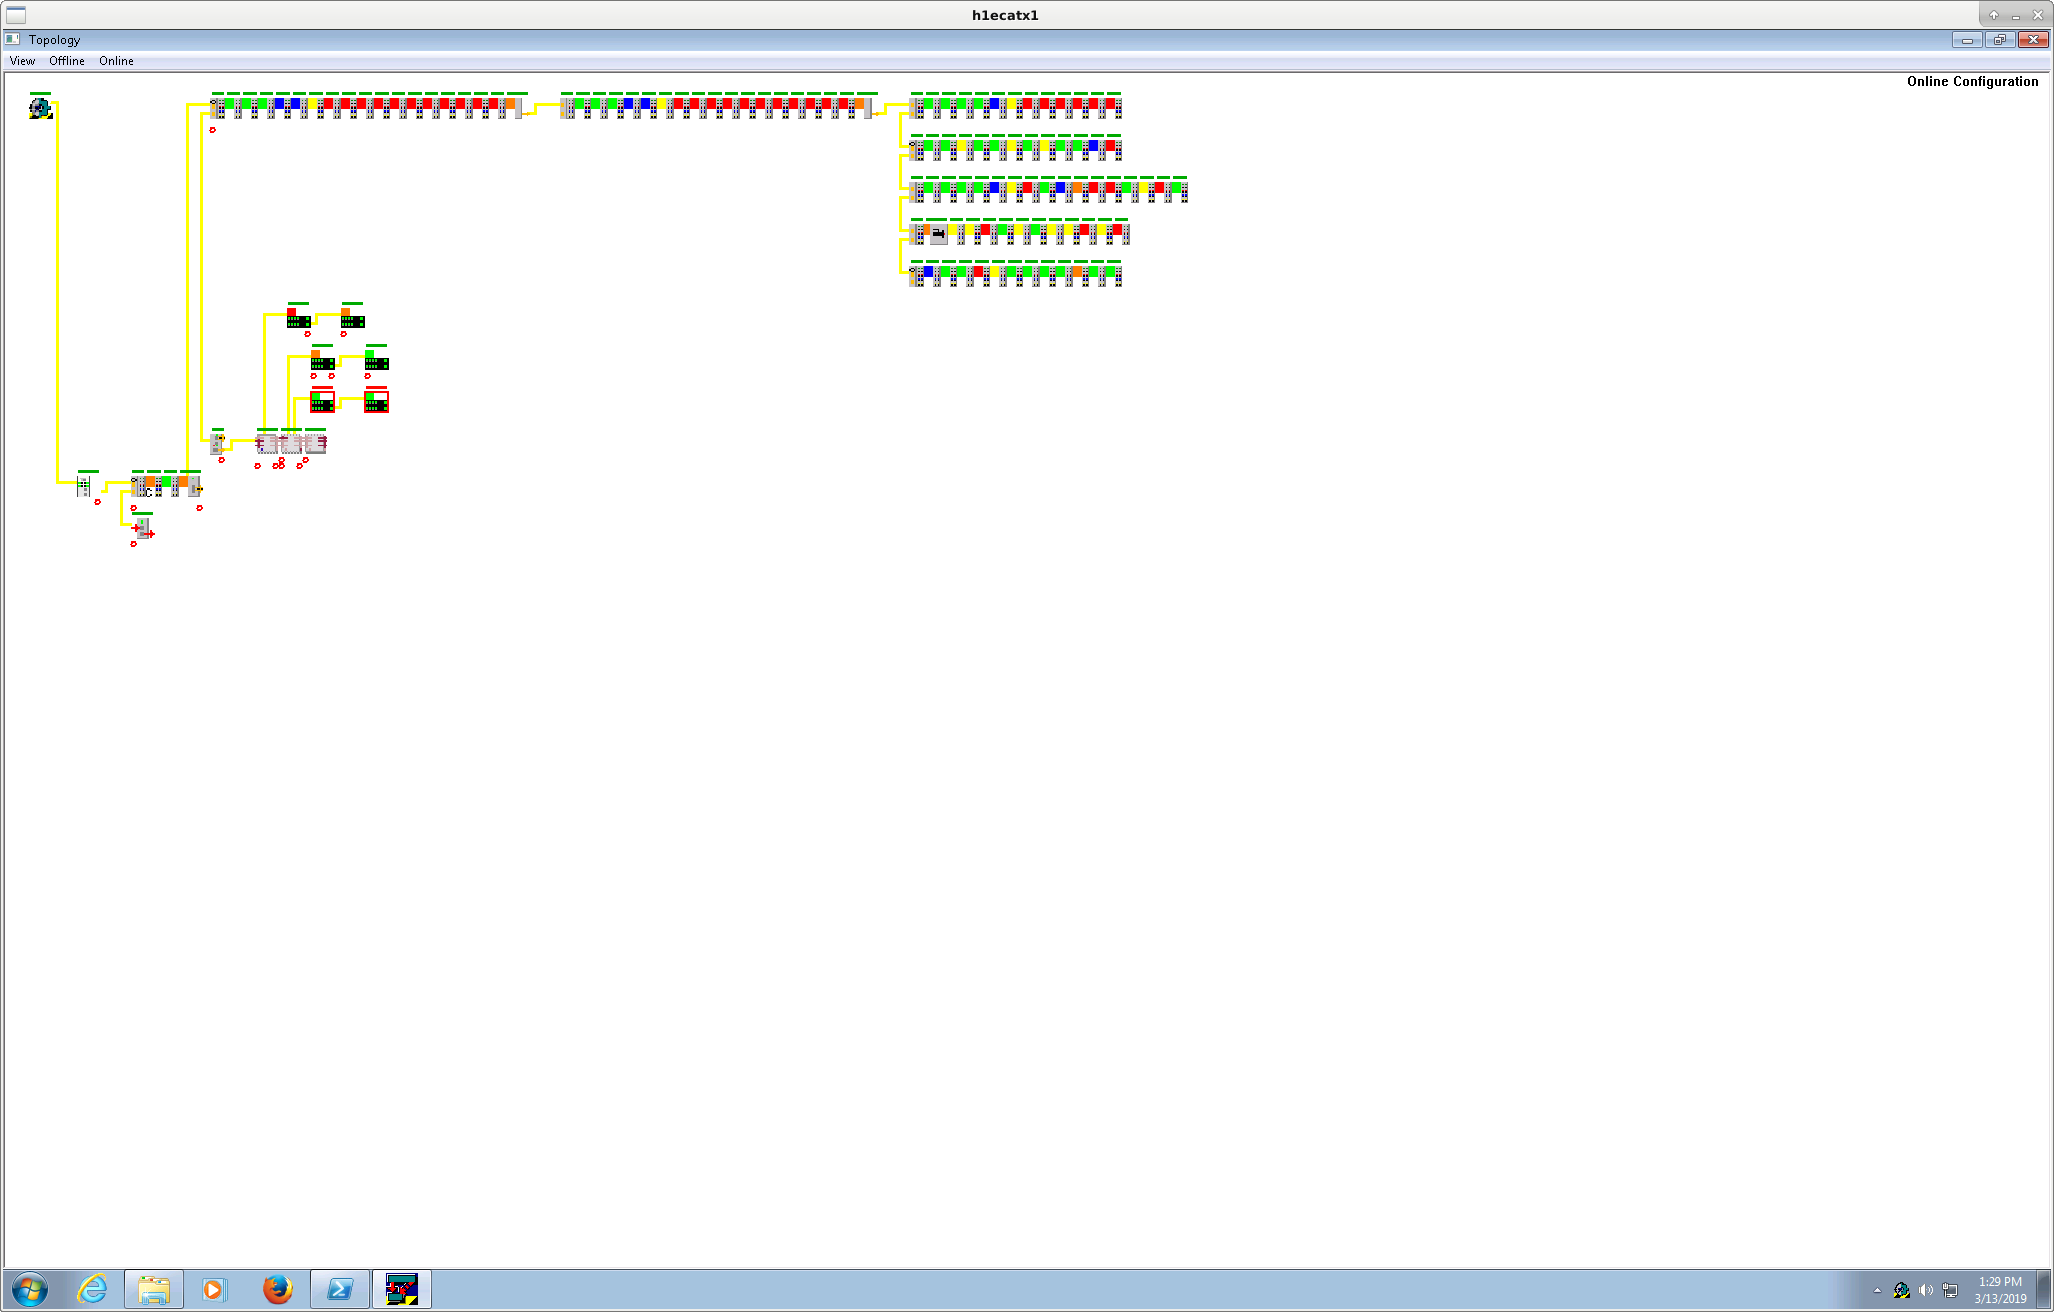
Screenshots attached. The wind sensor terminals are not in OP. I believe this also happened a week or so ago and was fixed by restarting the Beckhoff computer. I have not tried doing this yet. It seems that the issue may be more fundamental than I first thought.

There are also a lot of CRC errors that I believe have been there for some time. The red circles in the first screenshot indicate these.

End Y looks fine.
Images attached to this report
H1 General (OpsInfo, TCS)
edmond.merilh@LIGO.ORG - posted 13:00, Wednesday 13 March 2019 (47499)
Noted Effects of SR3 Heating

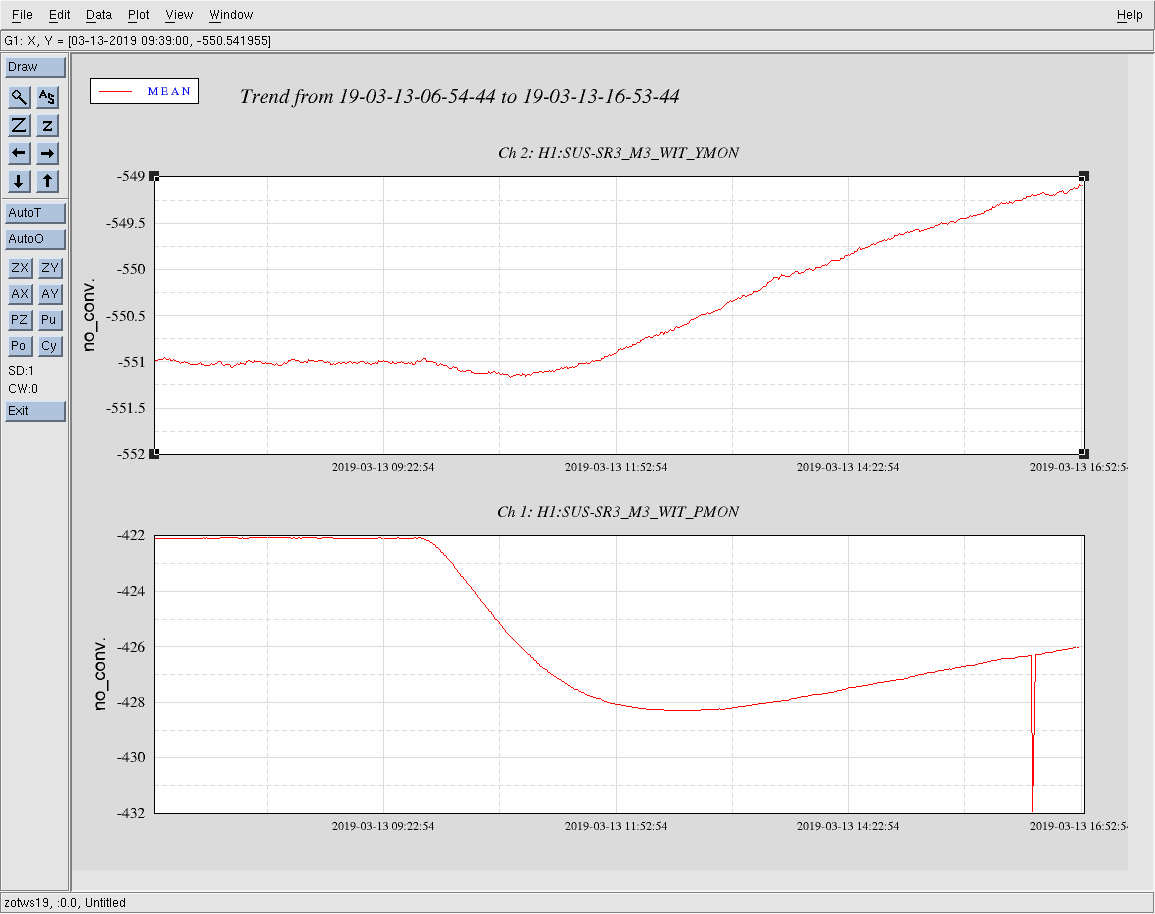
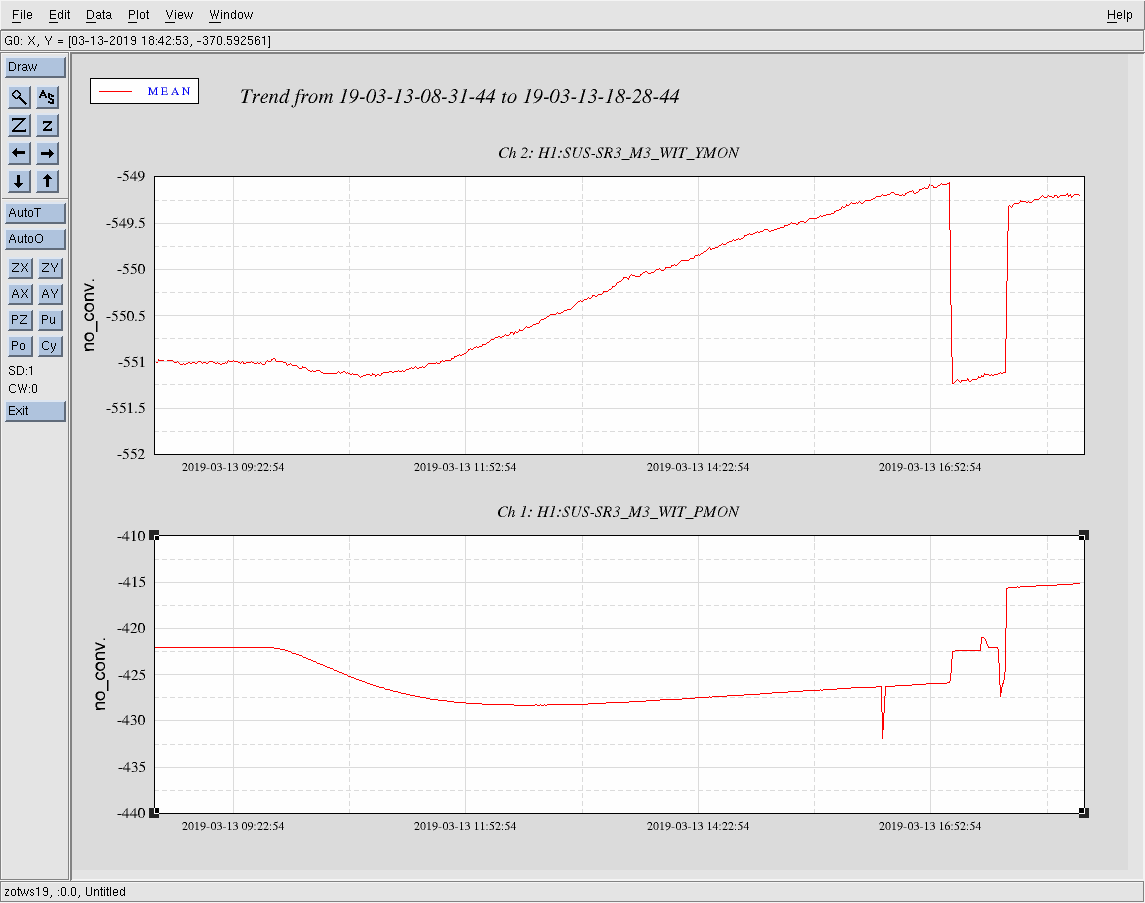
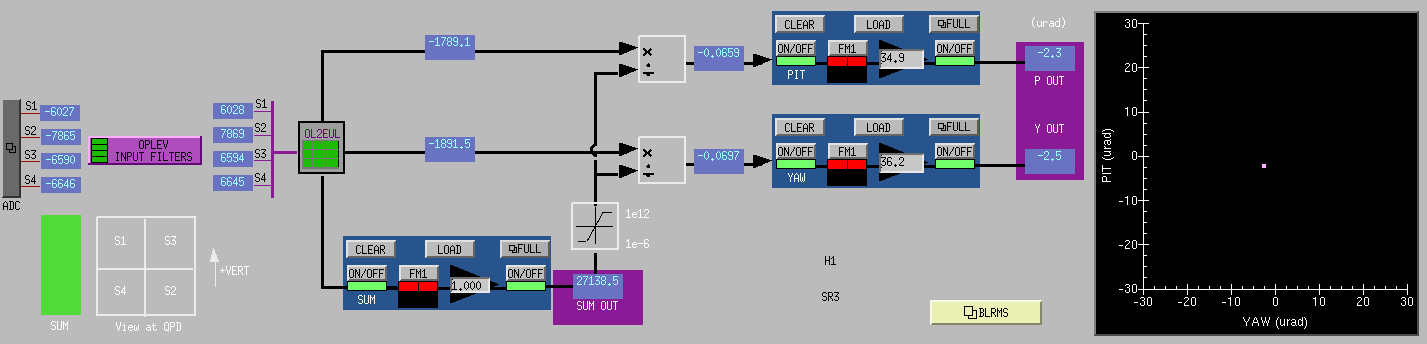
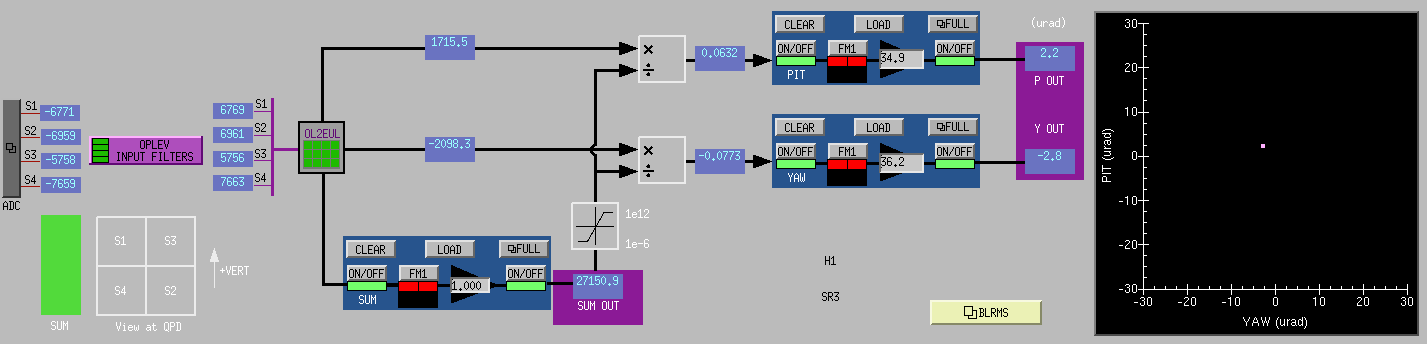
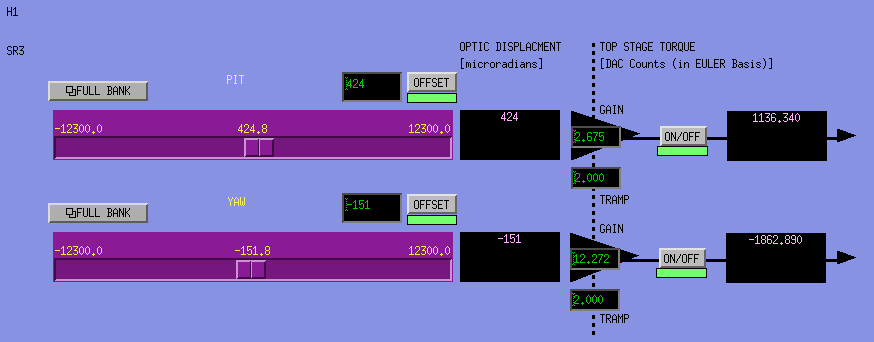
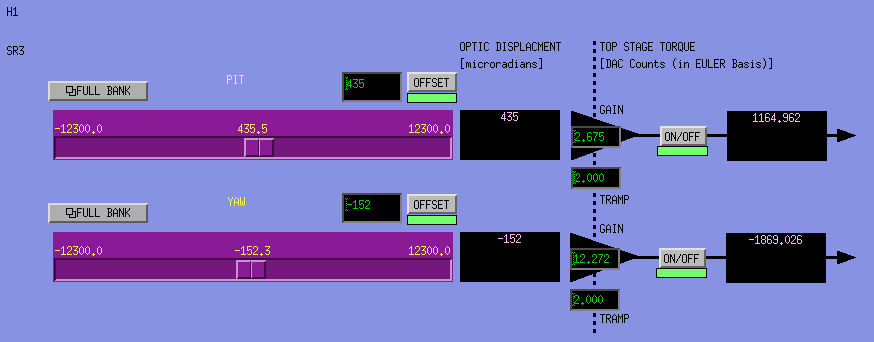
When attempting to relock this morning it was noticed that the SRC was pretty off in alignment. The AS air spot was noticeably high in the camera image. Heating of SR3 caused a rather large change in the pitch of SR3 which also seemingly effected some yaw as well. Below are before and after trends of the M3 witness sensors, OpLev, and alignment sliders.

Images attached to this report
H1 ISC (ISC)
gabriele.vajente@LIGO.ORG - posted 12:22, Wednesday 13 March 2019 - last comment - 08:57, Thursday 14 March 2019(47500)
Coherence with PRCL / REFL_A_RF45

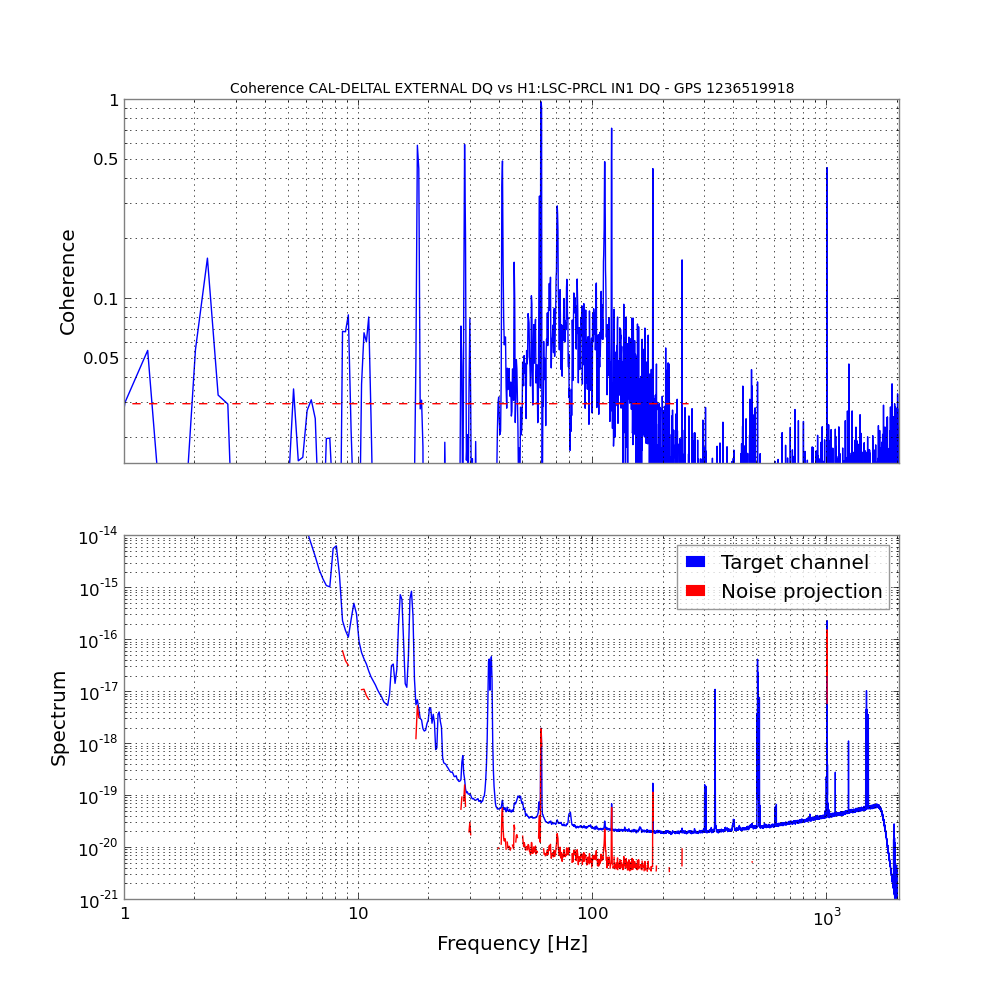
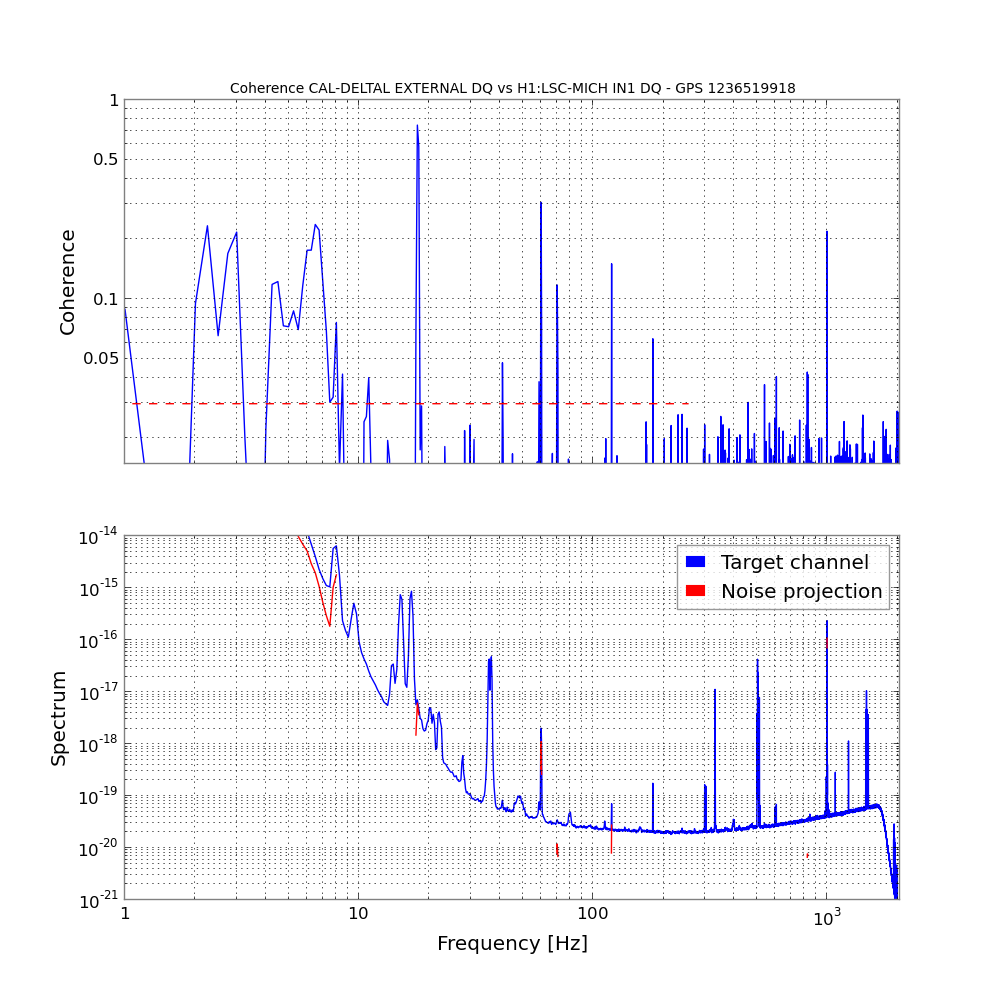
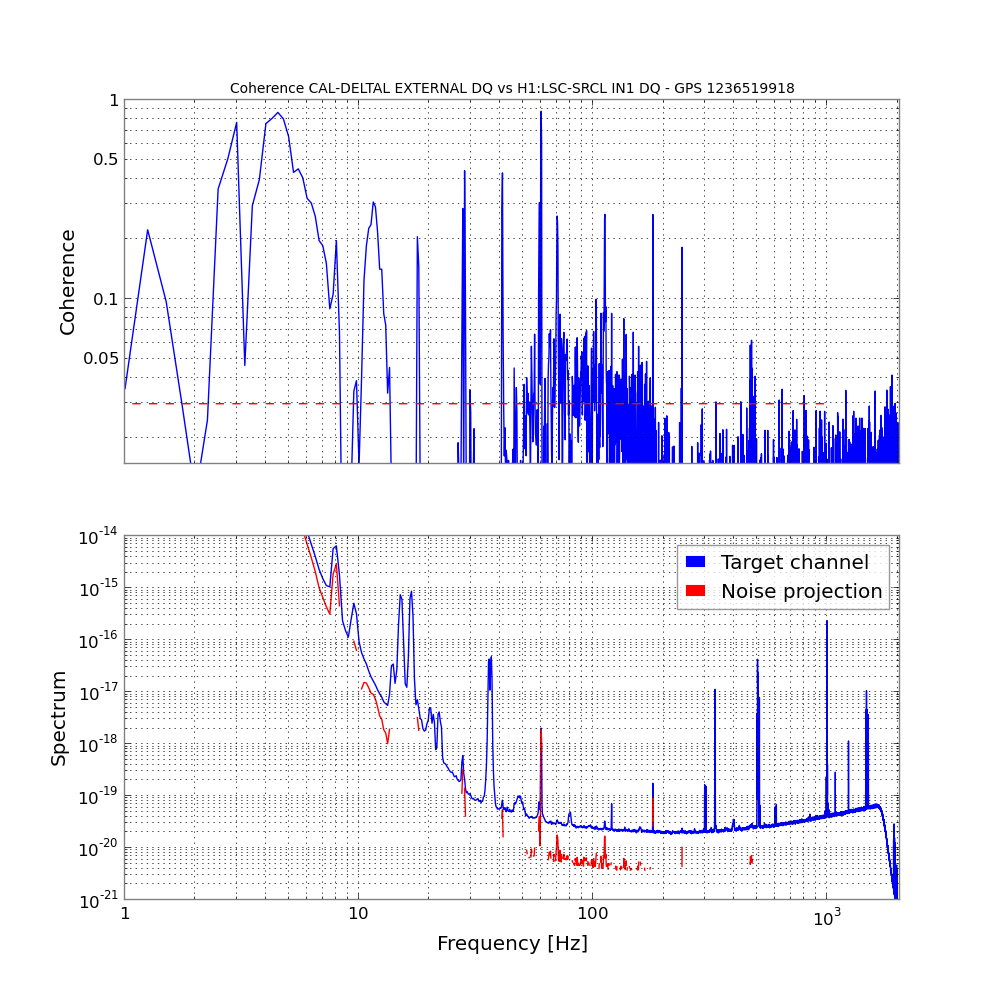
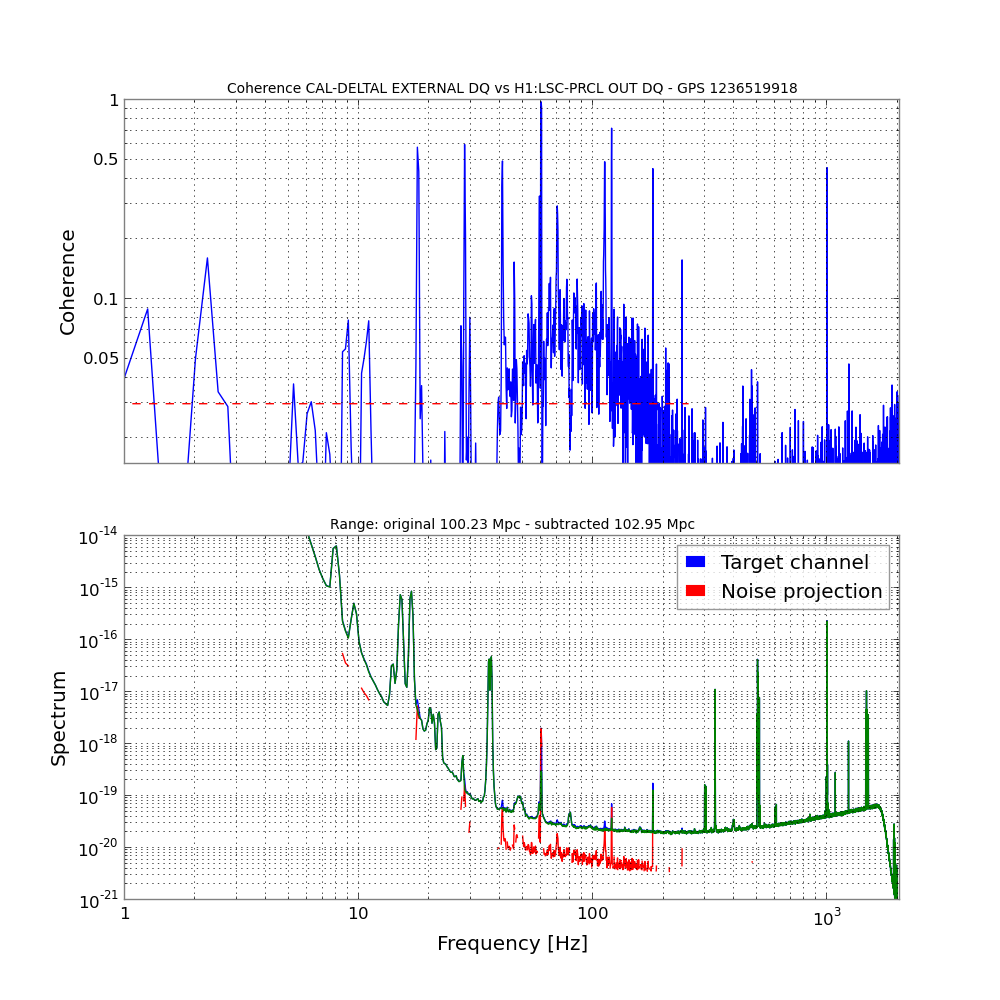
During last long lock, there's high coherence right in the bucket with PRCL and REFL_A_RF45 both I and Q. Not much coherence with MICH, some with SRCL.

https://ldas-jobs.ligo.caltech.edu/~gabriele.vajente/bruco_lho_1236519918/ 

This coherence might not see high, but at 50 Hz it projects into DARM at 1e-20 m/rHz, whereas DARM is 4e-20 m/rHz. That's about a 5% contribution in amplitude to DARM.

Images attached to this report
Comments related to this report
gabriele.vajente@LIGO.ORG - 17:06, Wednesday 13 March 2019 (47506)

Just added a new feature to BruCo:

if the --range=xxx option is added, then BruCo multiplies the PSD of the target signal by the coefficient xxx (0.00025=1/4000 to convert CAL-DELTAL_EXTERNAL to strain) an compute the BNS range, for the target signal and the estimated coherence subtraction. So one can get a ballpark idea of how much that noise contributes to the range.

For example, removing the coherence with PRCL would bring the range from 100.23 to 102.95 Mpc (the absolute calibration might be a bit off since I'm using a old calibration curve for CAL-DELTAL_EXTERNAL)


Images attached to this comment
jenne.driggers@LIGO.ORG - 08:57, Thursday 14 March 2019 (47528)

This is really fantastic!

H1 PSL (PSL)
corey.gray@LIGO.ORG - posted 08:40, Wednesday 13 March 2019 (47496)
PSL Chiller Water Level Top-Off (FAMIS #10500)

Topped off Crystal Chiller with 100mL.  Diode Chiller OK.  Filters look fine (mentioned slight yellow tint of Crystal filter to Jeff B & he said it is OK).

H1 General
jeffrey.bartlett@LIGO.ORG - posted 07:56, Wednesday 13 March 2019 (47494)
Ops Days Shift Transition
Ops Shift Transition: 03/13/2019, Day Shift 15:00 – 23:00 (08:00 -16:00) - UTC (PT)
State of H1: Locked at NLN
Intent Bit: Commissioning
Weather: Forecast for clear and sunny today with temperatures ranging from the low 30s to the mid 40s by afternoon. Winds are calm to a light breeze.
Primary 0.03 – 0.1Hz: 0.08um/s
Secondary 0.1 – 0.3Hz: 0.5mu/s
Outgoing Operator: N/A
Quick Summary: The IFO is locked at NLN at 29.9w with a range of 103.6Mp
H1 ISC (ISC)
craig.cahillane@LIGO.ORG - posted 03:22, Wednesday 13 March 2019 (47493)
DARM good to 6% in the bucket
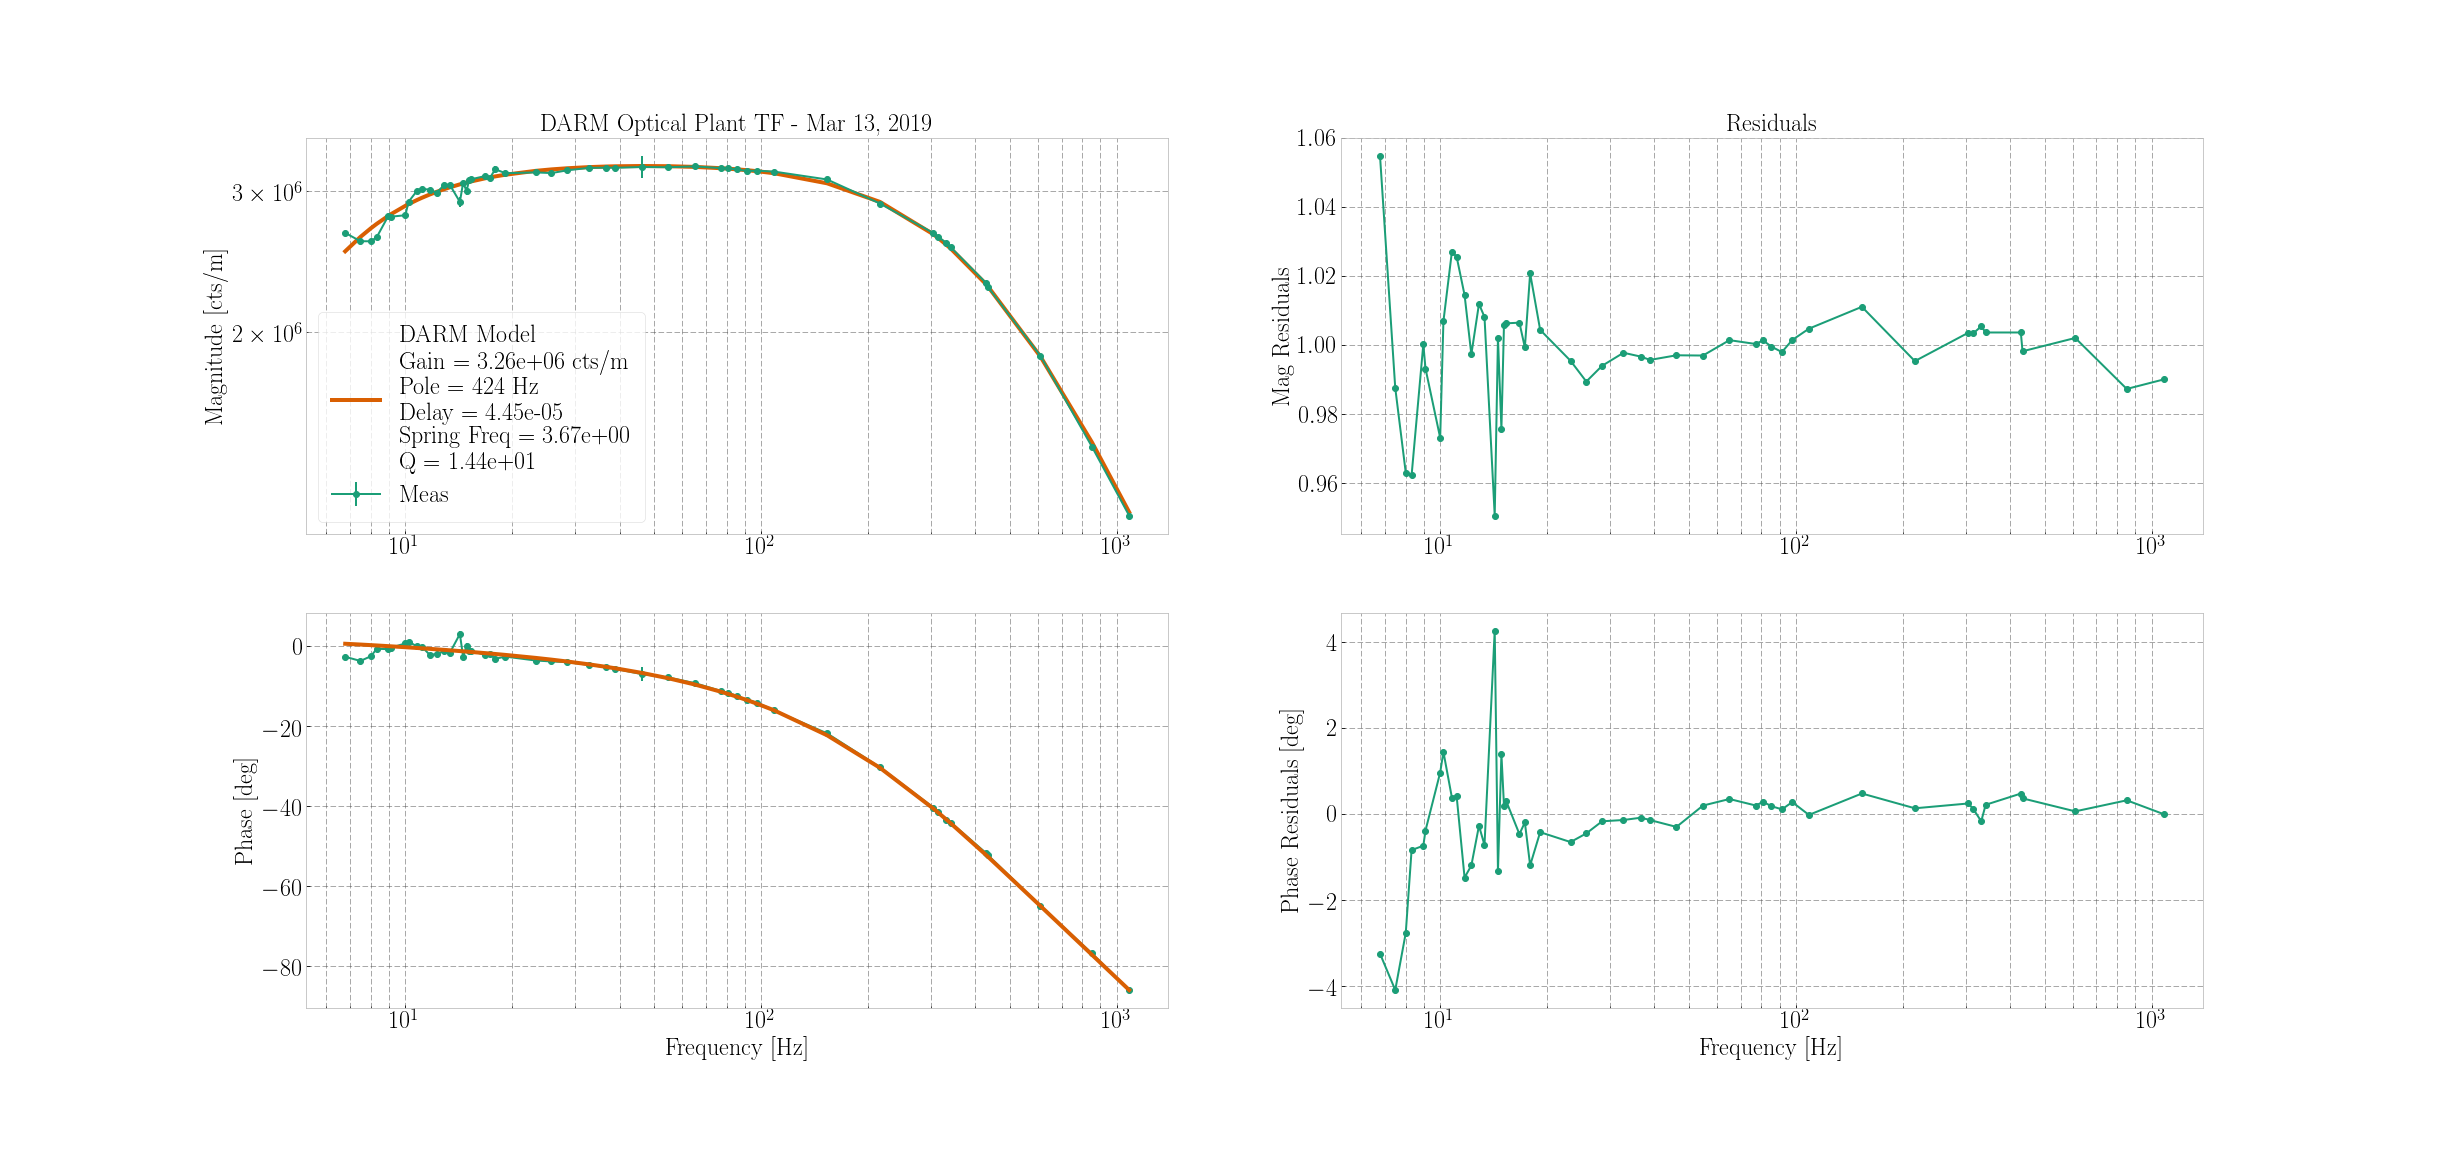
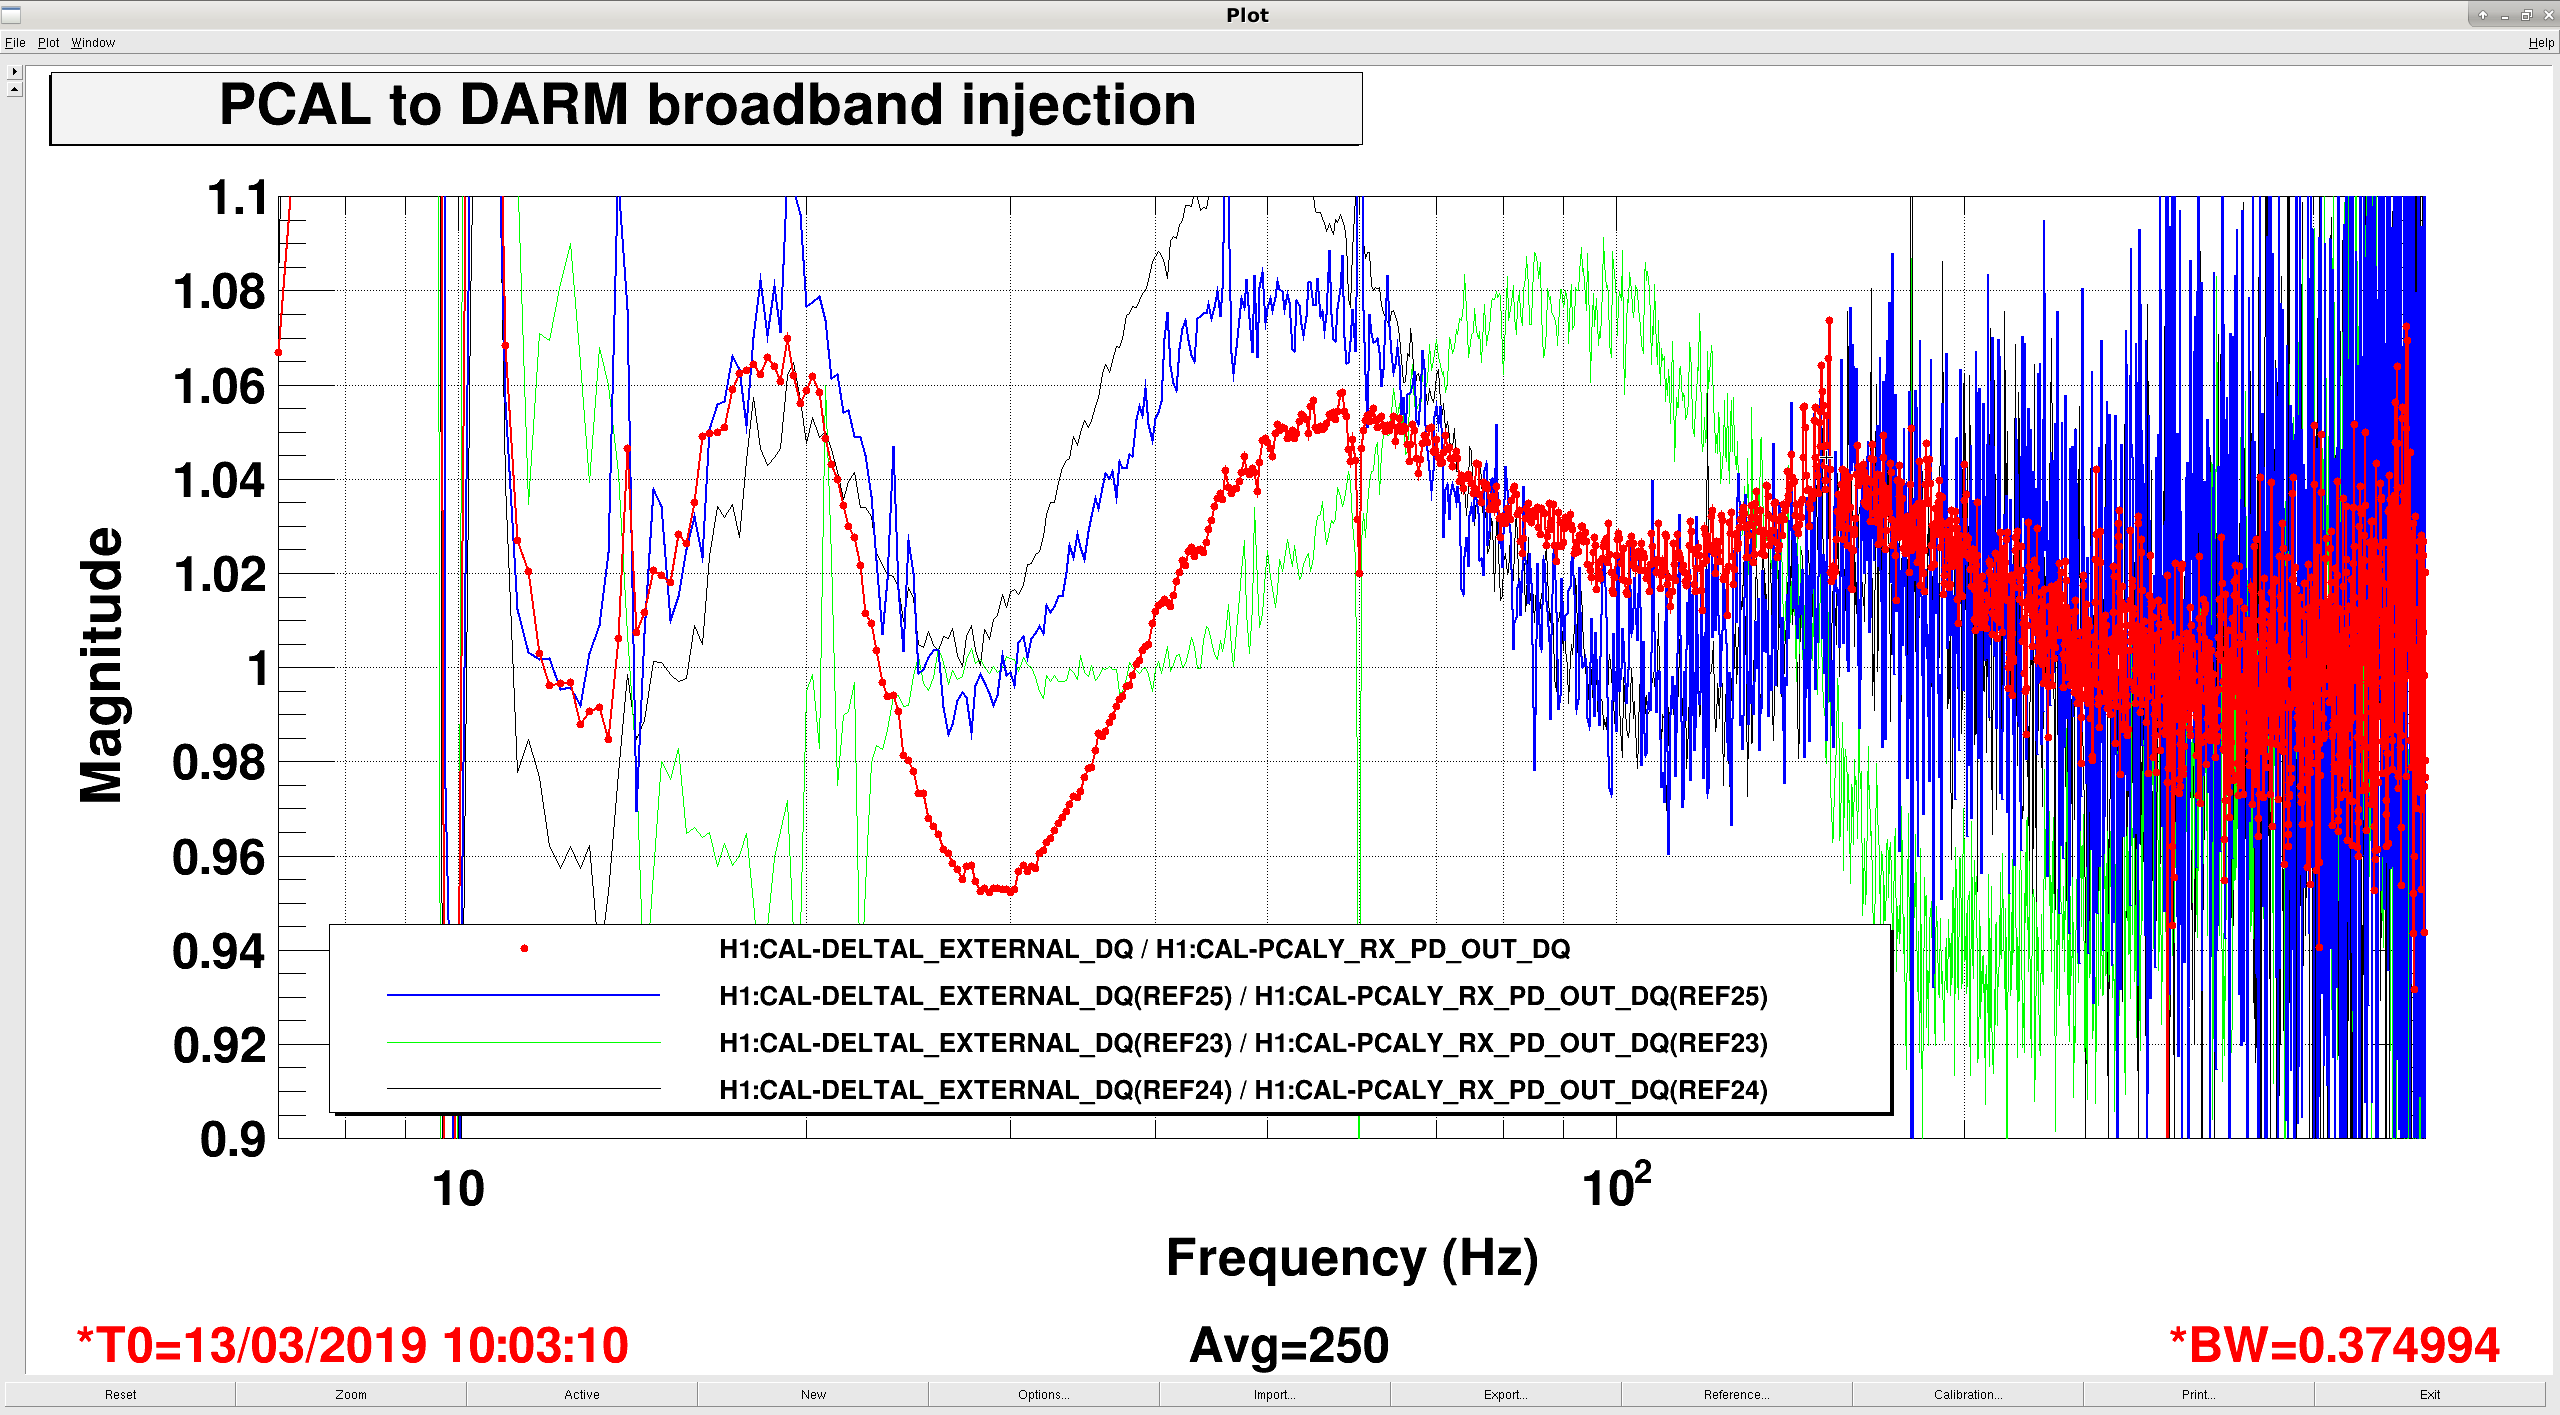
There was some problem with the high frequency photon calibration lines not lining up with DARM, so I remeasured PCAL to DARM and the DARM OLG and measured and fit the DARM plant.
The DARM plant fit was:
Optical Gain = 3.26e+06 cts/m
DARM pole    = 423.61 Hz
Delay        = 4.45e-05 s
Spring Freq  = 3.67 Hz
Spring Q     = 14.45


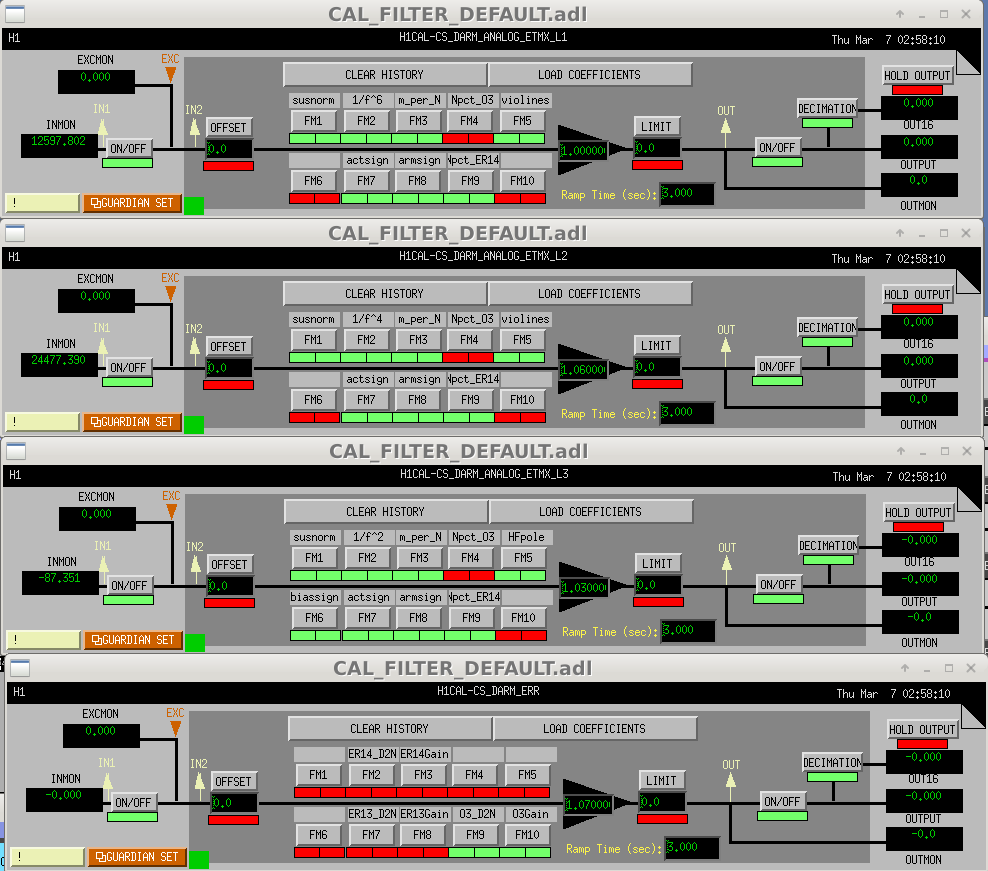
I updated the front end calibration filters according to this fit.  The high frequency lines seem better now.  

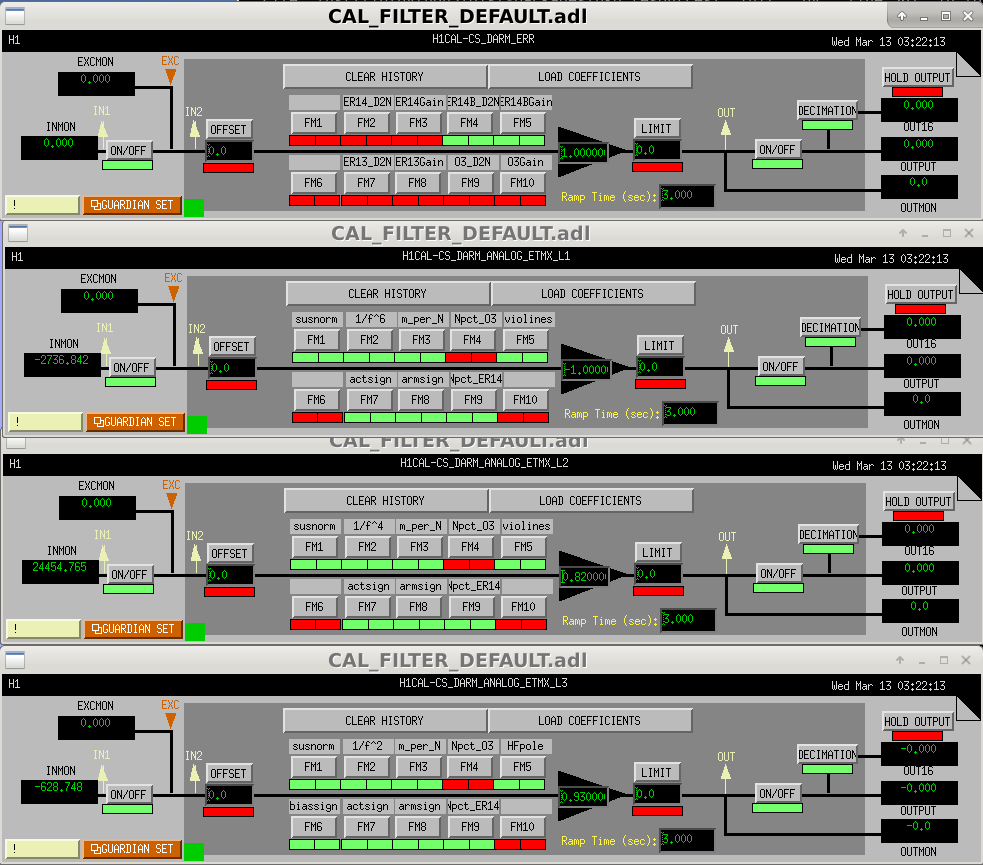
Then Georgia and I tested the calibration with a BB pcal injection.  There was a large phase discrepancy at low frequency, so we flipped the L1 actuation gain in the front end calibration, this seemed to help us.

We then tuned the actuation stages to get a decent front-end calibration.  We are good in the bucket to 6% with wiggles due to slightly improperly compensated actuation phase.  The reported range fell from 100 Mpc to 95 Mpc due to the changes.
Images attached to this report
H1 ISC (ISC)
georgia.mansell@LIGO.ORG - posted 02:29, Wednesday 13 March 2019 (47492)
Ran ITMX A2L, shook OFI at 1 Hz

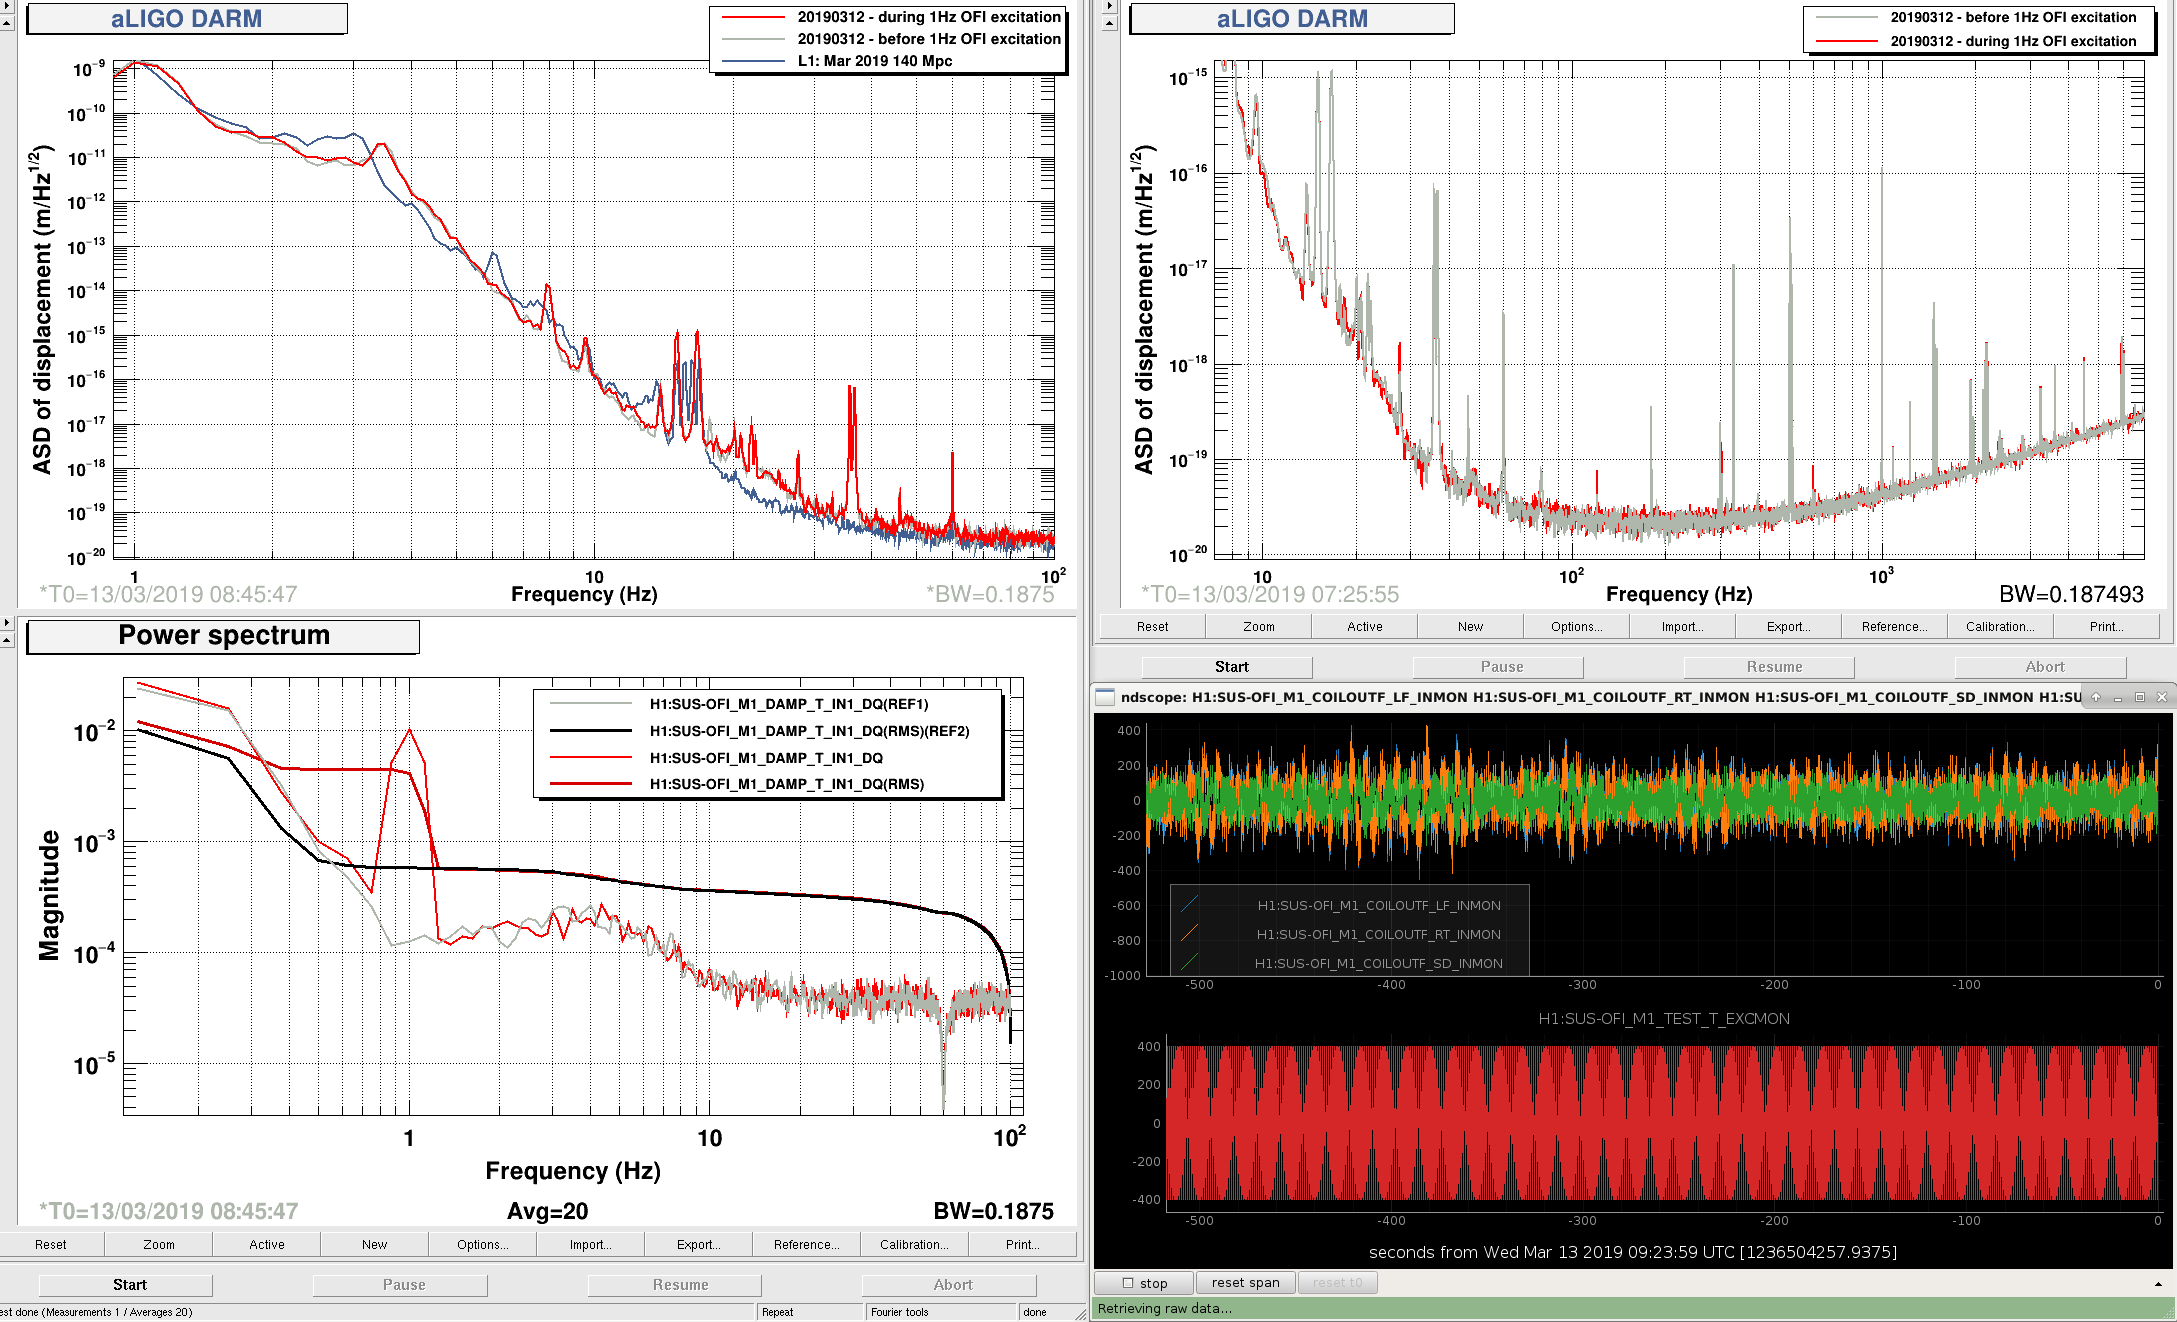
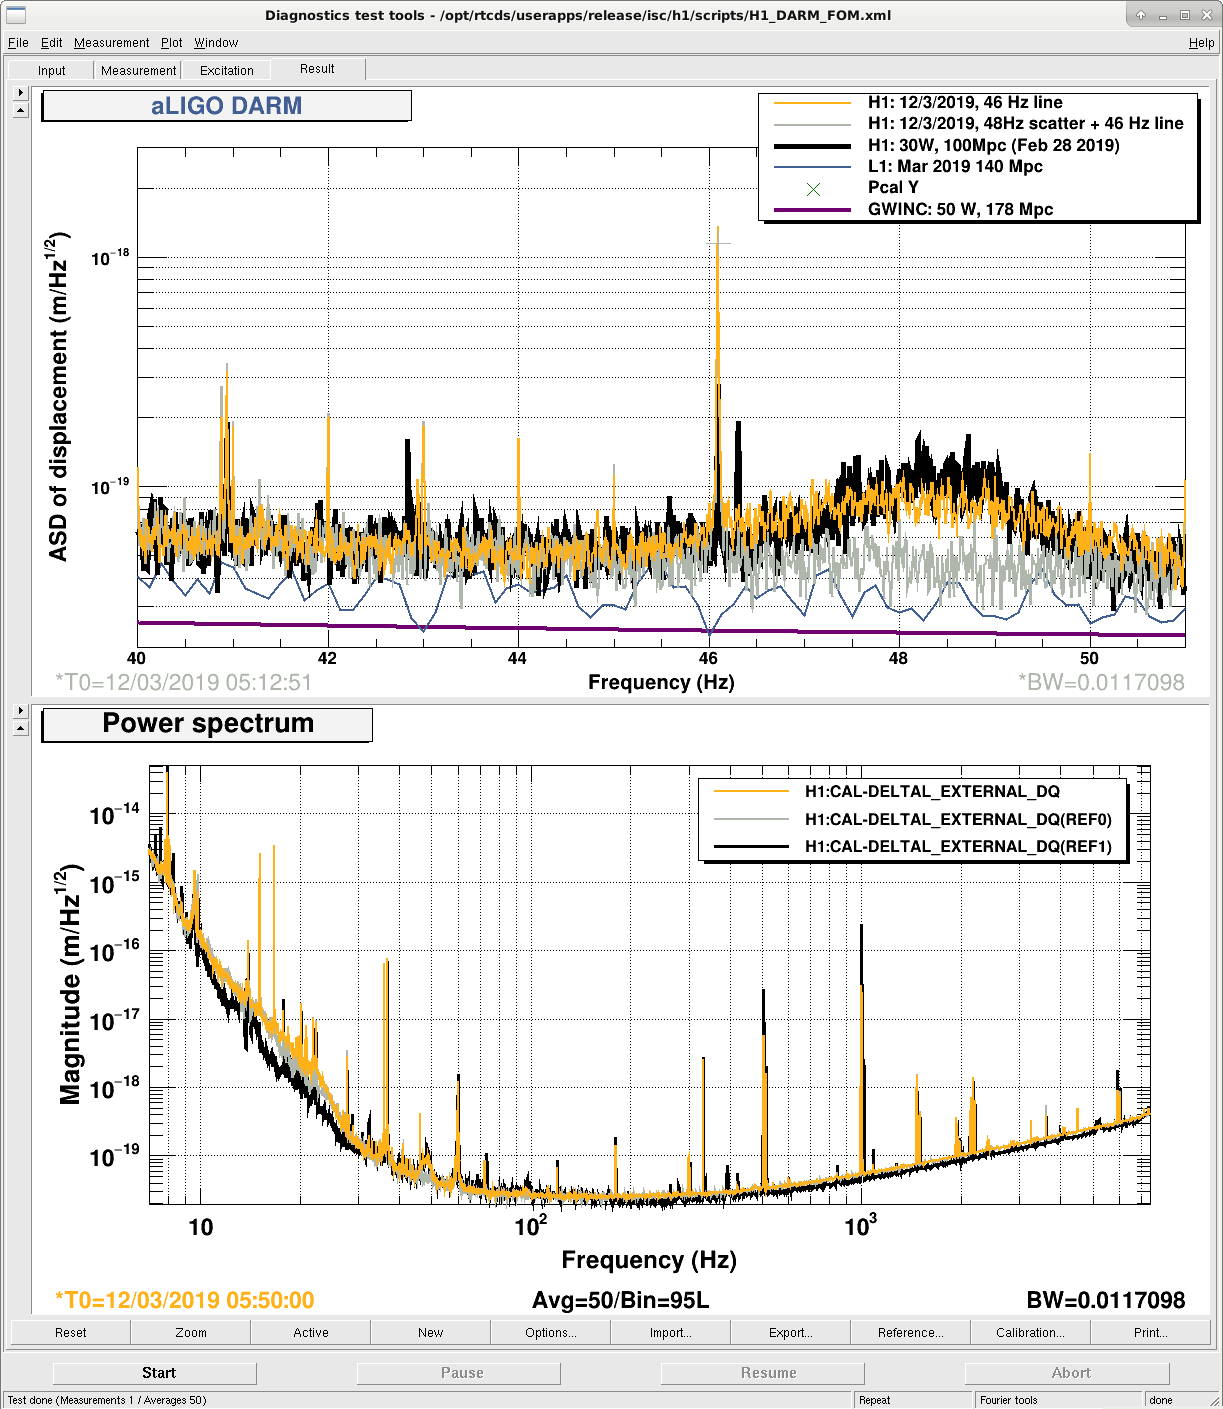
We noticed that the 10-30 Hz noise is worse recently compared to our Feb 28 reference. I ran Gabriele's A2L script on ITMX (the only test mass without a dither line). It barely changed the A2L gains (Y2L went from 0.366 to 0.259, P2L from -3.926 to -3.9819), and there wasn't any change.

I also drove the OFI (transverse) at 1Hz to see if it affected our 48 Hz scatter or any other lines, it did not. Attachment shows DARM spectra and OFI error signals with and without the excitation, excitation times are shown in red, quiet times in grey.

Images attached to this report
H1 ISC
daniel.brown@LIGO.ORG - posted 01:00, Wednesday 13 March 2019 - last comment - 10:08, Wednesday 13 March 2019(47491)
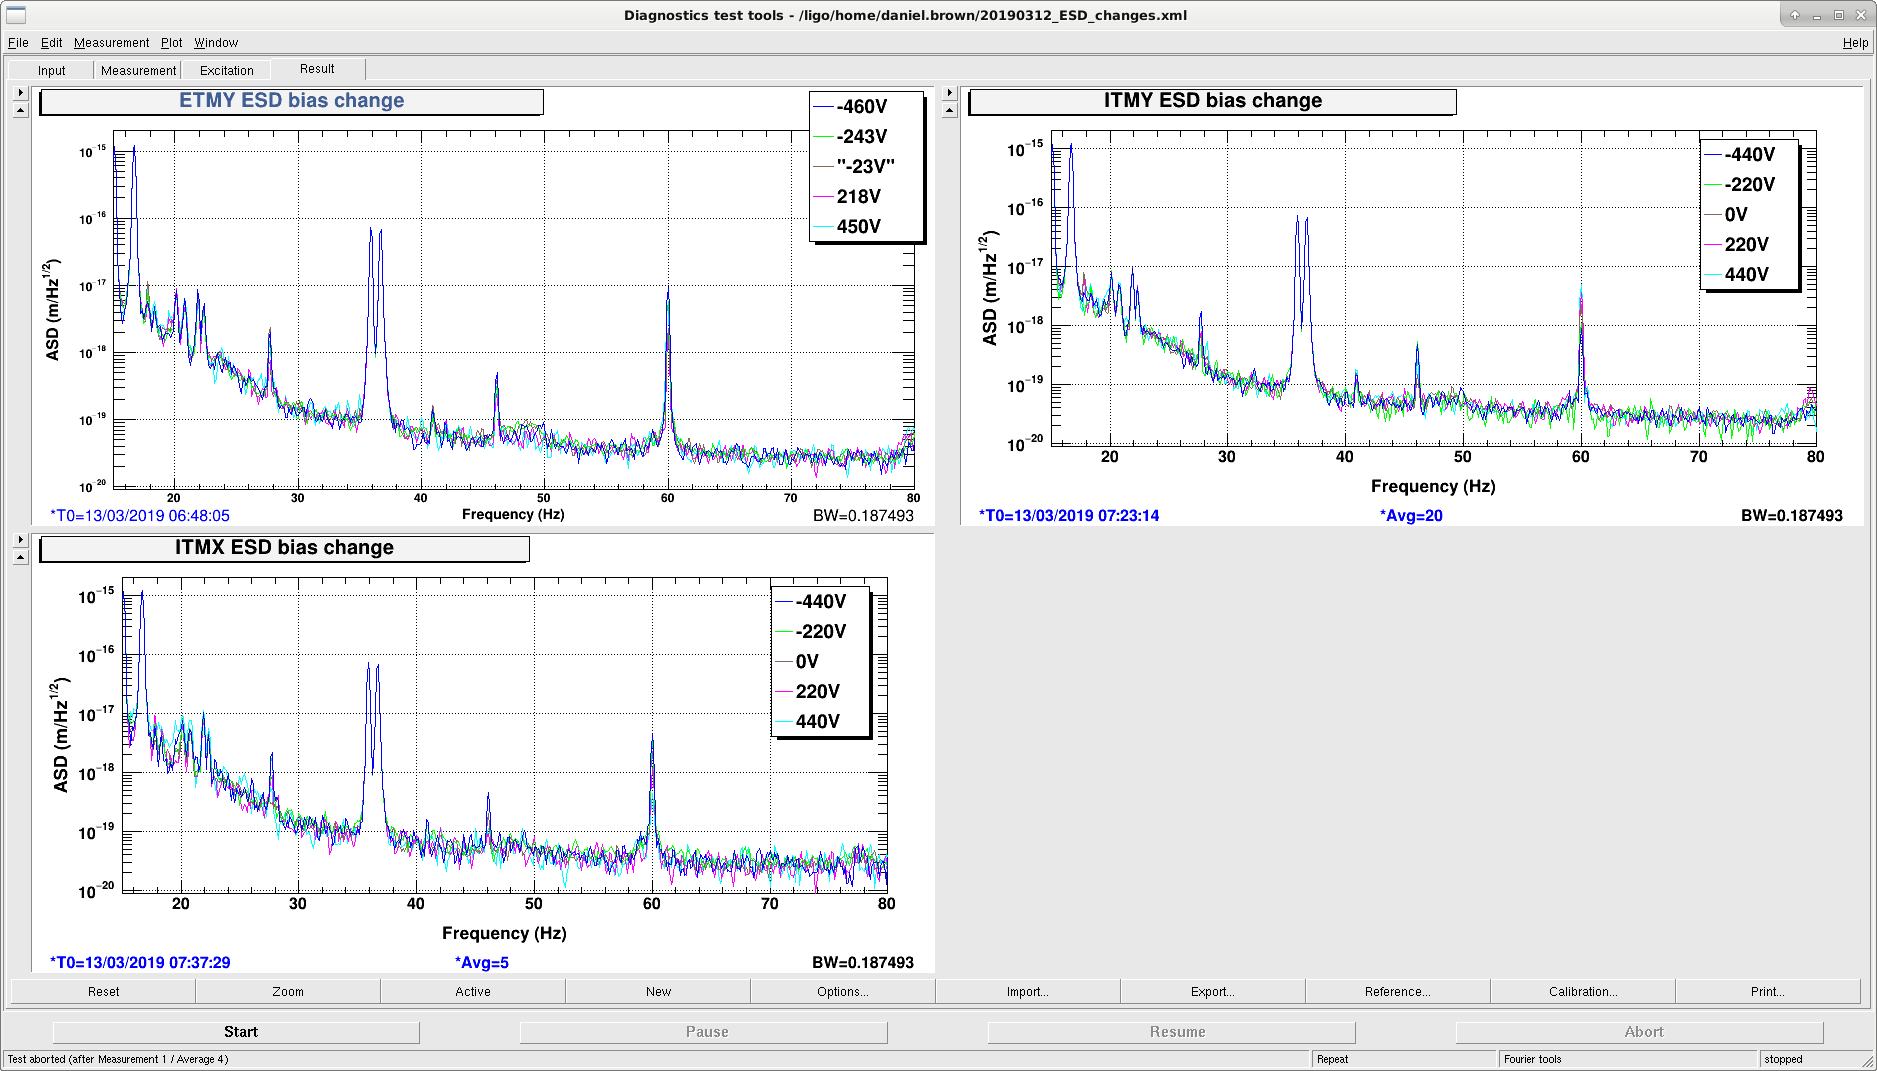
ESD bias test

Georgia, Dan, Sheila

We changed the ESD bias voltages on ITMX, ITMY, and ETMY to see how it affected DARM - it didn't.


Images attached to this report
Comments related to this report
rich.abbott@LIGO.ORG - 08:34, Wednesday 13 March 2019 (47495)
Dan, forgive my ignorance, but were you expecting a change?  I would have guessed that there would be a change seen in DARM.  What is the message to take away from this observation?
daniel.brown@LIGO.ORG - 10:08, Wednesday 13 March 2019 (47498)

Hi Rich, we were not expecting to see a change, but LLO saw some effects when they were changing theirs in alog 43081 and we wanted to see if perhaps we did too. 

H1 ISC (SUS)
jenne.driggers@LIGO.ORG - posted 21:20, Tuesday 12 March 2019 (47488)
Attempt to tune A2L coefficients for OMC SUS

[Jenne, Anamaria, Sheila]

Sheila reminded us that back in 2015 (alog 19691) they adjusted the P2L coefficient for the OMC ASC, which helped improve scatter from the OMC.  We tried to do that again today, and think we were sucessful with P2L.  We then thought we should give Y2L a try, and that has us pretty confused. 

We drove the OMC SUS LOCK P filter bank at 0.2 Hz with 4500 counts.  I then checked the value in the P2L filter bank to ensure that the fringe wrapping was minimized.  The old P2L value from 2015 was 6.0.  I tried both sides of that (5ish and 7ish), and found that I could increase the scattering shelves by some amount at 5.0, and by the same amount with 7.7.  I'm leaving the value at 6.35, which is halfway between those values.  This is indistinguishable from the 6.0 value, but is halfway between the 2 matching values I found.  Since we're not actually sending our OMC ASC signals through the LOCK filter banks and the drivealign matrix, in order to propagate this value of P2L decoupling, we put values in the OMC ASC output matrix.  So, the pos and ang Y (Y is y-axis here, not yaw...) outputs get fed to the SUS_P as you'd expect for P2P, and then we also feed those outputs to SUS_L with matrix elements 6.35 times the P2P matrix elements.  The PosY -> SUS_L element used to be -670, and it is now -711.  The AngY -> SUS_L element used to be 310 and is now 327. 

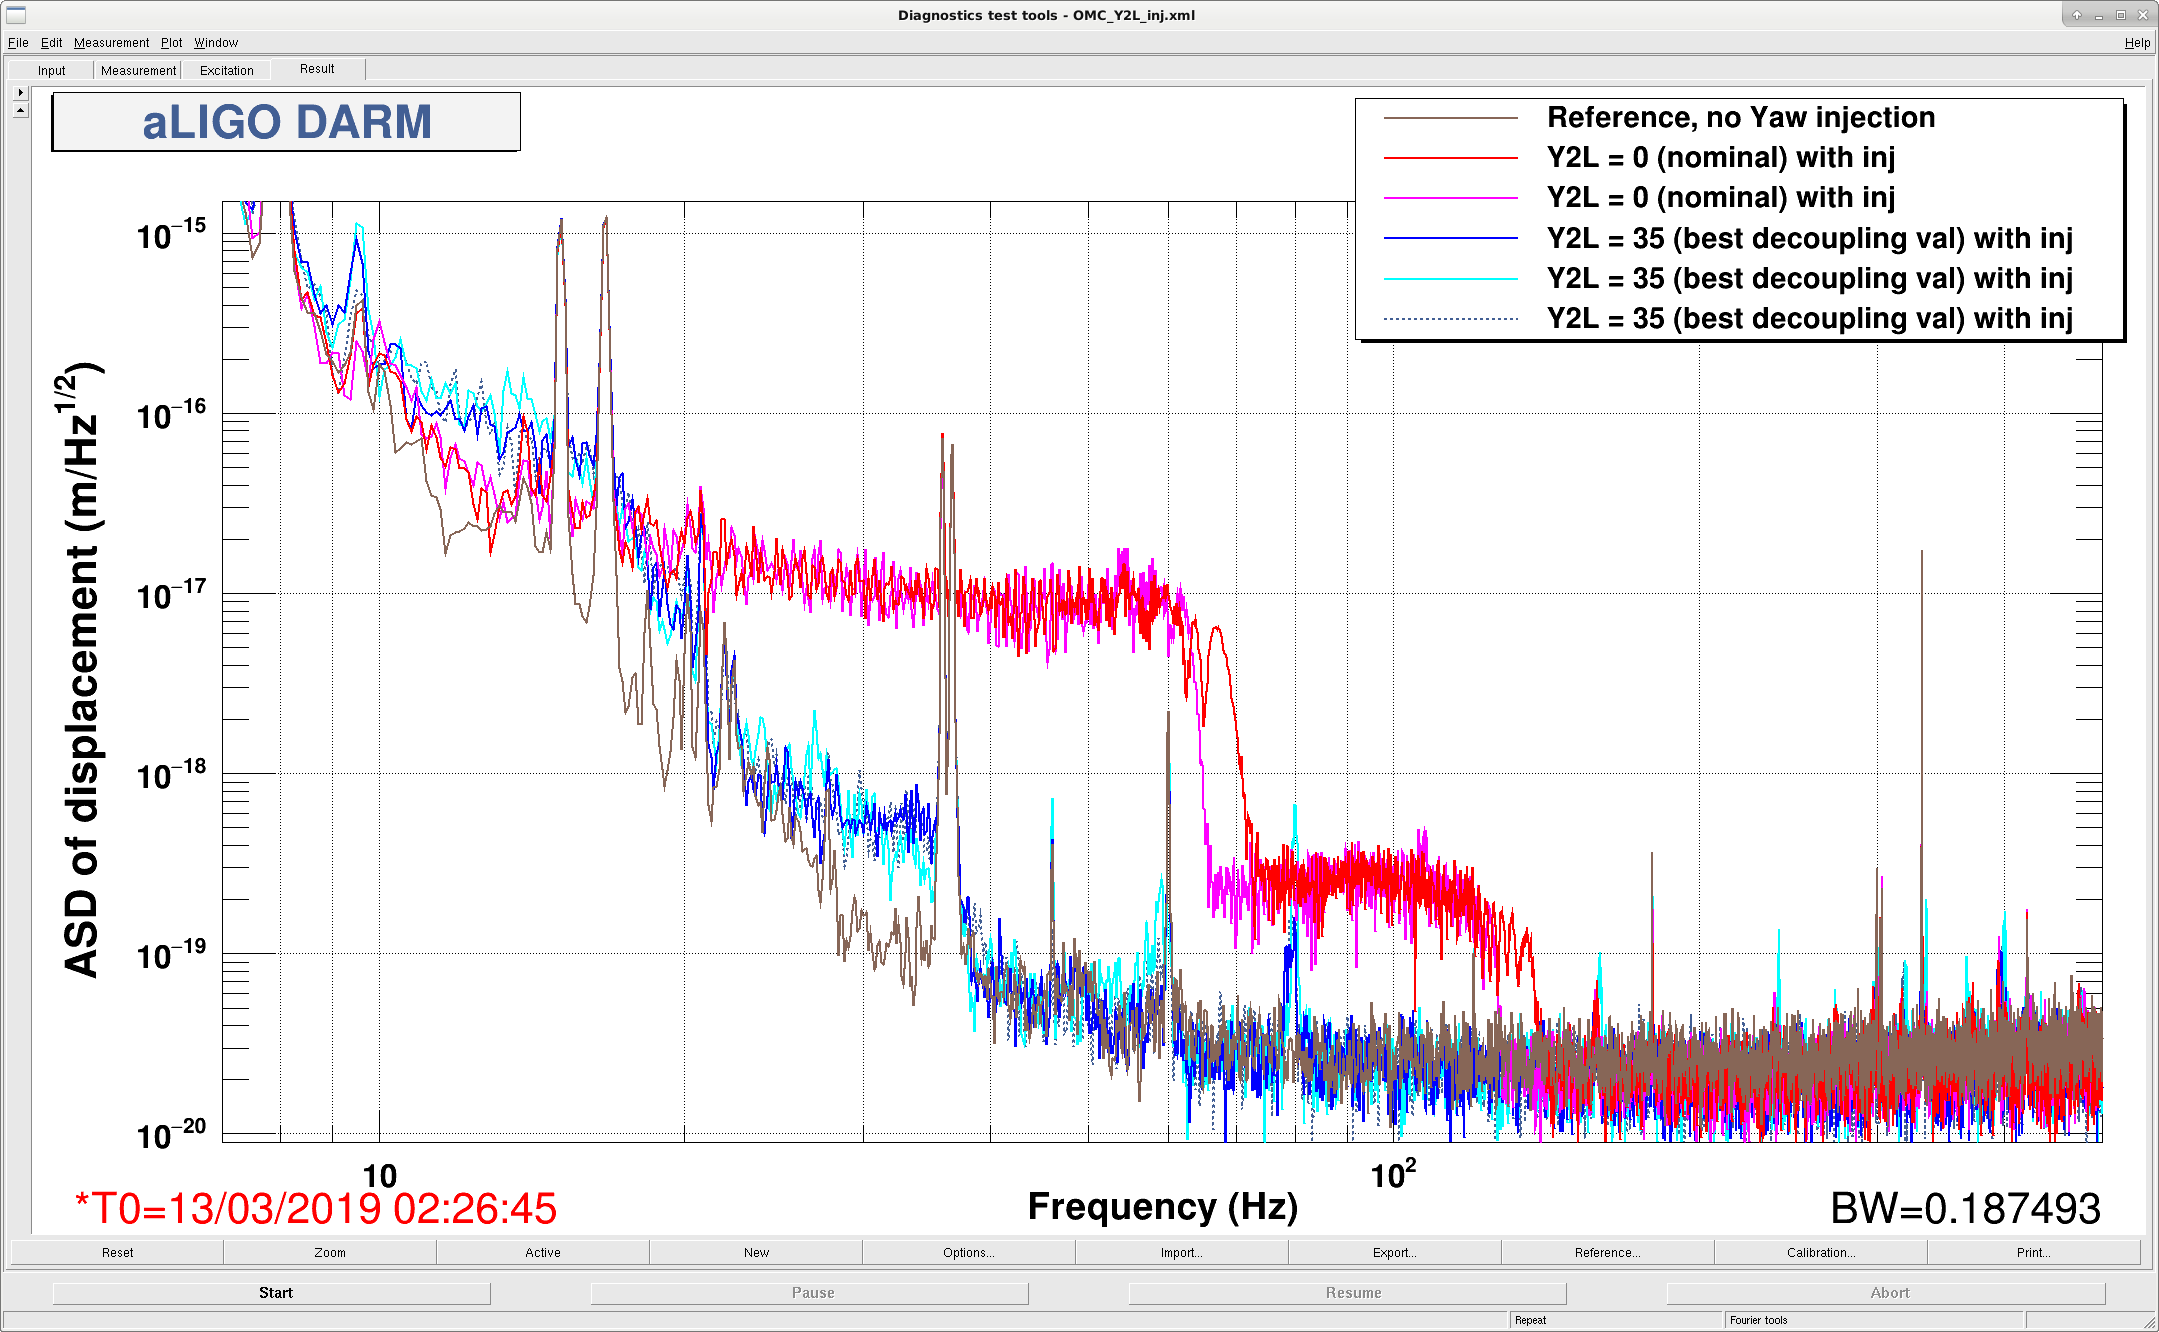
We then switched to driving the OMC SUS LOCK Y filter bank at 0.2 Hz with 1000 counts.  With a Y2L value of 0 (we have never used any Y2L decoupling for the OMC suspension), I saw giant scattering shelves.  I then changed the Y2L gain to minimize the scattering shelves, and saw a huge improvement, which you can see in the attached figure.  The Y2L value I need to minimize those shelves is 35, which seems awfully high, but I was able to convince myself that maybe it needed to be large since the input beam to the OMC breadboard is not near the geometric center of the breadboard.  We then started stepping up the OMC ASC output matrix values for PosX and AngX to OMC L, to move them toward being 35 times the PosX and AngX matrix values.  However, we started to see (not nearly as big as the injection scattering) scattering.  This was repeatable, in that I took away the 'decoupling' matrix elements and the scatter went away, put them back, the scatter comes back.

Anamaria and I checked that there aren't any DC gains that are different in the OMC ASC path versus the LOCK filter banks, so it's not clear to me why the Y2L decoupling value that was good for the Lock Yaw drive isn't good for the OMC ASC Yaw drive. For now, we are leaving the Y2L elements of the OMC ASC output matrix at their nominal values of 0 until we understand more what is going on.  One supposition is that it matters what frequency we are moving the OMC at, and that we should be doing this at some other frequency.


Images attached to this report
H1 TCS
daniel.brown@LIGO.ORG - posted 19:39, Tuesday 12 March 2019 (47486)
ITMY mask optical depth measurement

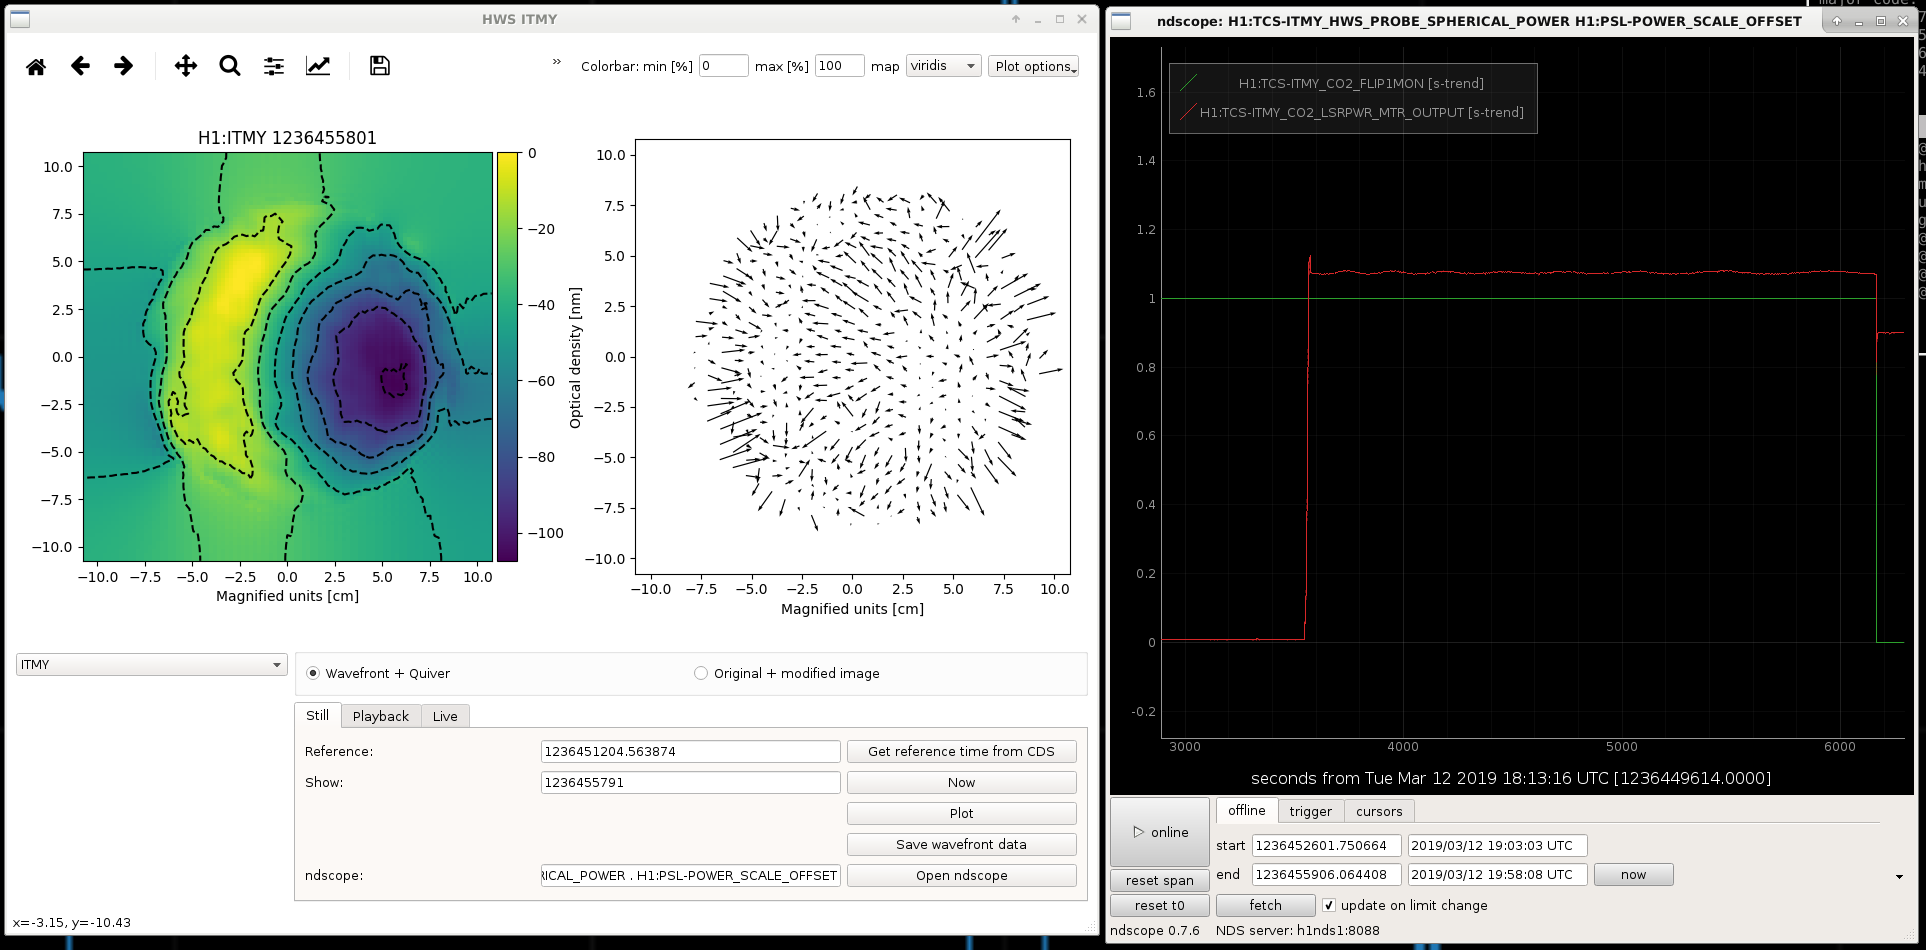
This morning all the laser got tripped and the CO2s went down. I used this opportunity to switch on the mask from a cold (ring heater only) state to get the actual OPD of the mask. Beforehand the CO2 cooling down was interfering with OPD measurement of the mask.

We now see an OPD more in line with the prediction (top right plot in main figure). Using 1.1W of CO2 on the mask gives similar level of OPD change compared to Aidan's model, which originally required 450mw. The test was cut short because we needed to get the thermal state ready for locking.

Images attached to this report
H1 ISC
daniel.sigg@LIGO.ORG - posted 12:56, Tuesday 12 March 2019 - last comment - 18:47, Tuesday 12 March 2019(47459)
Common mode board readbacks

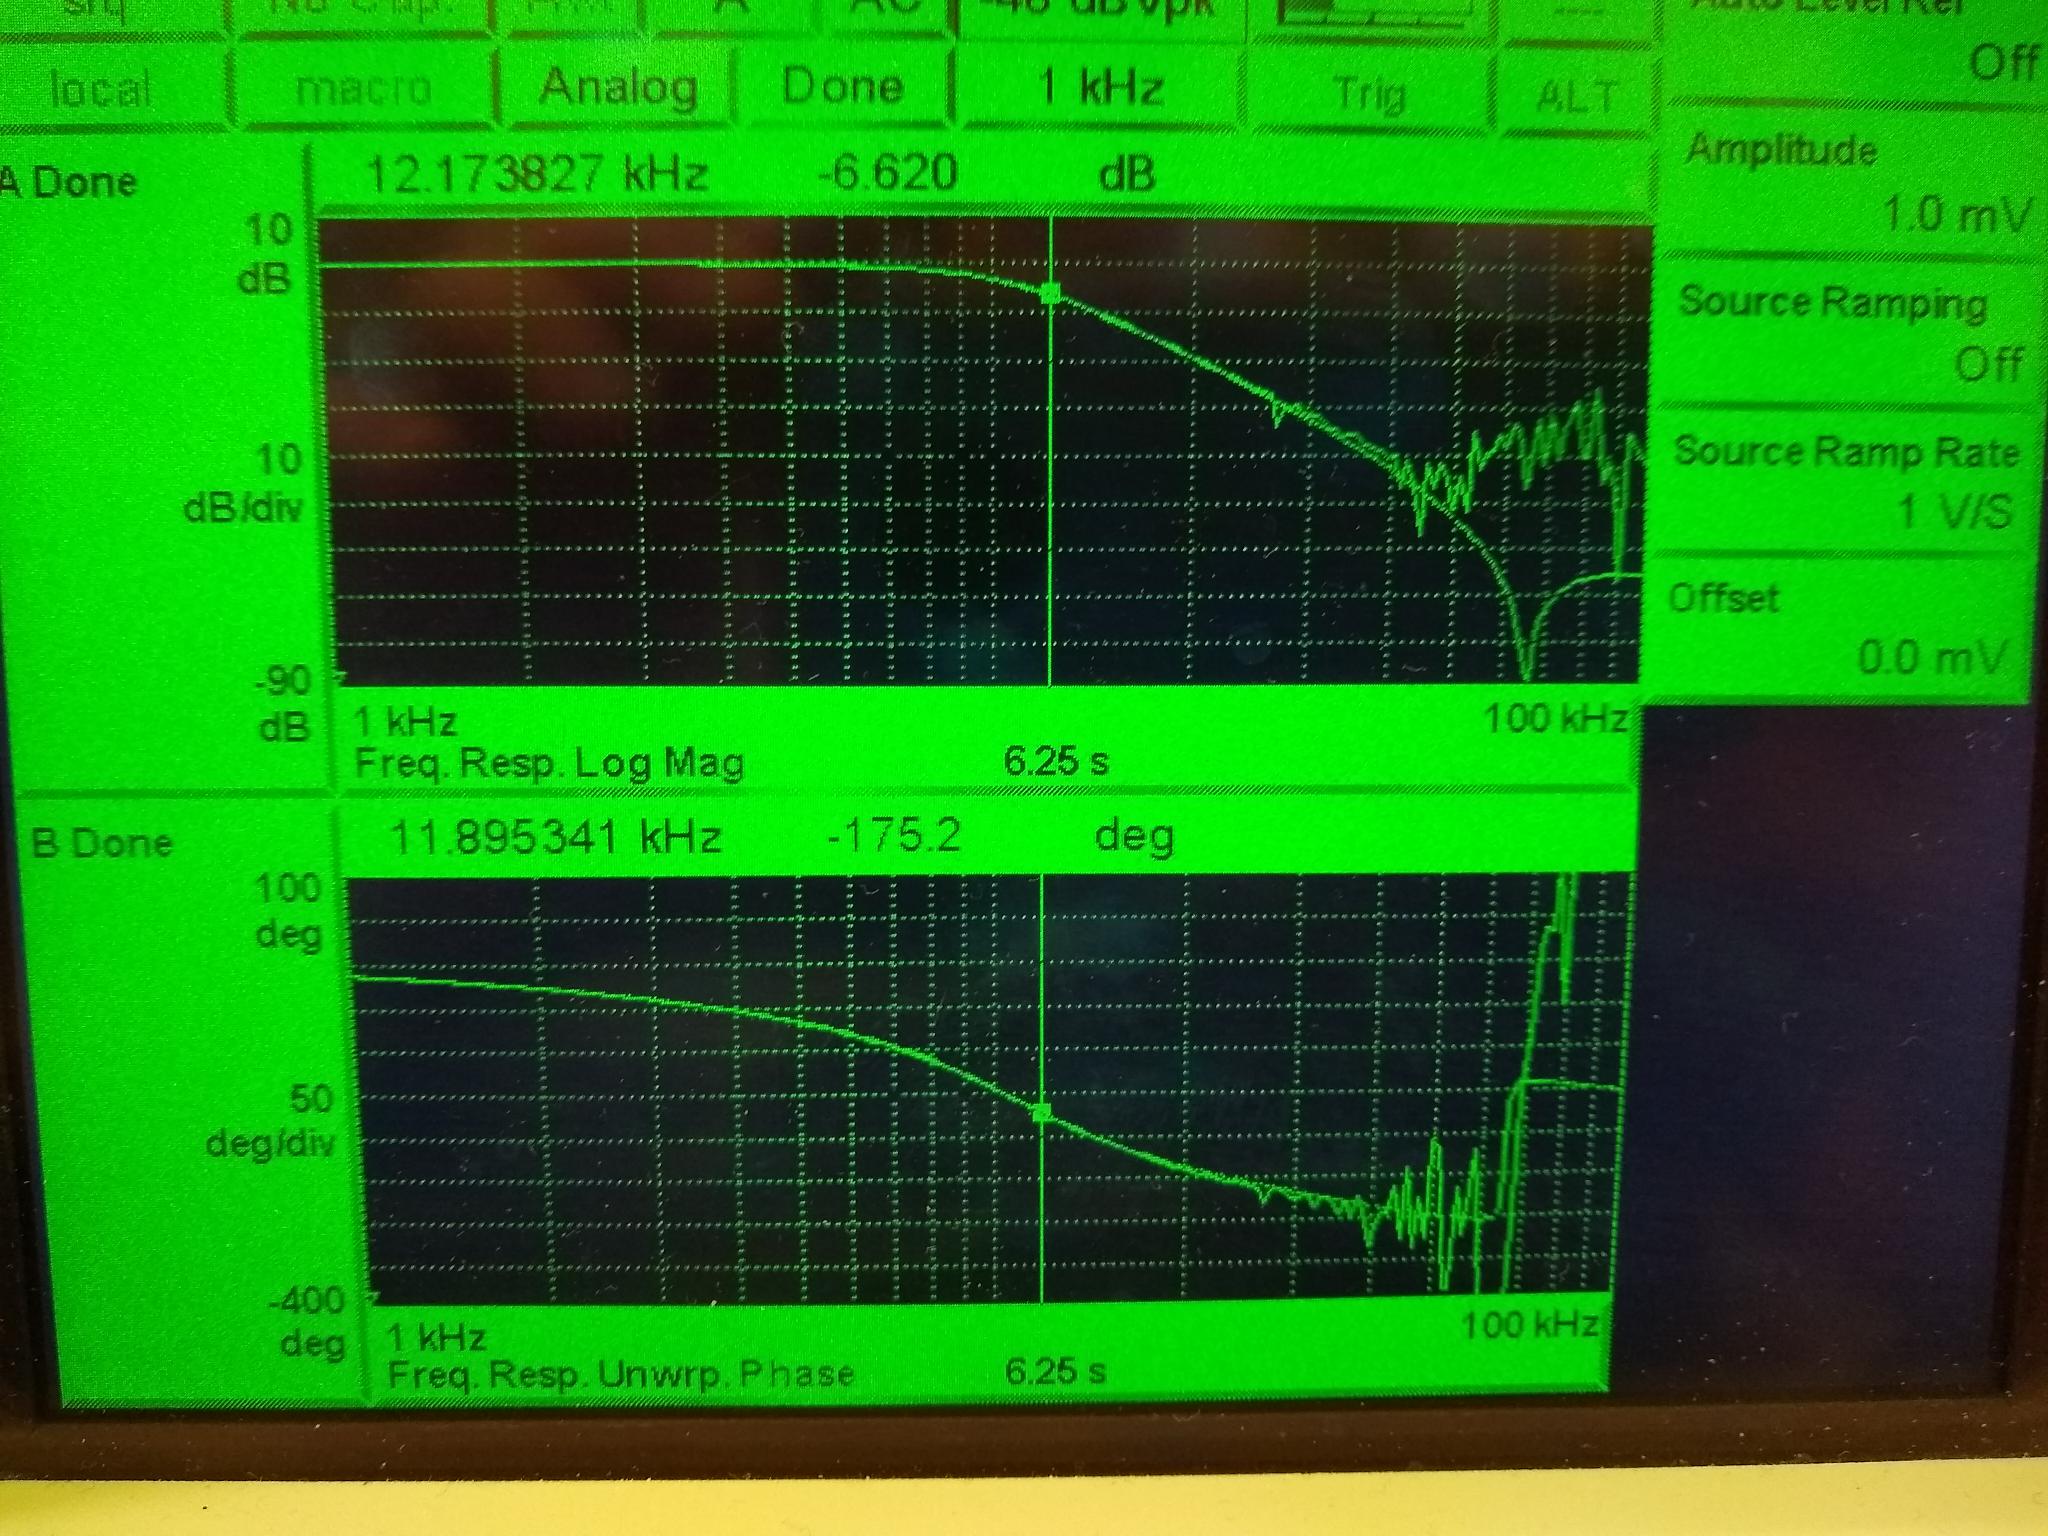
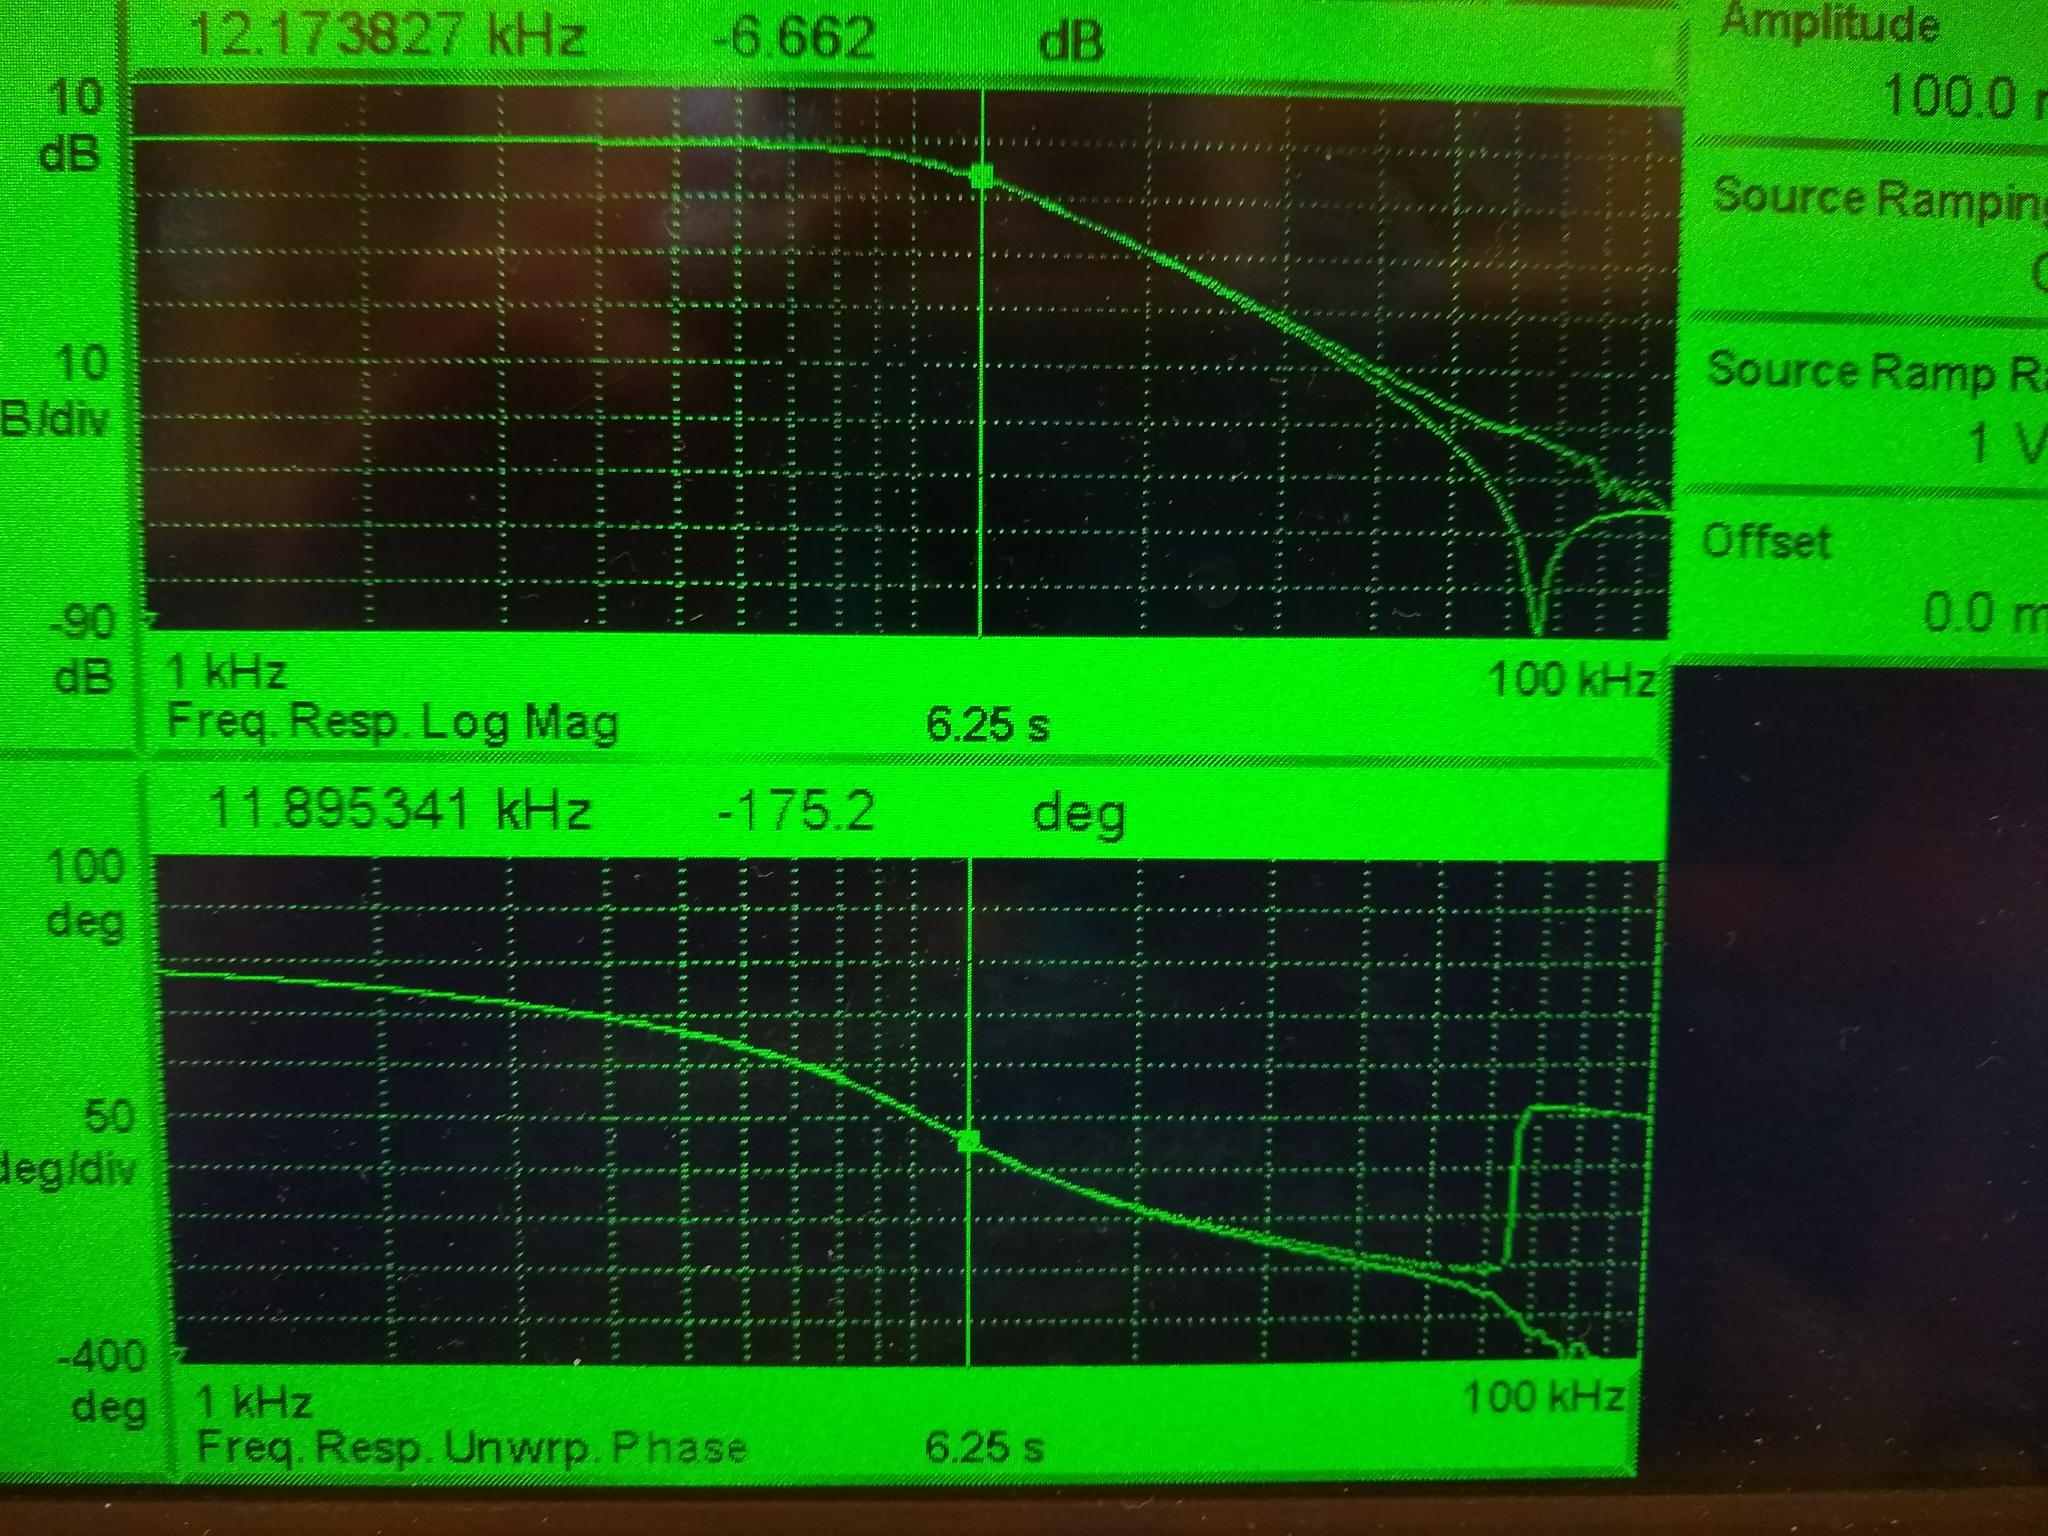
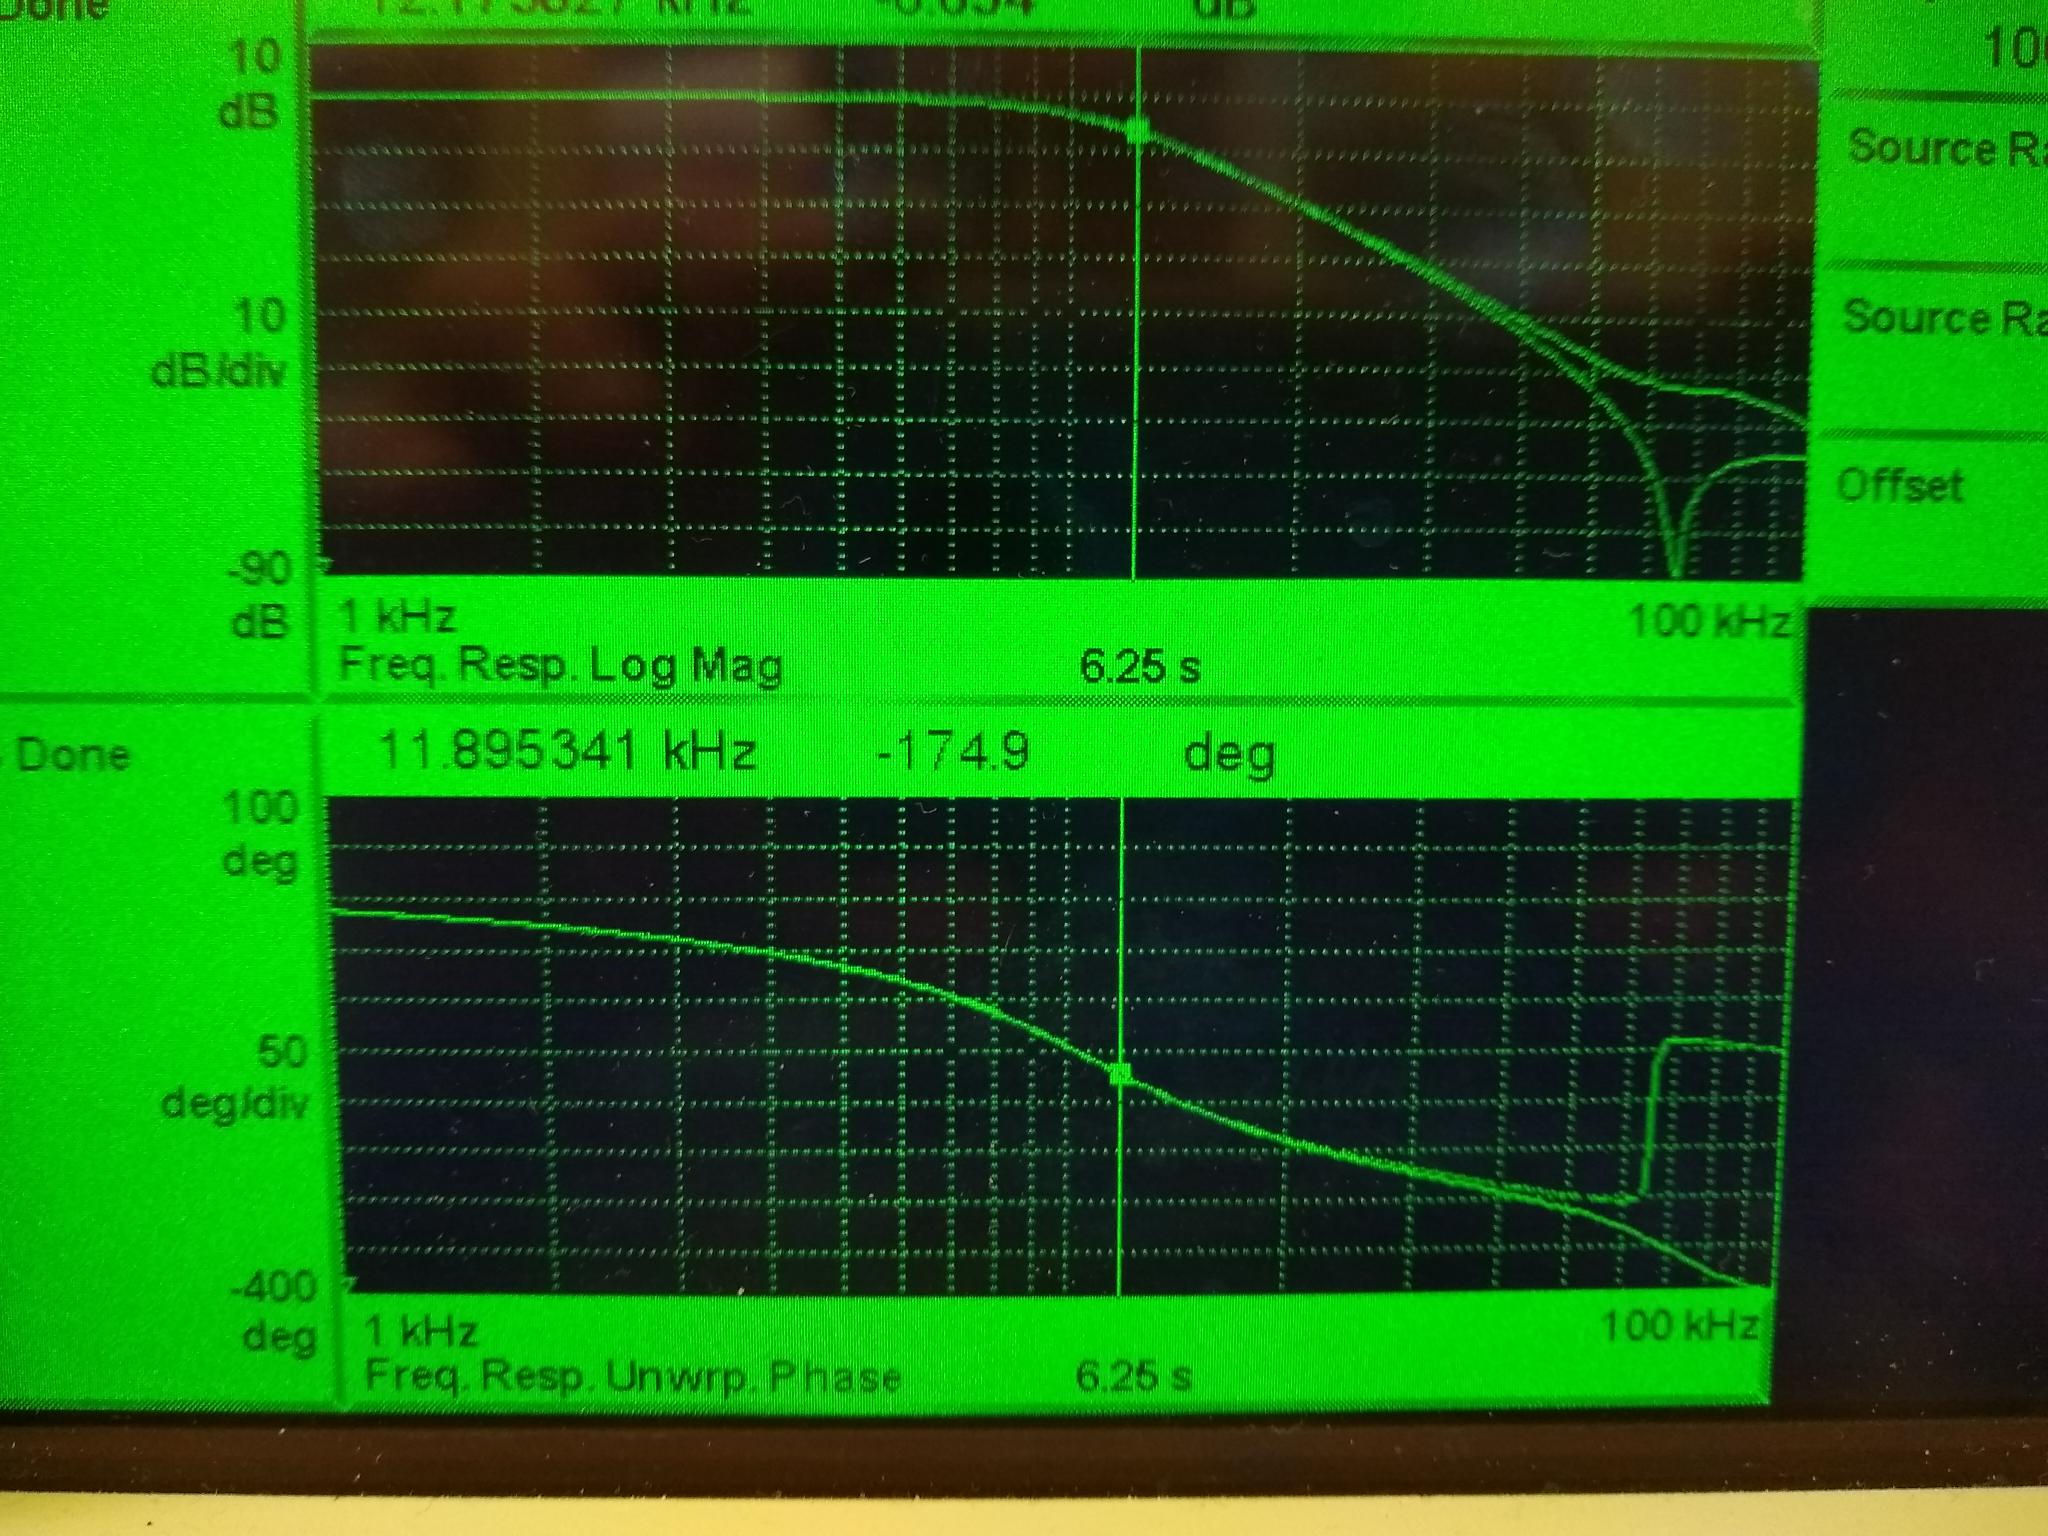
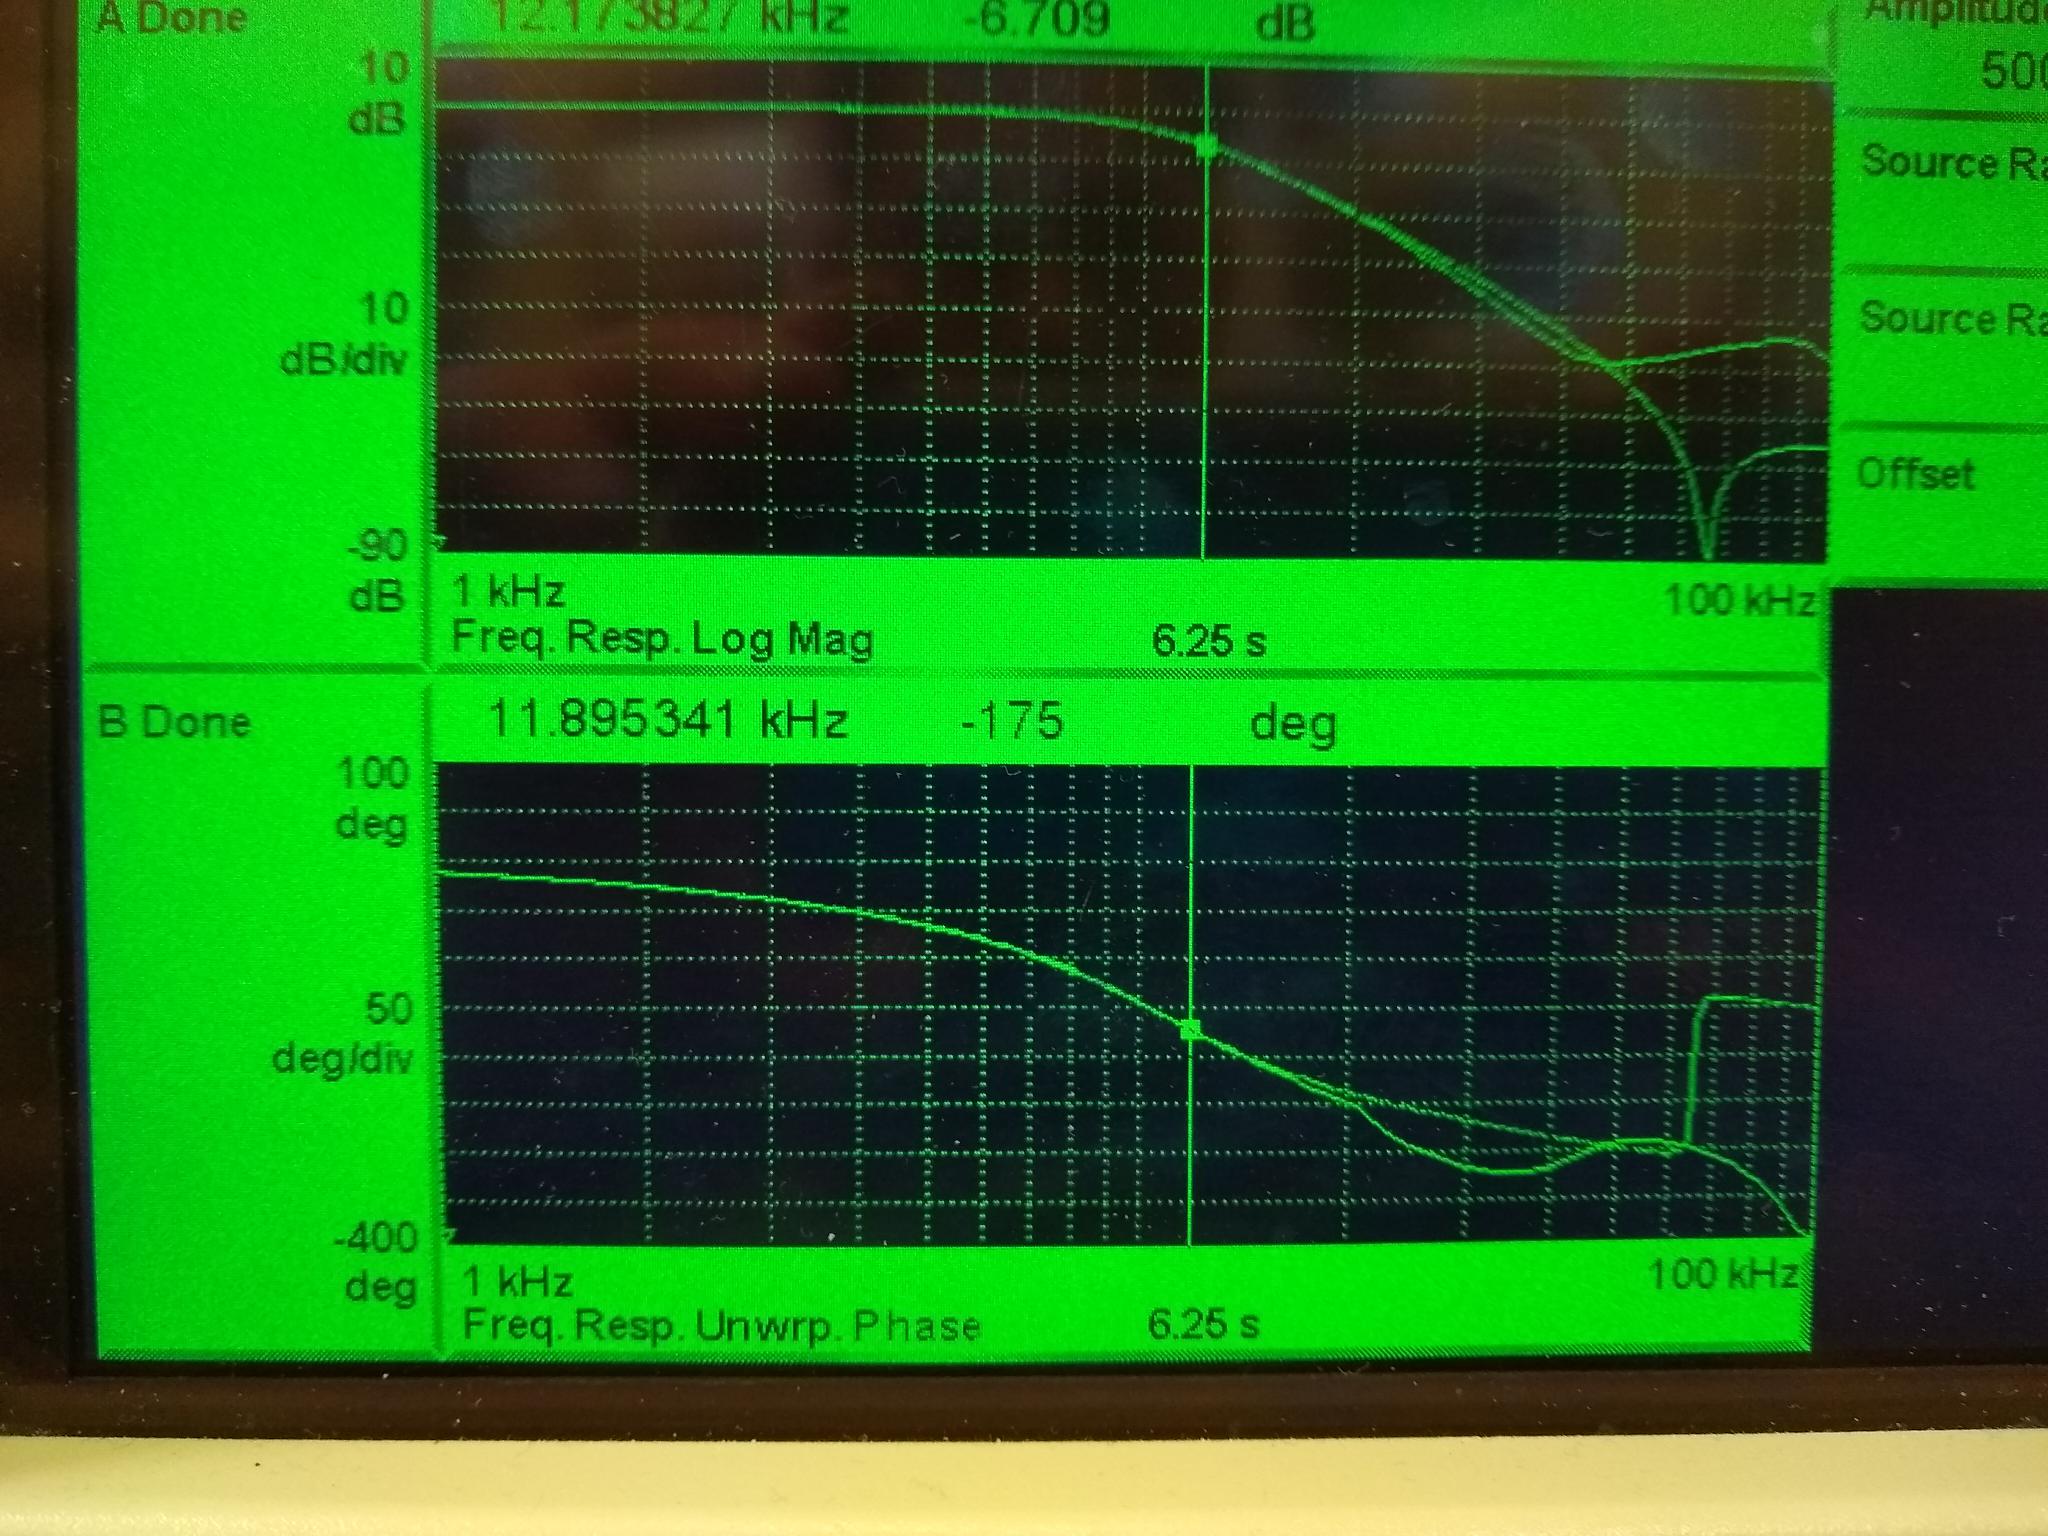
Opening up the AA chassis (S/N S1102788) we confirmed that the AA boards D070081 (chn 16-23 S/N S1202203; chn 24-31 S/N S1202202) have AD8622 stuffed. On channels  20-27 all of them (input and output) were replaced by ADA4075-2ARZ. This incudes the channels for the LSC_REFL_SERVO readbacks, the IMC-REFL_SERVO readbacks and the SQZ-CLF_REFL_RF6 readbacks. Attached are some measured transfer functions for a channel with the ADA4075-2 (reference trace with notch) and for a channel with the AD8622 (no notch). Varying the drive voltage from 1mV to 5V made no difference for the ADA4075-2, For the AD8622, one can clearly see that it cannot drive fast enough and at frequencies around the notch it looks anything but a notch.

Plots: AD8622 transfer function for 5V, 1V, 100mV, 10mV and 1mV drive compared against the ADA4075-2.

Images attached to this report
Comments related to this report
daniel.sigg@LIGO.ORG - 18:12, Tuesday 12 March 2019 (47482)

Repeating the measurements done in alog 47345, we find significant improvements. We now have good coherence between CTRL and SLOW for most of the frequency range. Due to the pole at 500 Hz the SLOW readback runs into quantization noise above 15 kHz. The ERR signal readback also has much better coherence. Between 10 and 100 Hz it seems limited by the  voltage noise of the first boost stage.

The line at ~14 kHz dominates the rms.

Non-image files attached to this comment
daniel.sigg@LIGO.ORG - 18:24, Tuesday 12 March 2019 (47484)

And here is the low frequency version.

Non-image files attached to this comment
daniel.sigg@LIGO.ORG - 18:47, Tuesday 12 March 2019 (47485)

Here are the plots for the IMC servo. The faster OpAmps also improved the IMC-F and IMC-L readbacks. The IMC_I readback shows flat noise at a relatively high voltage level. It may be limited by out-of-band noise.

First plot show current readbacks compared to the old ones.

Second plot shows the raw input signals in counts. There seems to be some excess noise between 10 and 50 Hz in IMC-F. Maybe a glitch here since the next plot looks different.

Third plot shows a full bandwidth spectrum. MC-F approaches the quantization noise between 1 and 20 Hz.

Non-image files attached to this comment
H1 DetChar (DetChar)
keith.riles@LIGO.ORG - posted 08:29, Tuesday 12 March 2019 - last comment - 10:57, Friday 29 March 2019(47450)
Strong 1 Hz comb appearing in H1 DARM after last Tuesday's maintenance
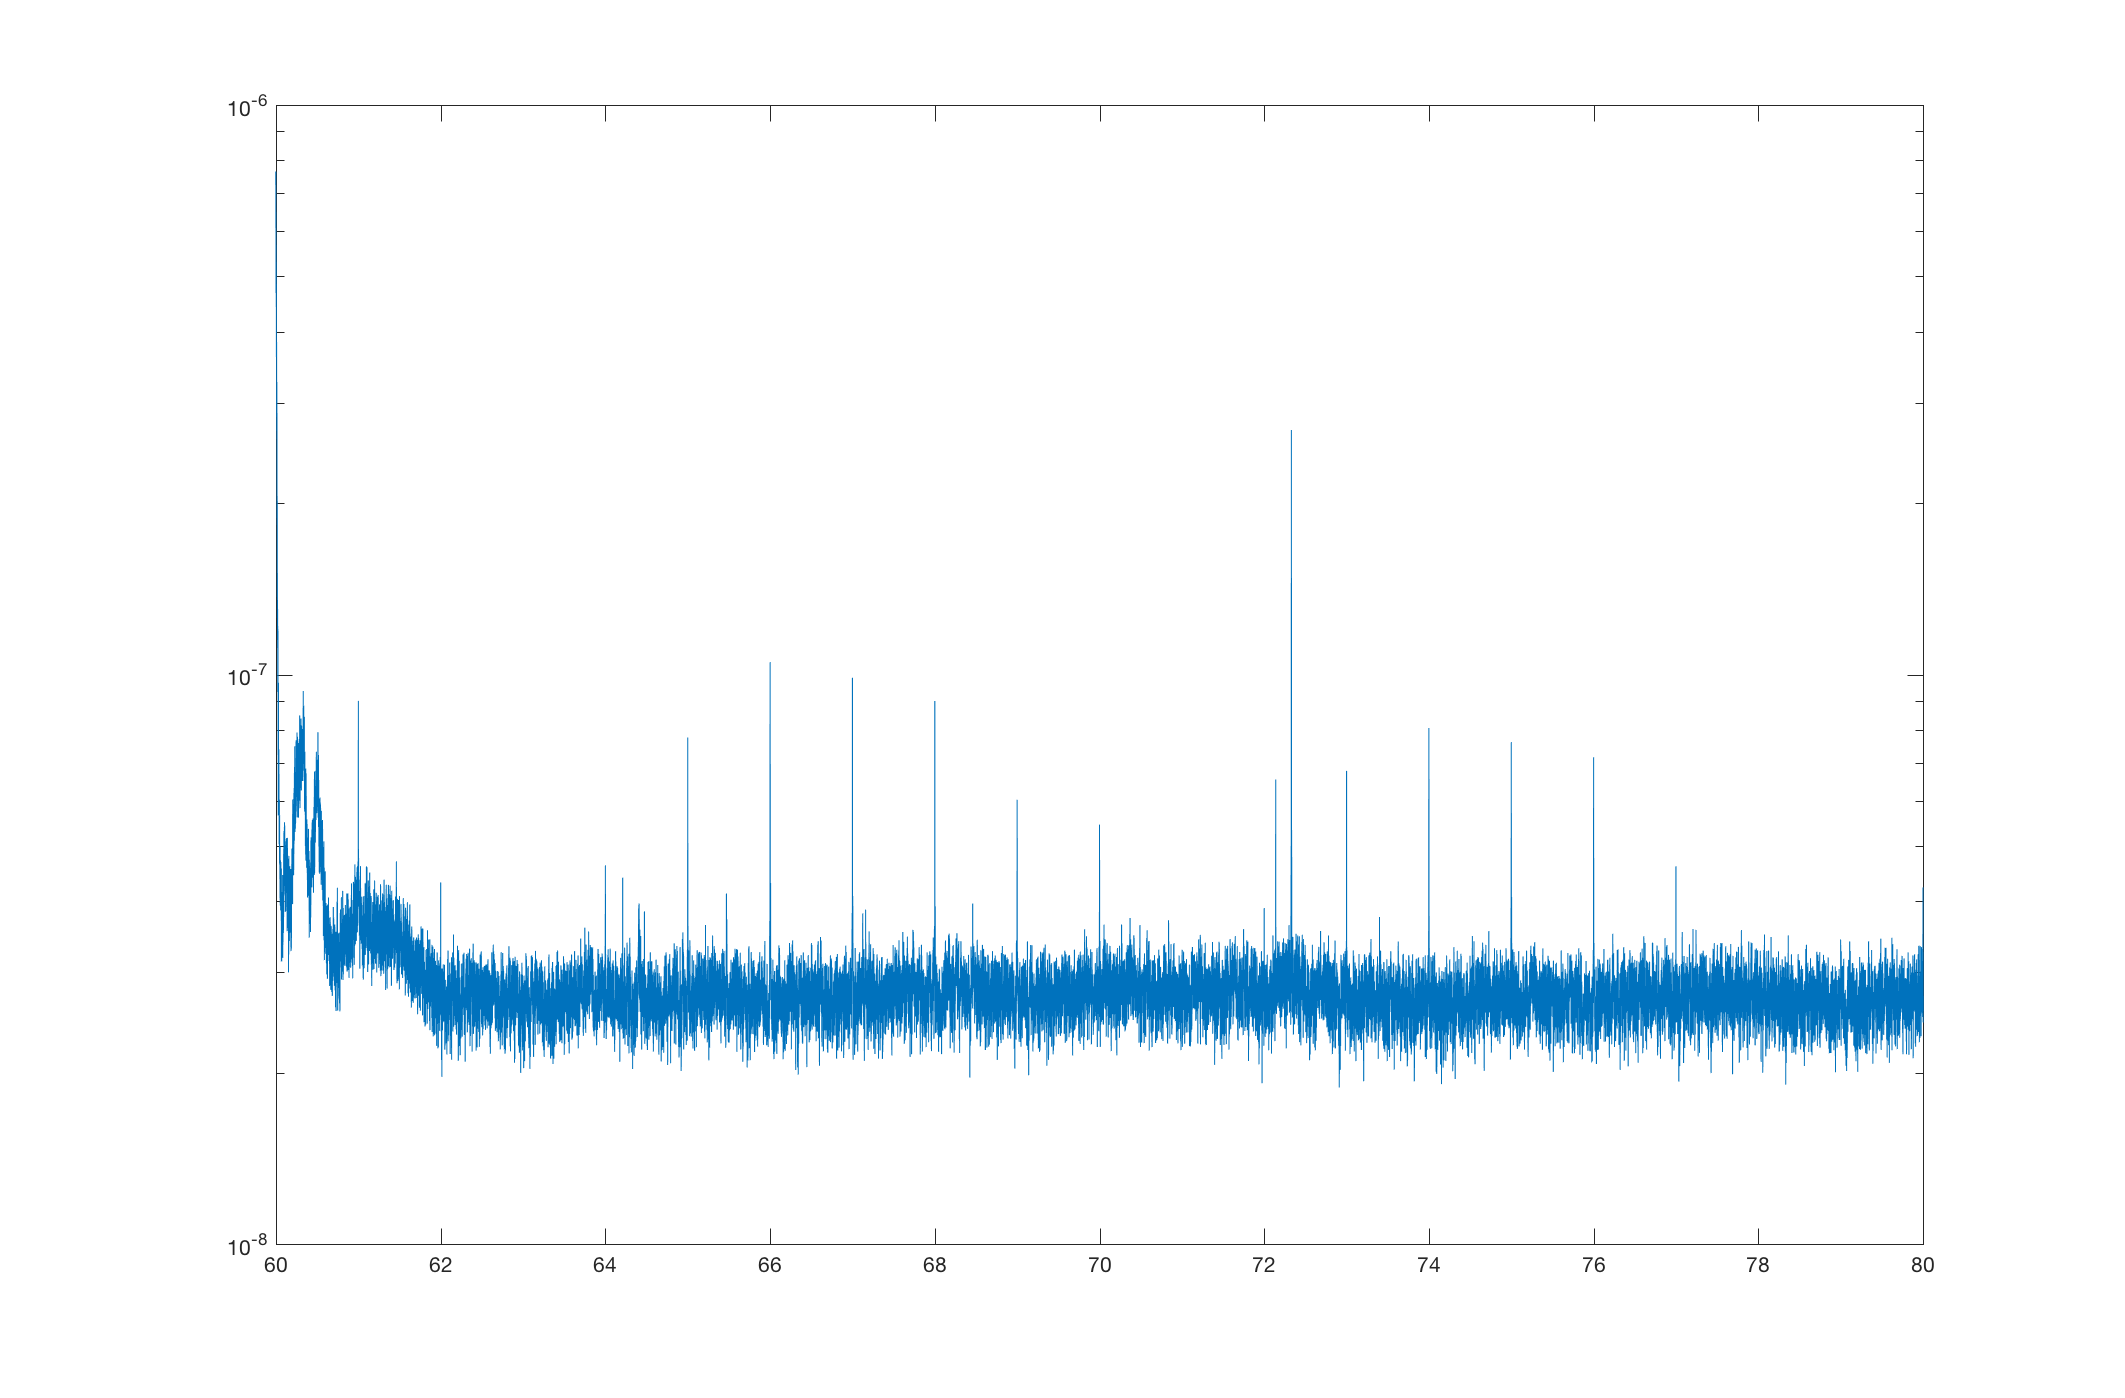
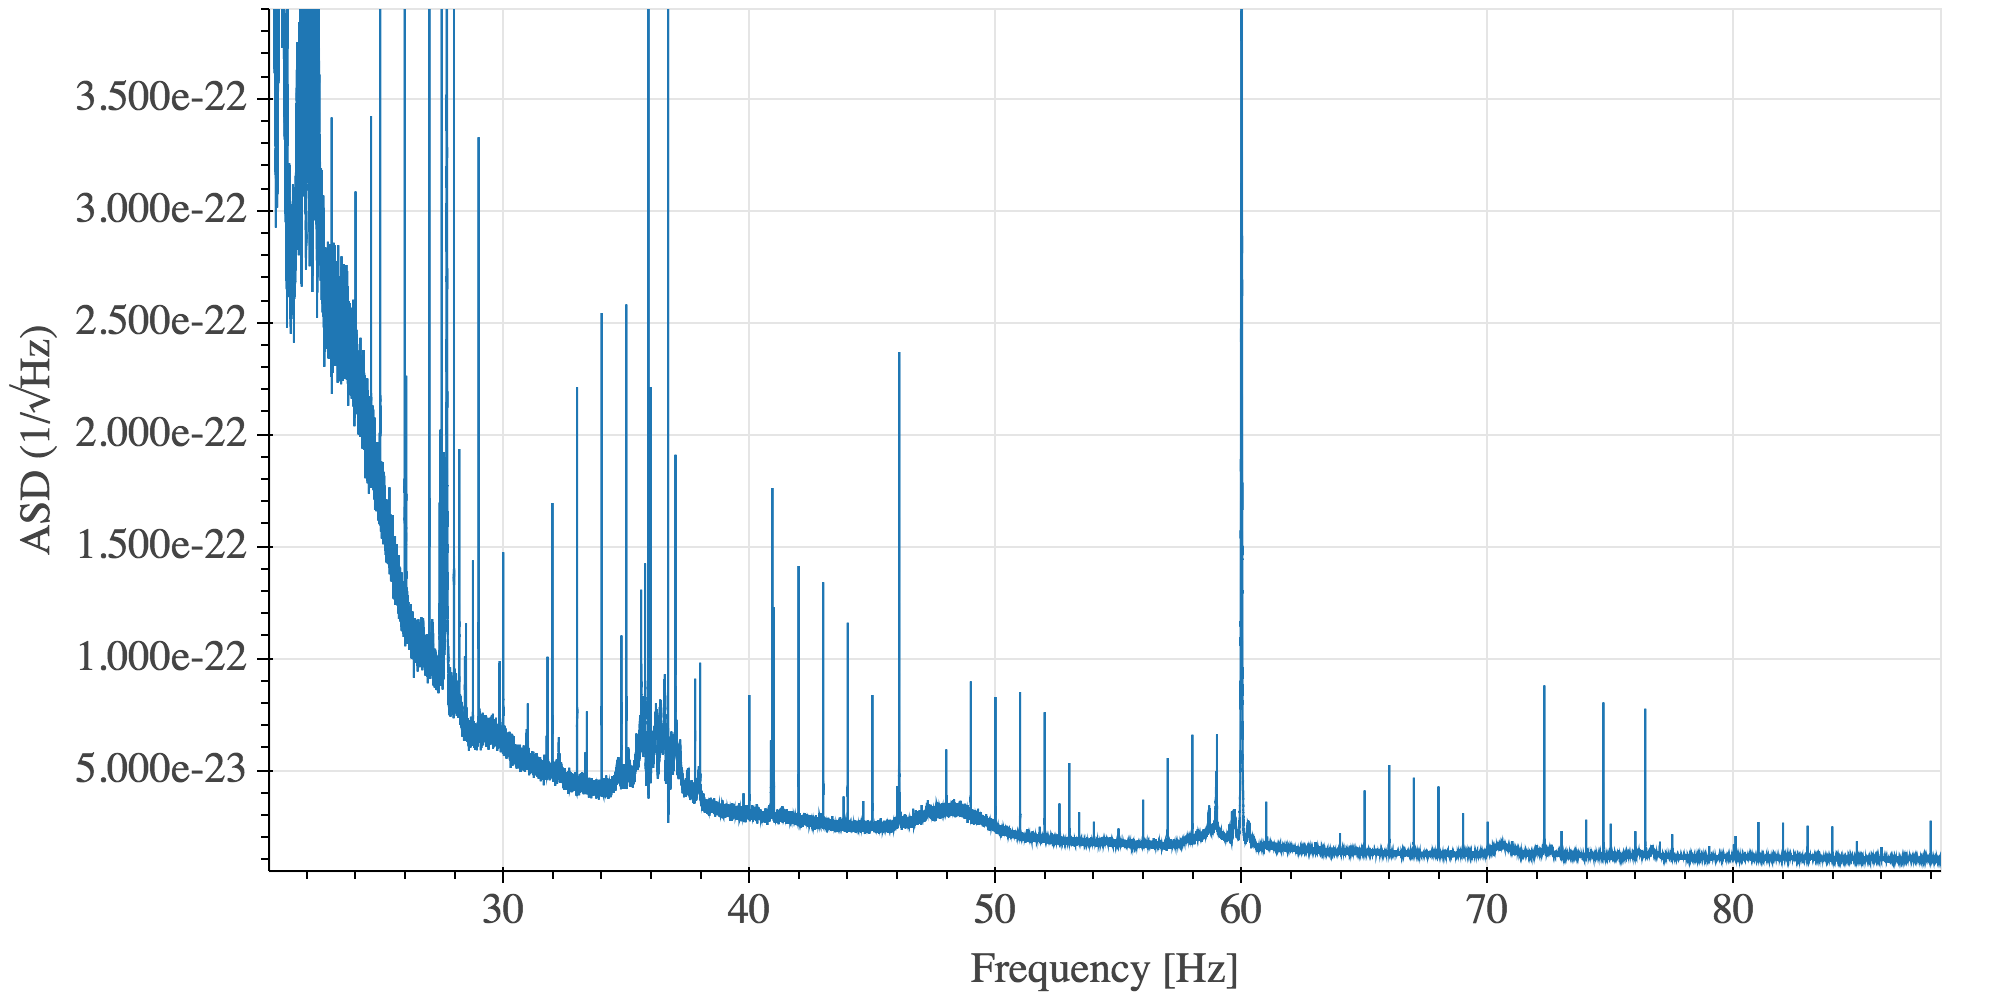
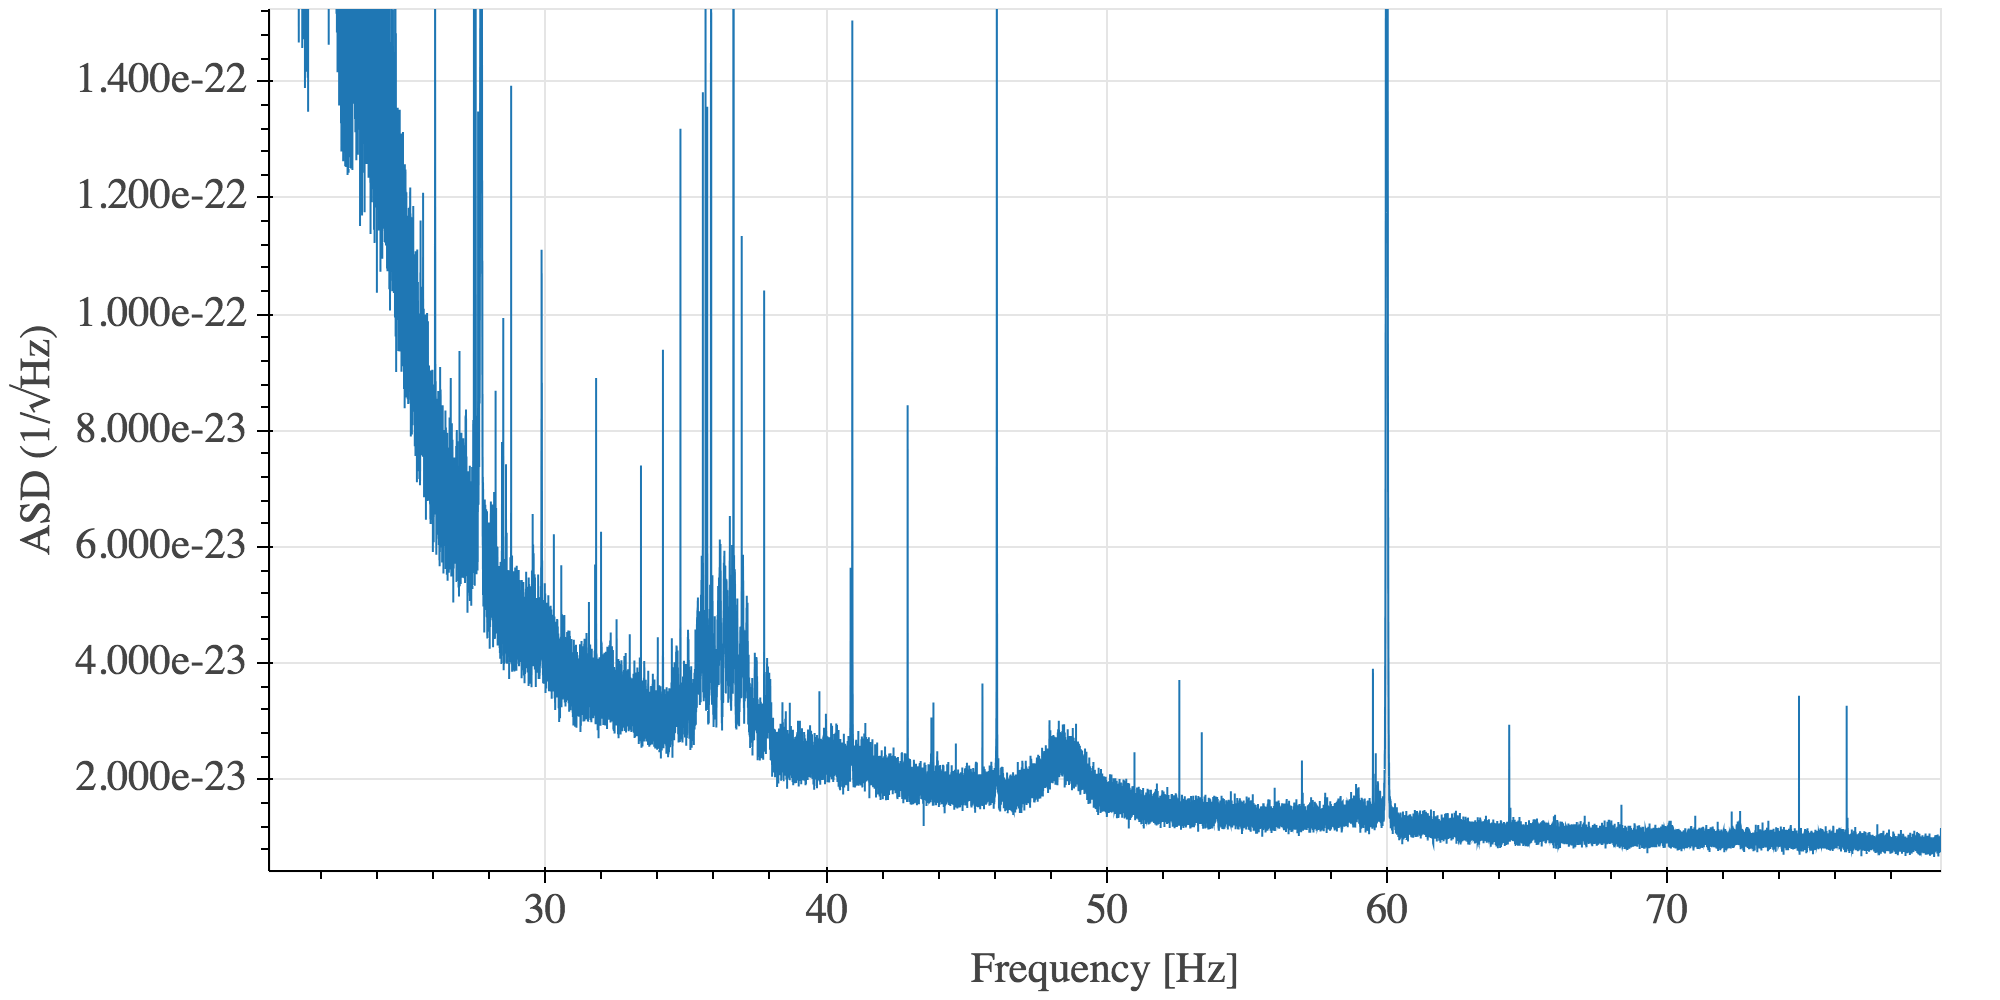
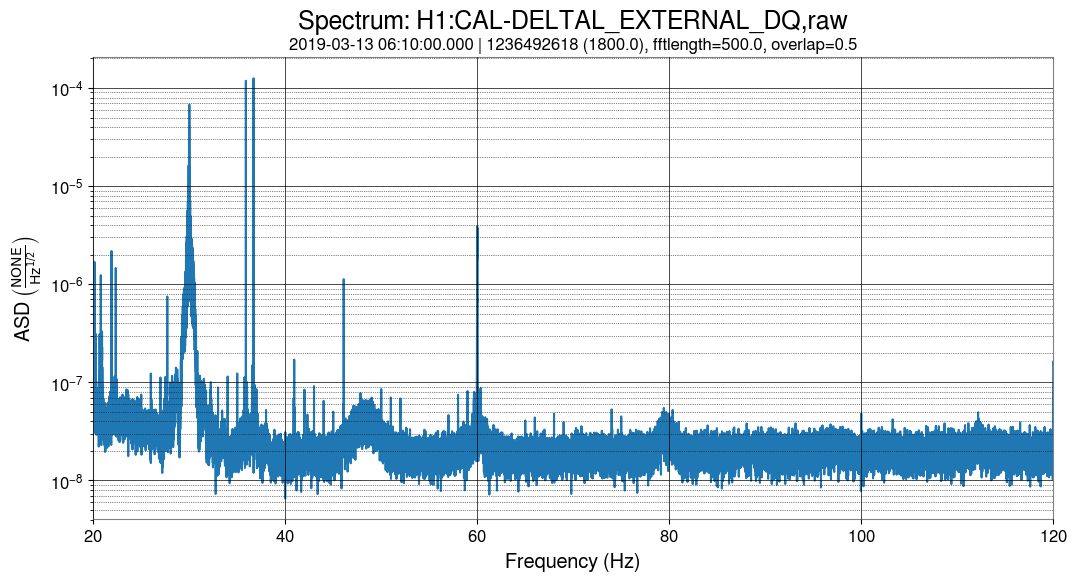
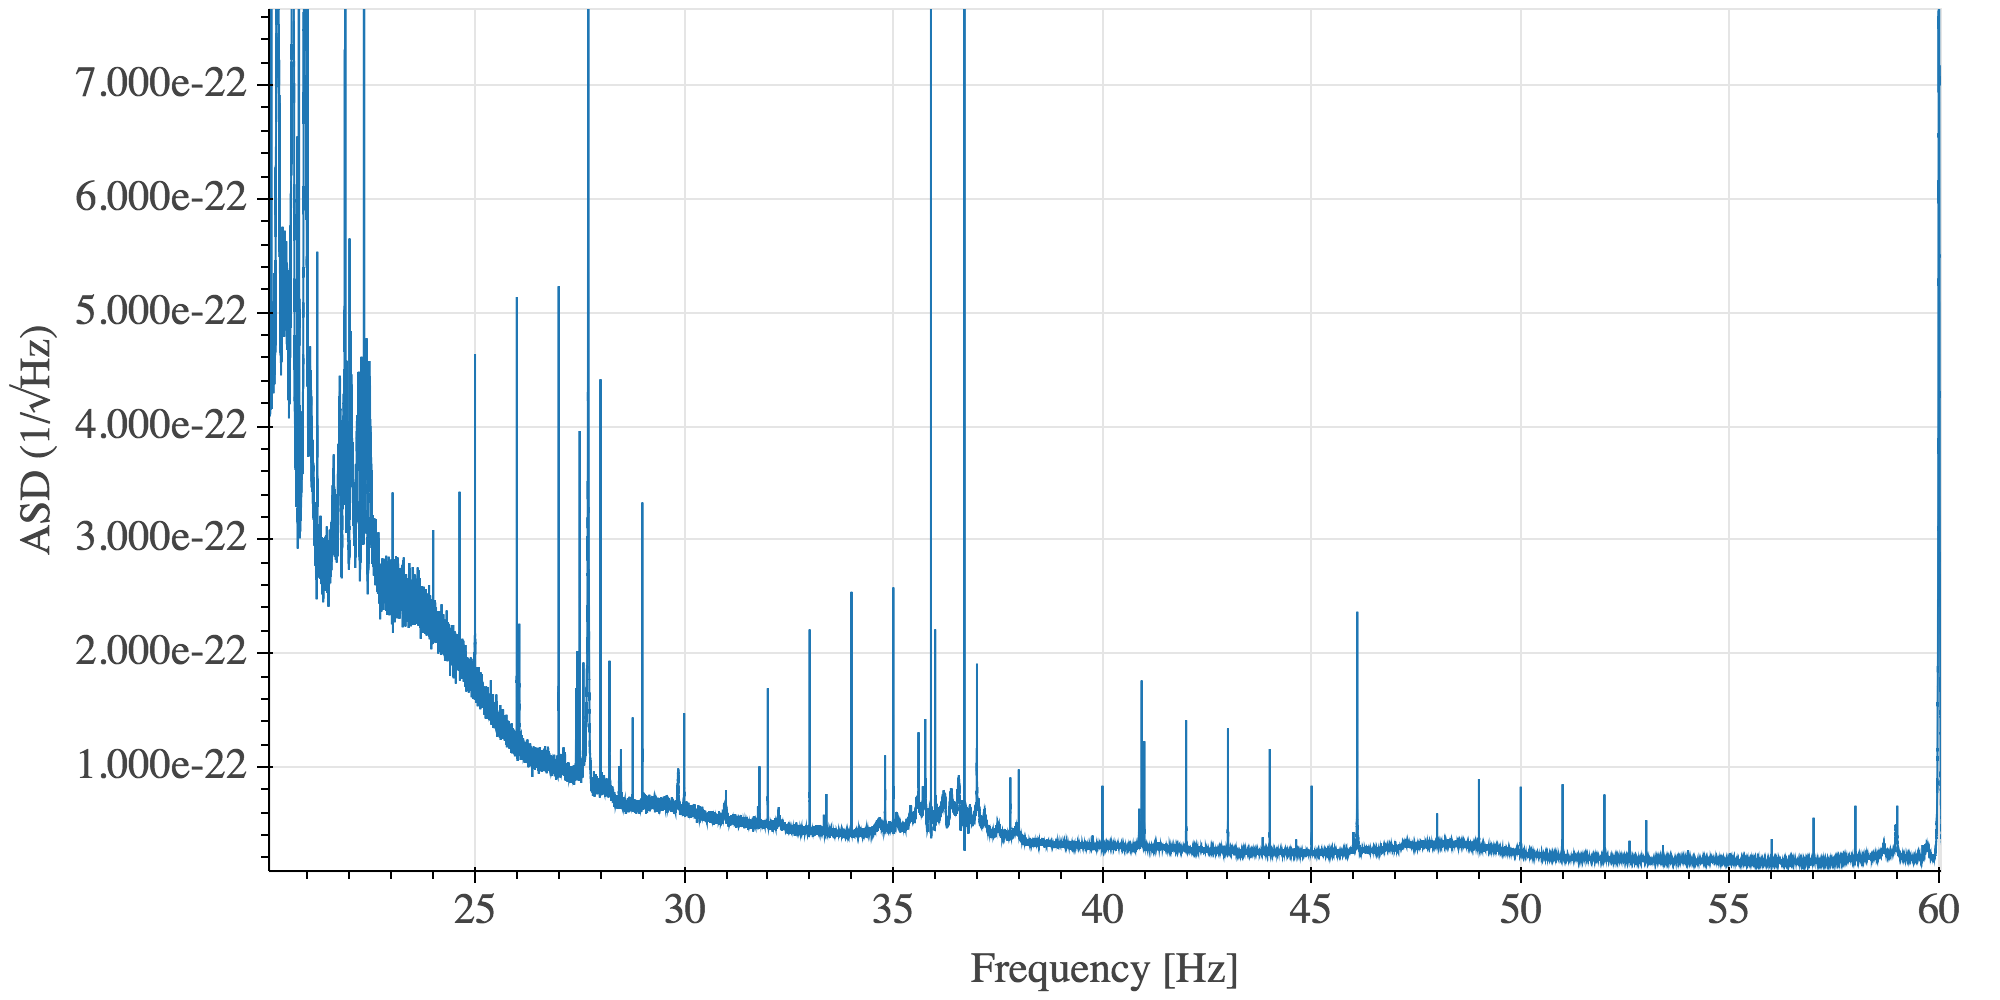
Given that H1 is still in commissioning mode, I hesitate to report on lines that may be due to ongoing work, but I'm seeing a very strong 1-Hz comb in DARM as of last Wednesday, which I suspect is unintended. Below are spectra of 20-120 Hz and its 20-Hz sub-bands from yesterday's data (typical of daily spectra since Wednesday). 
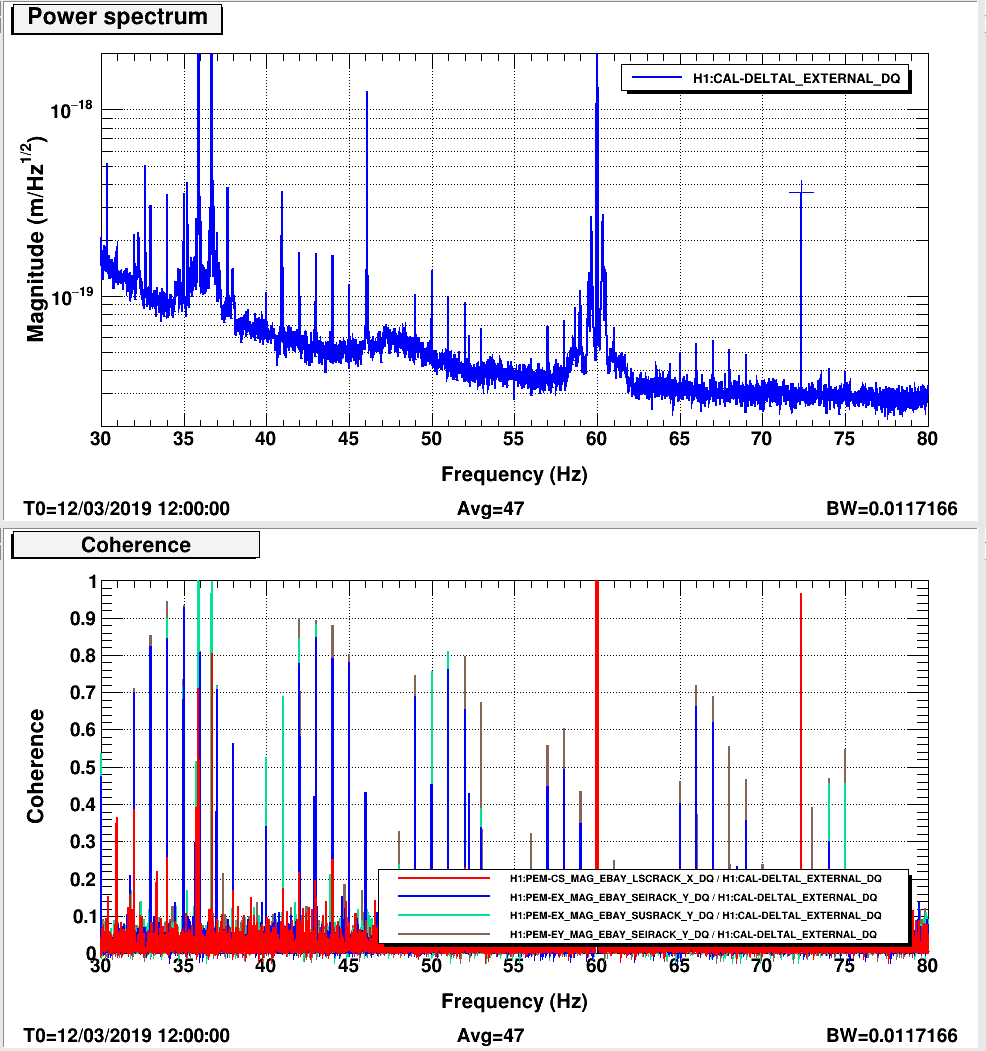
Note that the lines are on exact 1-Hz multiples (to ~0.5 mHz resolution), but they have flat shoulders of O(0.01 Hz) full width. An arbitrary but typical example at 34 Hz is shown.
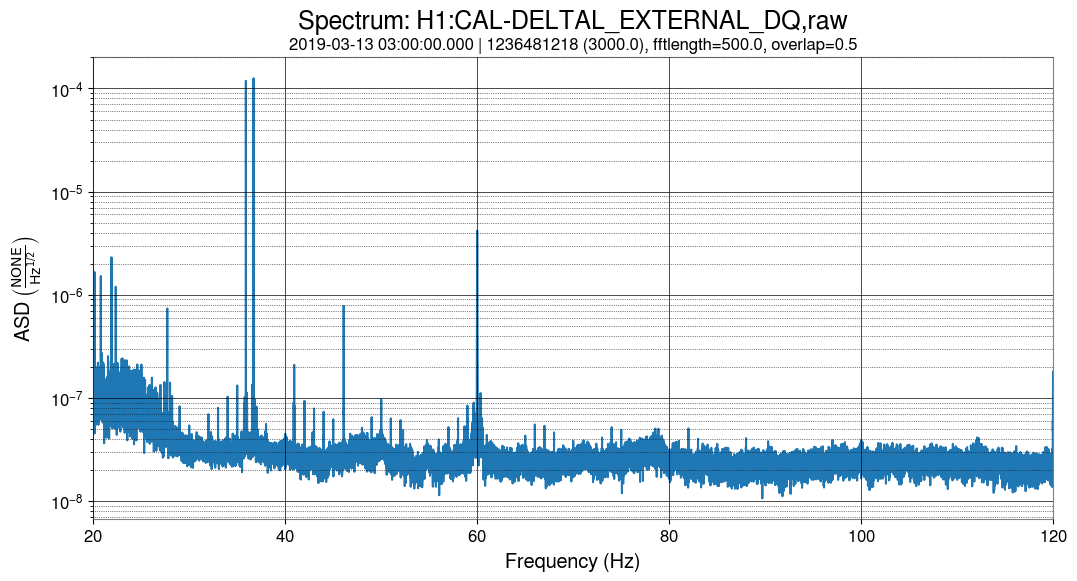
Also, the amplitudes of the lines do not fall entirely monotonically with frequency. There are clusters of lines with a spacing of roughly 7-8 Hz.

Any ideas on what changed, perhaps during the last Tuesday maintenance? 
Images attached to this report
Comments related to this report
ansel.neunzert@LIGO.ORG - 10:19, Tuesday 12 March 2019 (47454)

Additional clue: there are small but noticeable changes in comb strength in a couple magnetometer channels at EX, in the same time frame. I'm not seeing anything similar in EY or CS mags. (The 1-Hz comb is present in many magnetometers; it's the change points that seems to be unique to EX.)

daniel.vander-hyde@LIGO.ORG - 11:59, Tuesday 12 March 2019 (47455)

Hey all, 

This looks similar to what we have seen in the past from the hartmann wavefront sensor cameras. It seems like we solved the issue by changing the camera power supplies.  We can double check this by changing the HWS sync frequency at low noise and provide you with a gps time. 

sheila.dwyer@LIGO.ORG - 12:16, Tuesday 12 March 2019 (47458)

Sheila, Anamaria

The first thing that comes to mind from last Tuesday is a change to the ESD driver grounding at EX (47308), which did reduce some coherence between EX magnetometers and DARM (47323)  At first it looked like this work last tuesday removed a line at 73 Hz from DARM, although looking at the summary page you can see that this line has been coming and going and was at 72.5 Hz yesterday. summary page

andrew.lundgren@LIGO.ORG - 13:07, Tuesday 12 March 2019 (47461)DetChar
It's probably not the HWS because those were always showing up a few tenths of a percent below their sync frequency, so if this comb is within half a mHz it's too accurate.
ansel.neunzert@LIGO.ORG - 13:18, Tuesday 12 March 2019 (47462)

Ok, I'm posting more detail on what I'm seeing in the magnetometers, in case it helps to pin this down. I've checked for any obvious/clear change points, and also compared whether the shape of the comb is similar to what's observed in DARM (same pattern of variation in peak heights). In summary, SEIRACK and SUSRACK magnetometers at EX are particularly notable.

Also, the comb does appear to be precisely on 1 Hz, unlike the HWS comb.


Detailed magnetometer report:

[Corner station]
H1:PEM-CS_MAG_EBAY_LSCRACK_*_DQ: no apparent change; comb shape dissimilar from what is observed in DARM
H1:PEM-CS_MAG_EBAY_SUSRACK_*_DQ: no apparent change; comb shape dissimilar
H1:PEM-CS_MAG_LVEA_VERTEX_*_DQ: comb not really present

[End X]
H1:PEM-EX_MAG_EBAY_SEIRACK_X_DQ: changed (decrease); comb shape similar
H1:PEM-EX_MAG_EBAY_SEIRACK_Y_DQ: no apparent change; comb shape similar
H1:PEM-EX_MAG_EBAY_SEIRACK_Z_DQ: changed (increase); comb shape similar (?)

H1:PEM-EX_MAG_EBAY_SUSRACK_X_DQ: changed (increase); comb shape similar
H1:PEM-EX_MAG_EBAY_SUSRACK_Y_DQ: no apparent change; comb shape similar
H1:PEM-EX_MAG_EBAY_SUSRACK_Z_DQ: changed (decrease); comb shape similar (?)

H1:PEM-EX_MAG_VEA_FLOOR_*_DQ: comb not really present, but neither is anything else. These channels look way too clean; there might be an issue.

[End Y]
H1:PEM-EY_MAG_EBAY_SEIRACK_*_DQ: no apparent change; comb shape similar
H1:PEM-EY_MAG_EBAY_SUSRACK_*_DQ: no apparent change; comb shape similar
H1:PEM-EY_MAG_VEA_FLOOR_*_DQ: no apparent change; comb shape similar (?)

anamaria.effler@LIGO.ORG - 16:38, Tuesday 12 March 2019 (47473)

Robert, Anamaria

Even with just 0.01 Hz resolution, there is large coherence between various magnetometers in the EBAYs and DARM. Indeed this was not the case before last Tuesday.

Separately, the 72.5 Hz that appeared in the last two days is coherent with the corner EBAY magnetometer in the ISC rack. We think it's a real peak because if the sensor were picking up DARM the large calibration lines at 35ish Hz would show better coherence. Though it does not appear to be there this morning, so not completely clear what's going on.

Images attached to this comment
daniel.brown@LIGO.ORG - 17:00, Tuesday 12 March 2019 (47475)

Danny and I had a 72.33 Hz line driving some frequency noise over the weekend during some TCS tests. We also had lines at 3.25kHz, 4.5kHz and a bunch around 23-25Hz.

daniel.vander-hyde@LIGO.ORG - 23:47, Tuesday 12 March 2019 (47489)DetChar

Shifted ETMX HWS sync frequency from 1 Hz to 5 Hz starting at 1236485181 and shifting it back to 1 Hz at 1236494796.

daniel.sigg@LIGO.ORG - 15:41, Wednesday 13 March 2019 (47504)

What about the GPS clocks that got turned on last Tuesday?

keith.riles@LIGO.ORG - 17:55, Wednesday 13 March 2019 (47507)DetChar
I had trouble finding a lot of clean DARM data during the period when the HWS frequency was changed, but what I found suggested the 1-Hz was still strong. Figure 1 is from when the HWS frequency was normal. Figure is from when it was changed.

Images attached to this comment
pep.covas@LIGO.ORG - 11:32, Tuesday 26 March 2019 (47884)

The 1 Hz comb is still present in data from the third week of ER14, see first attached plot. There is also a very bad 0.8 Hz comb visible between 420 and 500 Hz, see second plot.

Images attached to this comment
ansel.neunzert@LIGO.ORG - 13:25, Wednesday 27 March 2019 (47932)

The 0.8 Hz comb Pep noted is a complicated structure, but it has some symmetrical features which are centered on the 516.78 Hz line. Keith tells me this is an EX violin mode (alog 47650, alog 47179).  A plot showing data from March 25 is attached.

Images attached to this comment
pep.covas@LIGO.ORG - 10:03, Friday 29 March 2019 (48032)

It seems that the work reported in https://alog.ligo-wa.caltech.edu/aLOG/index.php?callRep=47766 has made the 1 Hz comb disappear.

The first attached plot shows the spectra before this change, and the second one the spectra after this change.

On the other side, the lines and 0.8 Hz comb around the ~500 Hz violin modes are still there.

Images attached to this comment
H1 CAL
jeffrey.kissel@LIGO.ORG - posted 10:20, Wednesday 06 March 2019 - last comment - 15:06, Wednesday 27 March 2019(47331)
Status of Systematic Error in ETMX Actuation Model
J. Kissel (with help from L. Sun, E. Goetz, L. McCuller, E. Bonillla, R. Kumar)

I've been processing the actuation function data from 2019-03-01 (see LHO aLOG 47206), and have some updates. Not were I want it, but since the heat is on I'll give a status update.

Recall from LHO aLOG 46806,
Steps to success:
    (i) Find out why ETMX L1 and L2 doesn't work, and fix it, such that we can go forward with full ETMX DARM actuation. 
        DONE (see fixes to UIM and PUM crossovers in LHO aLOGs  47164 and 46861)
    (ii) Measure the PUM and UIM coil drivers, and update the compensation. 
        DONE (see LHO aLOG 47167)
    (iii) Truly identify ETMX all 8 violin mode fundamentals and their harmonics to update the PUM dynamical model (needs IFO time), finish fitting the UIM transfer function data to update the UIM dynamical model (needs Kissel time)
    (iv) Remeasure all stages of ETMX with the full IFO 
        DONE (see LHO aLOG 47206)
    (v) Update the front-end calibration (including reference model parameters at calibration line frequencies such that time-dependent correction factors are accurate), and 
    (vi) confirm success with the full IFO (needs IFO time).

So, I'm currently working on (iii) [with the help of Edgard, Rahul, Borja (#TeamSUS) along with Lee and Lilli #TheFittingCrew] and this aLOG is reporting the progress on fitting the results from the 2019-03-01 measurements, i.e. (iv) [working with Evan #TeamPyDARM].

Check out the attached .pdfs from each stage below, which are the output of the following script, 
    /ligo/svncommon/CalSVN/aligocalibration/trunk/Runs/O3/H1/Scripts/FullIFOActuationTFs/process_actuationmeas_20190301.py
after creating a new pyDARM model parameter file,
    ^/trunk/Runs/O3/H1/params/modelparams_H1_20190301.py

TST: MCMC Results 
    Force per count of longitudinal DAC request (just down stream of DRIVEALIGN bank):
    Gain = 4.734e-12 (N/ct)
    Force per actuator signal (current or voltage):
    Gain = 4.433e-11 (N/V**2)

    Actuator gain, H_c (N/ct)              | 4.734e-12 (+2.09e-15,-2.102e-15) or (+0.04415%,-0.0444%)
    Residual time delay, tau_A (usec)      | 10.79 (+0.7573,-0.76) or (+7.02%,-7.045%)


Comments: Except for the sign flaw in the "intermediate results" plot, I'm very happy with the state of the systematic error, I believe the MCMC fit, and I think we're ready push to front-end.

PUM: MCMC Results 
    Force per count of longitudinal DAC request (just down stream of DRIVEALIGN bank):
    Gain = 6.223e-10 (N/ct)
    Force per actuator signal (current or voltage):
    Gain = 0.03038 (N/A)

    Actuator gain, H_c (N/ct)              | 6.223e-10 (+3.339e-13,-3.33e-13) or (+0.05367%,-0.05352%)
    Residual time delay, tau_A (usec)      | 4.096 (+1.568,-1.571) or (+38.28%,-38.34%)


Comments: There's still something very fishy going on below 20Hz. I don't understand it, and this is under investigation by Evan and I.

UIM: MCMC Results 
    Force per count of longitudinal DAC request (just down stream of DRIVEALIGN bank):
    Gain = 7.498e-08 (N/ct)
    Force per actuator signal (current or voltage):
    Gain = 1.597 (N/A)

    Actuator gain, H_c (N/ct)                   | 7.498e-08 (+2.842e-11,-2.869e-11) or (+0.03791%,-0.03826%)
    Residual time delay, tau_A (usec)      | 57.81 (+1.218,-1.215) or (+2.107%,-2.101%)

Comments: the low frequency data (below 10Hz) is pretty un-informative, and this is where the UIM matters -- BUT I'm not sure we've ever got any better. I'm dividing out the high frequency dynamics of the OSEM bracketry and UIM to PUM violin modes based on old H1 ETMY data for now CSWG aLOG 11212, and that has significantly flattened out the systematic error, so we can now use all the data from 10 to 100 Hz for the fit of the actuation coefficient instead of what we did in O2 which was only use 3-5 points between 10 and 20 Hz. I'm working with Lee to get an updated fit on data that I took on 2019-01-25.

Finally, I show one of the plots from the latest output of 
    https://svn.ligo.caltech.edu/svn/aligocalibration/trunk/Common/pyDARM/darm_loop_critique.py
which, unlike the scripts from above is a function, which I called using the following command line,
    python3.6 darm_loop_critique.py --run=O3 --IFO=H1 --DARMmodelfile=modelparams_H1_20190301 --modelFunction=modelPars --outputfile=2019-03-01_critique

This shows the relative contribution of each stage. to the overall actuator to give you a feel for what matters where (now that things have been updated to reflect Sheila's latest work with the PUM crossover).

Comments: 
    - Only the phase is shown, so take the plot with a grain of salt. 
    - In the calibration band (a bit larger than the detection band, between 5 and 5000 Hz), excitingly, the UIM is now *very* unimportant to get perfect. However, I'm interested to see how this plot shapes up once we've fixed the dynamical model (which is currently all this plot has to go on)
    - It is far more important to get both the PUM and the TST stage right.
    - We'll need to resolve this reported frequency-dependent systematic error in the PUM, since it's right in the phase/magnitude mixing region ("the crossover" implies the hand-off between stages only happens precisely at a single frequency. No bueno.)

So -- I continue my work on the PUM as priority.

We also need to retake a sensing function sweep suite, so I can compare the results against and open loop gain model.
Non-image files attached to this report
Comments related to this report
craig.cahillane@LIGO.ORG - 01:39, Thursday 07 March 2019 (47354)
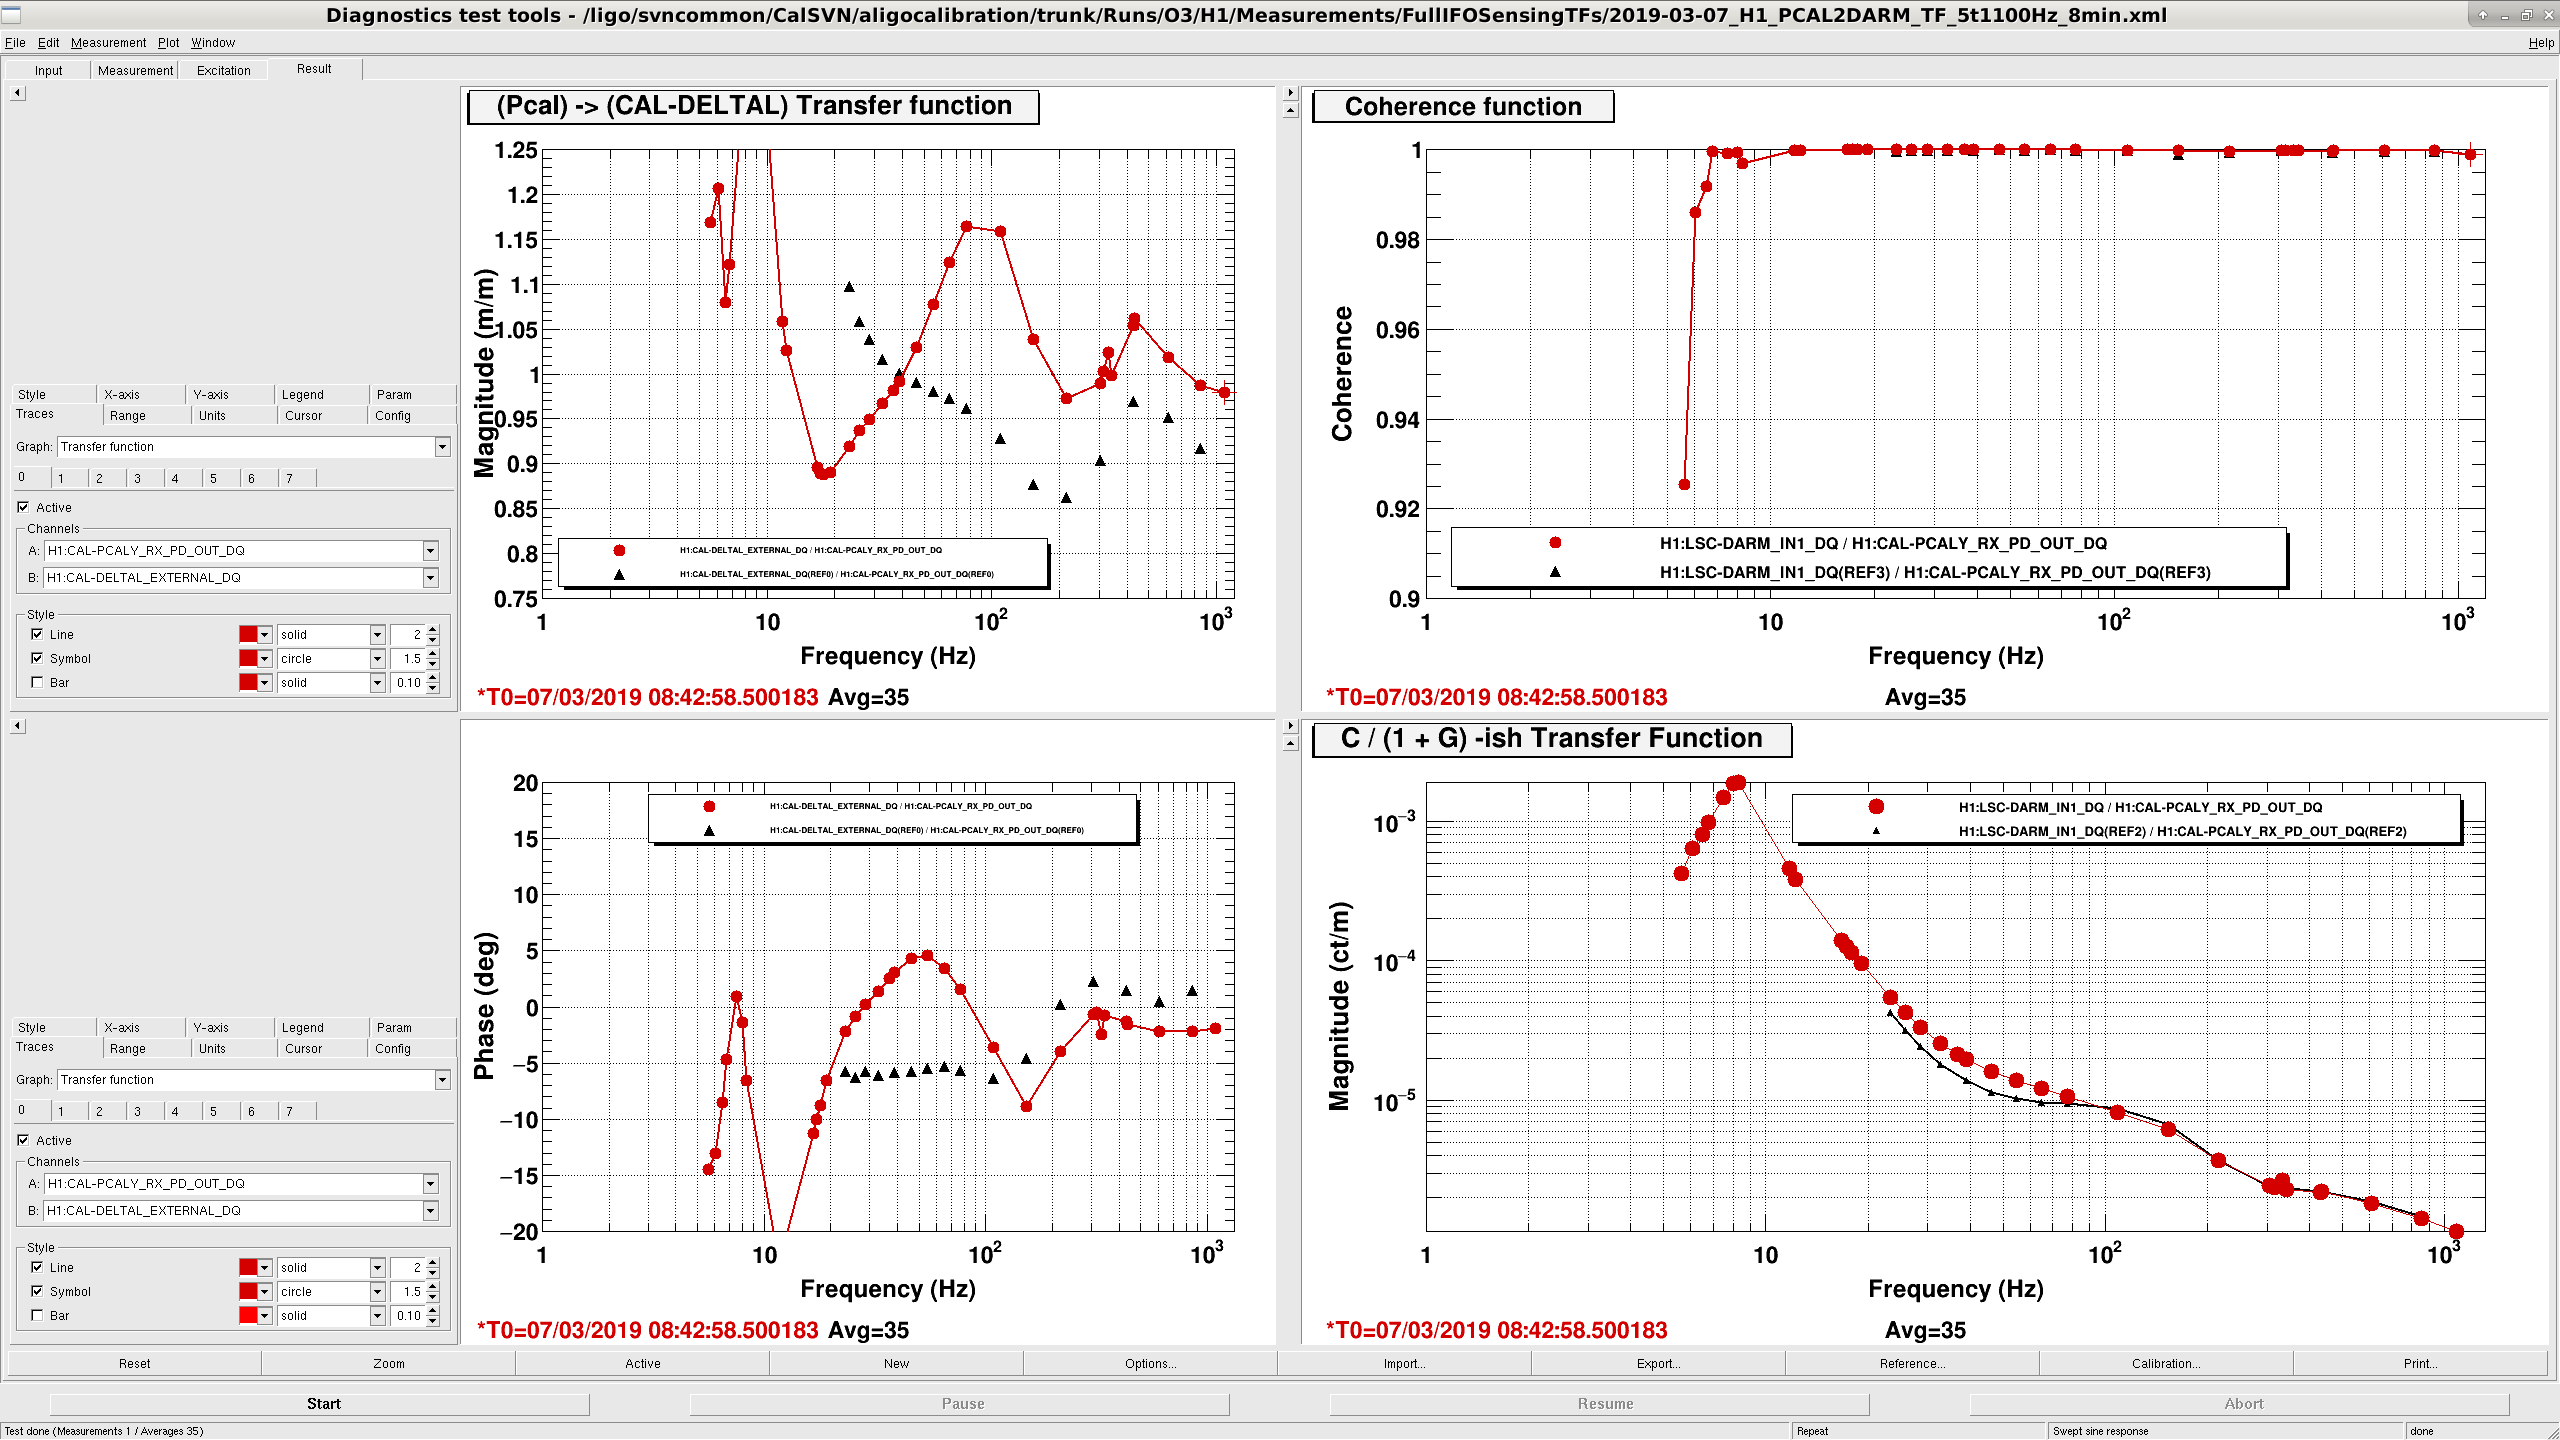
I took a PCAL to DARM measurement, and a DARM OLG, they are in /ligo/svncommon/CalSVN/aligocalibration/trunk/Runs/O3/H1/Measurements/FullIFOSensingTFs/2019-03-07*.xml
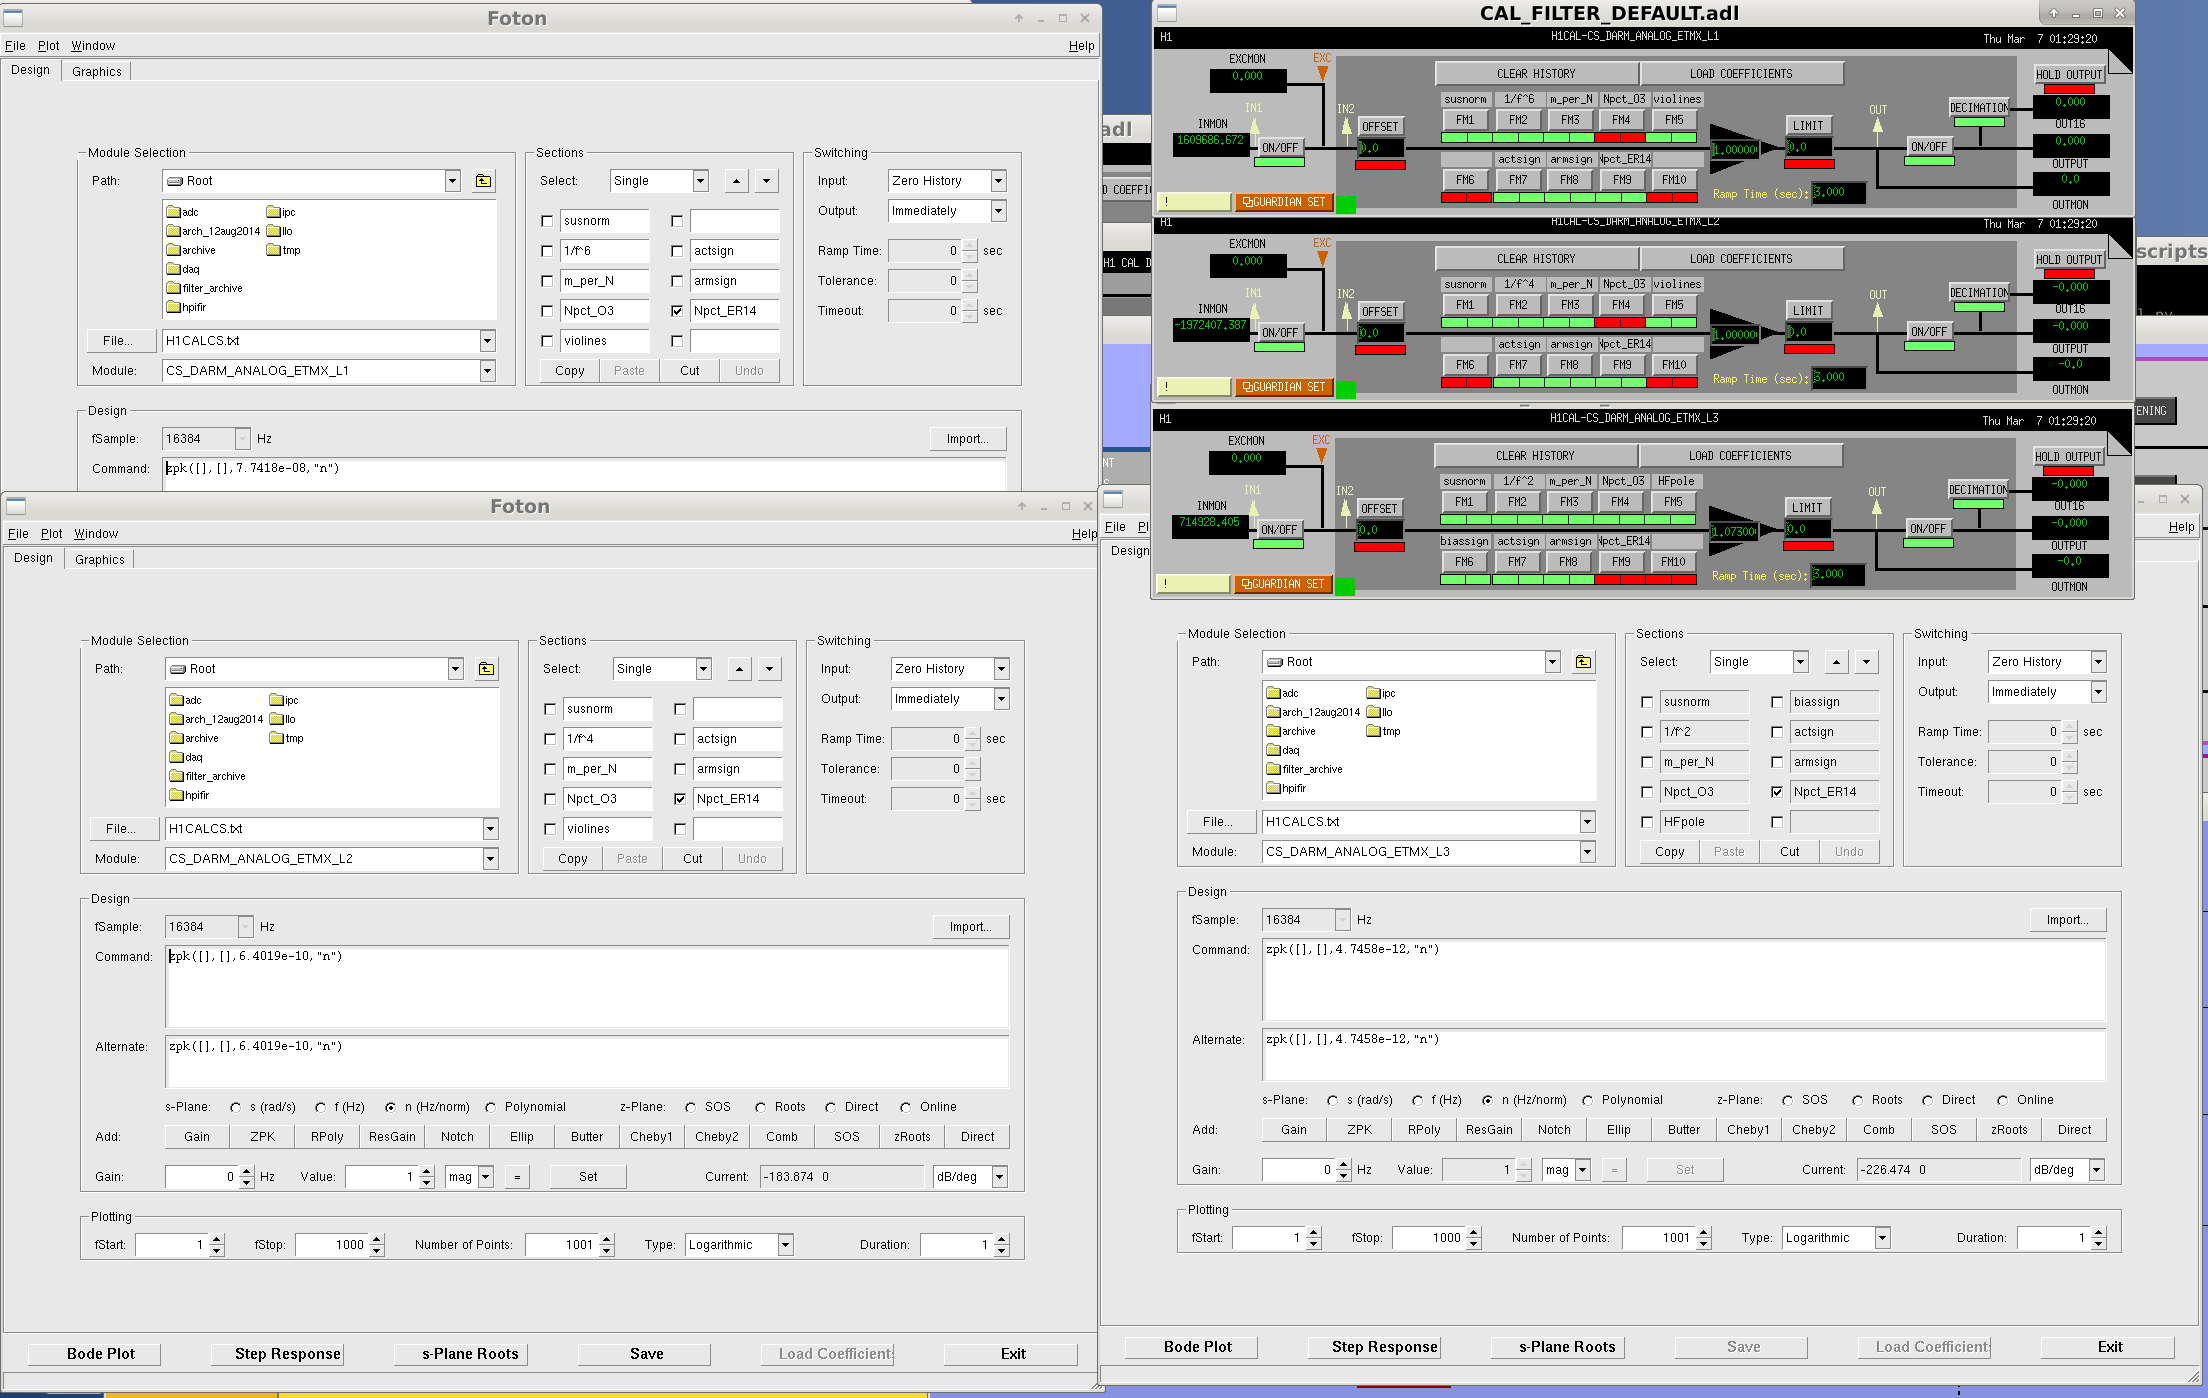
The PCAL to DARM was pretty bad, so I updated the Npct_ER14 front-end calibration filters according to the numbers above.  I also switched off Npct_O3 and switched on Npct_ER14 for ETMX L3, and adjusted L3's FM calib actuator gain from 1.073 to 1.0.  Will retake PCAL to DARM if I get a chance tonight.
Images attached to this comment
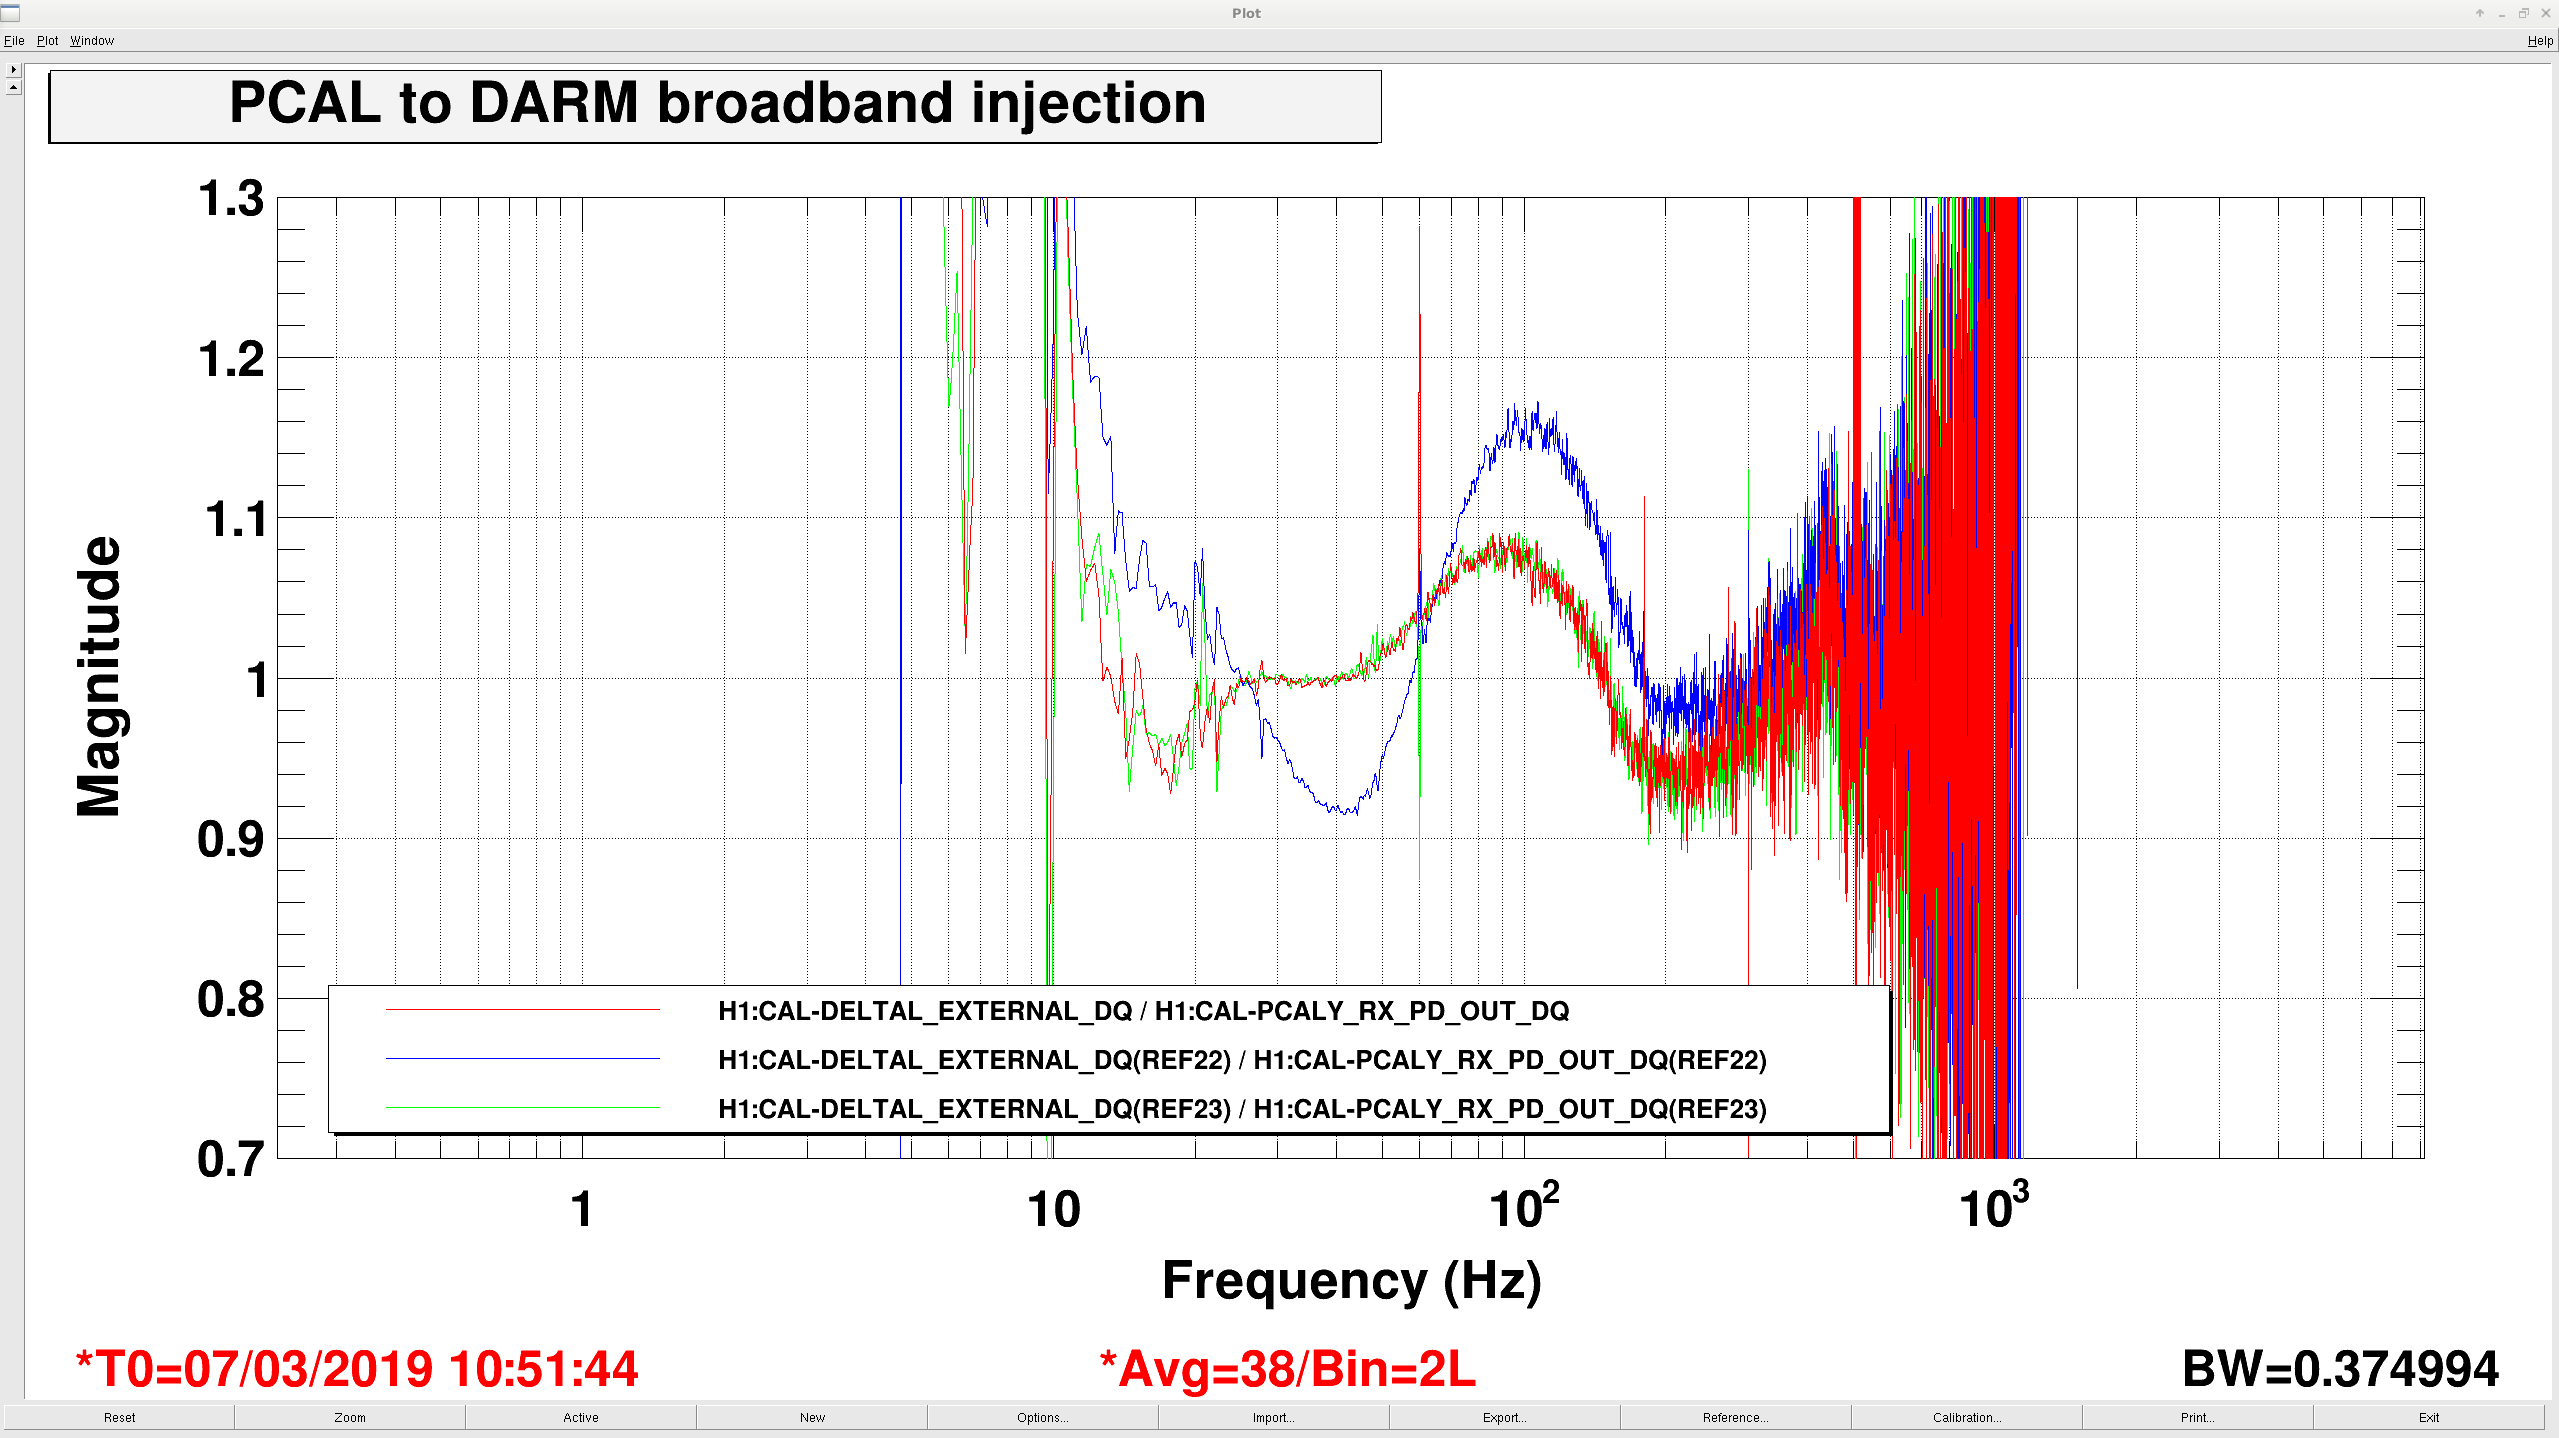
craig.cahillane@LIGO.ORG - 03:10, Thursday 07 March 2019 (47355)
I ran another PCAL to DARM broadband injection while adjusting the gains.  I believe there is some phase mismatch which makes a perfect front end calibration not possible at the moment: no matter how I adjust the gains, there is always a hump around 100 Hz, right around the crossover between the L3 and error signal authority.
I did the best I could, we are good to 10% everywhere now.  Range went from ~87 to ~95 Mpc.
Images attached to this comment
sheila.dwyer@LIGO.ORG - 00:01, Wednesday 13 March 2019 (47490)

Comparing the third plot above (called actuator authority) to the attachments to 47164, it seems like there must be a sign error in one of the stages which is creating the notch just below 2 Hz in the total.  It would be easier to debug these sign flips if we also could see the phase.  

jeffrey.kissel@LIGO.ORG - 09:05, Wednesday 13 March 2019 (47497)ISC
@Sheila -- You're correct -- the model file used to generate the plot you mention (via darm_loop_critiue) had a reference to the wrong H1SUSETMX filter file (it wasn't as simple as a sign flip, but a previous filter file [before the PUM design was fixed] called with the same filter *banks* meant a report of a cross-over instability). 

I've corrected this since (apologies for not posting until now), but the new version is attached below, including the phase.
Non-image files attached to this comment
sheila.dwyer@LIGO.ORG - 19:52, Wednesday 13 March 2019 (47511)

Keita, Craig, Sheila

Thanks Jeff for the updated plot.  We are using the model used (and compared to cross over measurements) in 47164 to try to reproduce your plot. 

We've tried to reproduce the plot you have above, but the only way we can do this is by removing the cascading of filters.  To say the same thing a different way, when you say LOCK IN to displacement, I think that you mean L3 lock in to displacement, which for L1 would mean L3 LOCK L * L2 LOCK L *L1 LOCK L * L1 drivealing *L1 electronics * L1 mechanical stuff.  The only way we can recreate your plot is to leave out L1 LOCK and L2 Lock from the L1 actuator.  However, if we leave these out the toal line in your plot is misleading/wrong.

In the first attachment (not cascading filters) is our reproduction of Jeff's plot above, where we have removed the L3 lock and L2 lock filters from L1.  The second one includes the cascaded filters, which is more correct if you want to add these up to make a total.  

Non-image files attached to this comment
ling.sun@LIGO.ORG - 15:06, Wednesday 27 March 2019 (47926)

I've processed the measurements taken from 1) Drivealign bank and 2) Test bank (measurement data in aligocalibration/trunk/Runs/O3/H1/Measurements/FullIFOActuationTFs; March 26)

The resulting plots are attached. The fitting through the test bank is better. This is a quick comment. The details need to be further investigated and discussed.

The residual comparison plot is made following the steps below:

1) Create two separate reference models for drivealign and test scenarios, based on the Mar 16 model, by writing back the MCMC PUM MAP values.

2) Compute the error residuals for two scenarios separately.

3) Plot Response_drivealign_with_error/Response_drivealign_ref, and Response_test_with_error/Response_test_ref.

Non-image files attached to this comment
Displaying reports 42601-42620 of 88682.Go to page Start 2127 2128 2129 2130 2131 2132 2133 2134 2135 End