NikoL, RickS
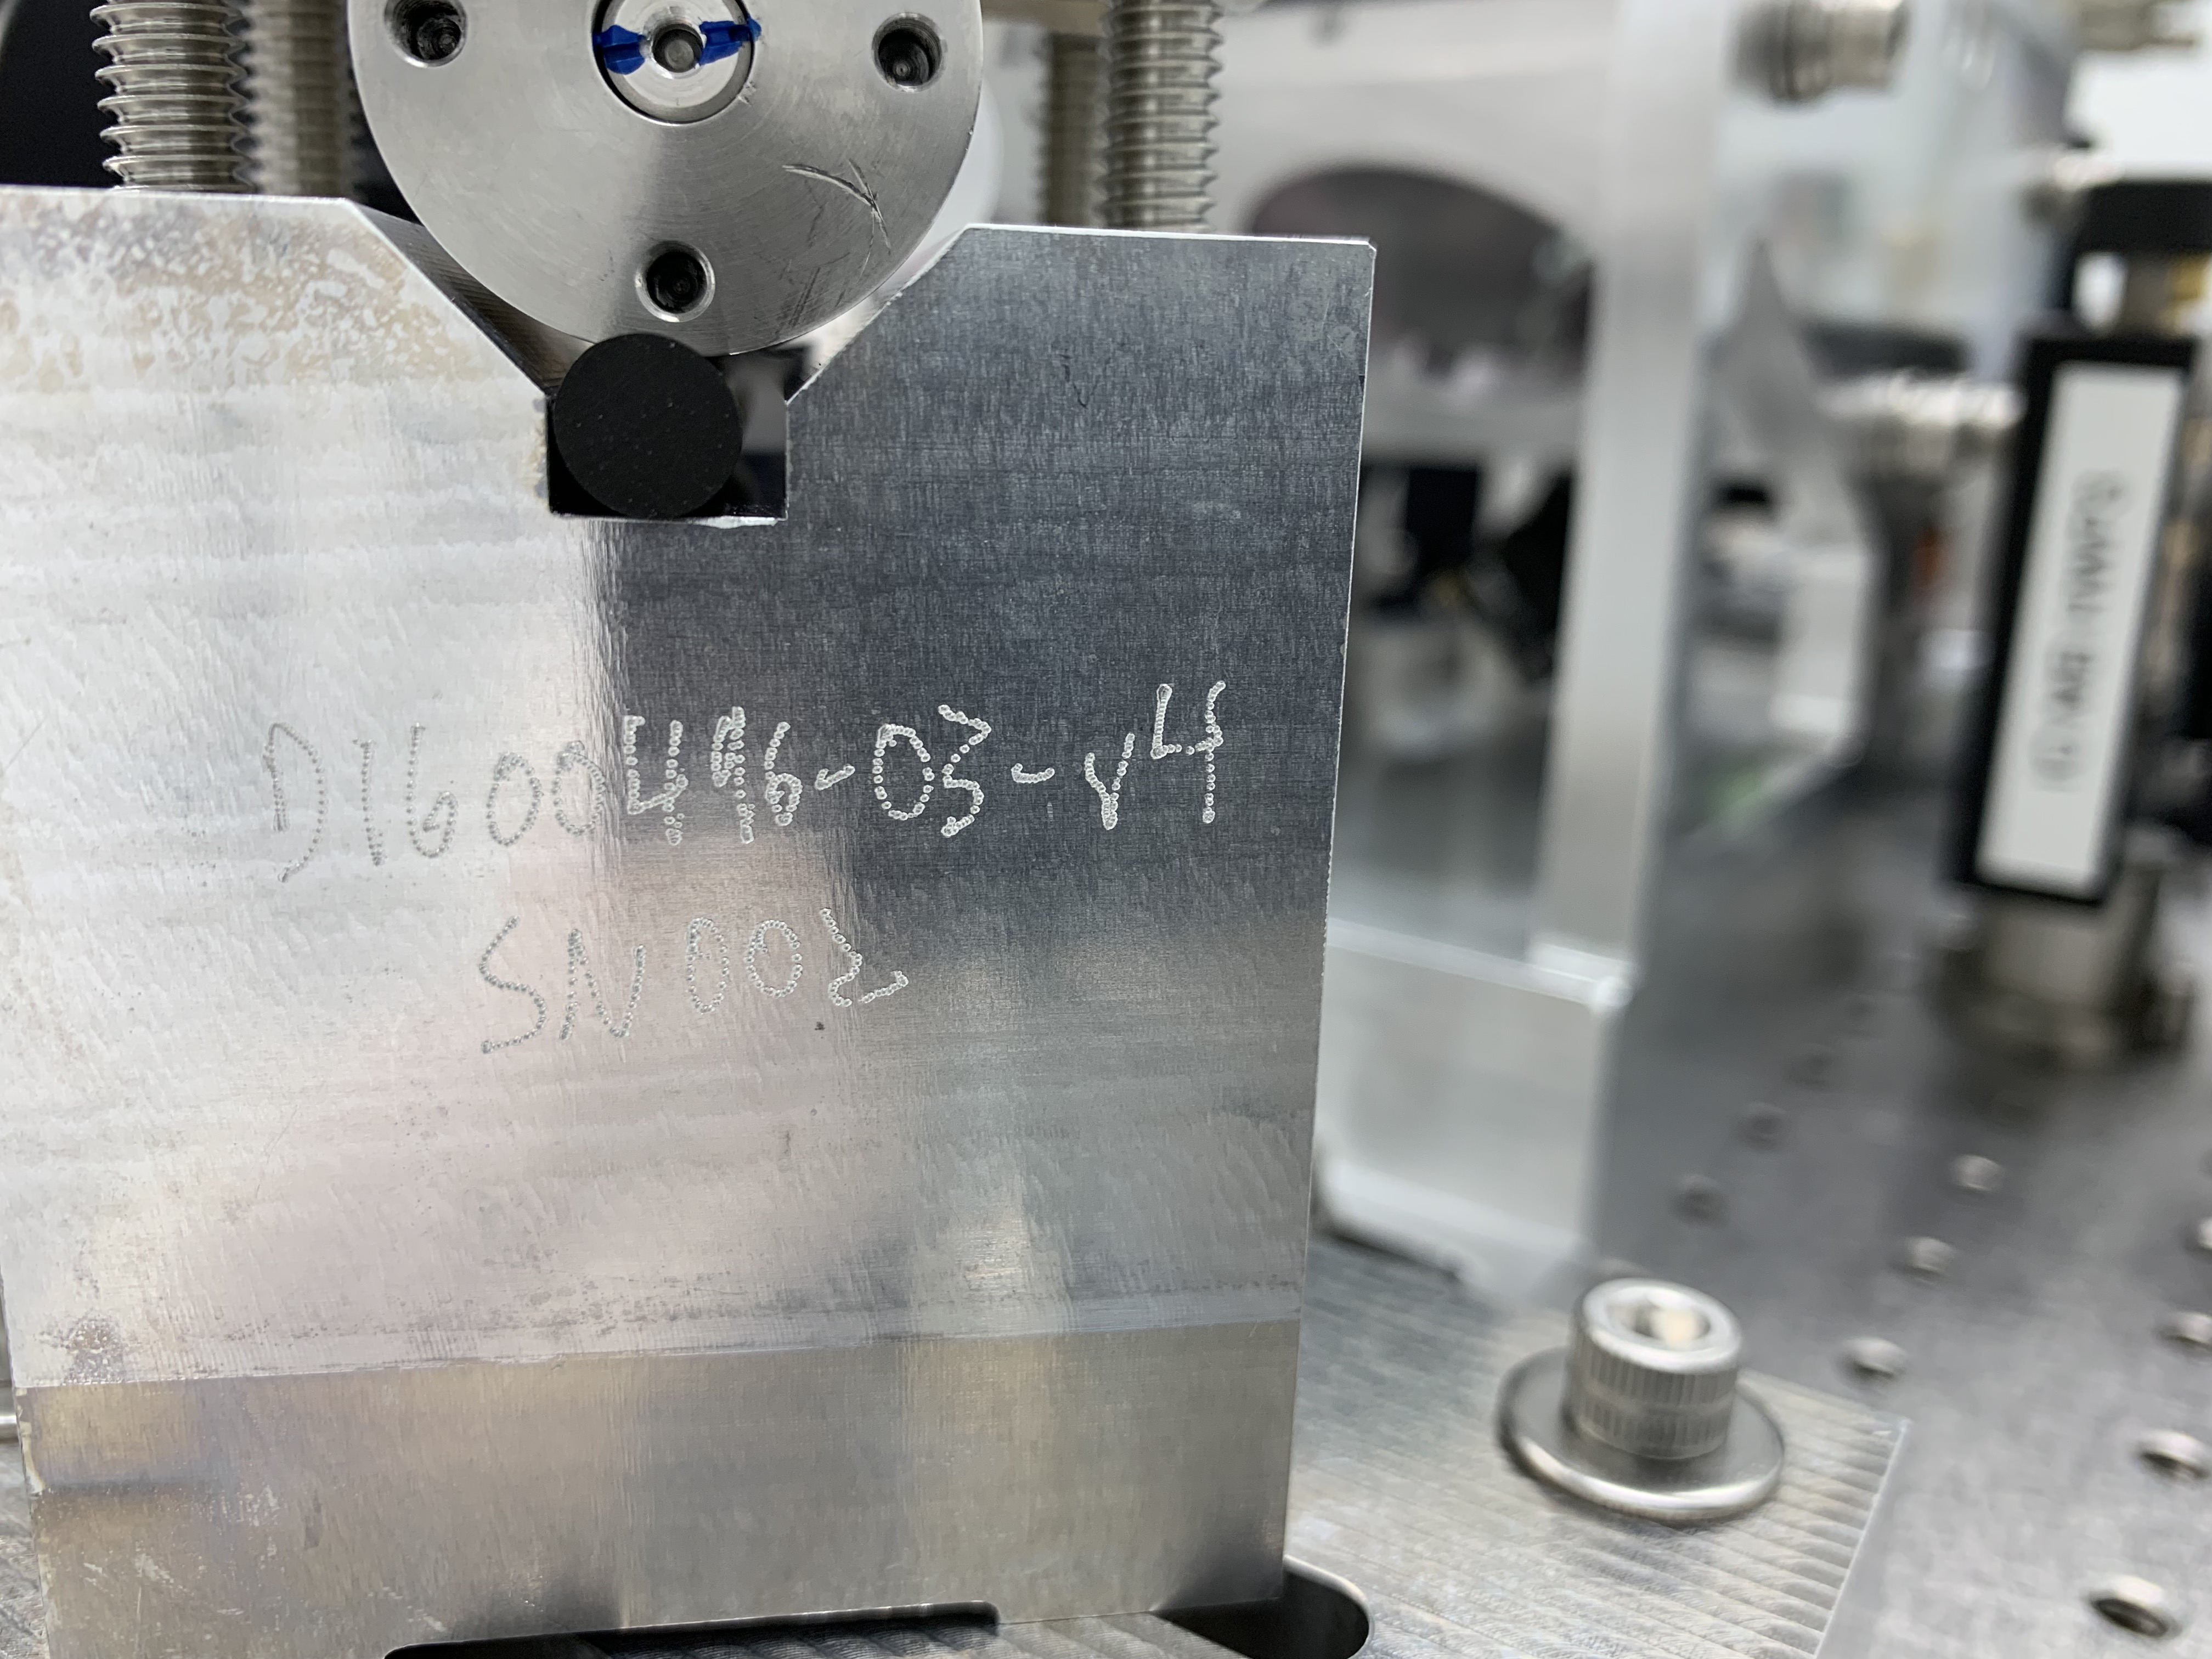
Following up on the work we did at Yend last week (see this Link), Niko inspected the beam positions at the input aperture of the Rx sensor at Yend yesterday after completing calibration measurements at Xend.
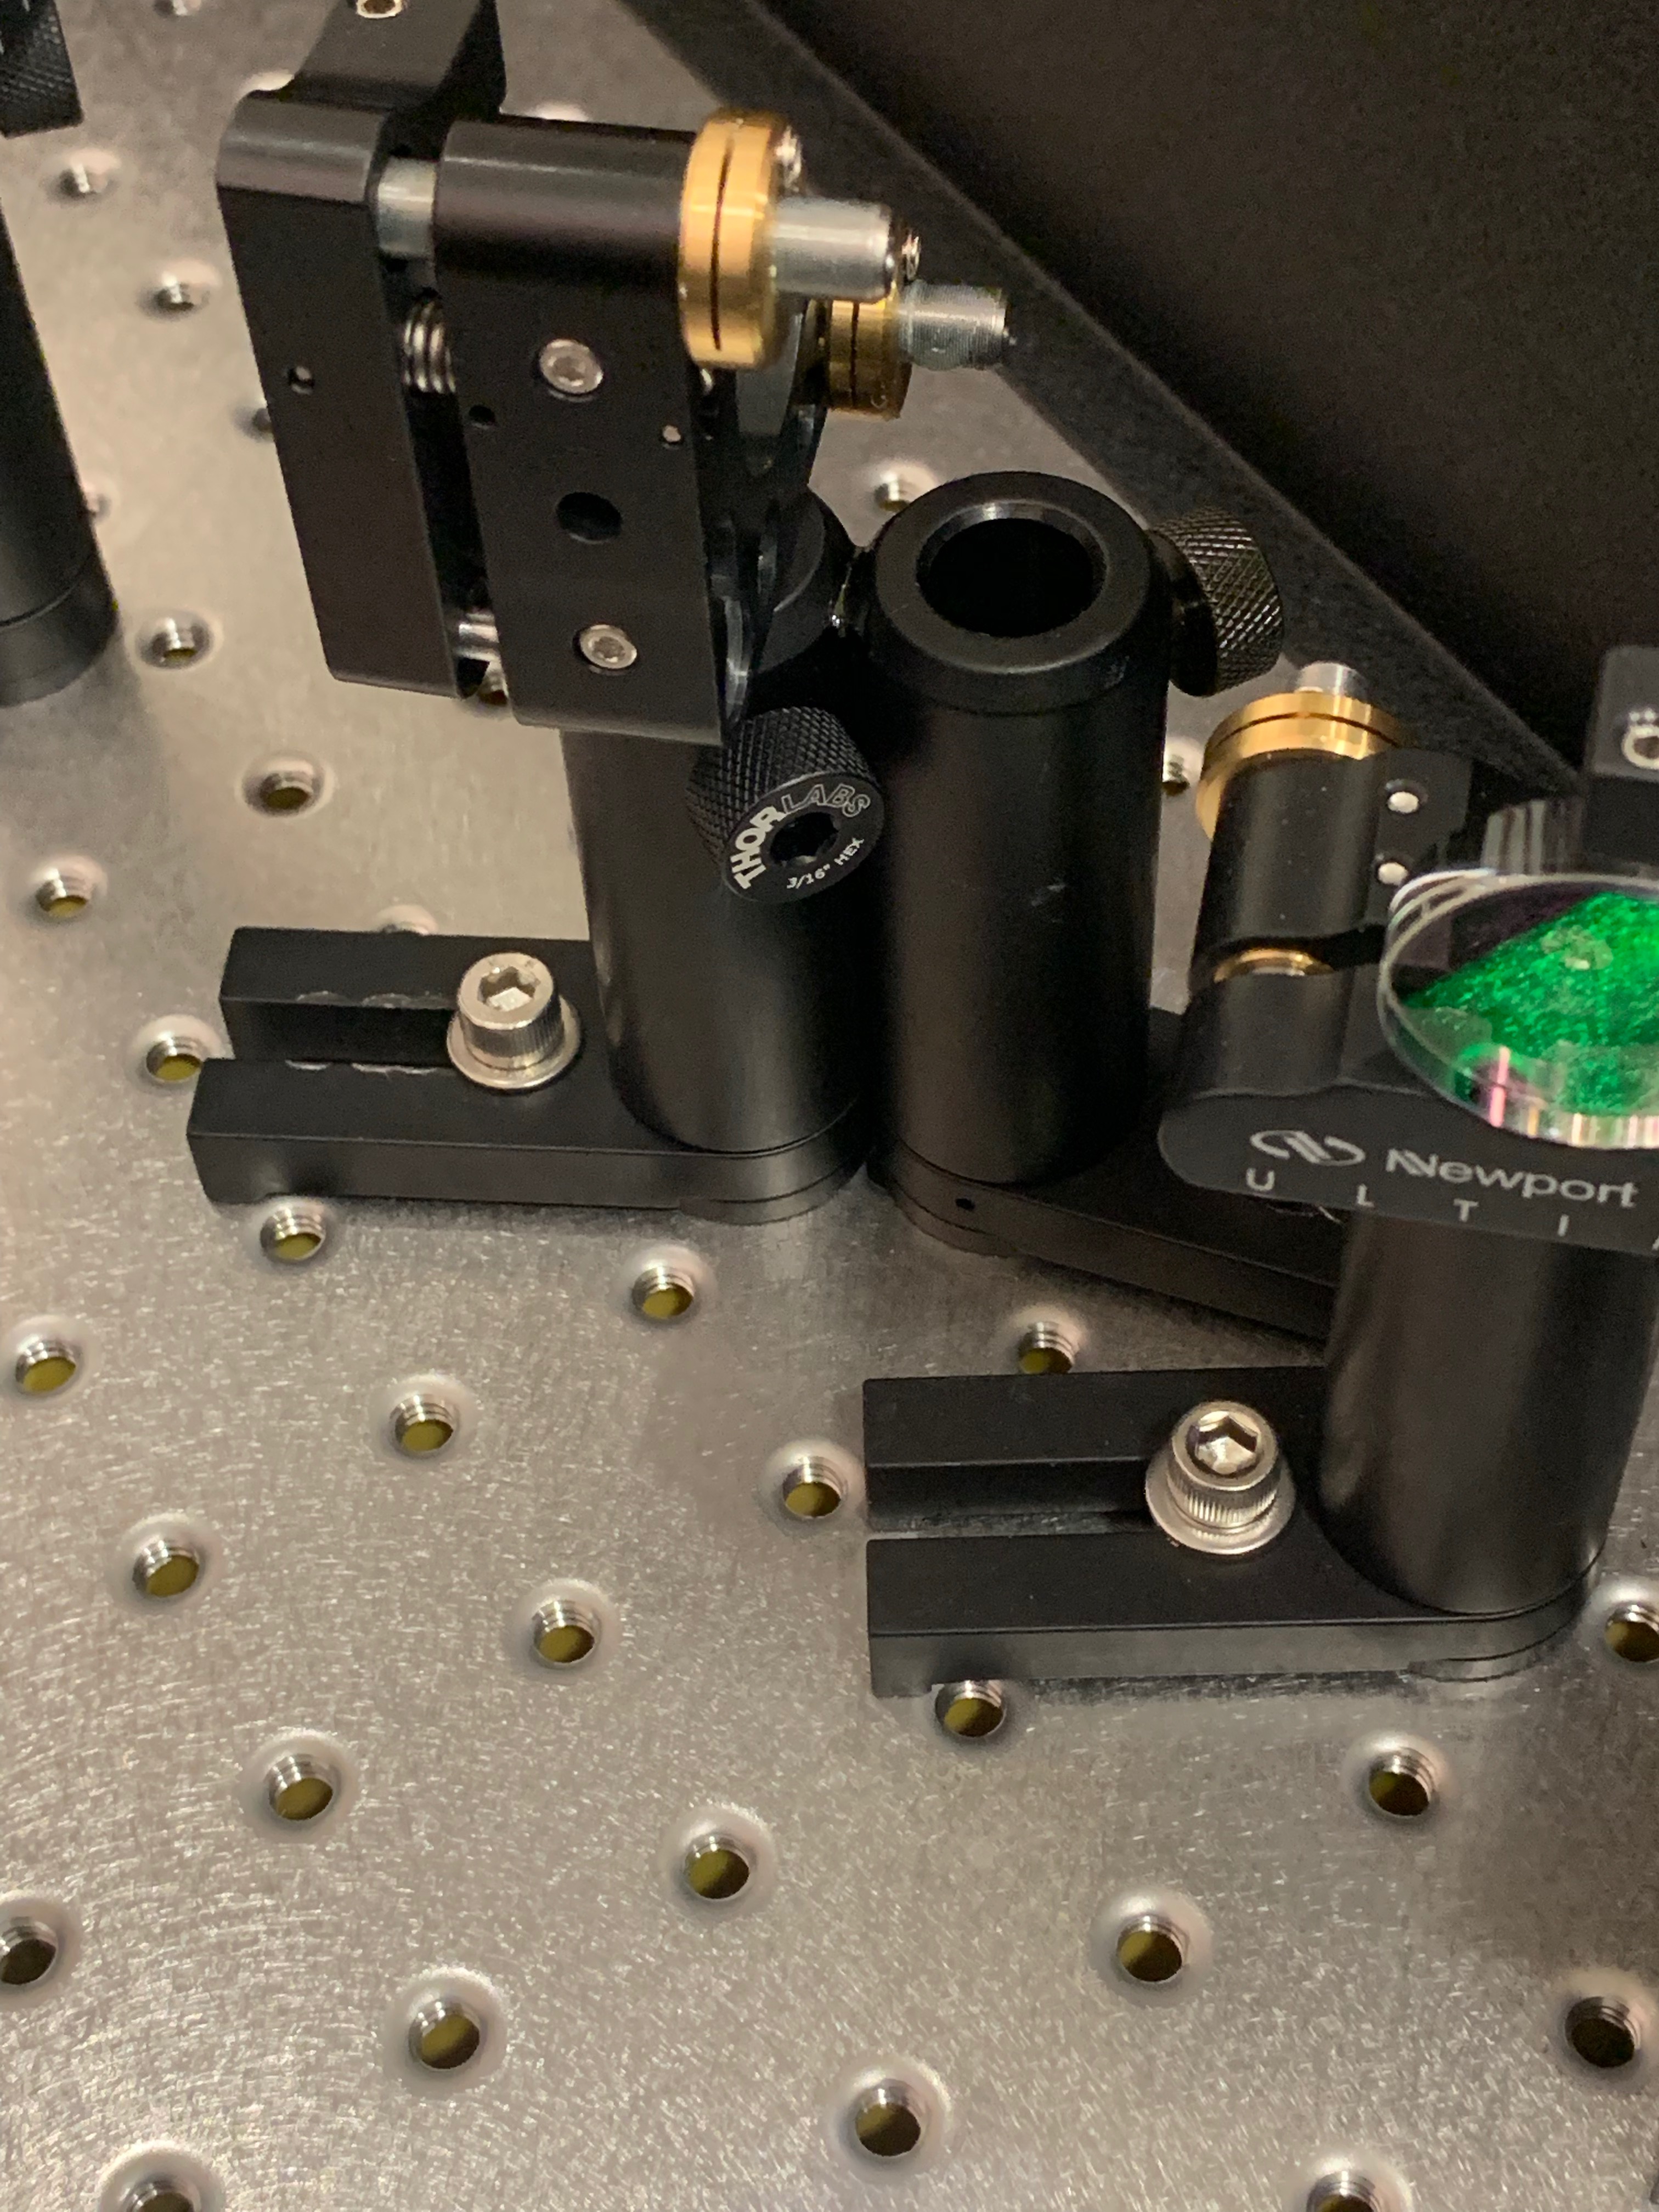
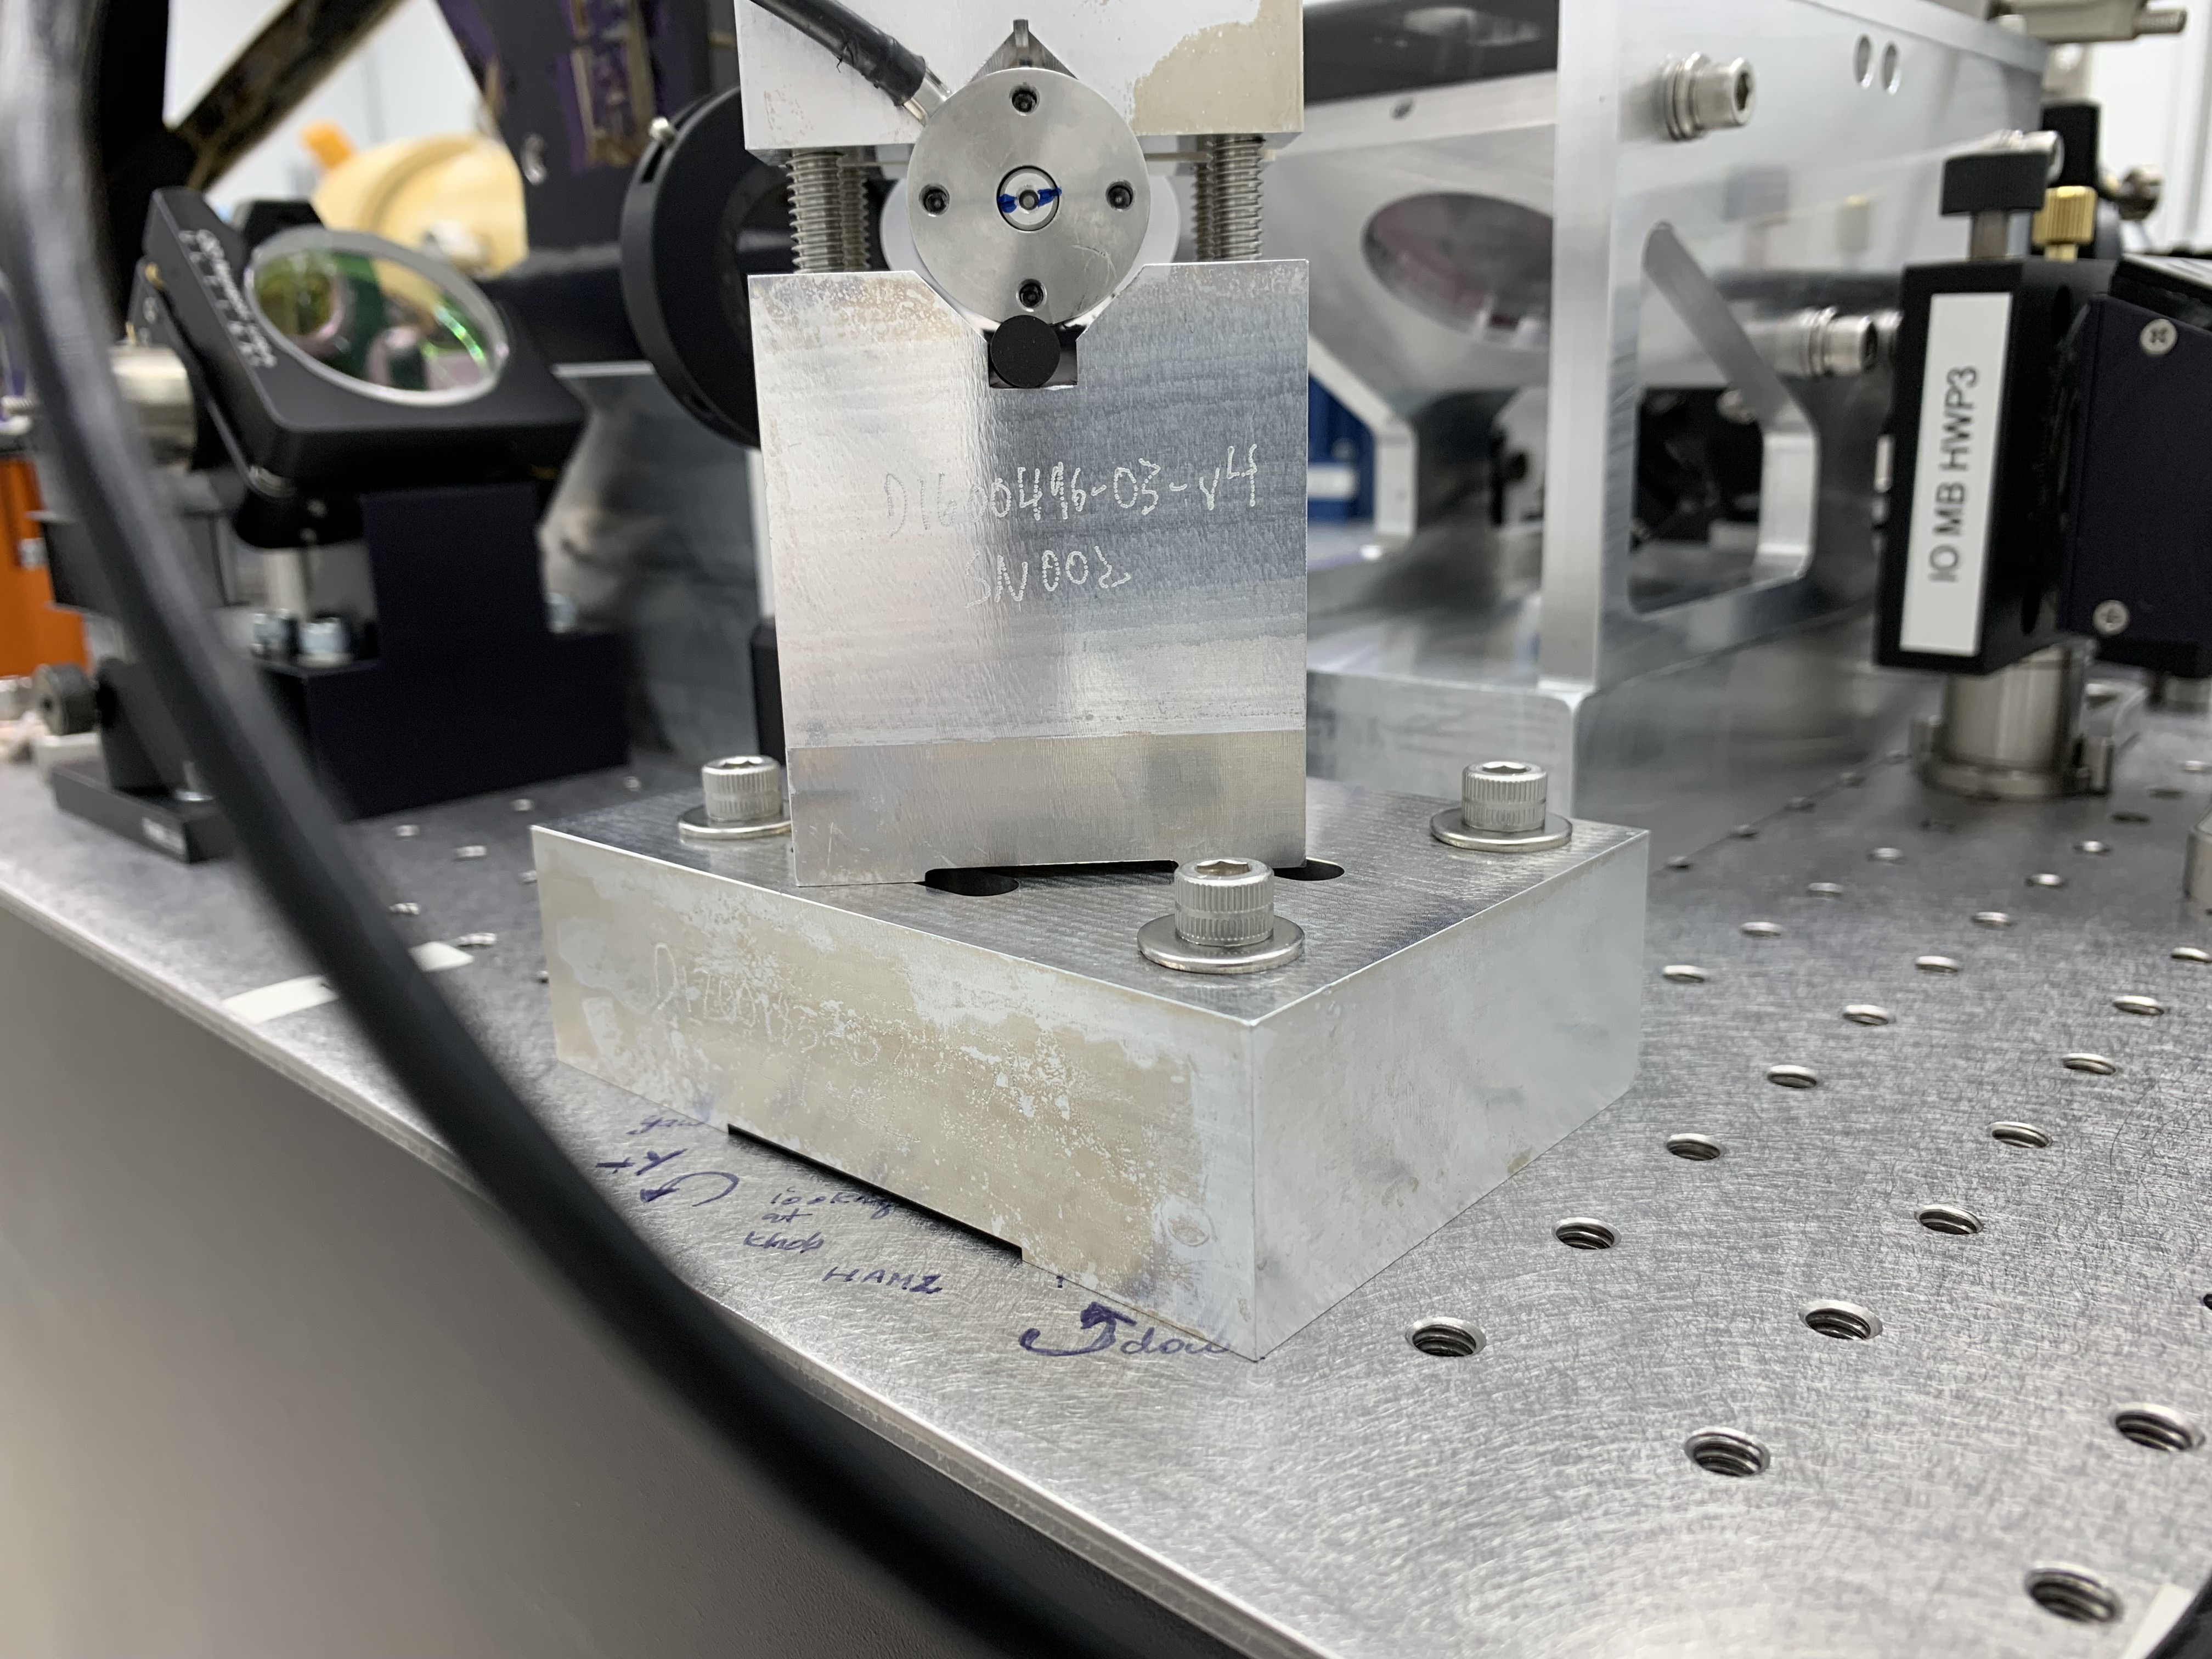
He found that the Outer (lower) beam had again drifted to the right (see attached photo), this time by a few millimeters. This likely did NOT impact the calibration because it did not appear to be clipping at the Rx sensor aperture.
Given that it was near the end of the Tuesday maintenance period, we did not have much time to improvise a potential fix. But we end up trying a kind of "flying buttress" approach. We used a second ThorLabs base and some 5-minute epoxy we found in the toolbox (it was WAY beyond its expiration date of 1/21/2013, but it was unopened, so we gave iit a try) - see second attached photo. If this epoxy actually hardens, it should help stabilize the post holder. If this is the source of the alignment drifts, this may help.
We also tightened the set screw that holds the 1" diameter beamsplitter in place in the Newport U100 mount. Slight tightening of the set screw resulted in the beam at the Rx module moving by more than the 1" diameter of the power sensor aperture. This might indicate that the optic was not seated properly to begin with. Maybe this is the real source of the alignment woes at Yend. We did not want to risk removing and re-seating it yesterday, but may try that in the future if this problem persists.
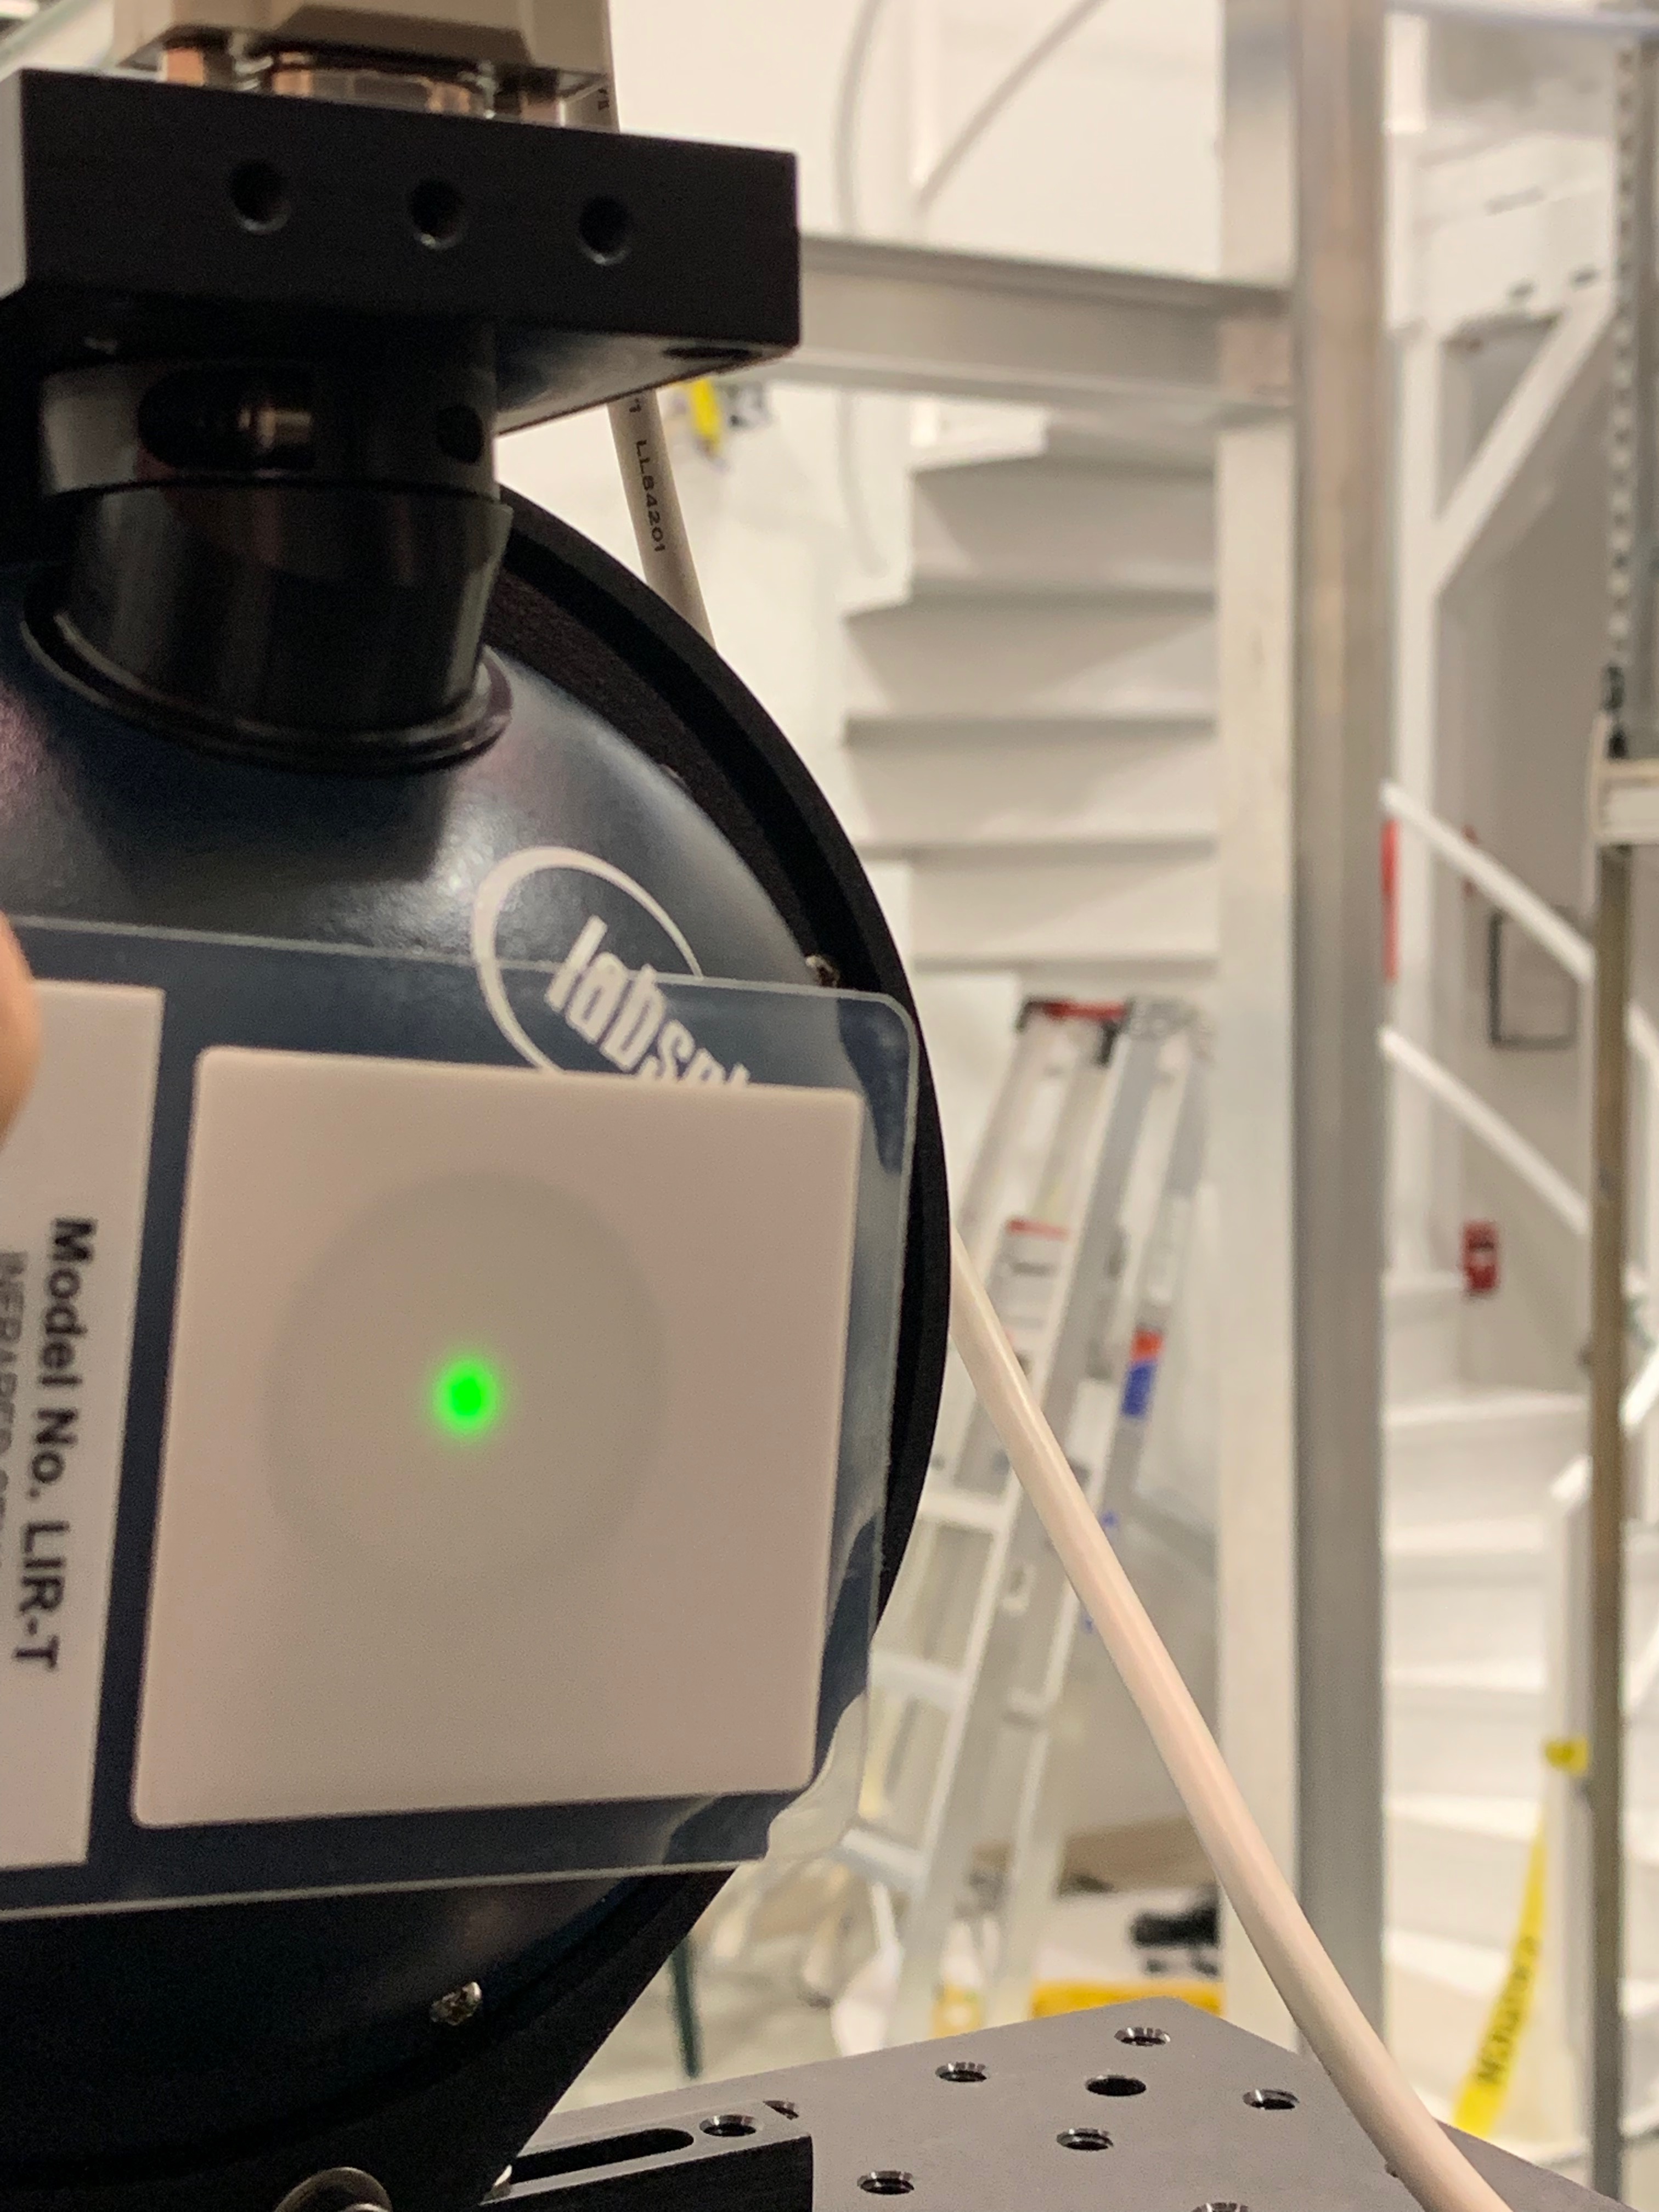
We carefully aligned both beams to the center of the Rx power sensor aperture before leaving the end station (see last attached photo).
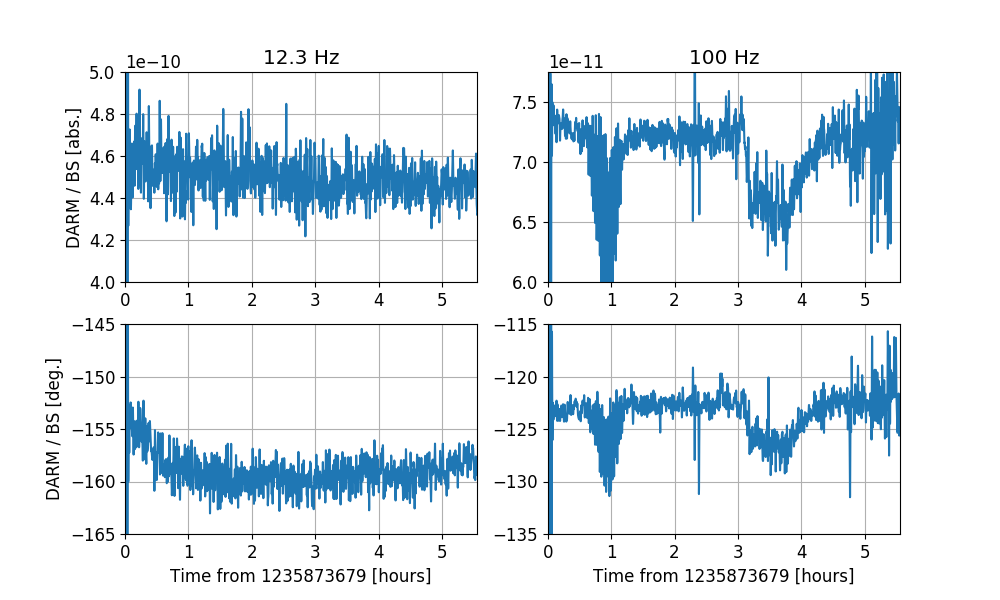
To follow up with the measurements described in 47289, Craig added two MICH length lines, at 12.3 and 100.0 Hz. They were both on for the entire duration of a long lock stretch yesterday night. By demodulating both lines in H1:SUS-BS_M3_ISCINF_L_IN1_DQ and H1:LSC-DARM_IN1_DQ we can track the evolution of the MICH to DARM coupling over time. The reason to have two lines is that looking at the transfer functions plotted in 47289, one can see that the high and low frequency components change in a different way.
The plot attached shows the DARM / MICH transfer function at the two lines, as a function of time, in hours from 1235873679. The coupling changes over time both at 12.3 and 100.0 Hz.
At 12.3 Hz there is a monotonic change from 4.6e-10 to 4.5e-10, with a phase rotation of about 5 degrees. This trend settles after a hour or so.
At 100.0 Hz the evolution is more complex. There seems to be an initial trend similar to the 12.3 Hz trend (except that the phase seems to be increasing), but then there are large fluctuations in both amplitude and phase. It would be interesting to understand what was happening to the IFO during those excursions.
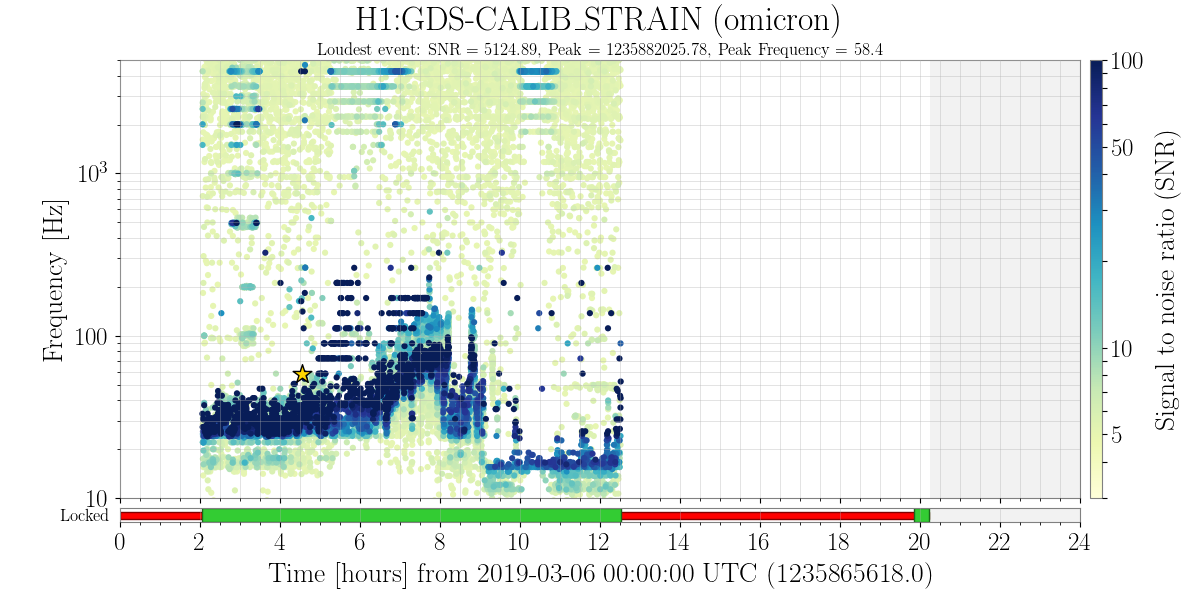
This test will probably need to be redone. The ASC loops were mistuned for this lock (alog 47321). The scattering arches reached up to 200 Hz, and the times of maximum scattering overlap the dips in your 100 Hz line. See attached plot.
J. Kissel (with help from L. Sun, E. Goetz, L. McCuller, E. Bonillla, R. Kumar) I've been processing the actuation function data from 2019-03-01 (see LHO aLOG 47206), and have some updates. Not were I want it, but since the heat is on I'll give a status update. Recall from LHO aLOG 46806, Steps to success: (i) Find out why ETMX L1 and L2 doesn't work, and fix it, such that we can go forward with full ETMX DARM actuation. DONE (see fixes to UIM and PUM crossovers in LHO aLOGs 47164 and 46861) (ii) Measure the PUM and UIM coil drivers, and update the compensation. DONE (see LHO aLOG 47167) (iii) Truly identify ETMX all 8 violin mode fundamentals and their harmonics to update the PUM dynamical model (needs IFO time), finish fitting the UIM transfer function data to update the UIM dynamical model (needs Kissel time) (iv) Remeasure all stages of ETMX with the full IFO DONE (see LHO aLOG 47206) (v) Update the front-end calibration (including reference model parameters at calibration line frequencies such that time-dependent correction factors are accurate), and (vi) confirm success with the full IFO (needs IFO time). So, I'm currently working on (iii) [with the help of Edgard, Rahul, Borja (#TeamSUS) along with Lee and Lilli #TheFittingCrew] and this aLOG is reporting the progress on fitting the results from the 2019-03-01 measurements, i.e. (iv) [working with Evan #TeamPyDARM]. Check out the attached .pdfs from each stage below, which are the output of the following script, /ligo/svncommon/CalSVN/aligocalibration/trunk/Runs/O3/H1/Scripts/FullIFOActuationTFs/process_actuationmeas_20190301.py after creating a new pyDARM model parameter file, ^/trunk/Runs/O3/H1/params/modelparams_H1_20190301.py TST: MCMC Results Force per count of longitudinal DAC request (just down stream of DRIVEALIGN bank): Gain = 4.734e-12 (N/ct) Force per actuator signal (current or voltage): Gain = 4.433e-11 (N/V**2) Actuator gain, H_c (N/ct) | 4.734e-12 (+2.09e-15,-2.102e-15) or (+0.04415%,-0.0444%) Residual time delay, tau_A (usec) | 10.79 (+0.7573,-0.76) or (+7.02%,-7.045%) Comments: Except for the sign flaw in the "intermediate results" plot, I'm very happy with the state of the systematic error, I believe the MCMC fit, and I think we're ready push to front-end. PUM: MCMC Results Force per count of longitudinal DAC request (just down stream of DRIVEALIGN bank): Gain = 6.223e-10 (N/ct) Force per actuator signal (current or voltage): Gain = 0.03038 (N/A) Actuator gain, H_c (N/ct) | 6.223e-10 (+3.339e-13,-3.33e-13) or (+0.05367%,-0.05352%) Residual time delay, tau_A (usec) | 4.096 (+1.568,-1.571) or (+38.28%,-38.34%) Comments: There's still something very fishy going on below 20Hz. I don't understand it, and this is under investigation by Evan and I. UIM: MCMC Results Force per count of longitudinal DAC request (just down stream of DRIVEALIGN bank): Gain = 7.498e-08 (N/ct) Force per actuator signal (current or voltage): Gain = 1.597 (N/A) Actuator gain, H_c (N/ct) | 7.498e-08 (+2.842e-11,-2.869e-11) or (+0.03791%,-0.03826%) Residual time delay, tau_A (usec) | 57.81 (+1.218,-1.215) or (+2.107%,-2.101%) Comments: the low frequency data (below 10Hz) is pretty un-informative, and this is where the UIM matters -- BUT I'm not sure we've ever got any better. I'm dividing out the high frequency dynamics of the OSEM bracketry and UIM to PUM violin modes based on old H1 ETMY data for now CSWG aLOG 11212, and that has significantly flattened out the systematic error, so we can now use all the data from 10 to 100 Hz for the fit of the actuation coefficient instead of what we did in O2 which was only use 3-5 points between 10 and 20 Hz. I'm working with Lee to get an updated fit on data that I took on 2019-01-25. Finally, I show one of the plots from the latest output of https://svn.ligo.caltech.edu/svn/aligocalibration/trunk/Common/pyDARM/darm_loop_critique.py which, unlike the scripts from above is a function, which I called using the following command line, python3.6 darm_loop_critique.py --run=O3 --IFO=H1 --DARMmodelfile=modelparams_H1_20190301 --modelFunction=modelPars --outputfile=2019-03-01_critique This shows the relative contribution of each stage. to the overall actuator to give you a feel for what matters where (now that things have been updated to reflect Sheila's latest work with the PUM crossover). Comments: - Only the phase is shown, so take the plot with a grain of salt. - In the calibration band (a bit larger than the detection band, between 5 and 5000 Hz), excitingly, the UIM is now *very* unimportant to get perfect. However, I'm interested to see how this plot shapes up once we've fixed the dynamical model (which is currently all this plot has to go on) - It is far more important to get both the PUM and the TST stage right. - We'll need to resolve this reported frequency-dependent systematic error in the PUM, since it's right in the phase/magnitude mixing region ("the crossover" implies the hand-off between stages only happens precisely at a single frequency. No bueno.) So -- I continue my work on the PUM as priority. We also need to retake a sensing function sweep suite, so I can compare the results against and open loop gain model.
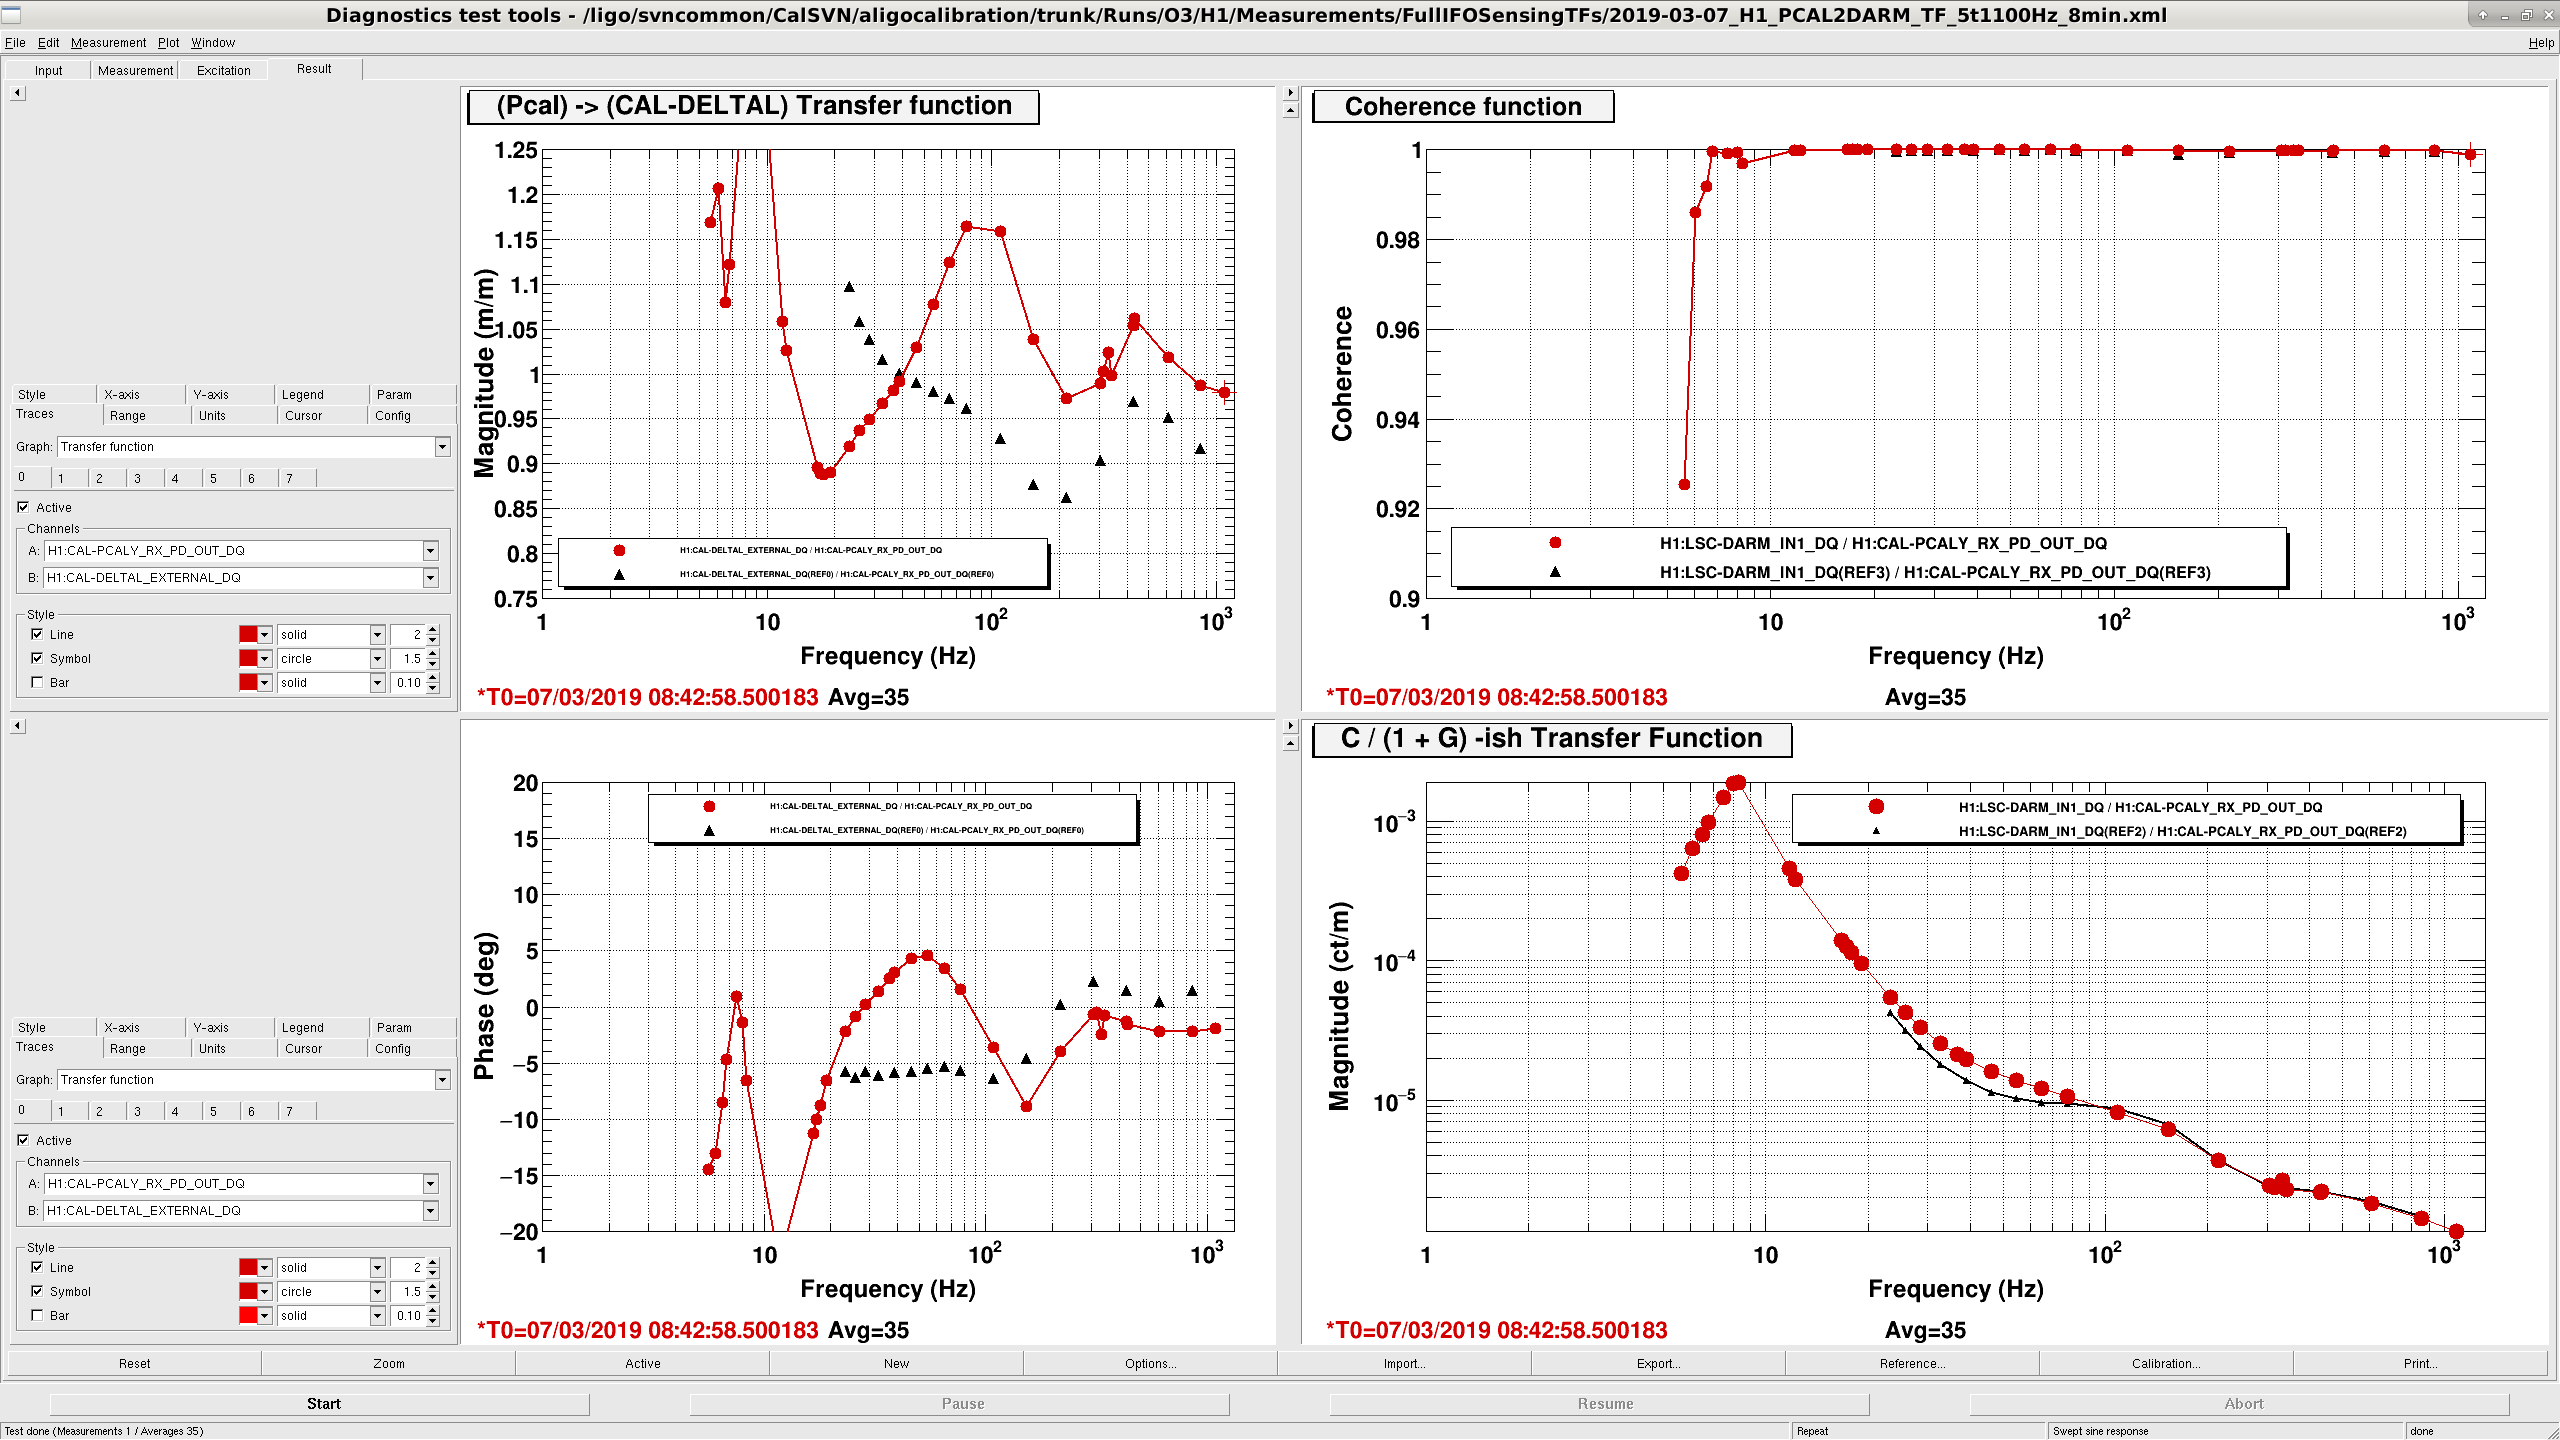
I took a PCAL to DARM measurement, and a DARM OLG, they are in /ligo/svncommon/CalSVN/aligocalibration/trunk/Runs/O3/H1/Measurements/FullIFOSensingTFs/2019-03-07*.xml
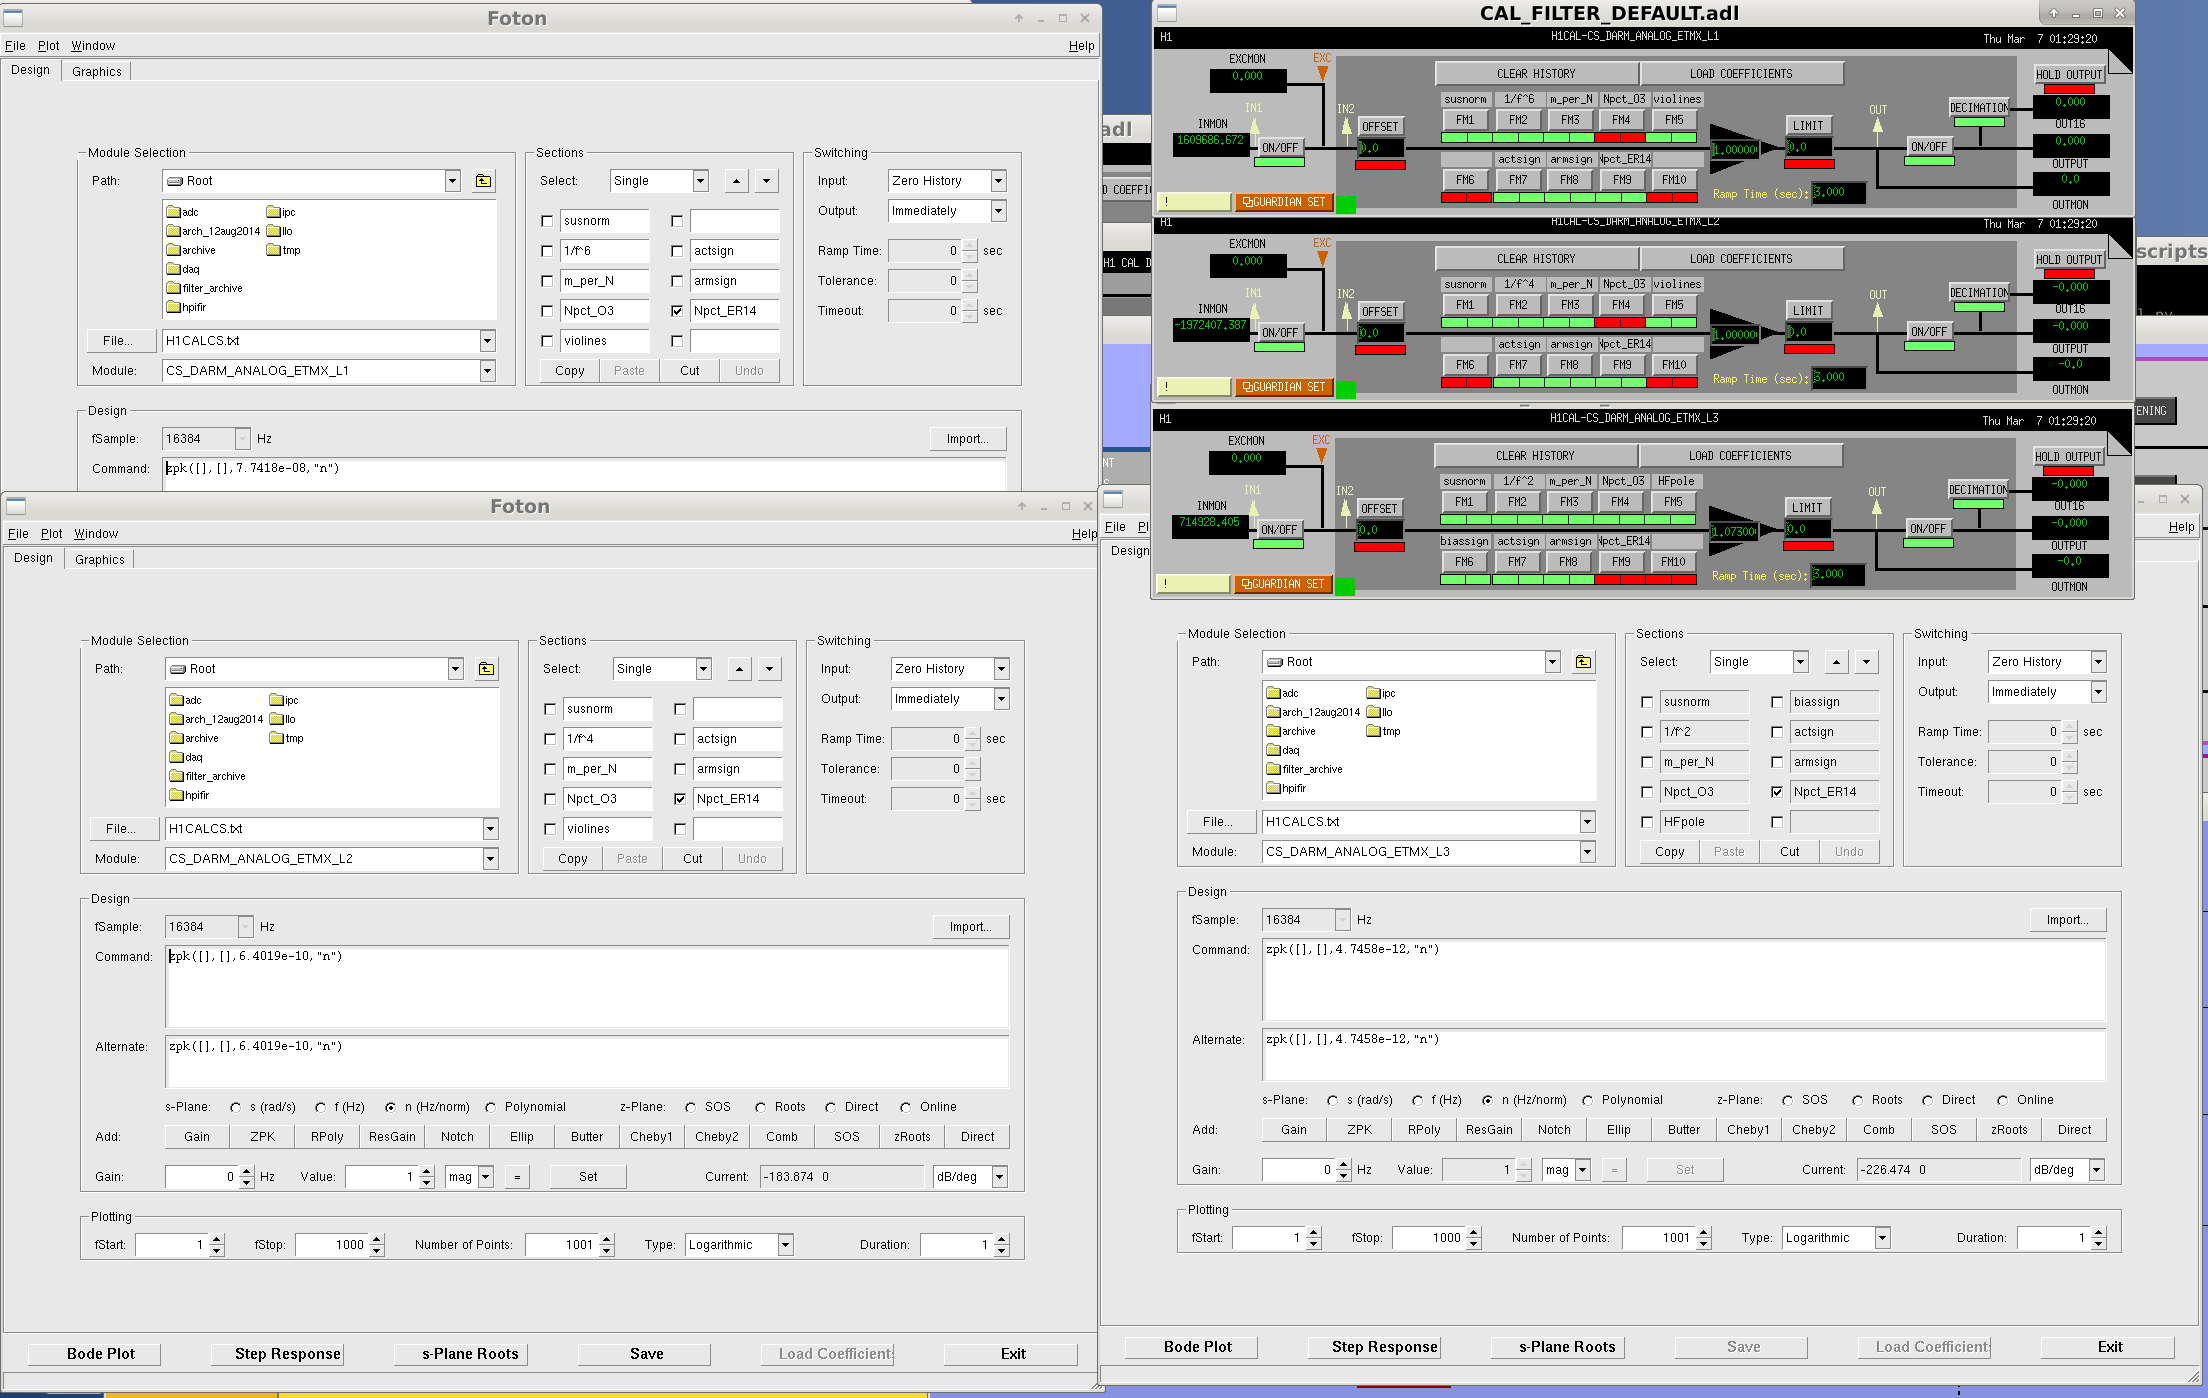
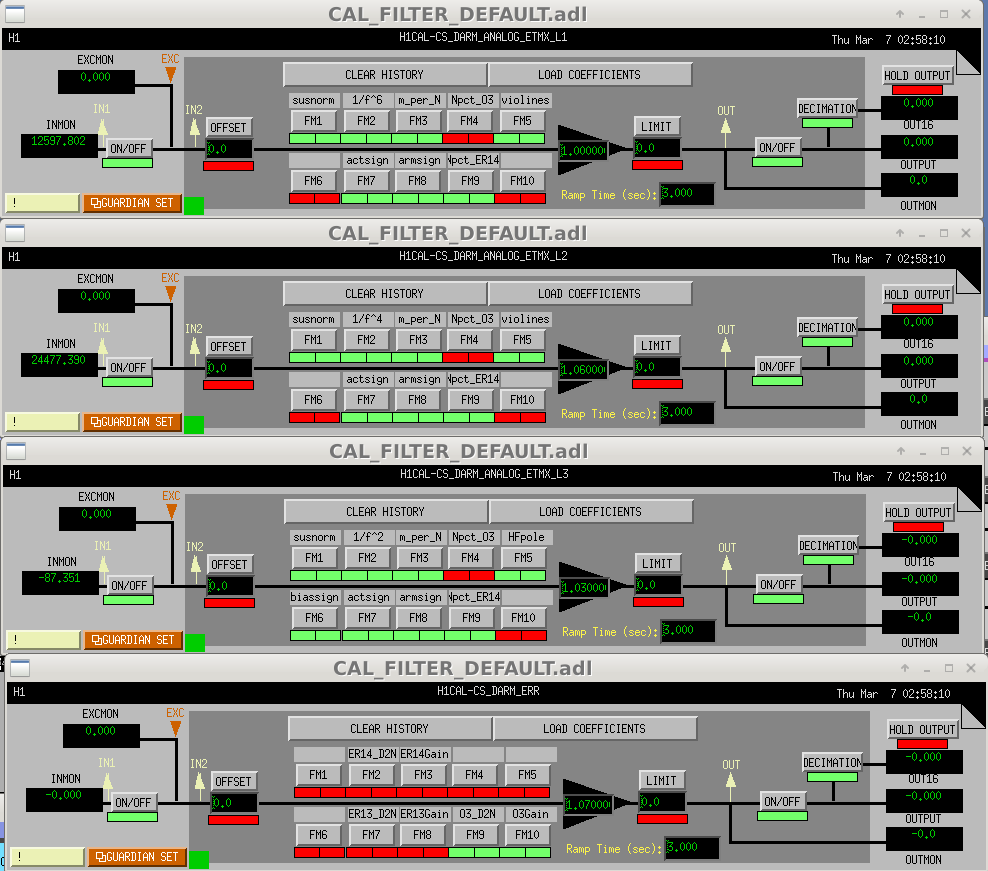
The PCAL to DARM was pretty bad, so I updated the Npct_ER14 front-end calibration filters according to the numbers above. I also switched off Npct_O3 and switched on Npct_ER14 for ETMX L3, and adjusted L3's FM calib actuator gain from 1.073 to 1.0. Will retake PCAL to DARM if I get a chance tonight.
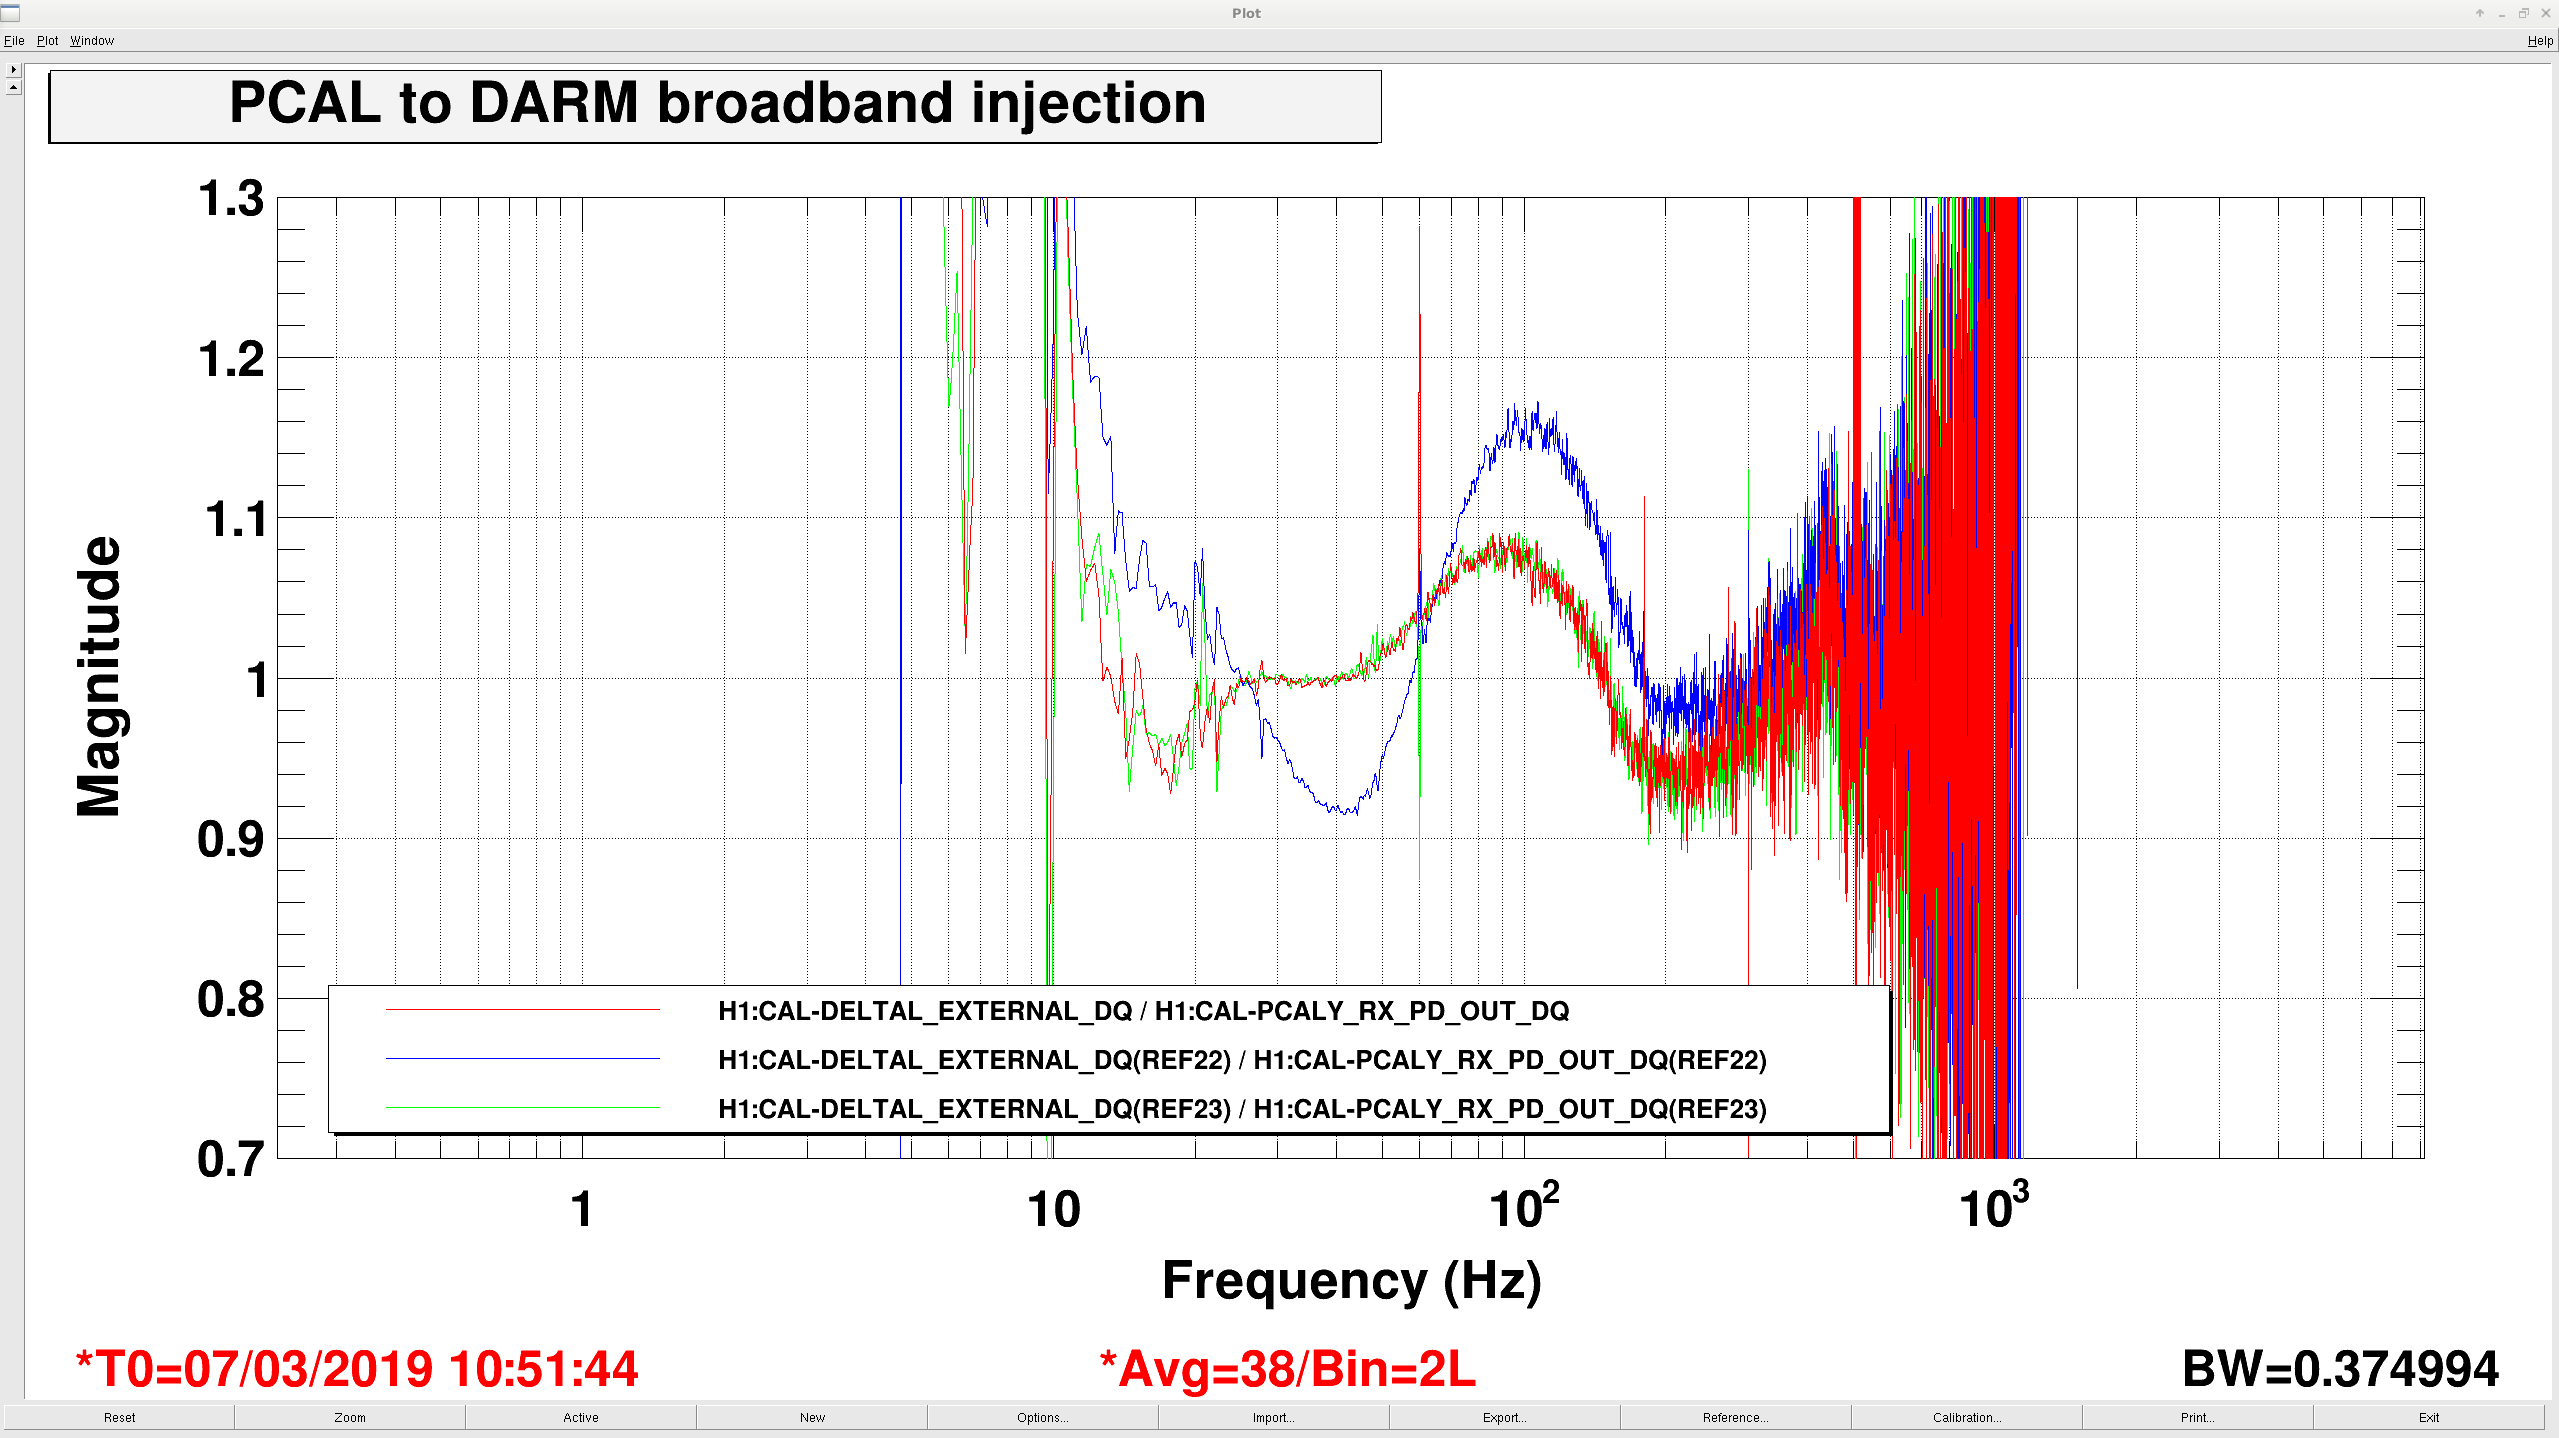
I ran another PCAL to DARM broadband injection while adjusting the gains. I believe there is some phase mismatch which makes a perfect front end calibration not possible at the moment: no matter how I adjust the gains, there is always a hump around 100 Hz, right around the crossover between the L3 and error signal authority. I did the best I could, we are good to 10% everywhere now. Range went from ~87 to ~95 Mpc.
Comparing the third plot above (called actuator authority) to the attachments to 47164, it seems like there must be a sign error in one of the stages which is creating the notch just below 2 Hz in the total. It would be easier to debug these sign flips if we also could see the phase.
@Sheila -- You're correct -- the model file used to generate the plot you mention (via darm_loop_critiue) had a reference to the wrong H1SUSETMX filter file (it wasn't as simple as a sign flip, but a previous filter file [before the PUM design was fixed] called with the same filter *banks* meant a report of a cross-over instability). I've corrected this since (apologies for not posting until now), but the new version is attached below, including the phase.
Keita, Craig, Sheila
Thanks Jeff for the updated plot. We are using the model used (and compared to cross over measurements) in 47164 to try to reproduce your plot.
We've tried to reproduce the plot you have above, but the only way we can do this is by removing the cascading of filters. To say the same thing a different way, when you say LOCK IN to displacement, I think that you mean L3 lock in to displacement, which for L1 would mean L3 LOCK L * L2 LOCK L *L1 LOCK L * L1 drivealing *L1 electronics * L1 mechanical stuff. The only way we can recreate your plot is to leave out L1 LOCK and L2 Lock from the L1 actuator. However, if we leave these out the toal line in your plot is misleading/wrong.
In the first attachment (not cascading filters) is our reproduction of Jeff's plot above, where we have removed the L3 lock and L2 lock filters from L1. The second one includes the cascaded filters, which is more correct if you want to add these up to make a total.
I've processed the measurements taken from 1) Drivealign bank and 2) Test bank (measurement data in aligocalibration/trunk/Runs/O3/H1/Measurements/FullIFOActuationTFs; March 26)
The resulting plots are attached. The fitting through the test bank is better. This is a quick comment. The details need to be further investigated and discussed.
The residual comparison plot is made following the steps below:
1) Create two separate reference models for drivealign and test scenarios, based on the Mar 16 model, by writing back the MCMC PUM MAP values.
2) Compute the error residuals for two scenarios separately.
3) Plot Response_drivealign_with_error/Response_drivealign_ref, and Response_test_with_error/Response_test_ref.
Came in to see ALS-Y w/ no beam or really no flashes at all. Saw a small step in the ETMy & ITMy after the last lock 4hrs ago, so quickly tried returning the optics to their oplev values to when we were locked...but did not see any flashes at all.
We are now going down for the DCPD work for the PSL (WP#8114) for about 30min.
The adapter box that interfaces between the DB9 of the RF photodiode and the DB15 of the TTFSS field box was
opened. On the DB15 side, there is 1M in series with pins 5 and 13. These reduce the nominal gain of the
RFPD DC monitor output from -1 to -0.01, which would explain the low number of counts observed.
Otherwise the number of counts for ADC channel 6 is consistent for the input applied voltage.
Richard / Peter
Fil and Richard fixed this, this morning. The two 1M resistors were removed.
The gain factor of -0.100 was changed to -0.0006103515 (ie the counts to volts conversion) to better reflect things.
This is a continuation of determining this was broken at:
https://alog.ligo-wa.caltech.edu/aLOG/index.php?callRep=47140
This adjustment has been tracked in FRS Ticket 12386. Jason / Peter are waiting for confirmation of success before closure.
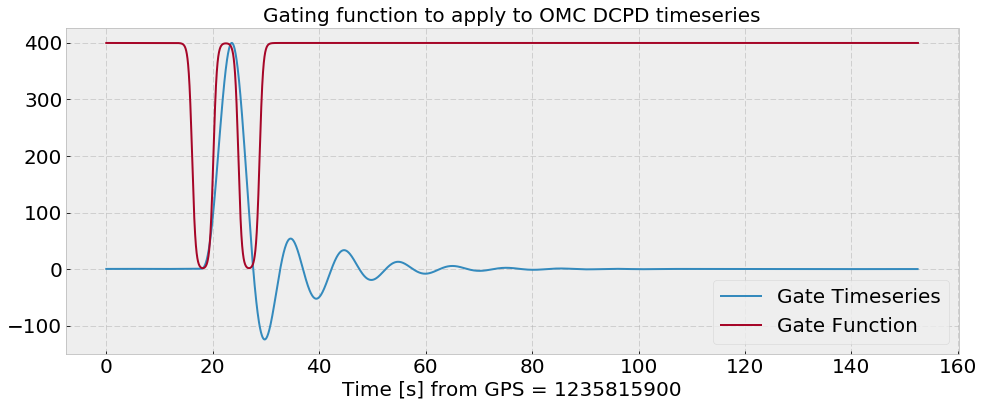
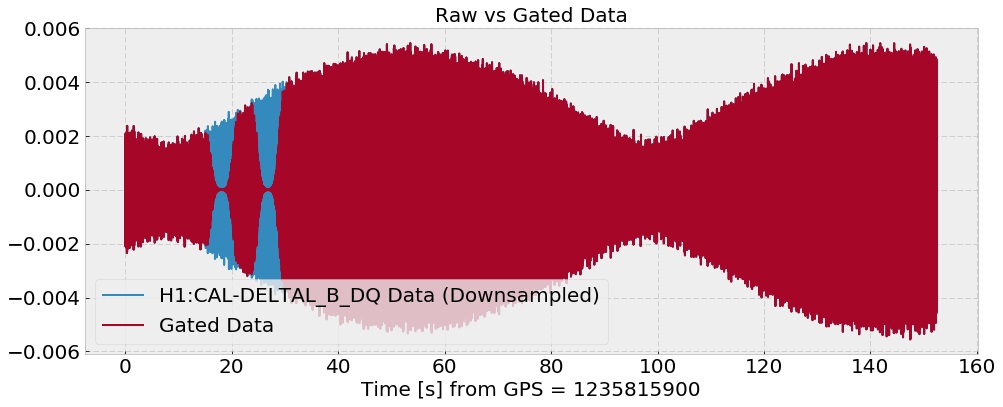
I wrote some python code to create cross-correlated DARM spectra over long, glitchy locks. Stefan balanced the PDs recently, and we saw our correlated DARM noise was fairly high at high frequency. Stefan supposed this was from glitches, but from this alog, this seems to not be the case. The info we want from the cross-correlated DCPD spectrum is the correlated noise from the IFO. We can average away the shot noise like 1/sqrt(N) where N = number of ASD averages. The problem is we need many averages to integrate away the shot noise. However, during these locks, we have frequent, strong ESD saturation glitches which spoil the spectrum. DTT is not able to "gate" the glitches, i.e. remove them from the timeseries. This code solves this problem. Attachment one shows a DARM ASD and DARM CSD between the OMC DCPDs during the lock last night. I have 2000 averages with a binwidth of 0.2 Hz and 50% overlap, or 1.4 hours of data. During this time there were 4 glitches which spoiled the spectra (the blue, purple, and green traces). With gating we have the red and orange traces. Attachment two shows a zoomed in gate function of one of these glitches. The gate I apply is just a logistic function with the mean of the data added in. The glitches are witnessed via the DARM BLRMS increasing to huge values, specifically H1:OAF-RANGE_RLP_3_OUT16 going above 100 counts. Attachment three shows the DARM OMC DCPD data with and without the gate applied. Code lives in/ligo/home/craig.cahillane/Git/IFO/Crosscorrelations/scripts/gated_DCPD_CSDs.ipynb. To run you'll have to run:$ setupanaconda (or $ source /opt/rtcds/userapps/release/cds/h1/scripts/setup_anaconda if your .bashrc alias isn't set up) $ source activate cragenv $ jupyter notebook /ligo/home/craig.cahillane/Git/IFO/Crosscorrelations/scripts/gated_DCPD_CSDs.ipynbShoutouts to TJ Massinger for help with understanding gating.
Please can you say exactly what is saturating in the ESD chain and, if you know it, what causes the saturation?
Rich:
The large glitches that show up in the BLRMS and as range drops used to always saturate the ESD, but they no longer do saturated the ESD every time (See 46642). The ESD saturation seems to be a symptom of the glitches which happen because the ESD sees DARM, not a cause. Our normal drive to the ESD is not close to saturating, and the glitches don't seem to be happening at times when we have large excursions in the drive to the ESD.
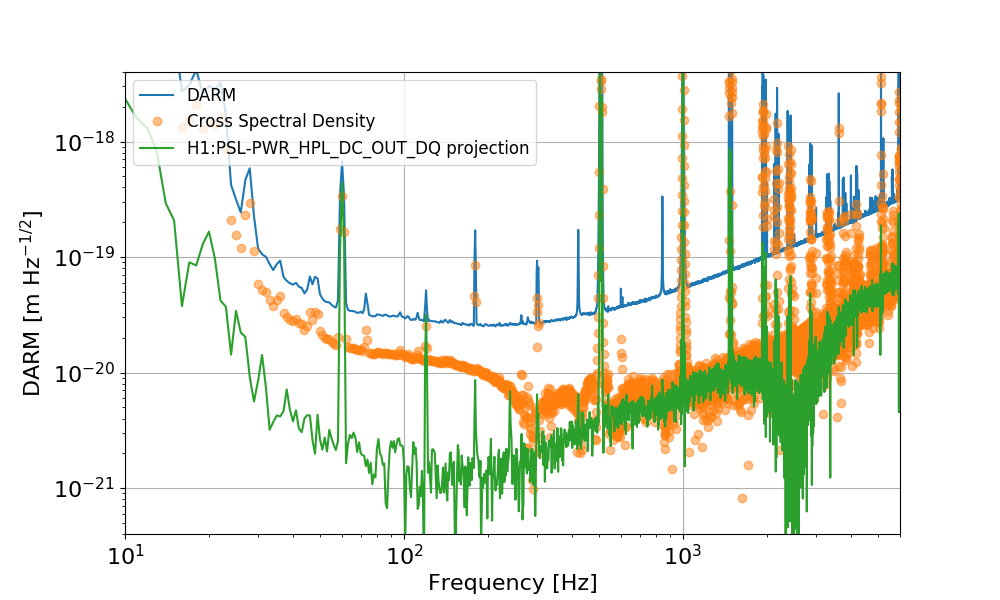
Looking at Craig's cross-correlated noise at high frequency, I remembered that we often see ~low coherence with PSL signals at a few hundreds Hz and above. In particular, looking at a BruCo scan for one of the last locks (bruco_lho_1236004218) I found that above a few hundreds Hz there is significant coherence with H1:PSL-PWR_HPL_DC_OUT_DQ (I'm not sure what that channel is...)
So I used a subset of the time Craig's listed in the plot (between 1235816126 and 1235816900) and computed
I used 1-second-long FFTs, to increase the number of averages. Maybe this is why my CSD is a bit lower than Craig's. In any case, it looks like the correlated noise lines up nicely with the projection from that PSL channel (I don't know what the "notch" at 2.5kHz is in the PSL channel projection, but it looks to be at about the right place where the intensity and frequency noises cross over in the noise budget 47351).
For future reference, the channel H1:PSL-PWR_HPL_DC_OUT_DQ is a power monitor PD on the PSL table. This PD sits before the ISS AOM (it is PD01 on the PSL table drawing, D1300348 (drawing update for 70W amp in progress update complete)), so any intensity noise it sees is free-running and therefore not suppressed by the ISS.
In 46983 and 46083 Robert showed that the fan frequencies of the IO chassis at EX were showing up in DARM. After the work today that electrically isolated the EX ESD electronics from the rack it is installed in, it appears that this coupling has gone away.
The EX ESD isolation seems to be a good move, and should be considered for the Y end as well.
Dan, Danny,
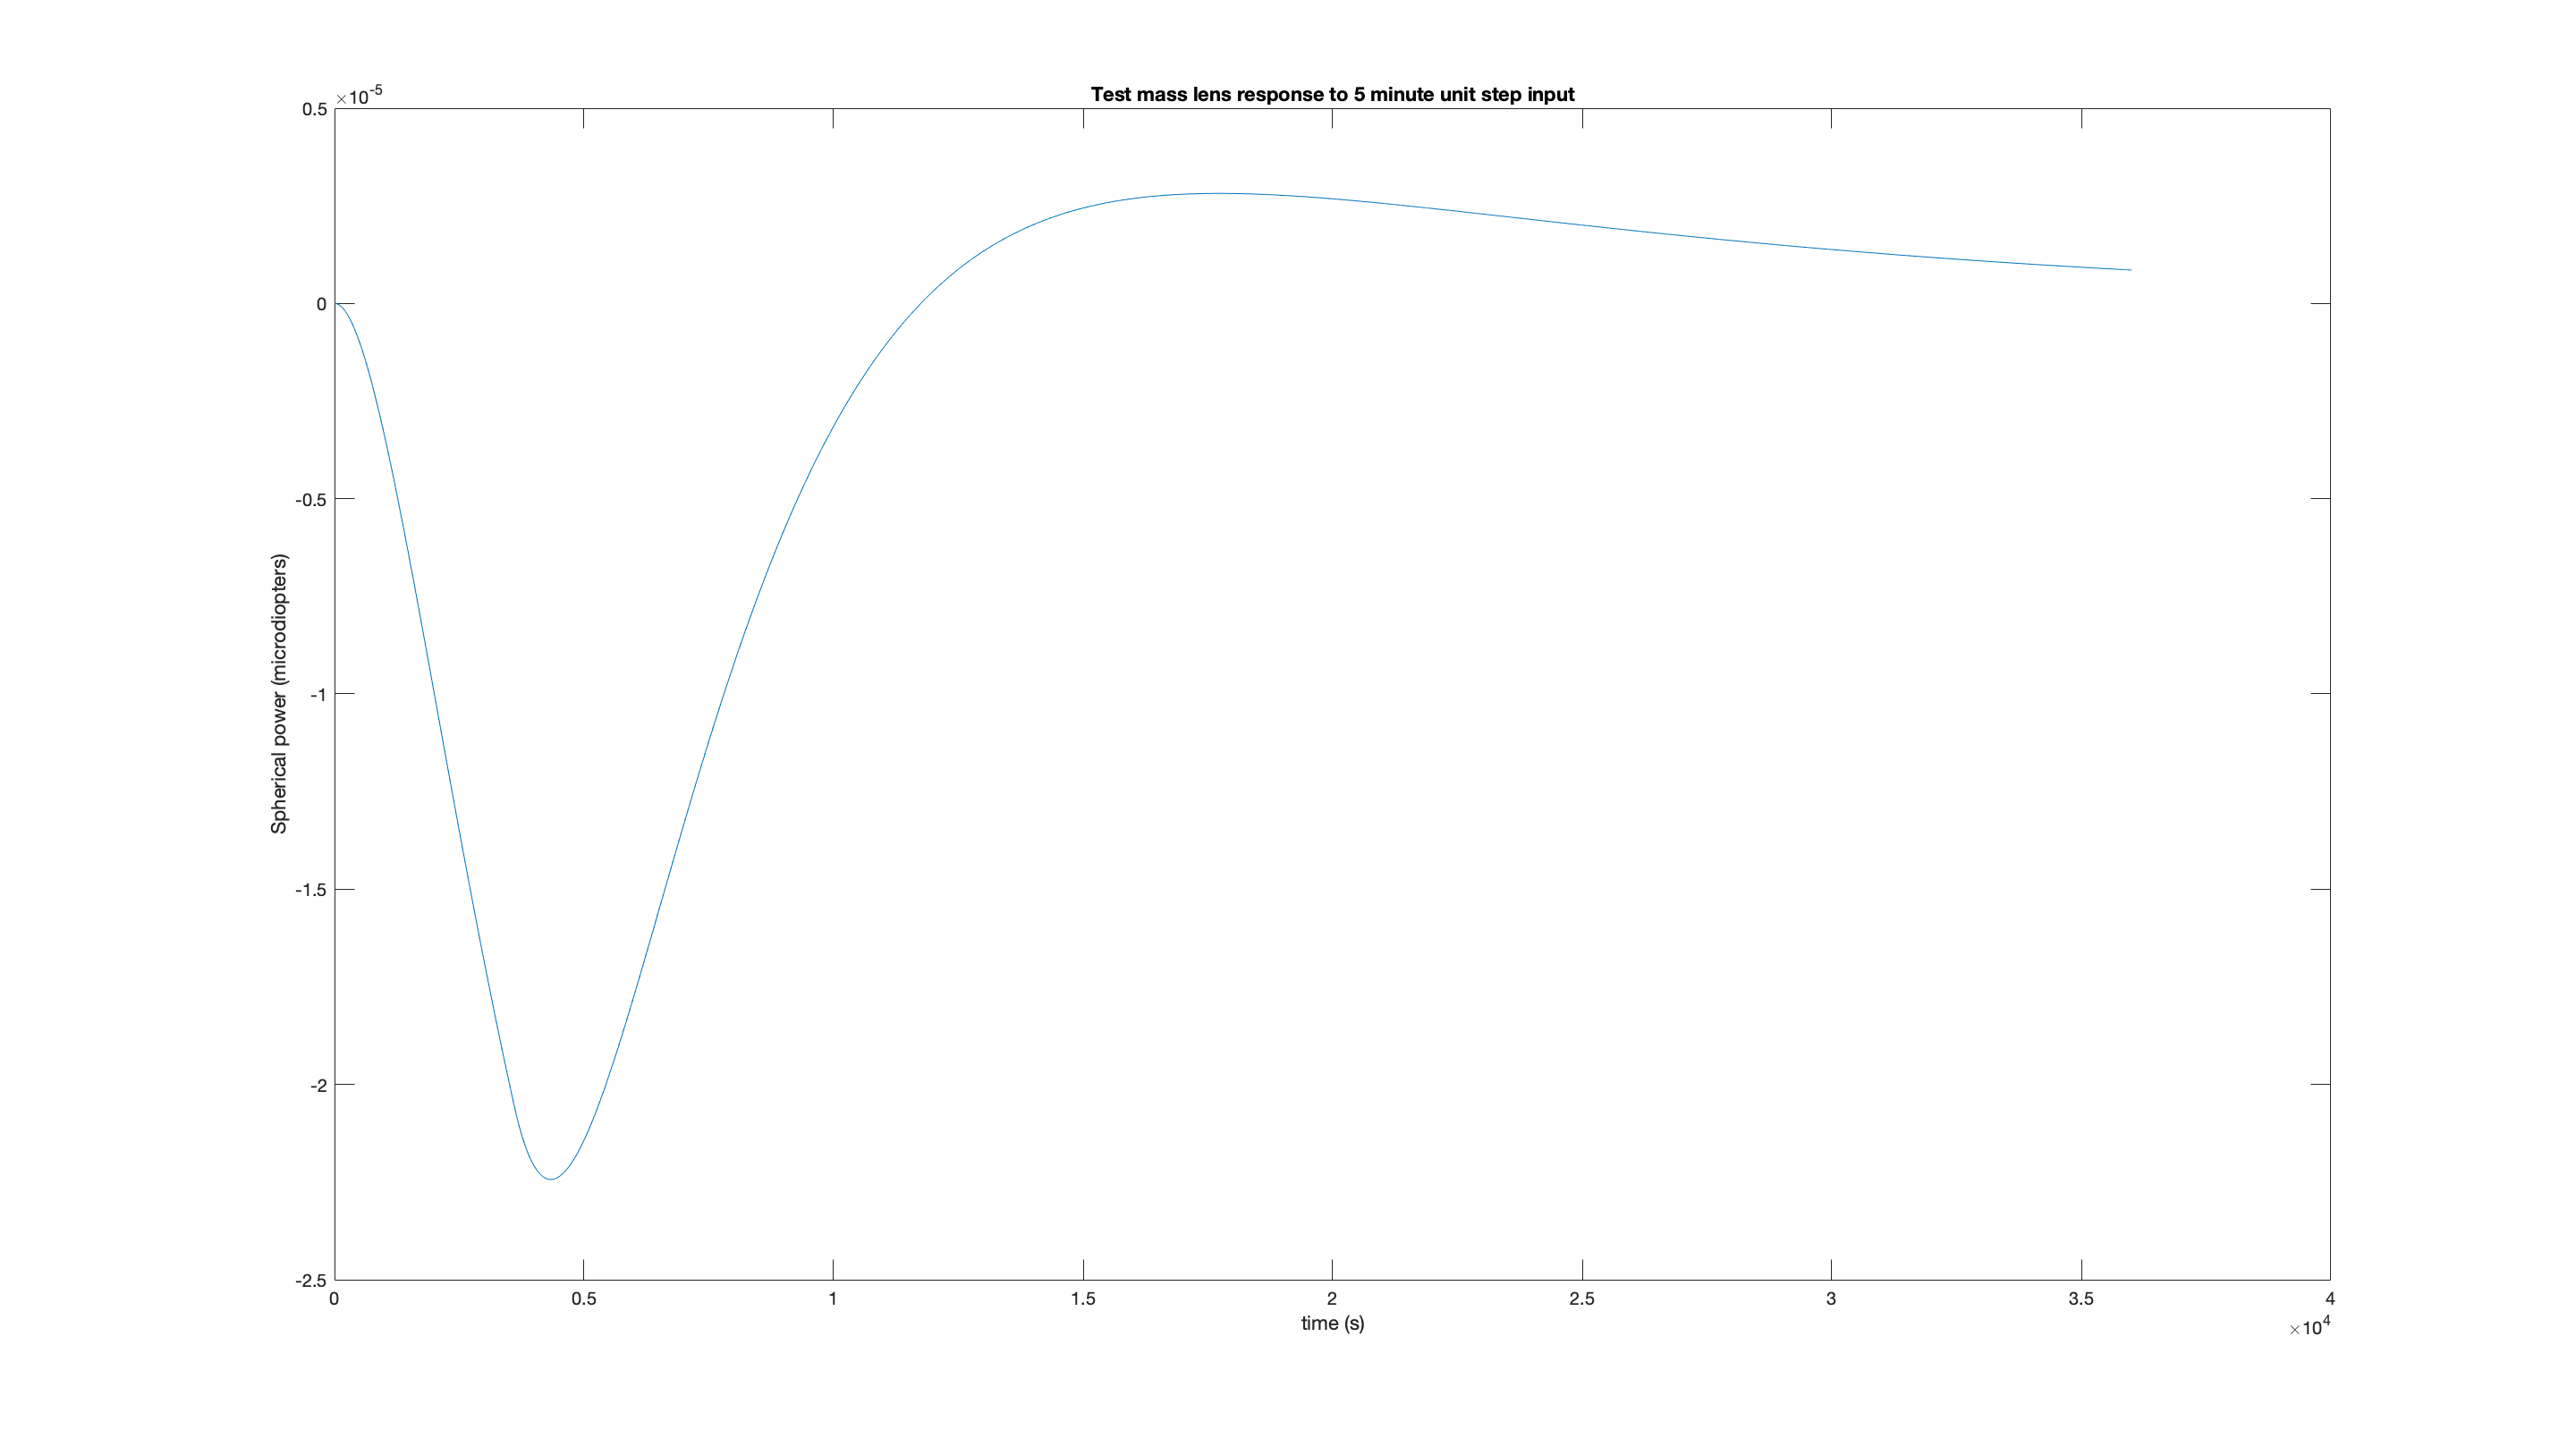
During the maintenance day we took a trip to EY to have a look at the HWS which has not been outputting any useful information. We took the plate off and noticed the beam was significantly pitched to the left. We recentered it and drove ETMY pitch and yaw with some sinusoidal signals and saw the equivalent in the HWS prism channels. We put the plate back on and have waited for a power up to check what we see. A video is attached. So it seems to be measuring the IFO beam absorption, it just has the wrong sign still. We're thinking of doing a small ETMY ring heater pulse to see how the HWS sees that. That should give the same result as all the other ring heaters.
We're going to request 1 watt of additional power on the ETMY RH for 5 minutes. This shouldn't be very disruptive at all since the carrier beam only sees the surface lens contribution which is a 1 microdiopter positive lens (as suggested by the TCS sim). The Hartmann on the other hand will see a -22.4 microdiopter lens. A time series of what we think the Hartmann should see based on a RH plant model is attached.
When re-locking after maintence day today, we have what looks like large scattering shelves in DARM (starting around 2:03 UTC march 6th).
Update: I accidentally increased the gain in the OMC ASC loops during maintence today, which caused large scattering shelves. We can use this data to estimate scatter noise from the OMC for normal ASC drive levels.
While looking for the cause of the large scattering shelves, we also found that turning off the cut-off filter for MICH P greatly reduced the scatter, and the 0.5Hz noise in our ASC signals. After reducing the OMC ASC gains, we tried to engage the MICH P low pass again, which caused a large scattering shelf, and caused the ASC signals to ring up.
The high gains were on in lock from about 2:30 UTC until about 9:05 UTC on March 6th. The MICH P low pass was off from 8:13 UTC to 8:43 UTC, while the OMC ASC was still in high gain. This would be a good time to use to estimate the ambient level of the scatter.
TITLE: 03/05 Day Shift: 16:00-00:00 UTC (08:00-16:00 PST), all times posted in UTC
STATE of H1: Commissioning
INCOMING OPERATOR: None
SHIFT SUMMARY:
Maintenance roughly ended just after noon. There was single bounce work for Squeezer in the afternoon.
Initial Alignment Notes: Then an Initial Alignment was run---ALS X-arm was pretty misaligned, but Patrick was able to restore it after some aggressive slider moves (and had to wait quite a bit for ASC signals to converge before offloading). SRC was fairly misaligned and this required tweaking SR2 pointing on the AS_C PD. Once this was centered, Patrick was able to lock the SRC.
Locking Note: IR was not found. Diff Offset slider was moved to maximize TR-X_NORM (blue on StripTool), but it only made it to about 0.45. Georgia suggested we get this value to 1.0 by taking the TRX_QPD_B_SUM's offset from -1.2 to 1.0. This did the trick. The offset was returned to -1.2.
LOG:
Today, while doing some cabling for PSL Picomotors, I noticed that the clamping of hte PZT actuator doesn't look right (see attached photos).
It seems that the screws that apply the clamping force, thus constraining the PZT body between the upper vee and the lower vee (and compressing the viton damping cylinder in the process) were not sufficiently tightened.
The PZT actuator cylinder appears to be floating on top of the viton cylinder, lightly constrained by the upper vee, but not the lower one - there is an obvious 1-2 mm gap between the PZT cylinder and the lower vee, on both sides.
Thanks for sharing, Rick. The cylinder of the PZT definitely should not be floating atop the viton cord, and the PZT cylinder definitely should be registered onto the V contact planes of the Base and the two Clamps.
SYS (EddieS) is working on updating the drawing D1700002 for clarity, but these are the steps that should have been implemented during assembly:
Some comments closing the loop on documentation:
Discussed at IIET call 3/8: See notes / actions at https://services.ligo-la.caltech.edu/FRS/show_bug.cgi?id=12077.
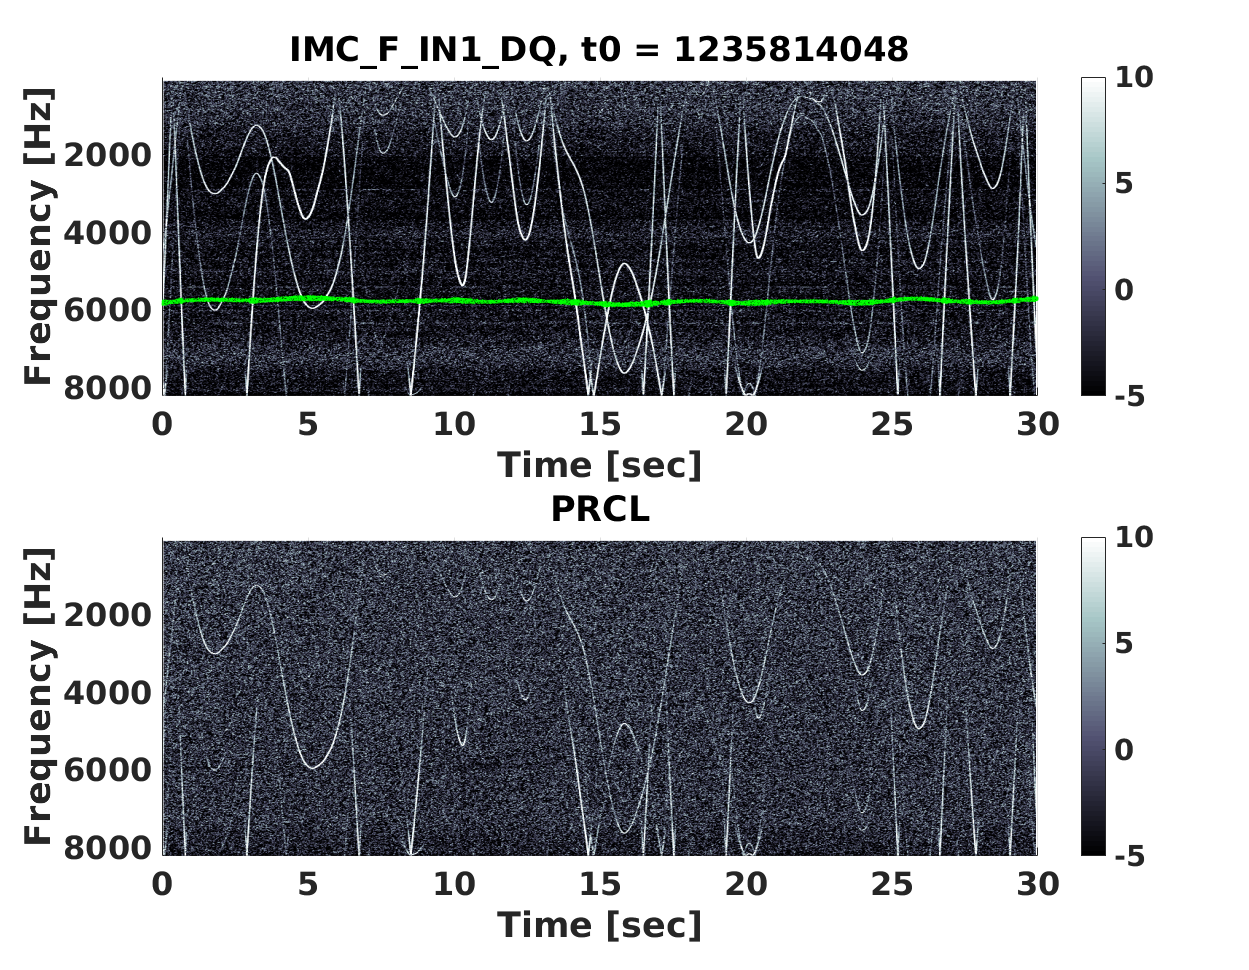
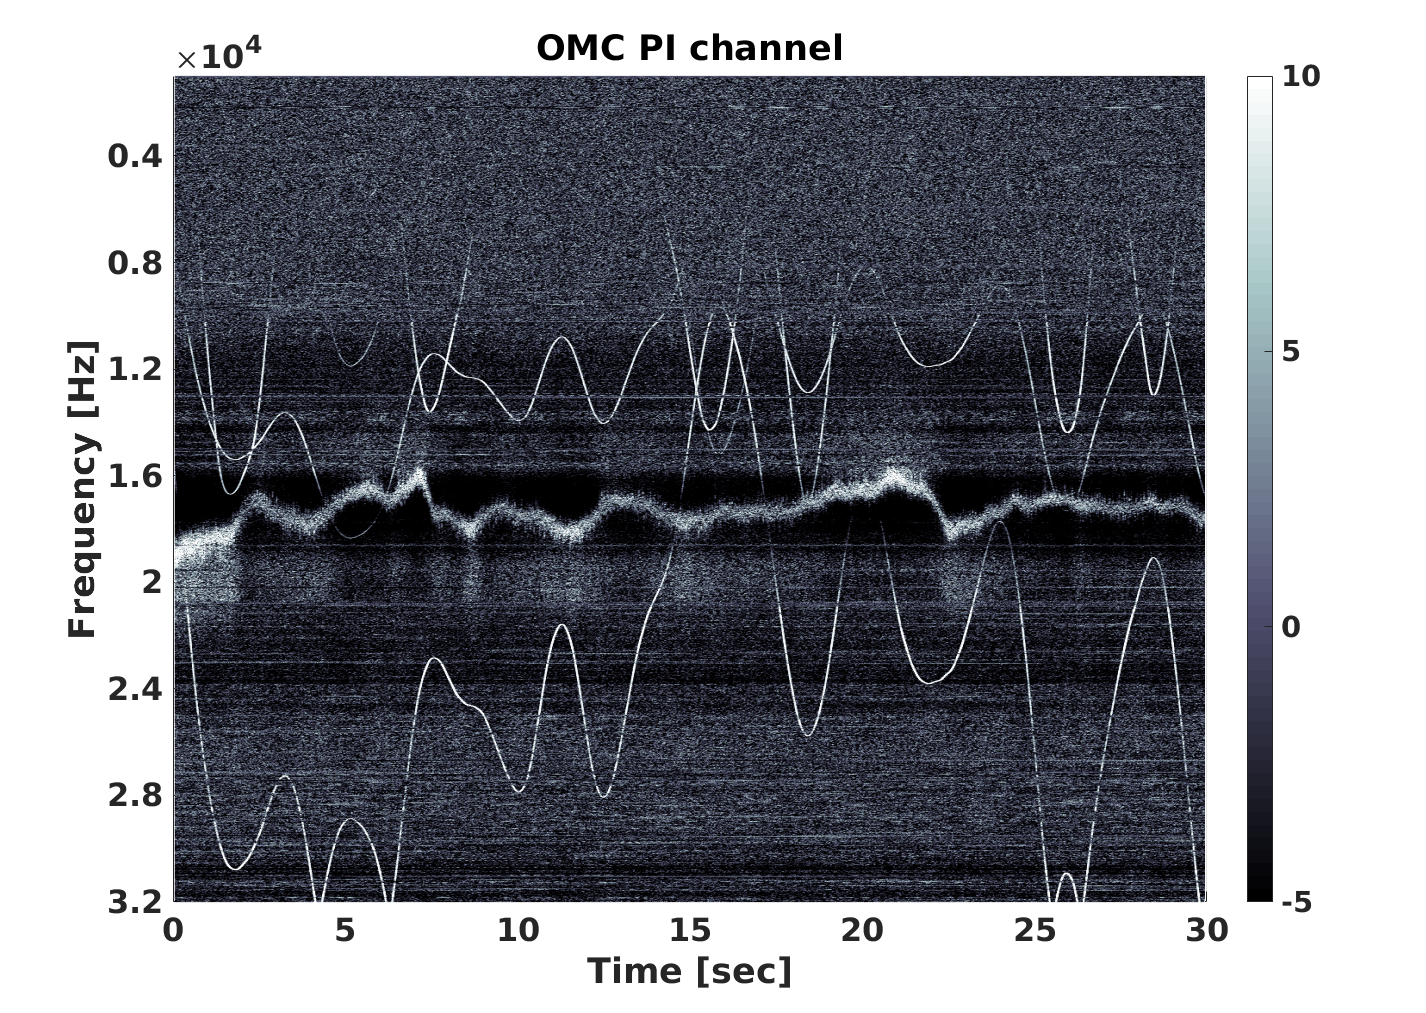
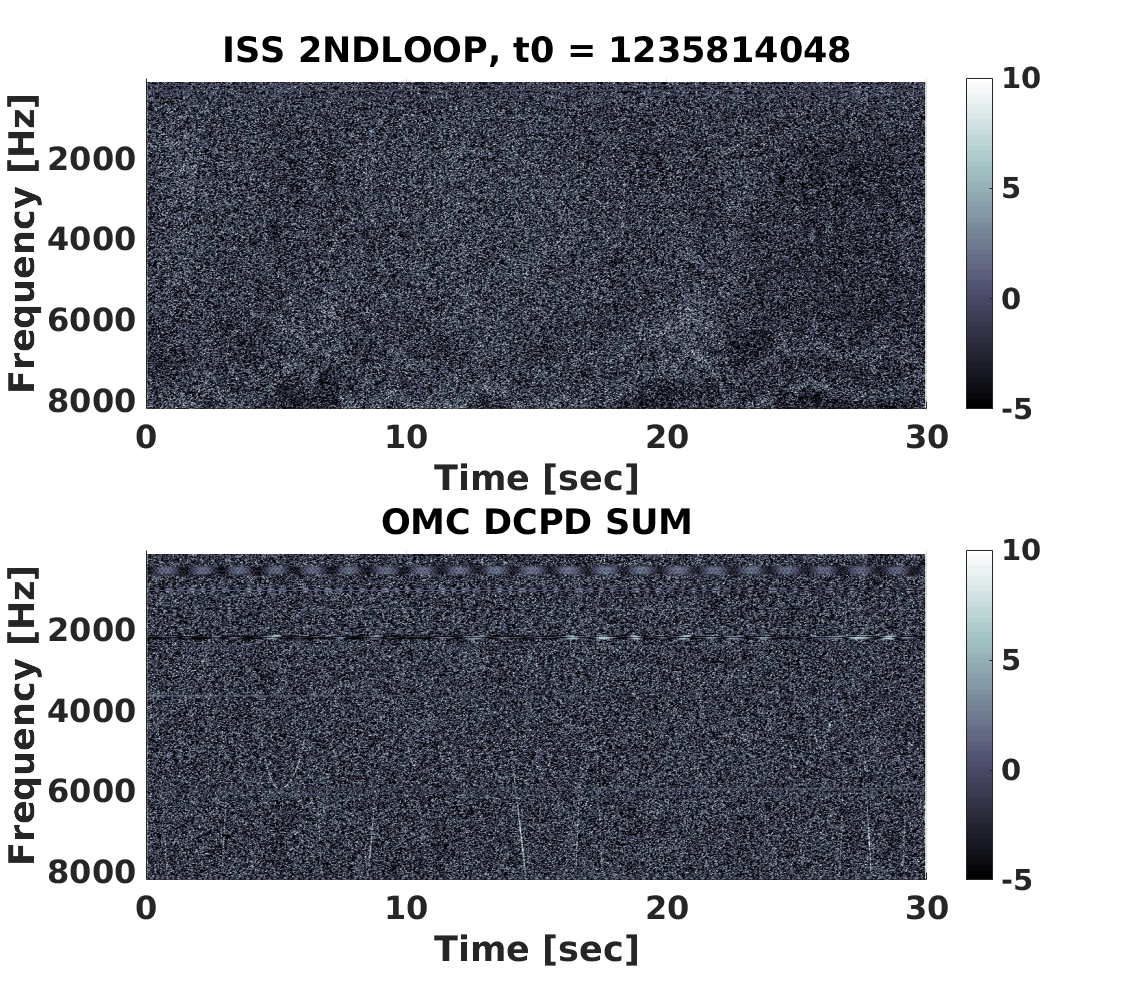
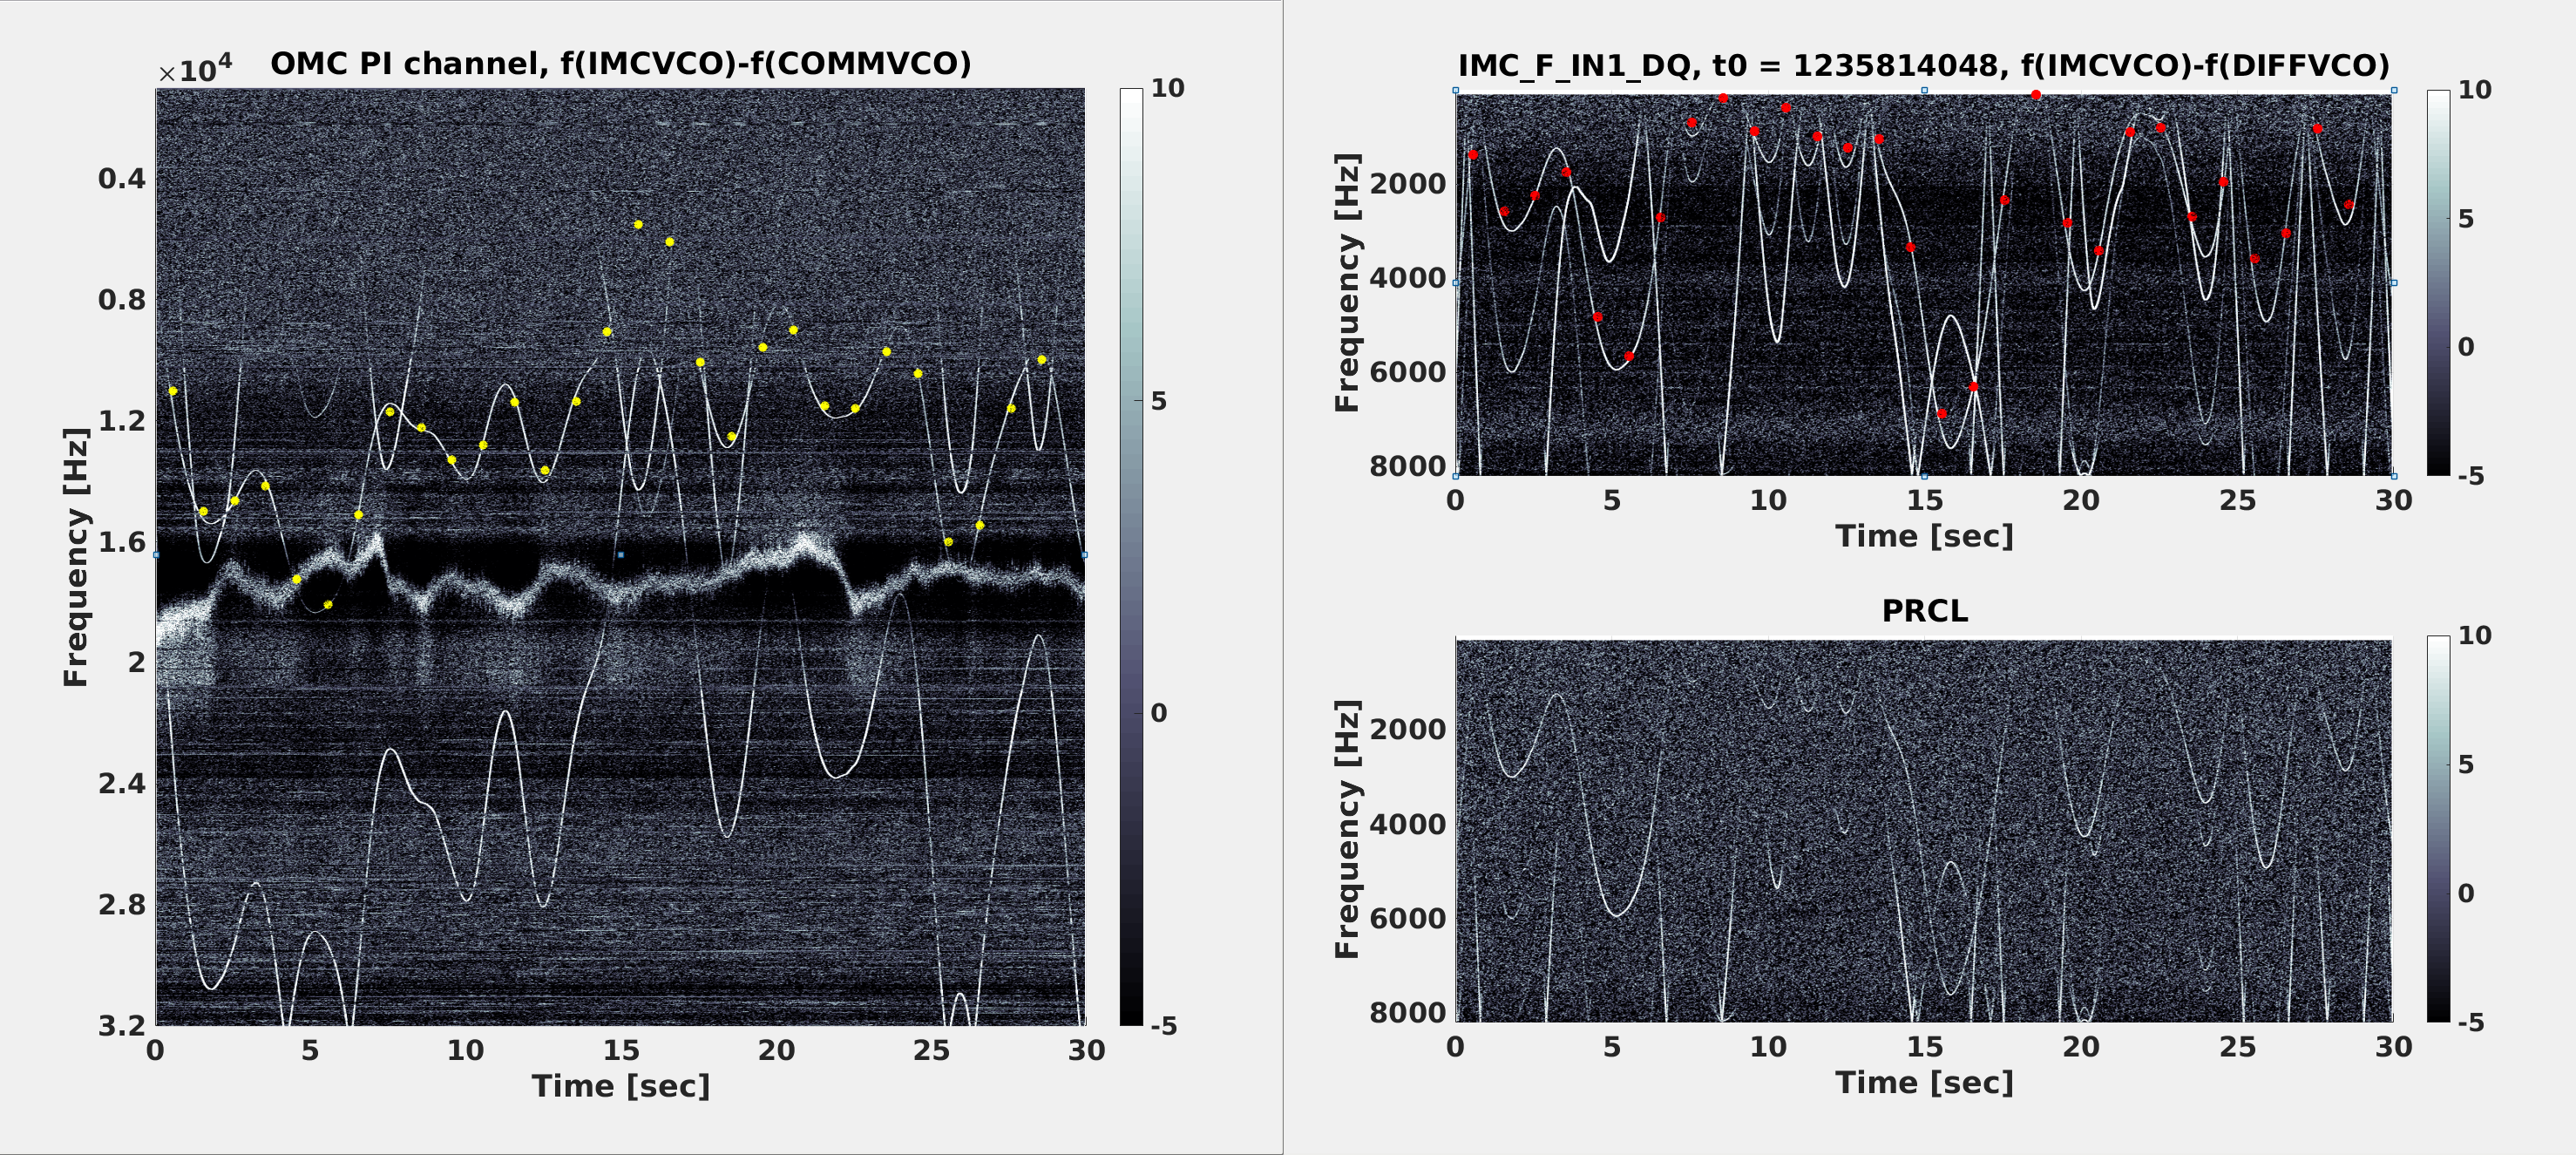
To aid the diagnosis of RF whistles (aka arches), I tried a matlab script that LLO has been using. It essentially just makes normalized spectrograms of channels that are good witnesses of the whistles. The attached plots are the outputs from running this script on data from last night's lock, around 10:00:00 UTC. The whistles/arches are clearly visible in the OMC PI (parametric instability) readout channel up to 32 kHz; they're also quite visible in IMC_F and PRCL (8 kHz and below). At this time the IMC VCO frequency was between 78.781 MHz and 78.794 MHz.
The script is 'look_for_arches.m', and is in: /ligo/home/peter.fritschel/Whistles/
In the first attachment, left panel is the frequency difference between IMC VCO and COMM VCO (which is mostly higher than 8kHz) plotted on top of OMC PI channel spectrogram, and right panel is the difference between IMC VCO and DIFF VCO (lower than 8kHz) plotted on top of IMC_F spectrogram.
The agreement with one of the whistle trace is pretty good.
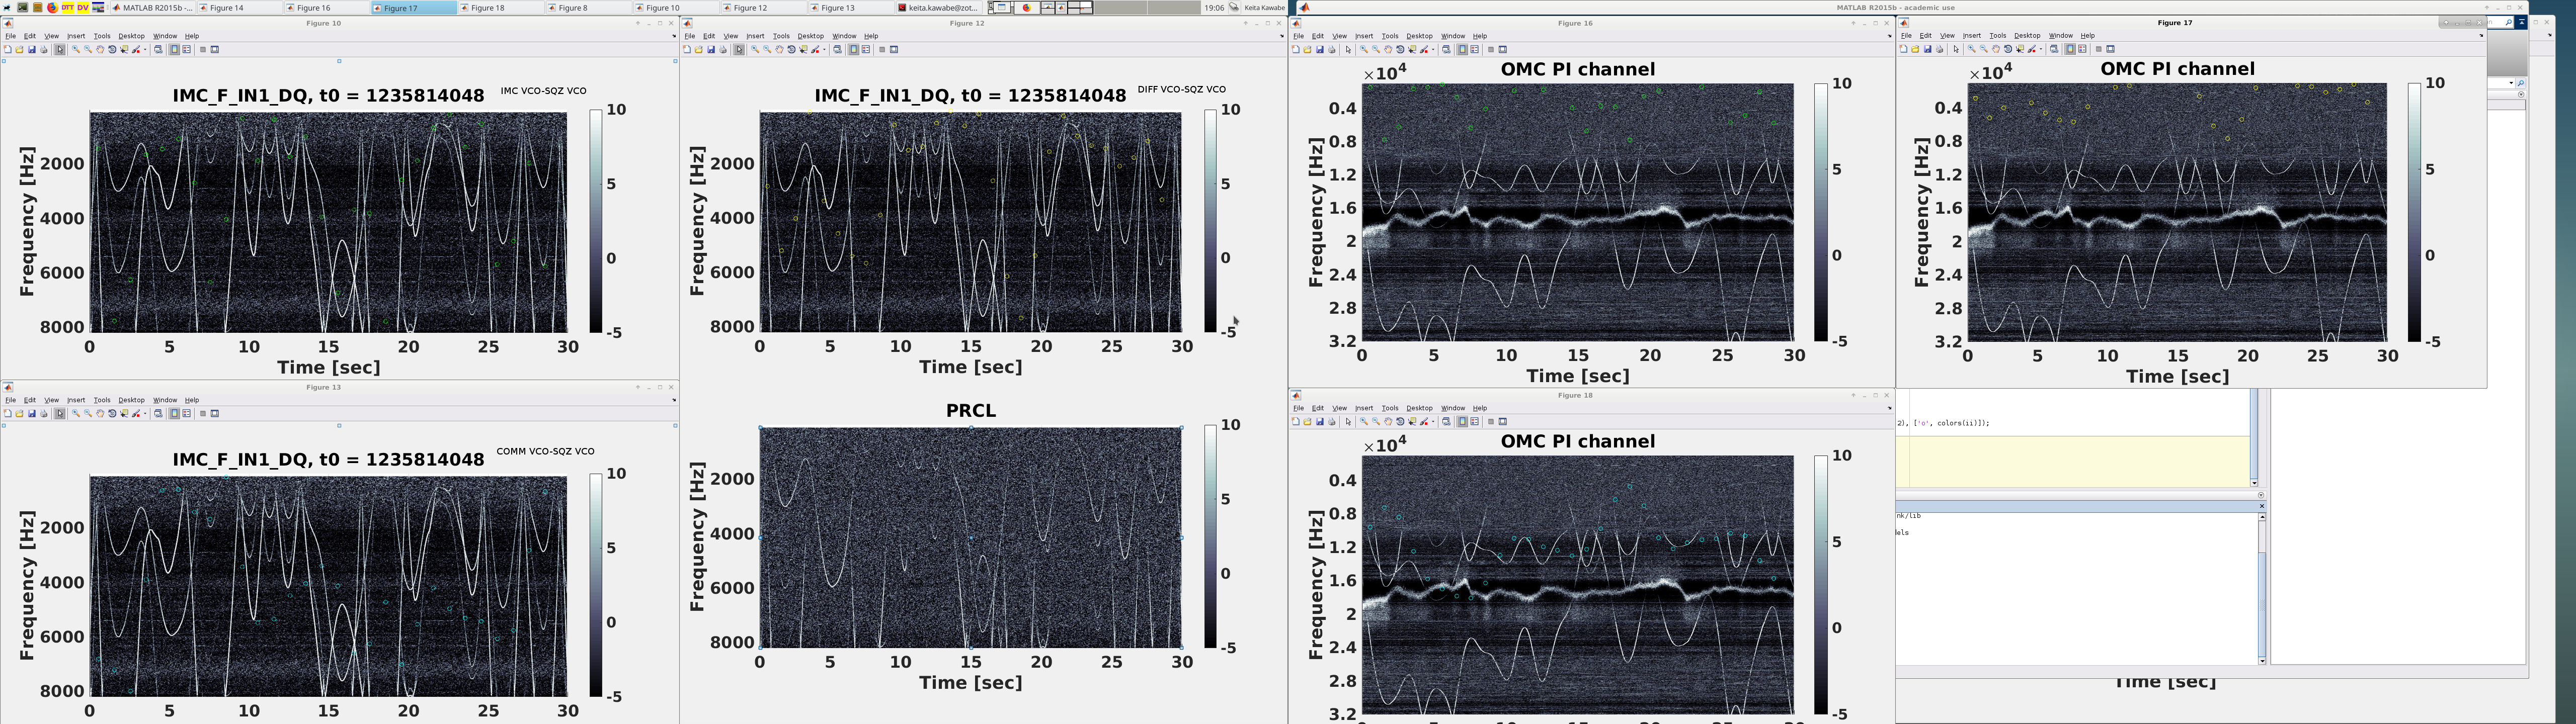
In the second attachment, IMCVCO - SQZVCO (green), diffVCO-SQZVCO (yellow) and commVCO-SQZVCO (cyan) might be correlated to weaker whistles in IMC_F but it's not as clear as IMC VCO and COMM or DIFF. These guys didn't look good on OMC PI channel.
What was done:
I took all available RF oscillator frequencies in the timing system and made differences between them. I discarded combinations that doesn't produce anything lower than 24kHz.
Anything larger than 8192Hz is aliased in the plotting on IMC_F, using 16384Hz sampling rate (but the only thing that was aliased is IMC-COMM).
Frequency counter measures the frequency once per second even though the channels are updated at 16Hz, so I just took the time stamp of the first updated value as the representative of the averaged frequency for the previous 1 second. Time axis was shifted by 0.5 sec due to this.
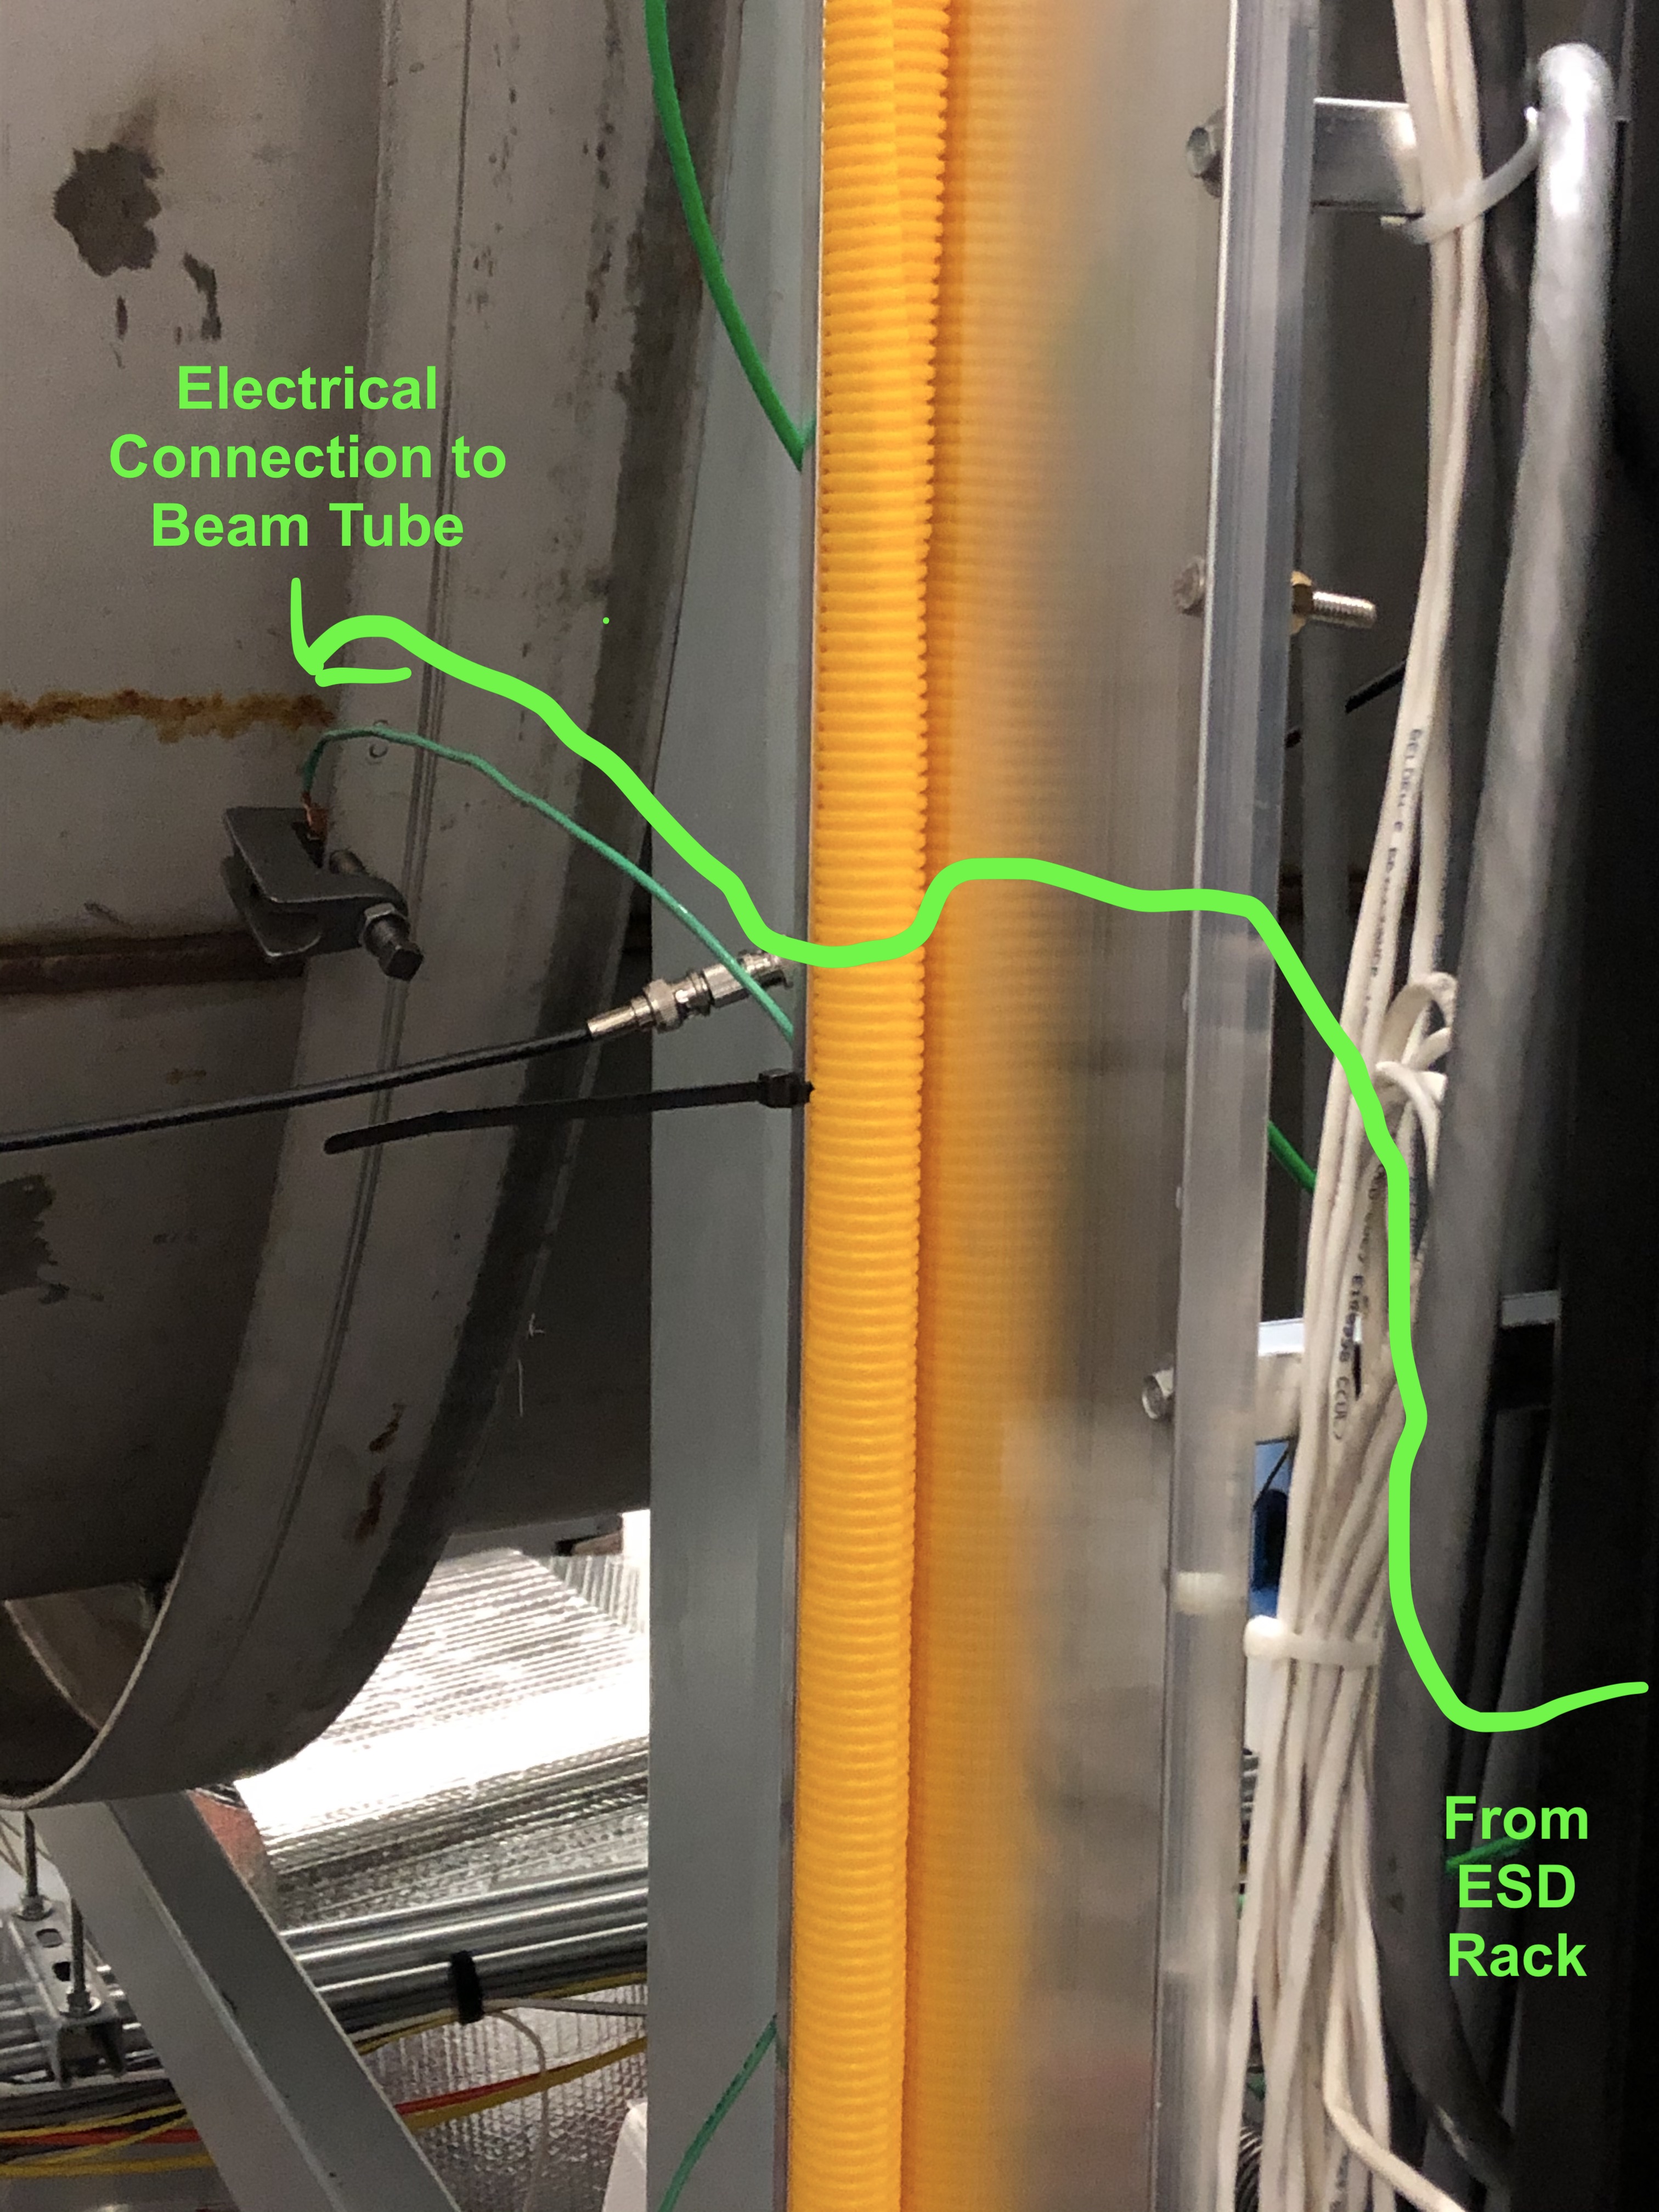
Filiberto, Ed, Richard, Rich A ETM-X ESD drive system has been floated from any connection to ground. After establishing that the whole system is floating WRT rack or building ground, we made a single connection to the beam tube as a reference point (see attached PDF diagram) Summary of Actions: I. For cable HI-SUS-ETMX-90 cut pin 8 (and unused pin is by accident) to remove a ground in the D1100809 AA Chassis Interface Board (CH I to 6) input connection. The actual cut was made in the gender changer on the front panel D 15 monitor output of the HV AMP. This cable is the HV monitor read back for the HV Amplifier Box. 2. Removed all rack ground connections in remote DC power supplies. The returns of all the DC outputs were previously connected to the rack/building ground 3. Connected the HV Amp & LV AMP to beam tube ground next to ESD rack. This is the single ground point for the ESD system 4. Installed dielectric breaks between rack and HV ESD amps 5. Verified entire ESD system is floating, then deliberately grounded to beam tube 6. Lifted cable shield connection on cable H1-SUS-ESD-5 at the LV Driver PI input connector (D-I 5) 7. Lifted cable shield connection on cable H1-SUS-ESD-6 at AA input (LV Driver monitors D-9) 8. Restored ground voltage mon (PEM) between beam tube & top of LV ESD Amp 9. Transitioned back to permanent ESD DC supplies in remote DC racks 10. Swapped HV preamp back to the one that was originally installed in EX so the 3RD IFO unit can be returned to the H2 building
Work done under WP 8112.
The ESD ground to the Beam Tube was chosen to get us as close to the OPTIC potential ground as possible. We know have equipment like the ring heater grounded in the chamber that is could create ground path concerns for us. This may not be ideal but after testing Robert has been doing seems like a good step.
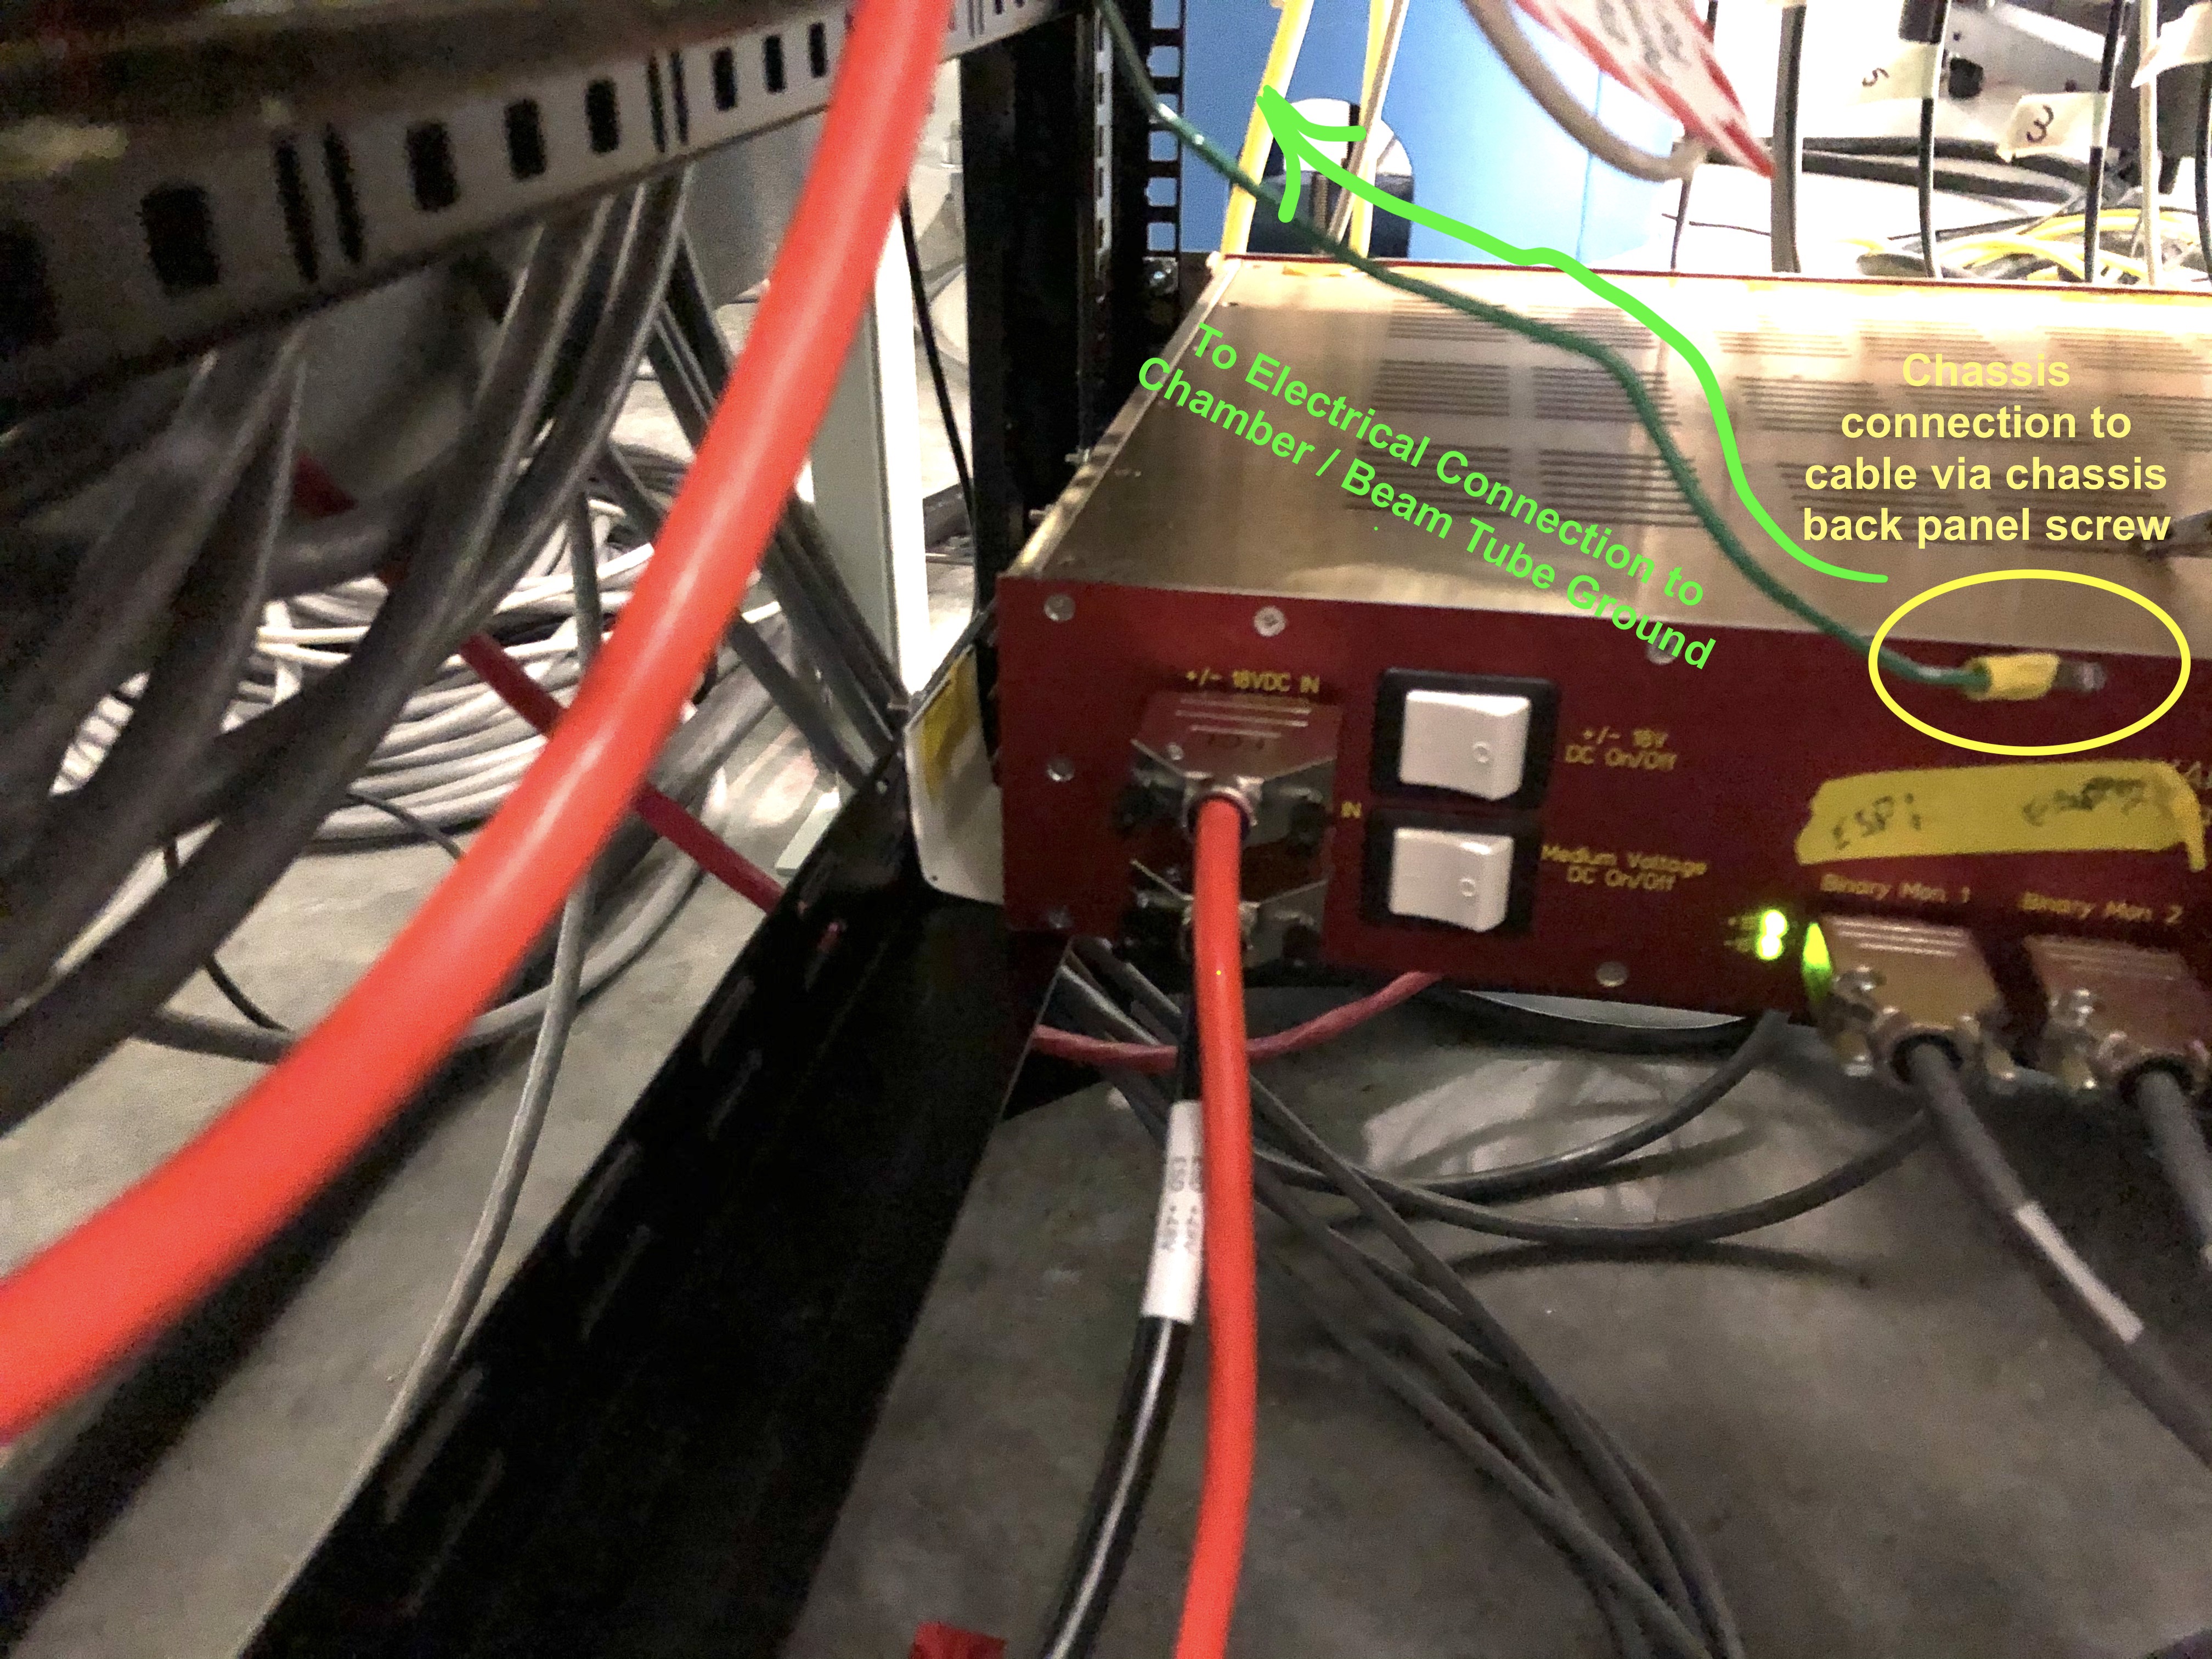
A *very* late entry, but the electrical shielding of the ESD driver chassis has come up recently again as we've found some evidence for excess electrical noise in August 2022 a la LHO aLOGs 64526 or 64478. As such I dug back through my pictures from Dec 2019, when I first discovered that this work had happened and/or that the electrical grounding of the ESD low-voltage driver chassis had been... "reconfigured" ... in this way. In 2019-12-10_H1SUSETMX_L3_ESD_Driver_Shielding_AtChassis, I show the connection to the low-voltage chassis. Note -- this cable from the low-voltage chassis goes up an electrically connects to the chassis of the UK high-voltage chassis as well before heading to electrically connect to the beam tube. This is not explicitly drawn in Rich's diagram above. While I haven't seen it with my own eyes, I've confirmed this with Fil, verbally, today (2022-08-23). In 2019-12-10_H1SUSETMX_L3_ESD_Driver_Shielding_FromRACtoChamber.jpg I show the connection to the chamber.
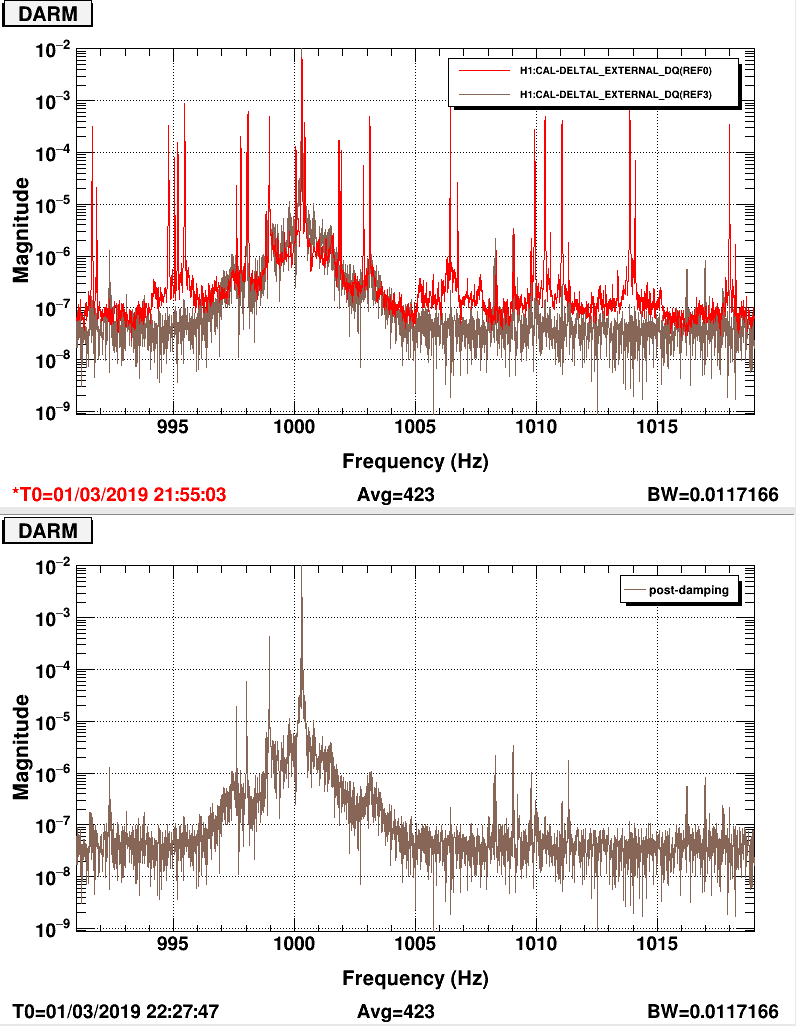
I examined a DARM spectrum with 0.0005Hz frequency resolution and used this to identify new second order violin modes, and more precisely determine the locations of previously identified modes. I have created both damping filters and monitor filters for the following violin modes: ETMX mode 11: 1006.439Hz ETMX mode 12: 1006.745Hz ETMX mode 13: 1010.356Hz ETMX mode 14: 1010.581Hz ETMX mode 15: 1011.063Hz ETMX mode 16: 1013.869Hz ETMX mode 17: 1014.091Hz ETMY mode 11: 1000.061Hz ETMY mode 12: 1000.423Hz ETMY mode 13: 1009.932Hz ETMY mode 14: 1017.985Hz ETMY mode 15: 1018.238Hz ETMY mode 18: 1000.294Hz ETMY mode 20: 1000.307Hz ITMX mode 11: 995.177Hz ITMX mode 12: 995.462Hz ITMX mode 13: 998.083Hz ITMX mode 14: 1001.843Hz ITMX mode 15: 1001.940Hz ITMX mode 16: 1002.859Hz ITMX mode 17: 1003.120Hz ITMX mode 19: 998.018Hz ITMY mode 11: 991.641Hz ITMY mode 12: 991.828Hz ITMY mode 13: 994.801Hz ITMY mode 14: 995.053Hz ITMY mode 15: 997.618Hz ITMY mode 16: 997.785Hz ITMY mode 17: 998.967Hz All of the damping filters are 0.1Hz wide, and all of the monitor filters are 0.02Hz wide. I have updated these modes in lscparams.py, and included the filter settings which have successfully damped the violin modes. There are a couple of damping filter settings which I have not tested as thoroughly as I would like to, and I have left these commented out in lscparams. There are also a couple of modes for which I, following Jenne's suggestion, left the maximum gain at a lower value than it could be set at, and included a higher value in a comment. I've updated the violin mode wiki to reflect these changes. The updated version can be found at: https://cdswiki.ligo-wa.caltech.edu/wiki/Violin_Mode_Table_v2 There are 32 second order violin modes, and we still do not know the corresponding test mass for 3 of them. These are at frequencies 998.825Hz, 1009.950Hz, and 1011.332Hz. ETMX, ETMY, and ITMY each have on of these modes on them. However, these 3 modes are relatively dormant, so are currently a low priority. We still have no consistently helpful settings for the damping filters on ETMY modes 18 and 20. But I have had success with mode 20 at 90 degrees, gain=2, and mode 18 at either 30 or 60 degrees, gain=2. Each of these settings seems to work individually, but not at the same time. Creating narrower damping filters might be wise for these 2 modes. We should exercise caution in damping ETMY modes 11 and 12, as these damping filters tend to very slowly drive up ETMY modes 18 and 20. I have begun to update the medm SUS_CUST_VIOLIN_OVERVIEW.adl to include the 2nd order modes, to the right of the first order modes. Attached is a spectrum of the violin modes before and after damping, taken during Friday's lock. A few modes remain undamped in the image because we lost lock before I did it.
In this lock, the damping for ETMY MODE 12 (1000.423 Hz) rang up ETMY mode 20 (1000.37 Hz). The settings that Kara suggested above worked well for damping mode 20 once I turned off the damping for mode 12. After a while I range up mode 18, (100.294 Hz), which I had a hard time damping. With acuation on pitch for mode 18, no phase shift and a gain of -2, it seems to be damping both mode 18+20. If we can use the same settings to damp both of these, that will be a much easier solution than trying to make two different filters.
ITMX mode 13 (998.083 Hz) also range up ITMX mode 19 (998.018 Hz), the settings that Kara suggested for mode 19 in the guardian (90 degrees, positive gain) damped it well, but rang up MODE 13. I made a narrower filter for MODE13 (50mHz wide instead of 100mHz). It seems to have damped well without ringing up mode 19 with a gain of 2 and -60degrees of phase, actuating on pitch. The mode19 filter probably needs to be made narrower as well.
I've set the gains for both ETMY MODE12 and ITMX MODE 13 to zero in the guardian for now.