Displaying reports 42941-42960 of 88648.Go to page Start 2144 2145 2146 2147 2148 2149 2150 2151 2152 End
Reports until 02:18, Monday 25 February 2019
H1 ISC (ISC)
craig.cahillane@LIGO.ORG - posted 02:18, Monday 25 February 2019 - last comment - 20:03, Monday 15 April 2019(47113)
Modulation Depth Measurements
Craig, Georgia

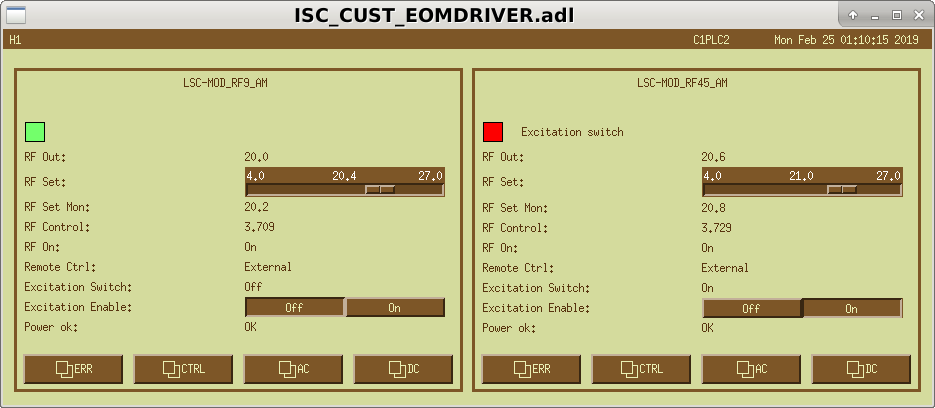
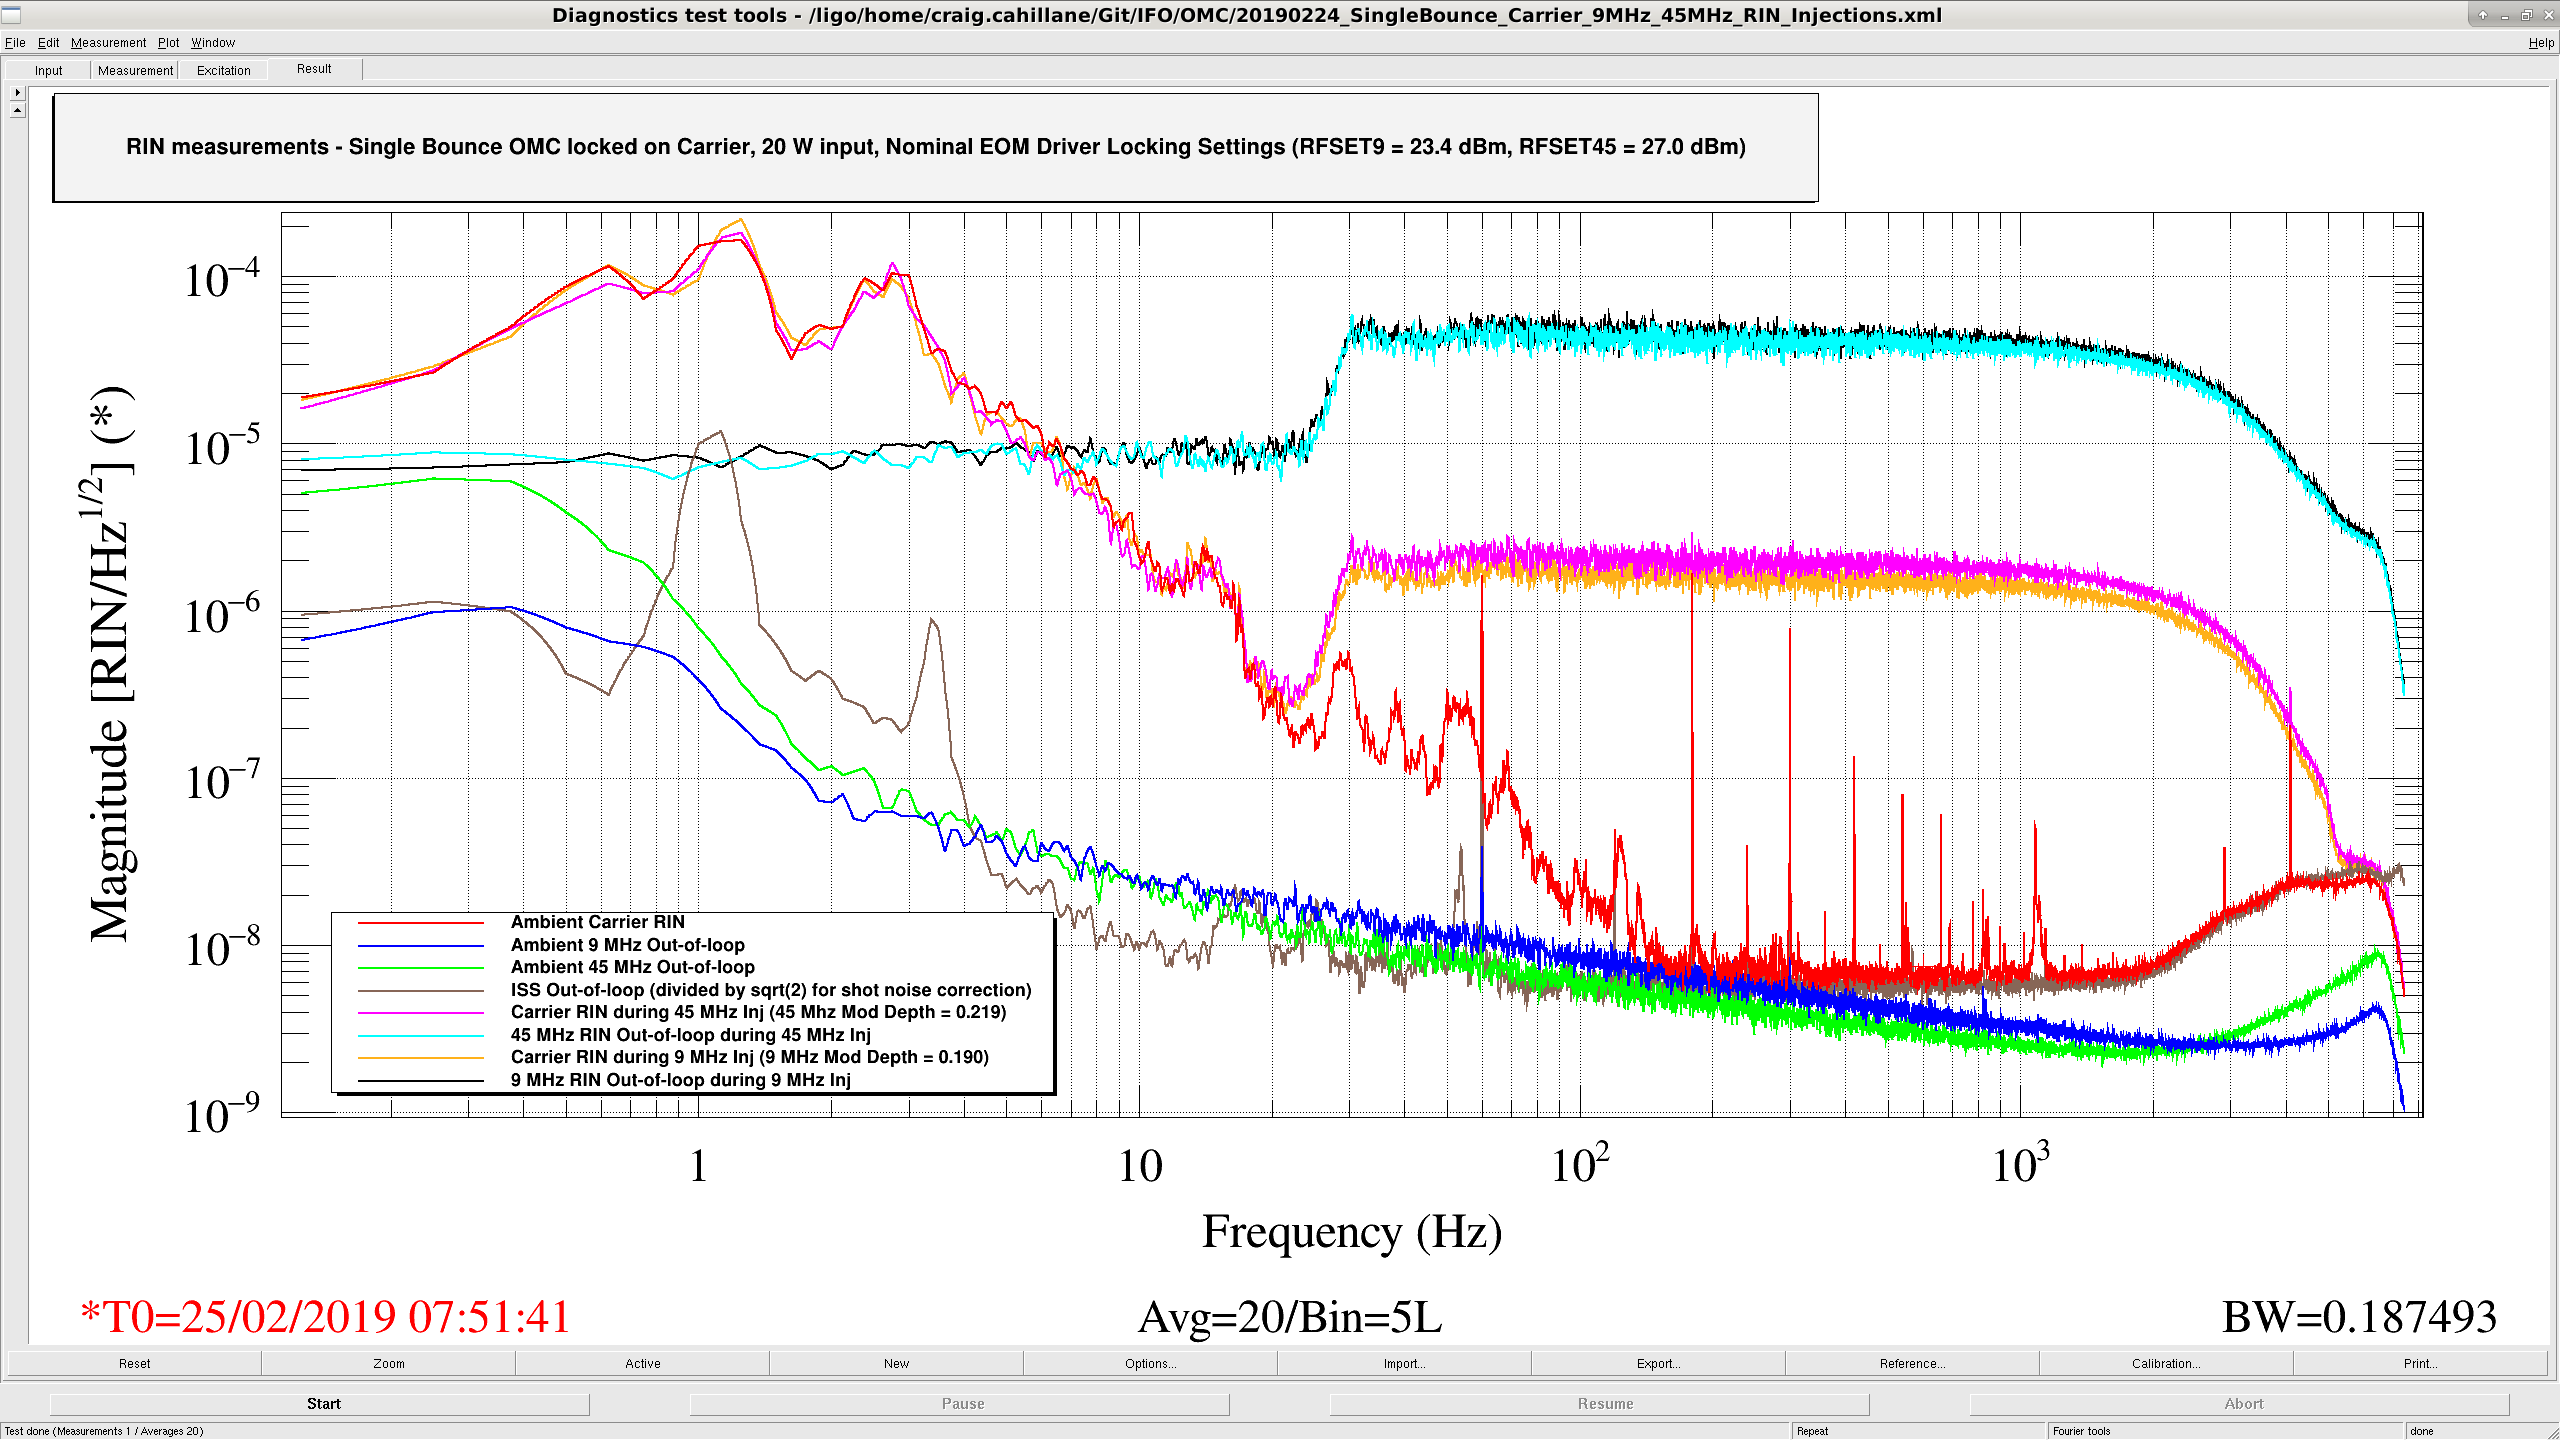
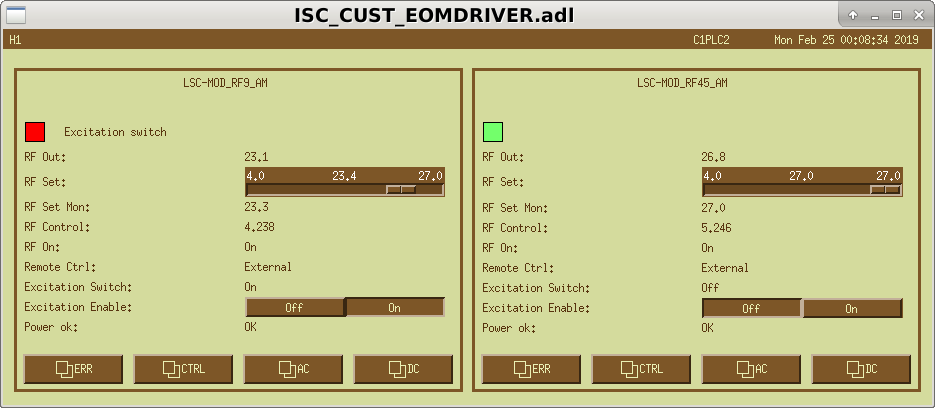
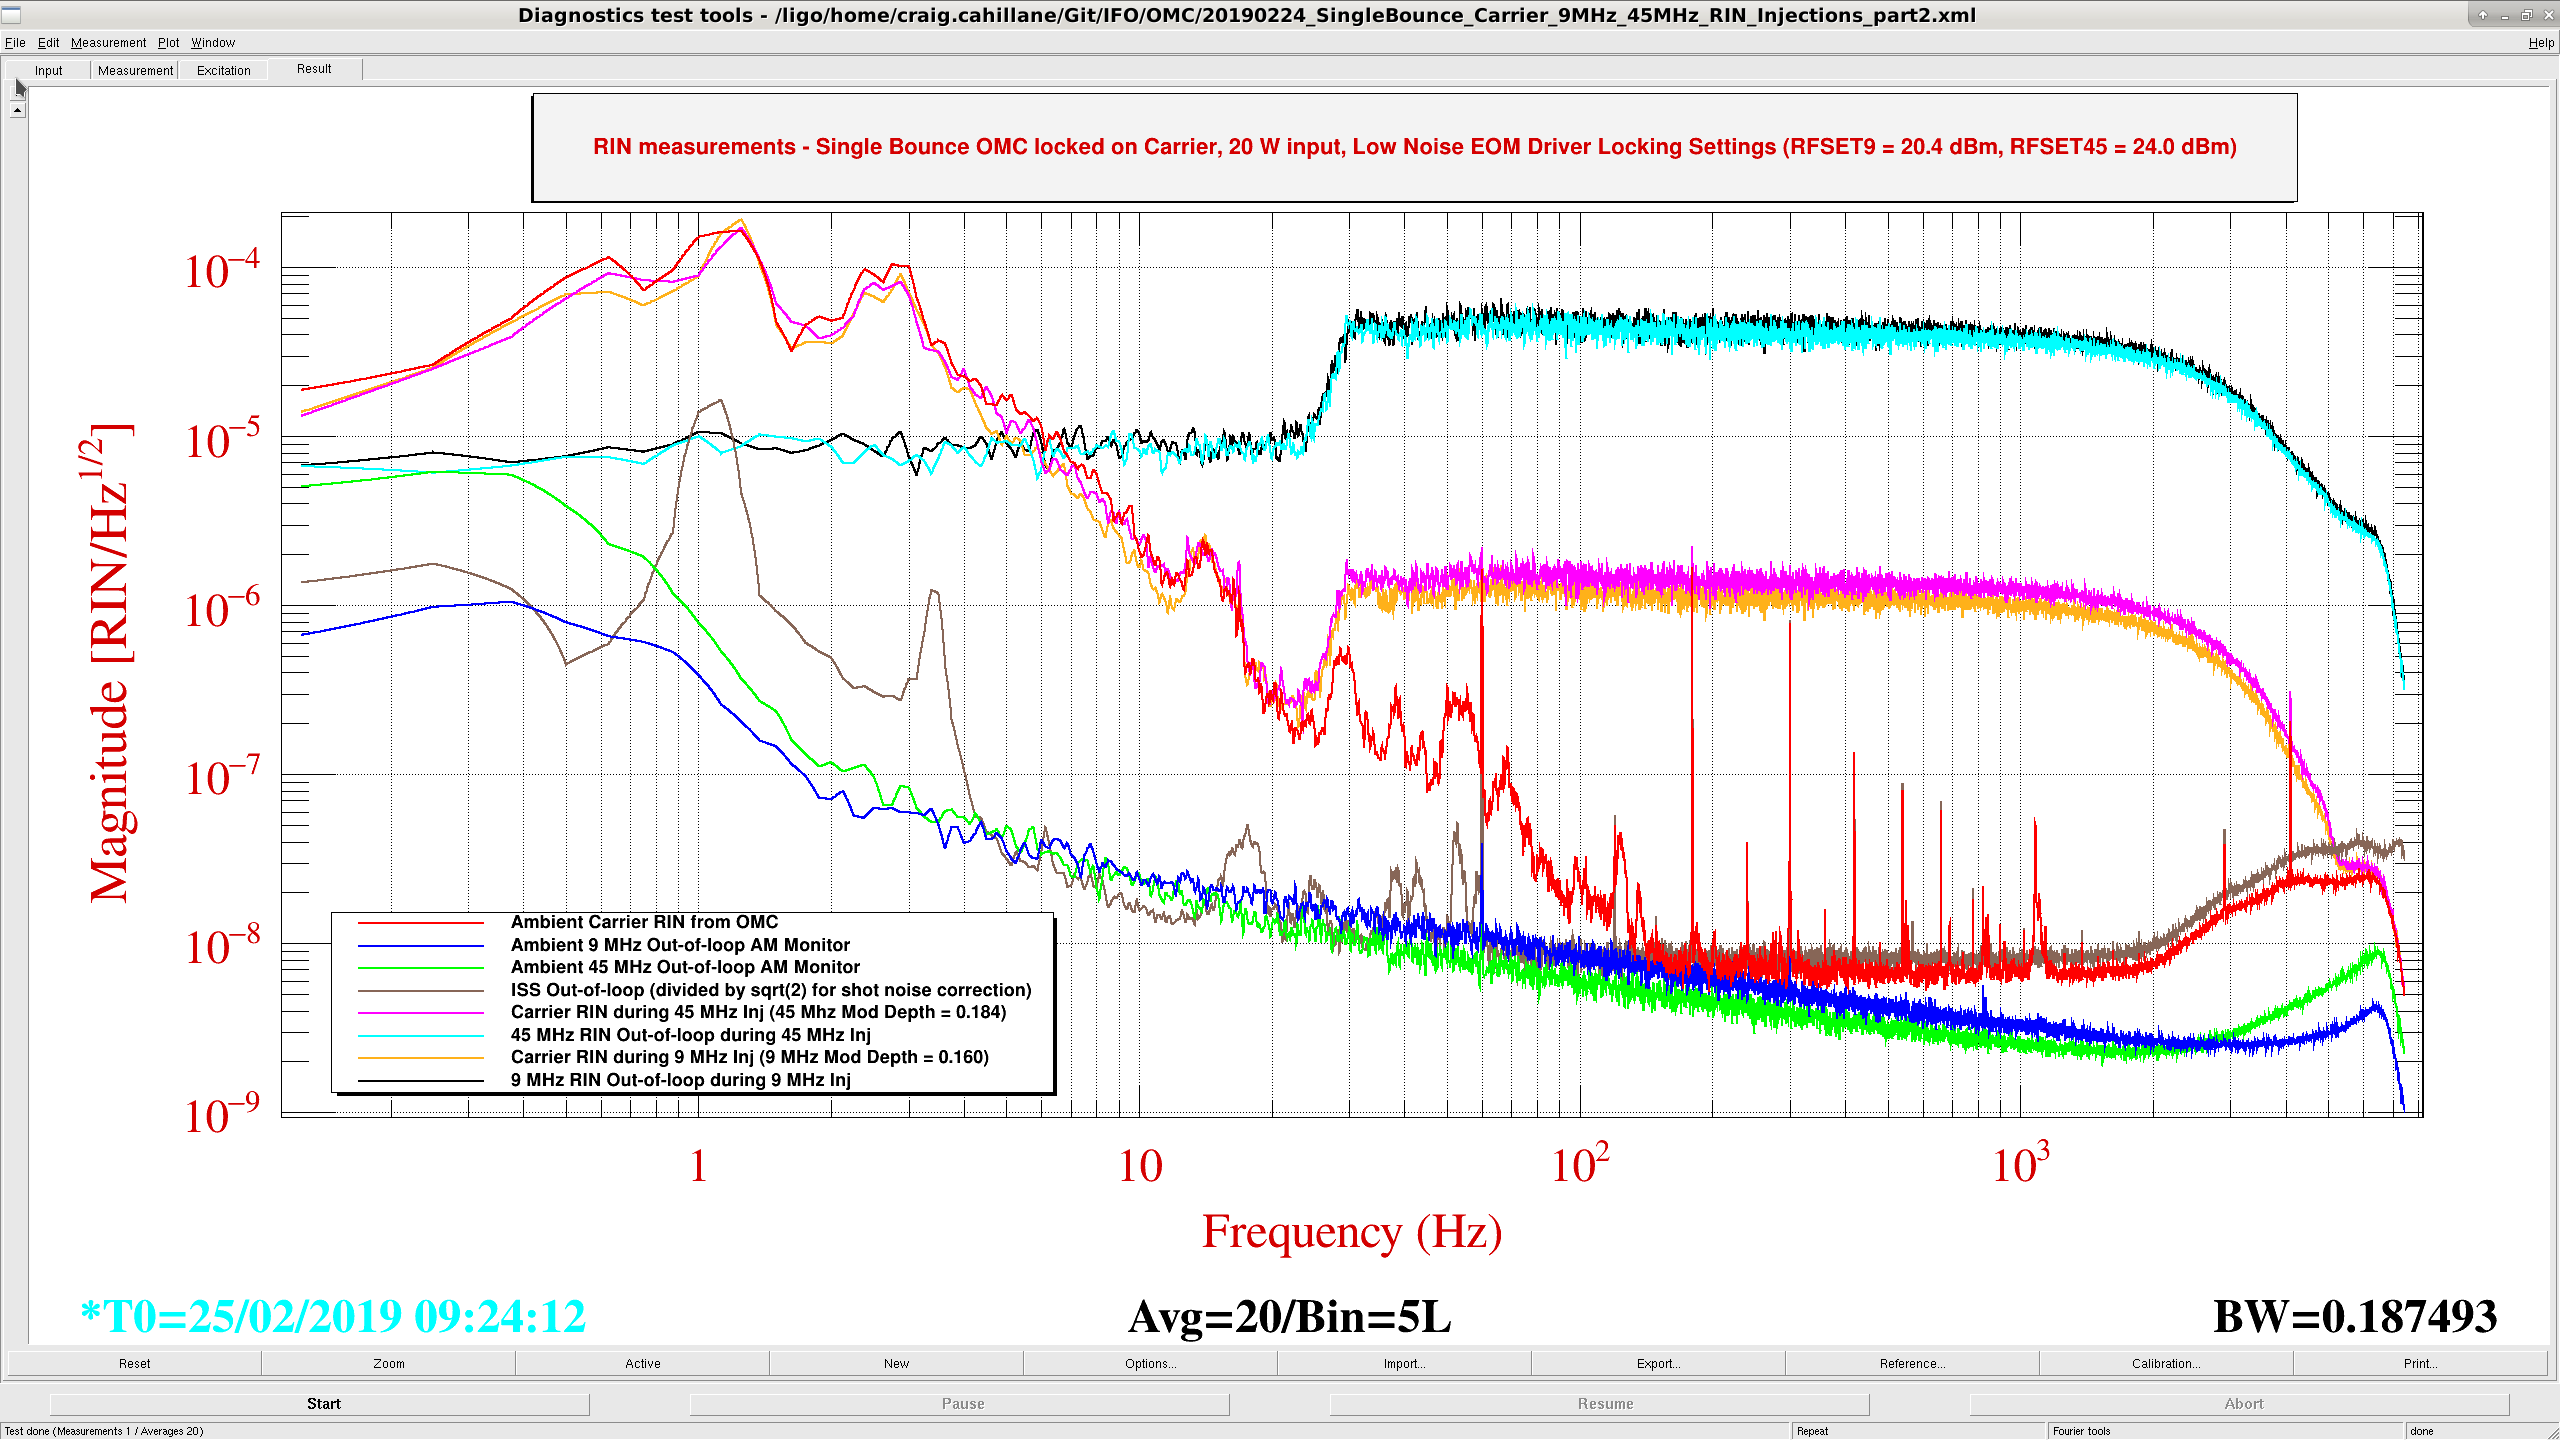
Today we locked the OMC on single-bounce carrier with 20 W input and injected large sideband intensity noise to measure the modulation depths for locking and low noise settings.

Results

Sideband     Locking EOM Driver Slider Value [dBm]     Low Noise EOM Driver Slider Value [dBm]     Locking Mod Depth     Low Noise Mod Depth
---------------------------------------------------------------------------------------------------------------------------------------------
9 MHz                                   23.4                                        20.4                       0.190                   0.160
45 MHz                                  27.0                                        24.0                       0.219                   0.182


Method
A simple comparison of the carrier and sideband RINs when injecting.  

RIN0(f) = Γ2 RINsb(f)

We know that we can trust the 9 and 45 MHz RFAM monitors when we inject high broadband noise in the EOM driver.  
At the same time, if we inject enough sideband RFAM, the carrier RIN should show through in the OMC transmission.

All injections were amplitude=10, ellip("BandPass",4,1,30,5000) through the LSC EXTRA AO 3, which is connected to the front of the drivers.

Reason
We've been running several 9 MHz RIN tests.  It is good to know, for some high level of sideband RIN, the level of carrier RIN we expect. 

Old EOM Driver alogs
Koji installation
Daniel boost 
Images attached to this report
Comments related to this report
craig.cahillane@LIGO.ORG - 20:03, Monday 15 April 2019 (48515)
These numbers are likely wrong because we cannot trust the calibration of the RFAM monitors when we move the sliders away from nominal.

Math
I double checked the math here, I think there is a factor of -2 missing:

If P0 = Pc + 2 Ps, where P0 is initial power, Pc is power in the carrier, and Ps is power in a single sideband.  If we require P0 to be constant, then taking the derivative wrt modulation depth gives
dPc = -2 dPs

Pc = J0(Γ)2 P0 ≈ P0
Ps = J1(Γ)2 P0 ≈ Γ2/4

RINc = dPc/Pc
RINs = dPs/Ps

RINc = - Γ2/2 RINs

H1 SUS (ISC, SUS)
georgia.mansell@LIGO.ORG - posted 23:25, Sunday 24 February 2019 - last comment - 09:40, Tuesday 26 February 2019(47109)
IX reaction chain SD OSEM not responsive

Craig, Georgia

This afternoon we could not make it through ENGAGE_DRMI_ASC without (1) the verbal alarms saying that IX had saturated, and (2) a 0.5 Hz oscillation ringing up when the beamsplitter oplev servo was turned off.
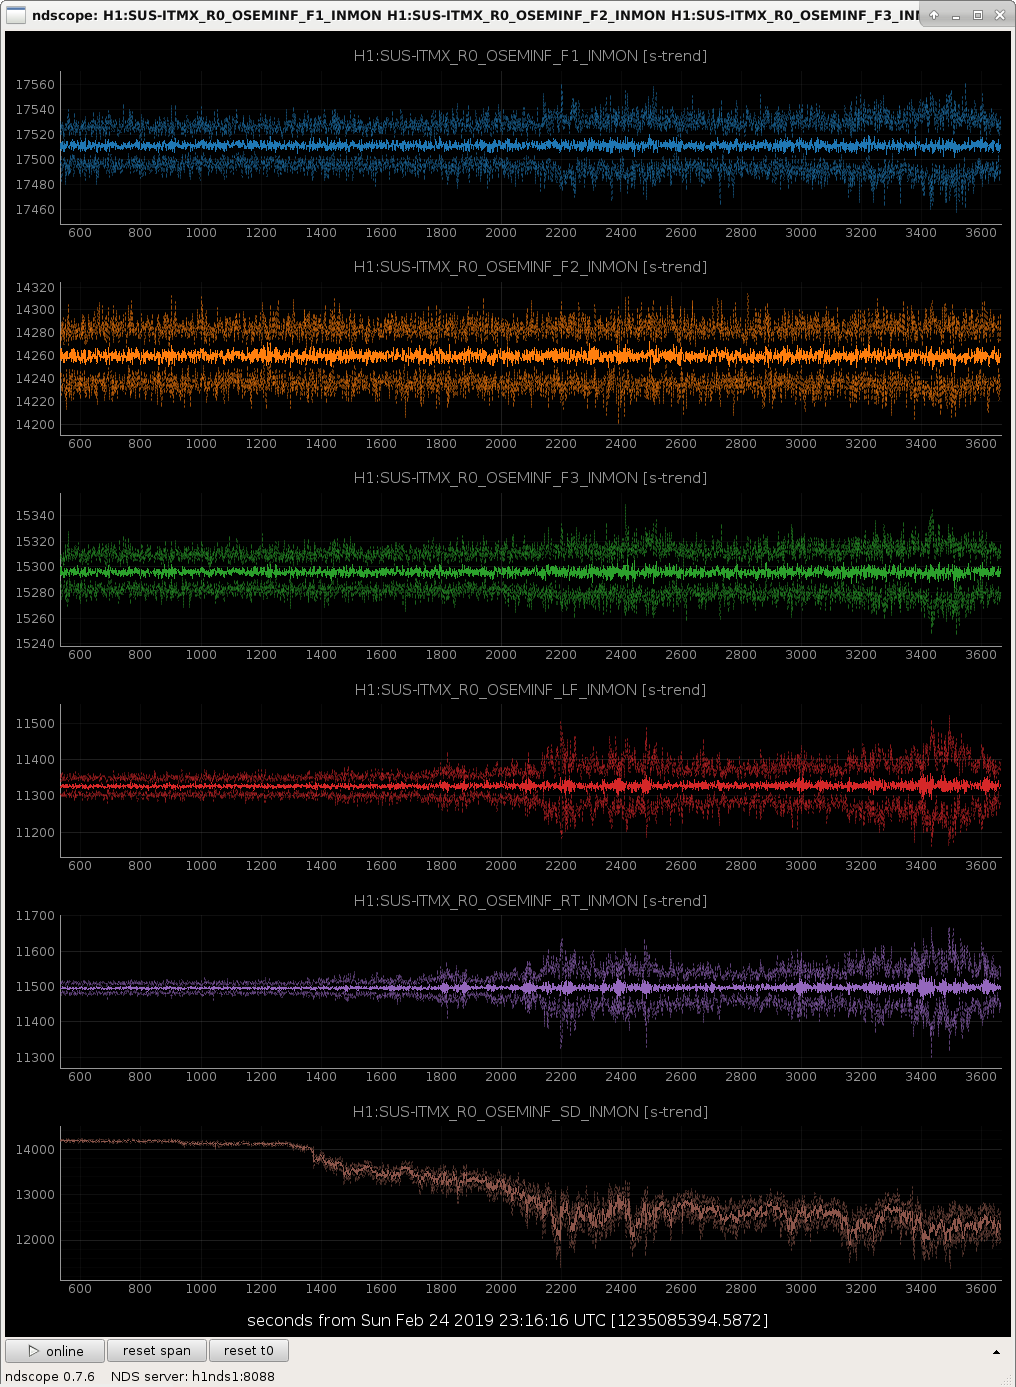
This first problem was baffling since nothing should be feeding back to IX at this early stage in the lock acquisition sequence. We had a look at the ITMX top mass (M0) and reaction chain (R0), and found some strange behaviour on the reaction chain OSEMs. Before we had begun working on alignment this afternoon, while the interferometer was just sitting trying to lock the arms in green, the sensor input of the SD (transverse) OSEM had plummeted, and the noise on the other OSEMs (particularly LF and RT) had increased. First attachment shows inputs to the R0 OSEM input filters at this time. Second attachment shows M0 and R0 master out signals (bottom 3 rows are R0) which go to the coil drivers.

I had a look at the M0 and R0 channels for the other test masses and didn't see anything similar.

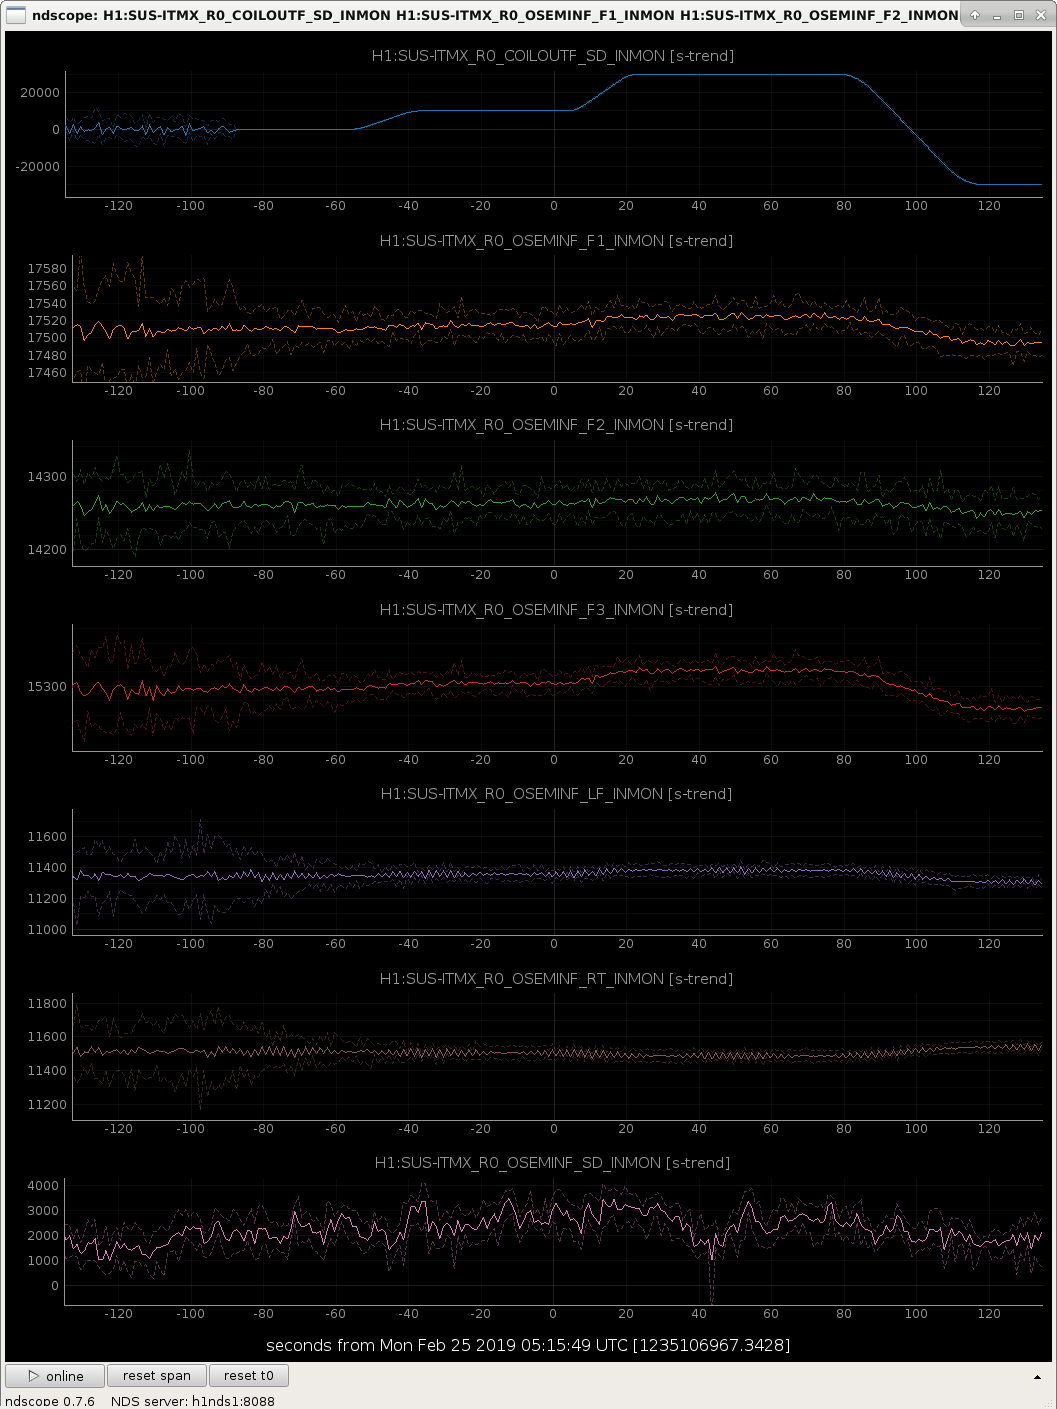
We tried adding positive and negative offsets in the test filters, which adds an offset to the coil driver and should be seen in the sensor. We expected that if the we were close to the edge of the shadow sensor, an offset in one direction would be visible in the sensor. Our offsets were not seen in the SD sensor (though there was some coupling to the other sensors) as shown in the third attachment. Does this suggest that the light source for this particular OSEM has died? Or are we missing something?

We also noted that when turning off the damping feedback to this sensor the noise in the other sensors was reduced (visible early in the time series in the third attachment). We have left this feedback off, and managed to reach lownoise_length_control without a problem.


(We never solved the 0.5 Hz oscillation problem when engaging DRMI ASC. We had resolved let the IFO lose lock at this step and work on single bounce RF9 modulation problems, when for no apparent reason we succeeded in locking, got up to lownoise_length_control, and lost lock due to a 4.7 Hz ETMX L2/L3 oscillation that caused many locklosses yesterday.)

Images attached to this report
Comments related to this report
rahul.kumar@LIGO.ORG - 13:54, Monday 25 February 2019 (47121)
An FRS ticket (no. 12410) has been created to look into this issue, the link is given below,

https://services.ligo-la.caltech.edu/FRS/show_bug.cgi?id=12410
richard.mccarthy@LIGO.ORG - 09:40, Tuesday 26 February 2019 (47127)

The channel was responding but was not healthy. Following the signal chain out of the Coil driver to the AA chassis showed healthy signal.  Out of the AA chassis to the ADC also looked good.  Disconnecting the AA from the ADC showed a -12000 count offset.  Dave B. and I then shut down the computer and IO chassis.  Brought the system back up and everything seems to be fine.  We will have to keep and eye on this.

H1 ISC
georgia.mansell@LIGO.ORG - posted 18:30, Sunday 24 February 2019 (47108)
ALS X glitchiness

Craig, Georgia

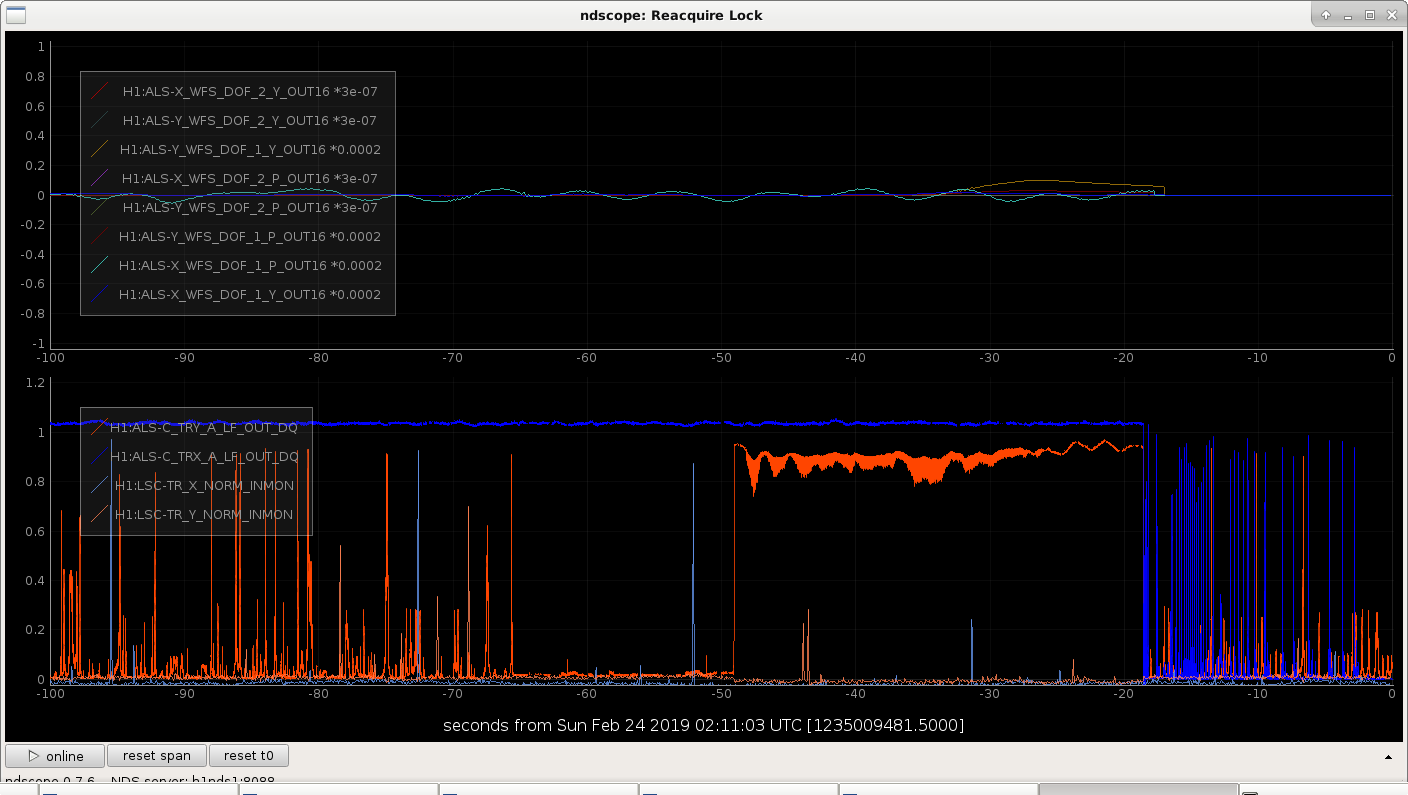
This afternoon we had some problems locking the X arm in green. We found it would acquire, lock briefly, then lose lock after a few seconds, similar behaviour to what I saw back in January. We spent a while adjusting alignment, tried toggling the noise eater, locking without the WFS, finally Craig adjusted the PDH locked gain. When he set it back to its nominal value (4), a few things happened within a second:

I don't understand why locking would cause the power from one of the laser diodes would change, or why this particular lock worked out. Is it a coincidence and the laser just happened to hop out of a mode-hopping region?


Images attached to this report
H1 ISC
sheila.dwyer@LIGO.ORG - posted 23:53, Saturday 23 February 2019 (47105)
DARM loop

Today I think that we had 3 locklosses due to a DARM crossover instability, although I am not entirely sure that is what happened.  

Daniel had suggested leaving the PUM out of the DARM loop would be a way to simplify things.  The last lock tonight I tried to transition DARM to the EY UIM +EX ESD with a crossover around 7 Hz, which worked.  I think that this would have been acceptable for range on the ITM ESD if I had increased the crossover to about 10Hz and added a boost to the UIM.  The crossover should be unconditionally stable and the partial measurement I got matched the model well.  

This crossover required turning off the bounce mode notch on the UIM which I thought might be OK now that we have bounce roll dampers, I had tried turning off the notches friday while we were locked with the usual DARM actuator which was OK.  Tonight after about 15 minutes with the higher UIM cross over the bounce mode rung up, I transitioned back to EX UIM with the lower crossover.  When I then tried the ESD transition as it is in the guardian I lost lock.  

It would be helpful the next time people lock with DARM on the low noise ESD ETMX to measure the PUM crossover to lower frequencies than I have. There is a template with references /sheila.dwyer/LSC/DARM/PUM_crossover.xml     It would be nice to get this measurement down to 3-4 Hz to see the instability frequencies. 

H1 SQZ
sheila.dwyer@LIGO.ORG - posted 21:44, Saturday 23 February 2019 - last comment - 13:20, Sunday 24 February 2019(47104)
squeezer ASC signals look good

I did a little work on the squeezer ASC today, although I haven't gotten to close any loops because we have been having lots of locklosses.  

With anti squeezing injected, I phased the signals into I, which doesn't matter since we take the quadrature sum of I and Q, but it makes it easier to watch what is happening.  The settings for the WFS matrices were wrong, now that I fixed them the signals respond as we would expect.  It looks like the output matrix that Haocun found for the DC loops will work well for the 42 signals as well, with the pos loop controlling AS A and the ANG loop on AS B. 

The squeezer automation has worked well today, in most locks the squeezing is injected and locked automatically.  One time the LO loop was not locking, and I had to reduce the LO IN1 gain from it's usual 7dB to -3dB, the loop locked, and I was able to step the gain back to 7dB.  


Comments related to this report
nutsinee.kijbunchoo@LIGO.ORG - 13:20, Sunday 24 February 2019 (47107)

FYI: The Inject Squeeze guardian on the ISC_LOCK will move on without closing the loop if RF3 level is below -25 dBm (if I remember correctly). When this happens it's an indication that we should check our alignment (or lock by hand if we have enough 3MHz signal).

H1 PSL
sheila.dwyer@LIGO.ORG - posted 21:35, Saturday 23 February 2019 - last comment - 08:44, Sunday 24 February 2019(47103)
FSS oscillation threshold

The guardian that toggles the FSS gain when it is oscillating has not been toggling it, which is why it has sometimes been taking a long time to lock the FSS and IMC.  The reason it wasn't working was that it relies on H1:PSL-FSS_OSCILLATION to check if the FSS is oscilating, which wasn't working.  I reset the threshold for that from 5V to 0.2V, and now the guardian is toggling the common gain to relock the FSS as it was meant to.  

Comments related to this report
peter.king@LIGO.ORG - 08:44, Sunday 24 February 2019 (47106)
Sorry, I forgot to change it back when I was checking things on Friday.
H1 ISC
jenne.driggers@LIGO.ORG - posted 19:33, Saturday 23 February 2019 - last comment - 21:39, Saturday 23 February 2019(47101)
Moving ITMY spot position changes 9 MHz RIN coupling

[Jenne, Dan, Sheila, Alexei]

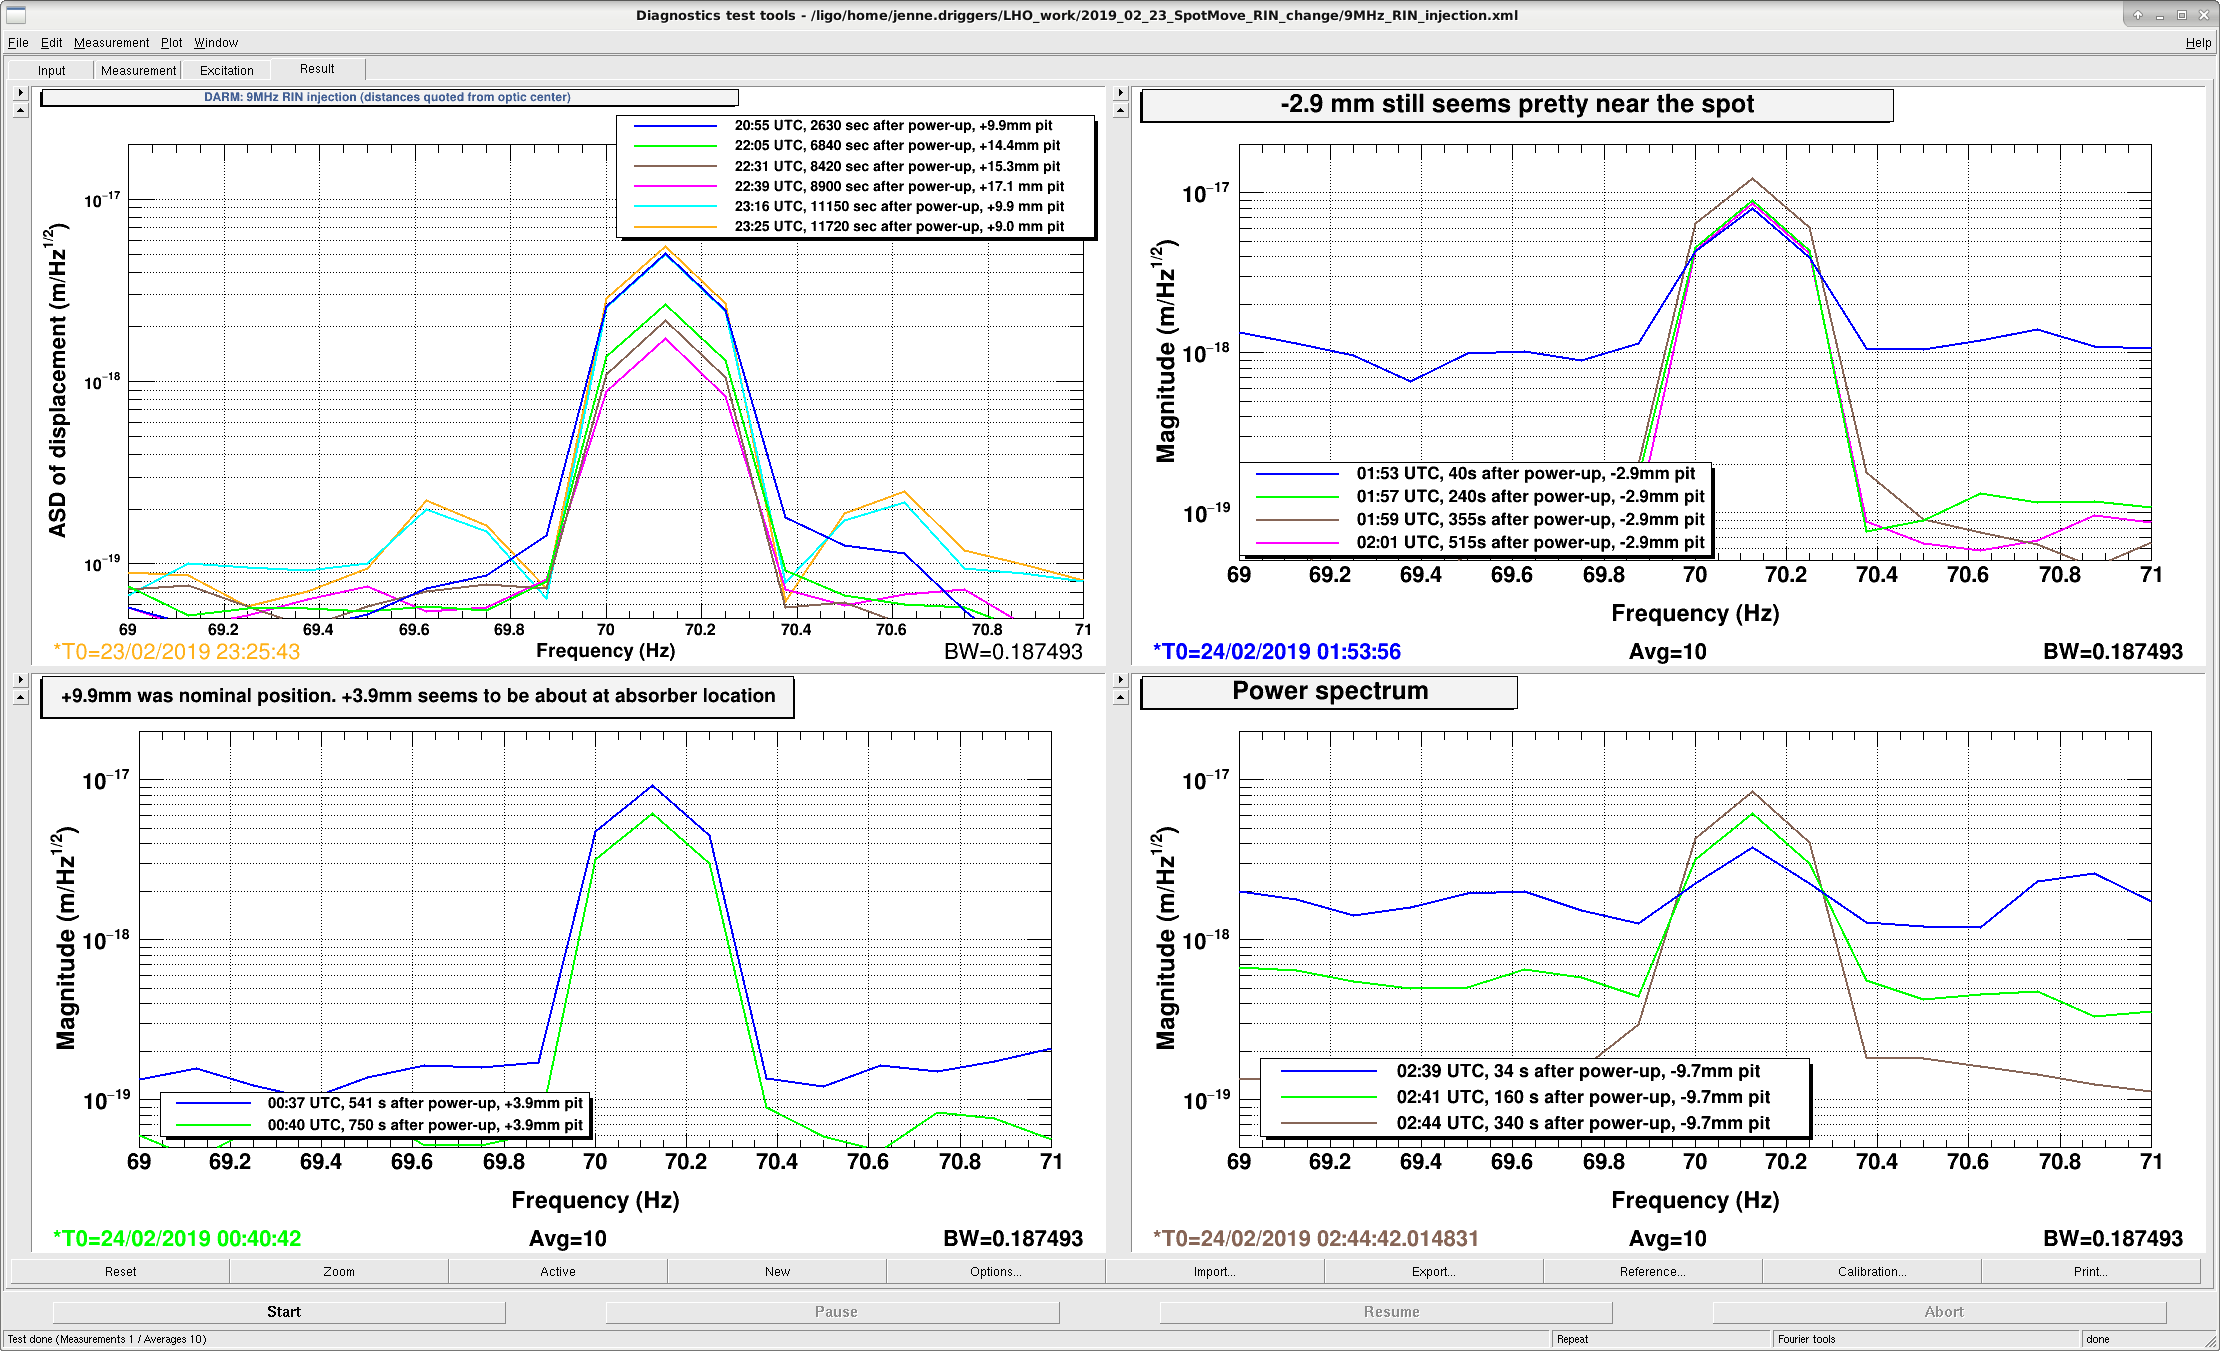
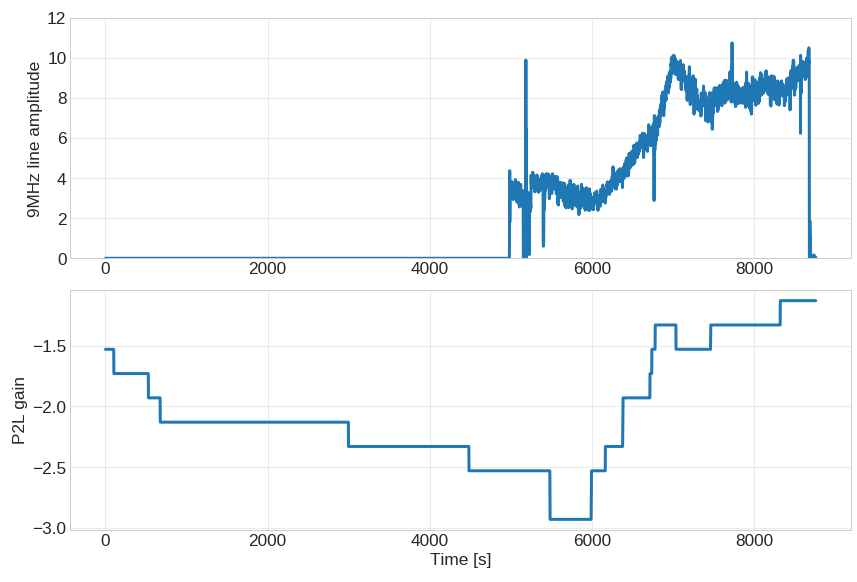
Today we've been moving the ITMY spot position around by changing the L2 P2L gain. It seems that we can repeatably change the coupling of the 9 MHz RIN (as measured by the 70 Hz line injected into the RFAM stabilization box) when we move the spot. 

Dan has been watching the ITMY HWS, and noted that the first lock, I was moving away from the point absorber when I was moving farther from the center of the optic.  Then, we decided to try to 'jump' over the point absorber, and get closer to the geometric center of the optic.  The next 2 locks seemed like we were very nearly on top of the absorber, and the ASC system did not like that.  Also, our buildups (arm circulating power and POP18) were much worse when we were on top of the absorber.  Now we're trying to move even farther from the center of the optic, to be much farther from the point absorber.  So far, this is bringing the buildups back up, however we'll need to move the PRC cavity axis to move the POPX spot.  The POPX PZT was starting to rail in pitch during our most recent lock, and will get worse if we continue to move the ITMY spot. 

In the attached screenshot, I've got the RIN injection peak, as measured by DARM, at several points in time during these locks.  The upper left plot is the first lock where I went up in pitch and things were getting better, but we were getting quite far from the center of the optic. 

The lower left plot and upper right plots are attempts to go below the point absorber, but we seem to have been very nearly on top of it.  Both of these locks were very short, and they seemed like ASC problems.

The lower right plot is much farther below the center of ITMY.  At this location, the buildups were getting better, although not yet as good as they were during the first lock.  Also, the RIN coupling was lower than the middle 2 locks, also indicating that we're starting to get farther from the point absorber.  This last lock was lost during the Lownoise ESD ETMX transition.

Next steps are to see that the latest position on ITMY is in fact good over a long lock stretch, and move the power recycling cavity axis so that we can try moving even farther on ITMY.  I'd like to also see if there is any advantage to moving the spot position in yaw, to be as far as possible from any of the small point absorbers that are also on ITMY.  Once we've found a good place on ITMY, we should check to see if we can get better buildups in the arms by moving the spots on the ETMs to match this new ITM position. 

The ITMY spot position is defined by the A2L gain.  So far today, all I've changed is H1:SUS-ITMY_L2_DRIVEALIGN_P2L_GAIN.  It started the day at -1.33 (and is currently at +3.00), so if there are problems relocking, check that and consider setting it back to it's old value.

Images attached to this report
Comments related to this report
daniel.brown@LIGO.ORG - 21:39, Saturday 23 February 2019 (47102)

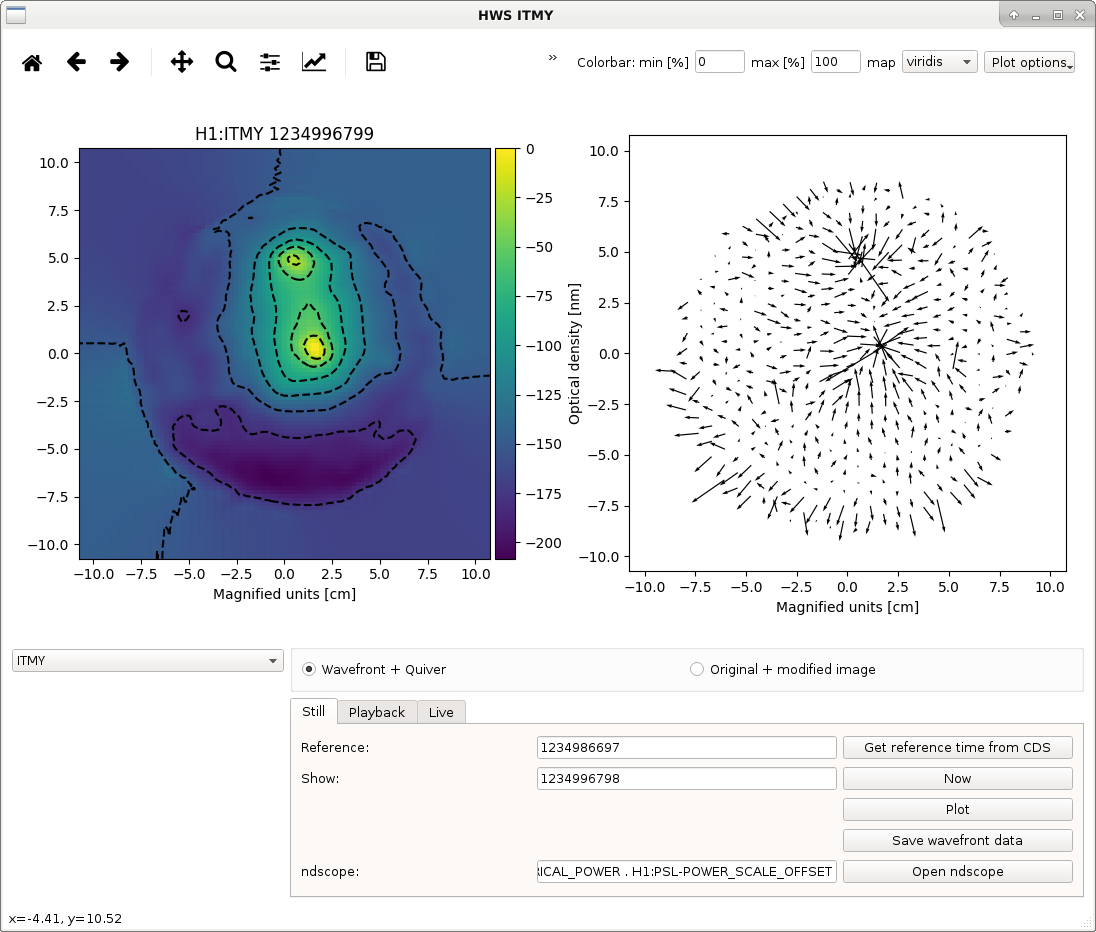
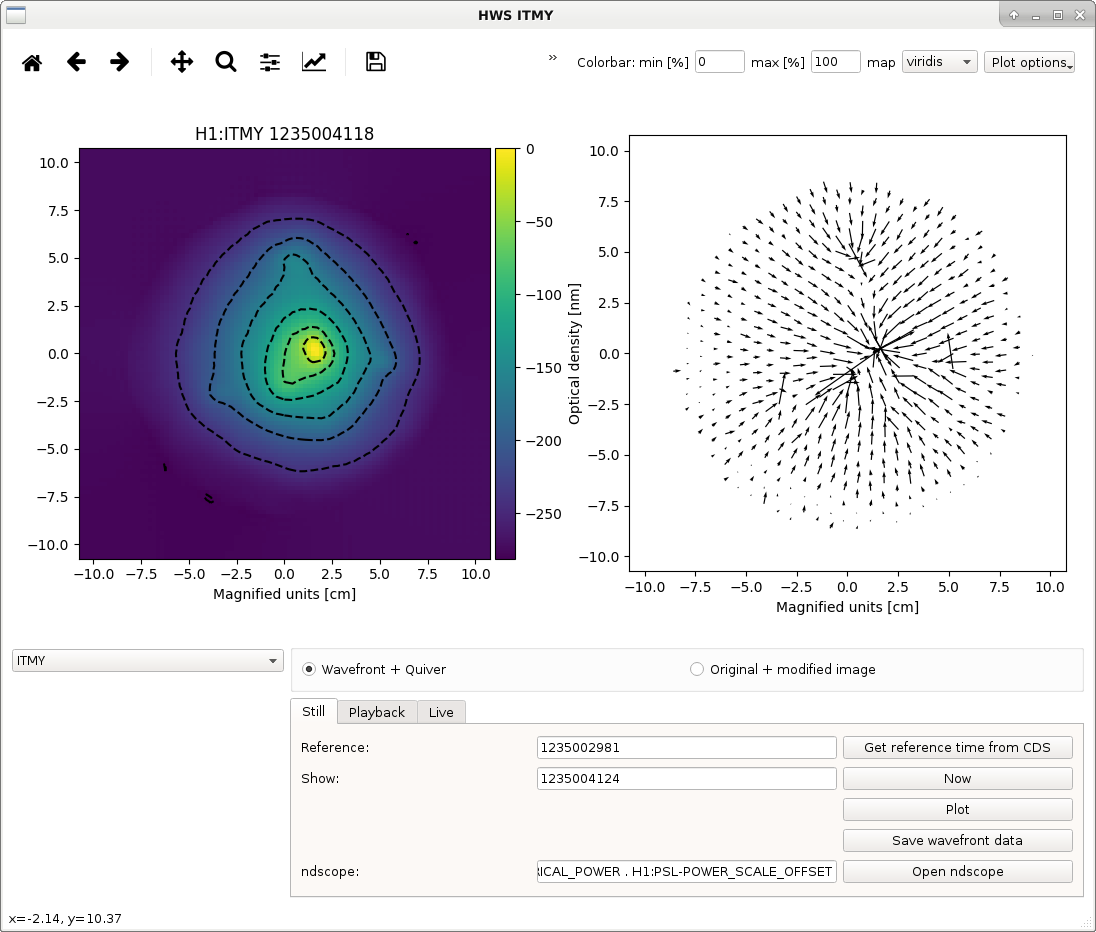
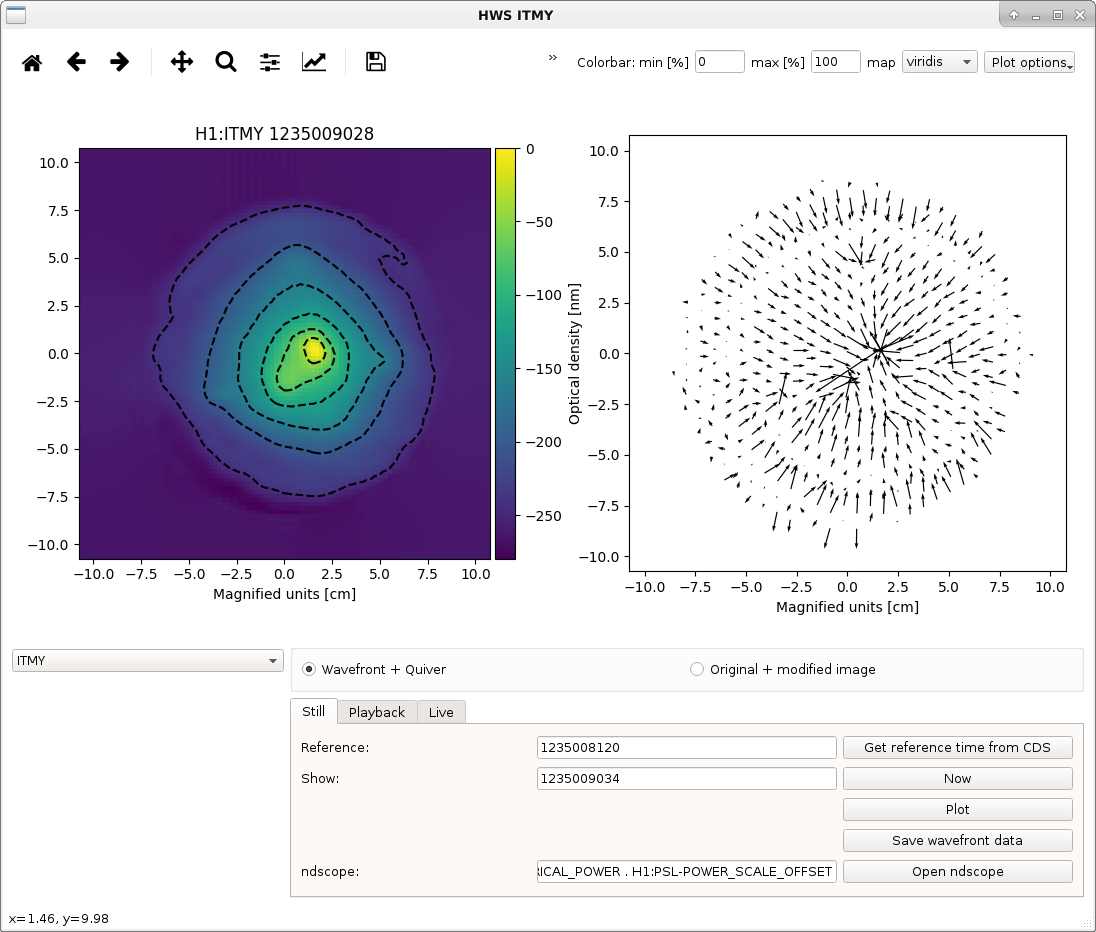
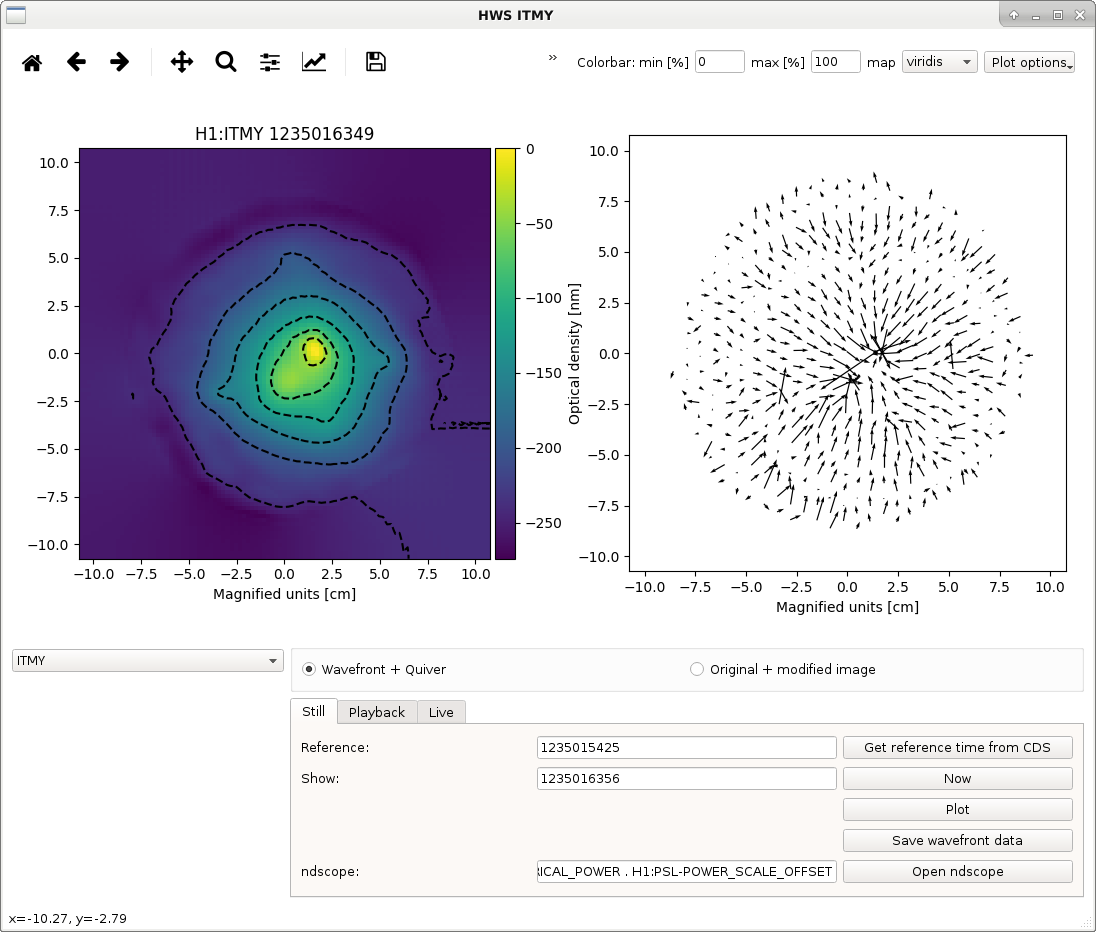
Here are some HWS images from our spot moving today. Initially we moved up to 17mm, here we can clearly see that the topmost point absorber is getting hot. The other images show the spot position moving down, 9.9mm image is the nominal position. Images for the P2L gains of 1.5 and 3 are also attached. If you flick through them you can see the absorption of the beam gradually shifting down. We were hoping to get over the main point absorber with the P2L gain of 3 however the IFO did not like this spot position. DARM spectrum was particularly bad when we finally locked, there appeared to be a lot of additional frequency noise too. The lock didn't last too long so we put the P2L back to the nominal value.

The longest lock we had was when we moved the beam up to 17mm. During this time we saw a good reduction in the 9MHz coupling - nominally the line height is ~10. The other locks were too short for anything to thermalise completely so hard to say whether much improved or not.


Images attached to this comment
H1 ISC
jenne.driggers@LIGO.ORG - posted 19:08, Saturday 23 February 2019 (47100)
Locking Notes
Images attached to this report
H1 ISC (ISC)
craig.cahillane@LIGO.ORG - posted 01:52, Saturday 23 February 2019 - last comment - 11:10, Saturday 23 February 2019(47097)
Locking tonight
Dan Danny Georgia Craig

Tonight we increased the DARM offset and measured the 9 MHz RIN to DARM coupling, and looked at the noise.  It seems like the 9 MHz RIN to DARM coupling goes down with increased DARM offset.  
At the same time I took DARM spectra and cross-correlations, there was no change in either while the DARM offset was moved.  
This seems to indicate that it may not be the 9 MHz coupling itself which limits us at 40-70 Hz.  
Daniel suggests that the coupling could be carrier-borne intensity noise which trades off differentially with the sidebands.  In other words, carrier power goes up, sidebands go down, and vise versa.  The higher the modulation depth, the larger this coupling could be.  This sort of intensity noise would be invisible to the ISS, which stabilizes total power.  And we know that our input RIN coupling to DARM is higher than for a balanced IFO.
We may try locking the OMC on carrier and exciting the 9 MHz to see how the RIN couples from 9 to carrier.

While Georgia was moving the DARM offset, we saw the 48 Hz hump go away in the DARM spectrum.  Seems like it could be a jitter/scatter peak near the OMC which was washed out by the extra DARM offset light.

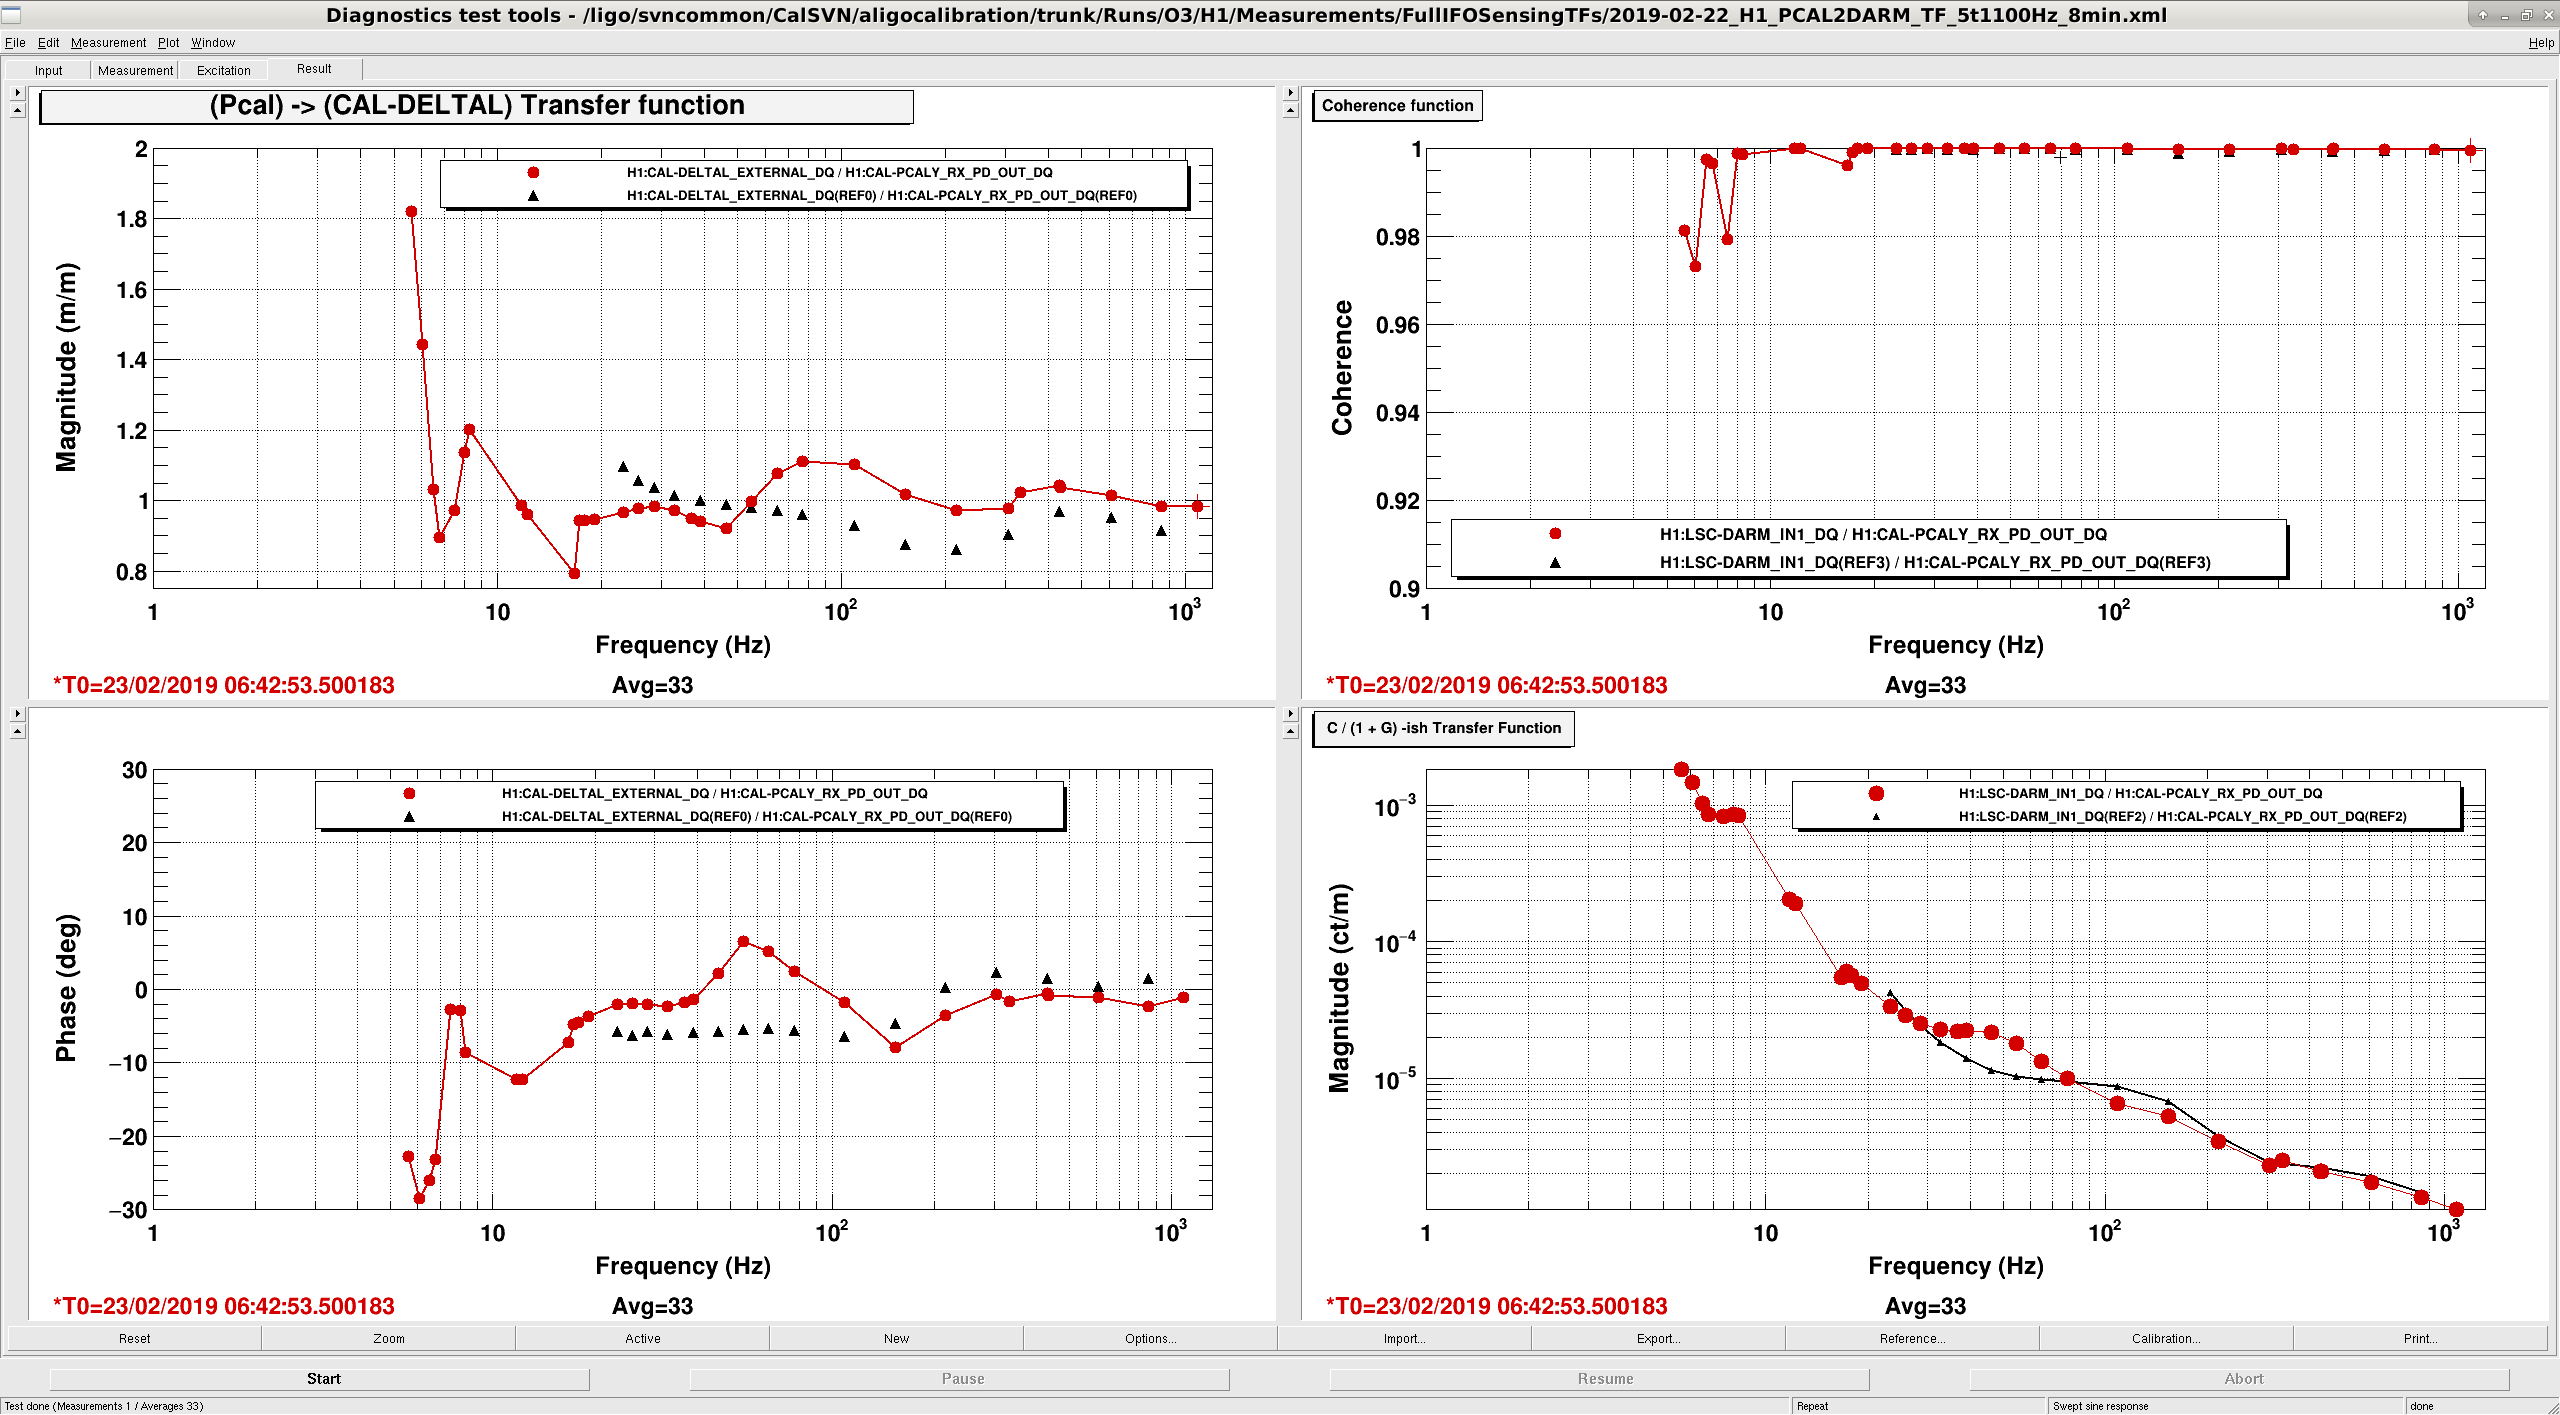
We also took a PCAL to DARM sweep and a DARM OLG for the calibration, stored in /ligo/svncommon/CalSVN/aligocalibration/trunk/Runs/O3/H1/Measurements/FullIFOSensingTFs/.  From the PCAL to DARM measurement it seems that our very low frequency calibration is off.

I set up some frequency (600-800 Hz) and intensity (1200-1400 Hz) injections, flipped the CO2 mask guardian to ANNULUS, and started Dan and Danny's 400 mW ITMY C02 mask injection at GPS=1234950440 with the following command: python co2_power_temporary_adjust_ITMY.py ITMY -s 'now' -d 7200 -sp 0.4
If you come in tomorrow, please turn off the awgguis on workstation ZOTWS22.
Images attached to this report
Comments related to this report
jenne.driggers@LIGO.ORG - 11:10, Saturday 23 February 2019 (47099)

awgs just set to 0.

H1 ISC (ISC)
georgia.mansell@LIGO.ORG - posted 01:04, Saturday 23 February 2019 (47098)
More 9 MHz RIN coupling measurements - changes during lock, and with DARM offset

Craig Georgia Danny Dan Sheila

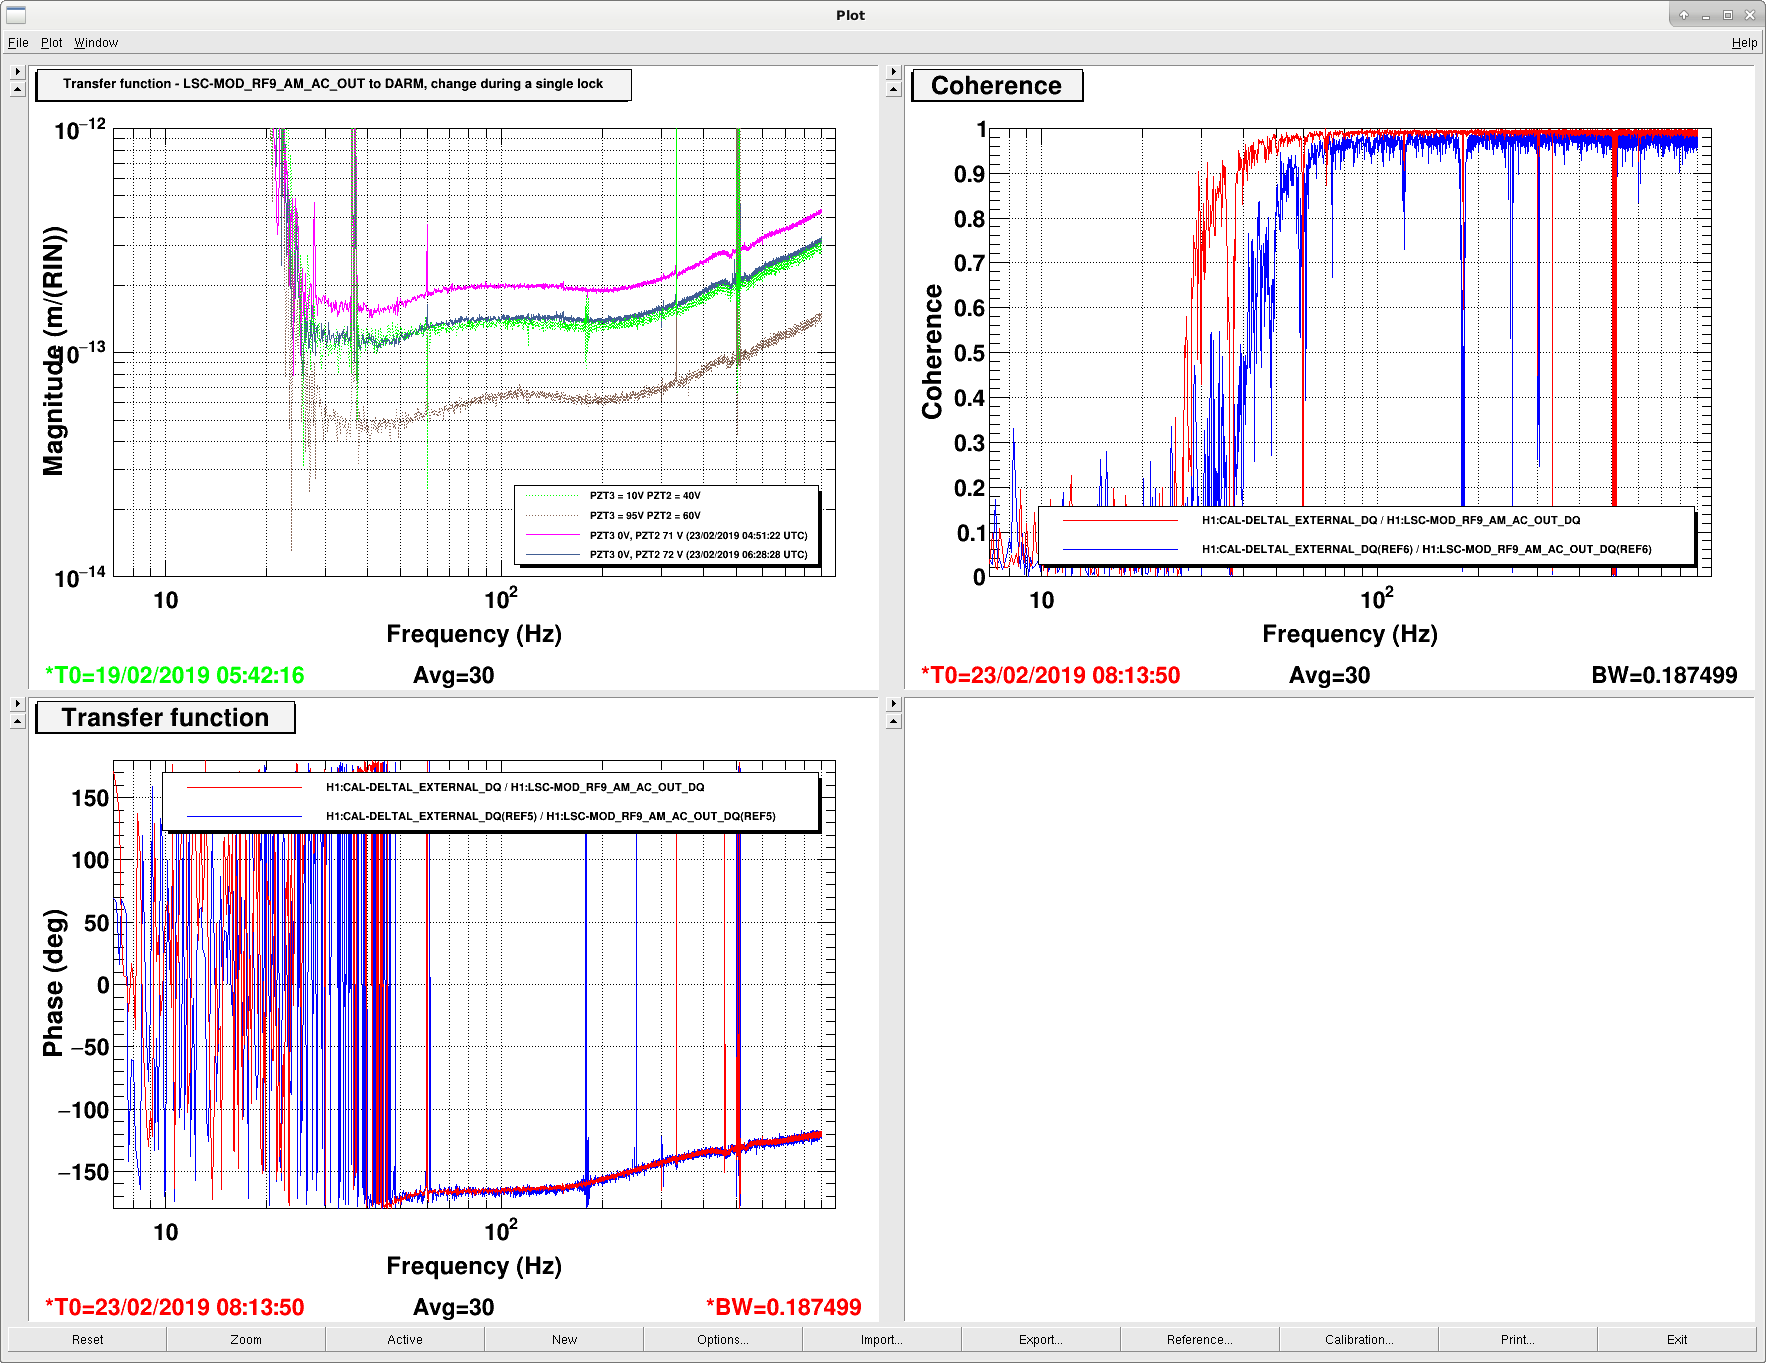
Following on from RF9 coupling tests earlier this week (alog 47008), tonight we ran some more excitations in the RF9 amplitude modulation.

We found that over the course of the lock the coupling of our excitation to DARM changed. See first attachment top left plot. The dotted references are traces from earlier this week, the pink was measured 10 mins after reaching NLN, and the blue trace an hour and a half into the lock. This supports Dan's observation of the coupling of his 70 Hz RF9 AM line (alog 47081). I only measured the broadband coupling at these two times, it might have been useful to measure ~1000 seconds into the lock, where Dan observed maximal coupling.

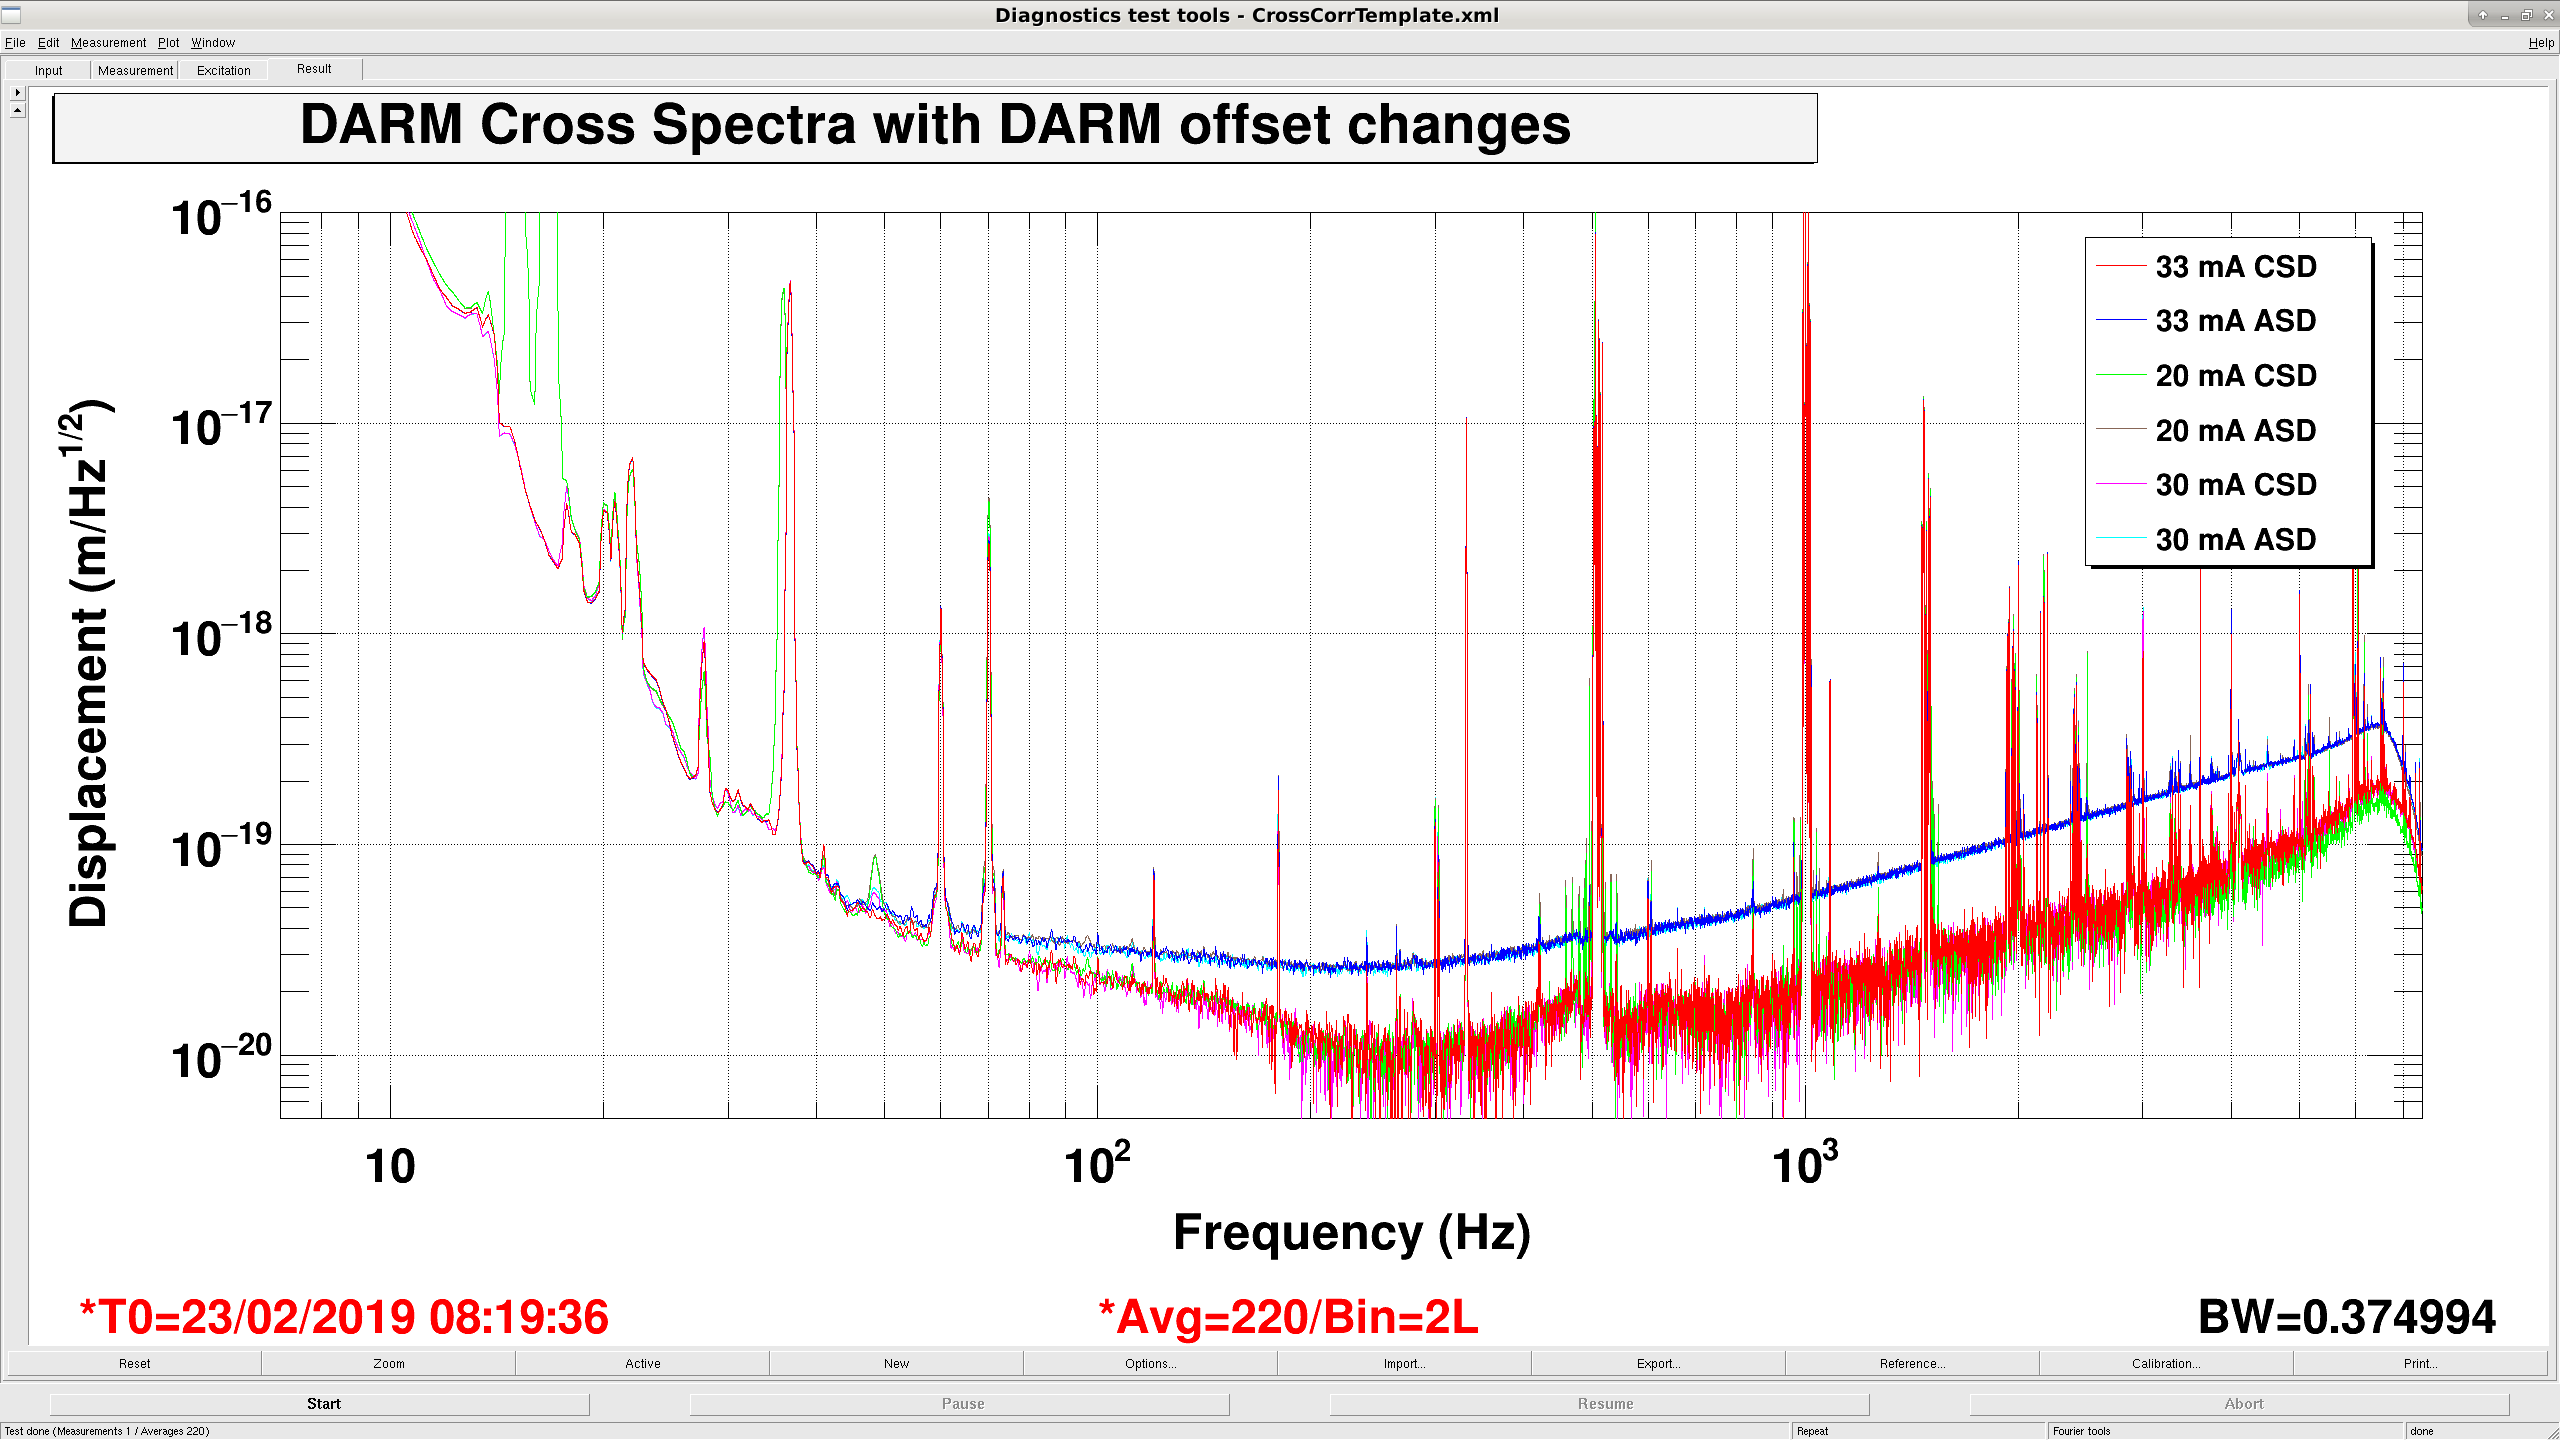
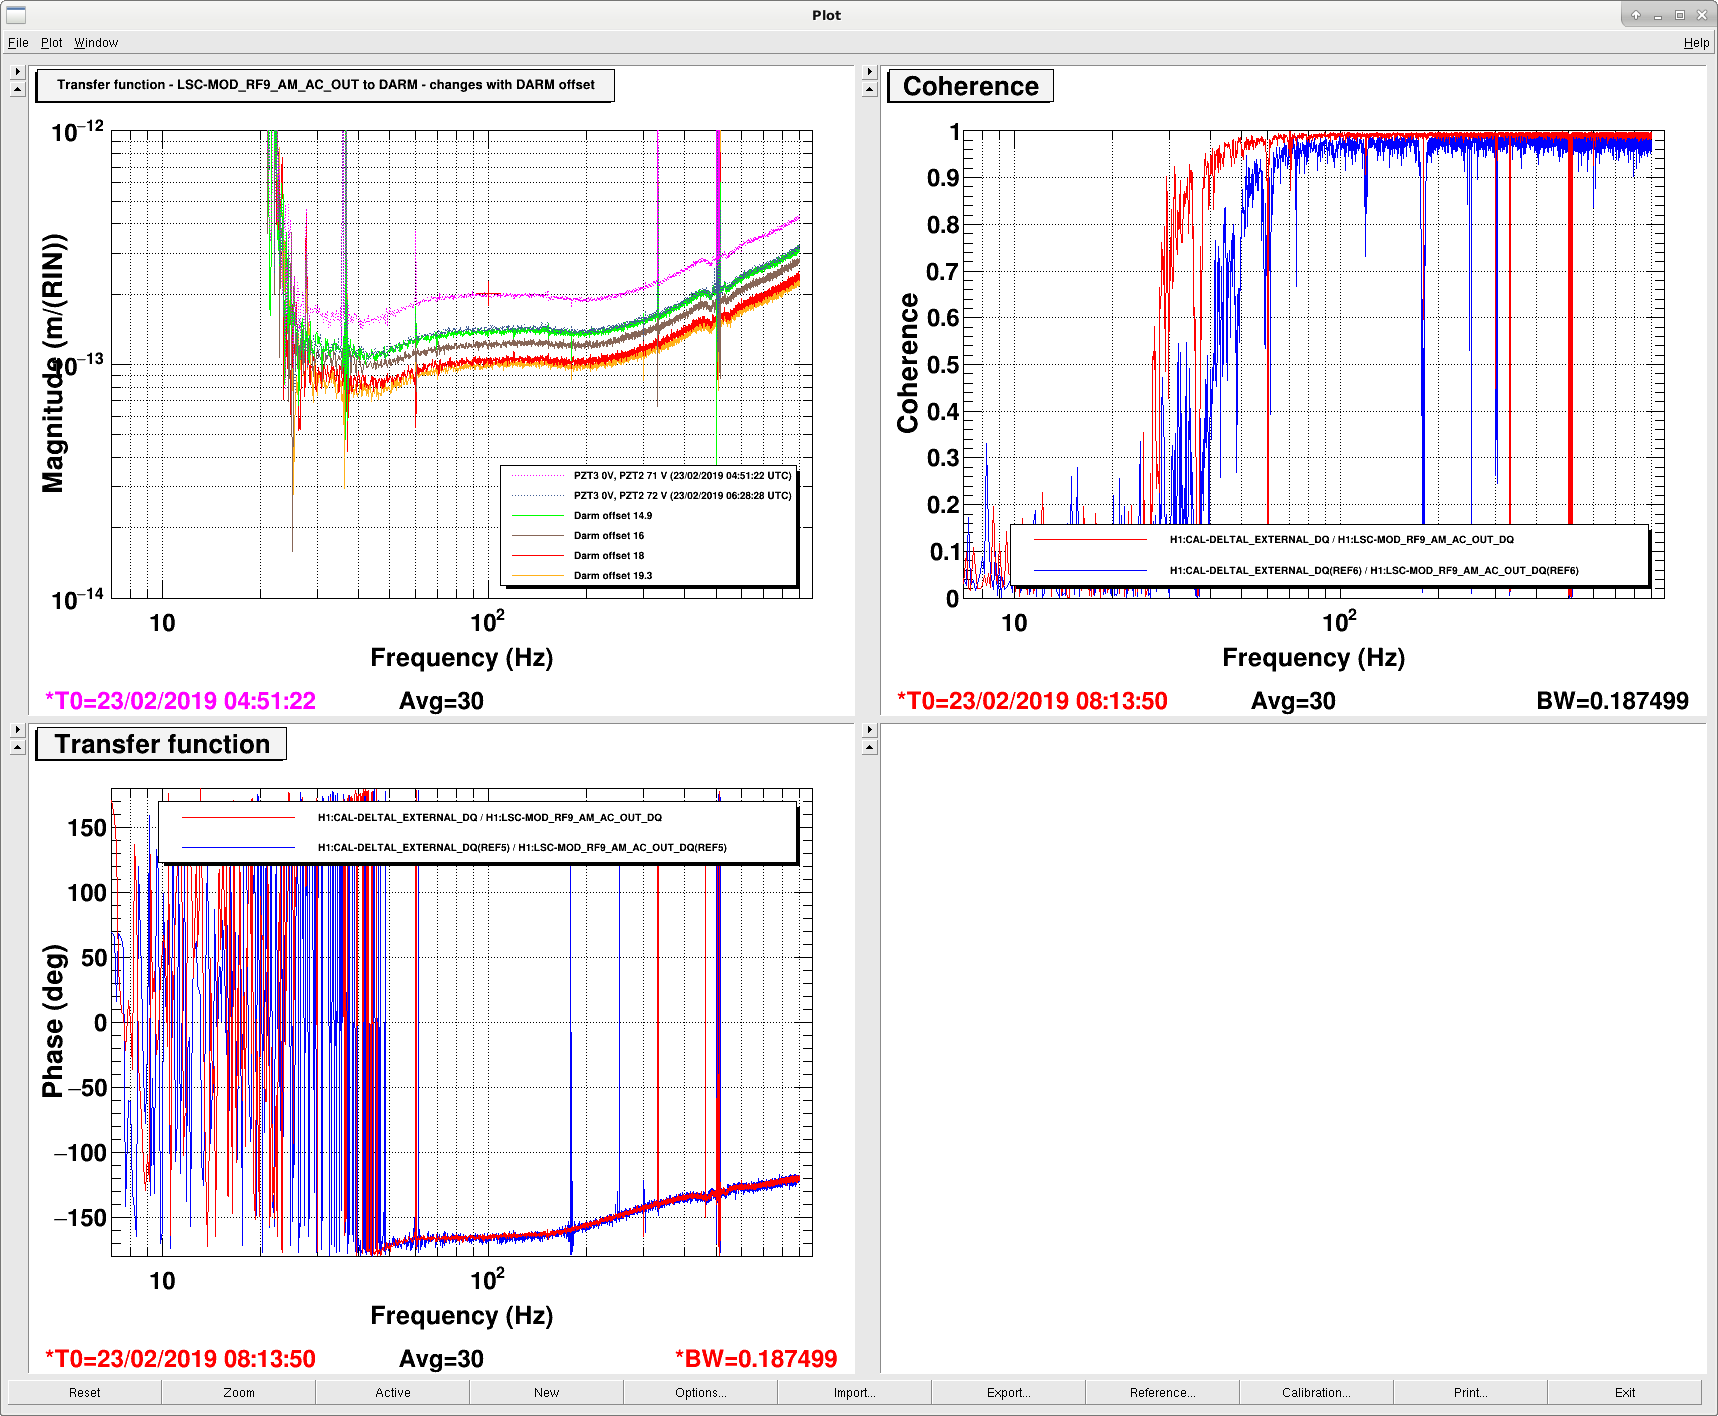
We then changed the DARM offset and ran the same RF9 coupling measurements, as well as the OMC DCPD cross-correlation, for a few values of the DARM offset. We found the RF9 coupling was reduced with higher DARM offset, maybe this isn't surprising given that the ratio of 9MHz to carrier at the AS port is changing as we change the DARM offset. The second attached figure shows several DARM offsets, dotted traces are from earlier in the lock, and have nominal (14.8) DARM offset. At 19.3 (33.65 mA DC current on the DCPD sum) we started to saturate the DCPD's with the second order violin modes and so backed off. The change in DARM offset did not show any change in the DCPD cross-correlated spectrum. We did not alter the feedforward as we were changing the DARM offset, and Craig noticed there was coherence between SRCL and DARM between 10 and 20 Hz when we had the large DARM offset.

Images attached to this report
H1 SQZ (SQZ)
nutsinee.kijbunchoo@LIGO.ORG - posted 23:48, Friday 22 February 2019 (47096)
SQZ level at various CLF power

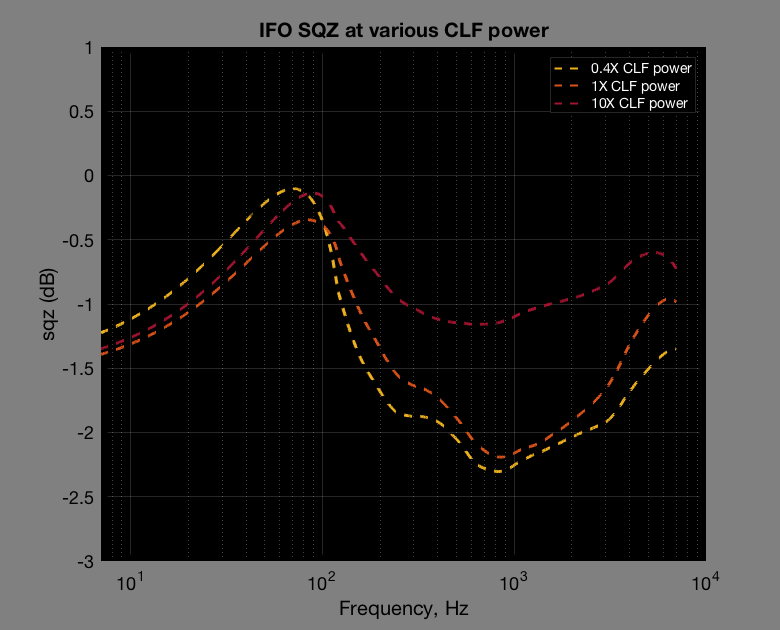
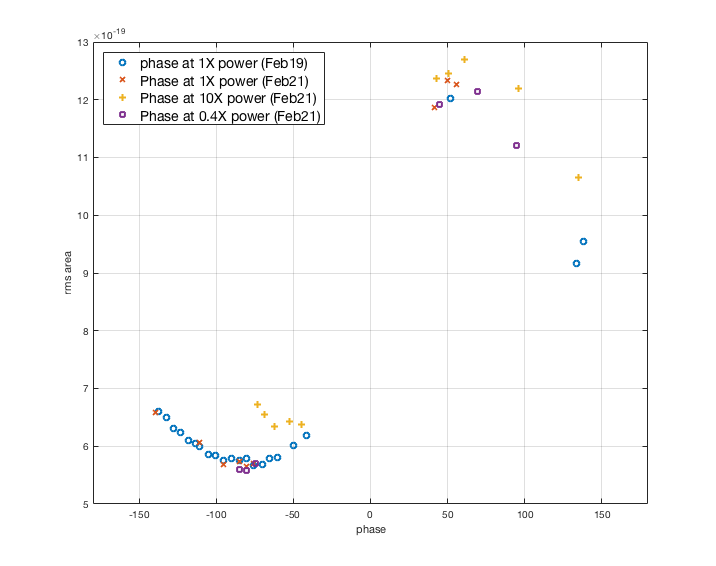
Attached a quick plot showing dB of squeeze we get at various CLF power. 1X CLF power being 0.05 mW sent into the coupler, 1uW transmitted. We were able to gain a little more just by decreasing the power (at least down to 100Hz). This might be an indication that there is something to be gain just by investigating CLF noise alone. More noise budget to follow. 


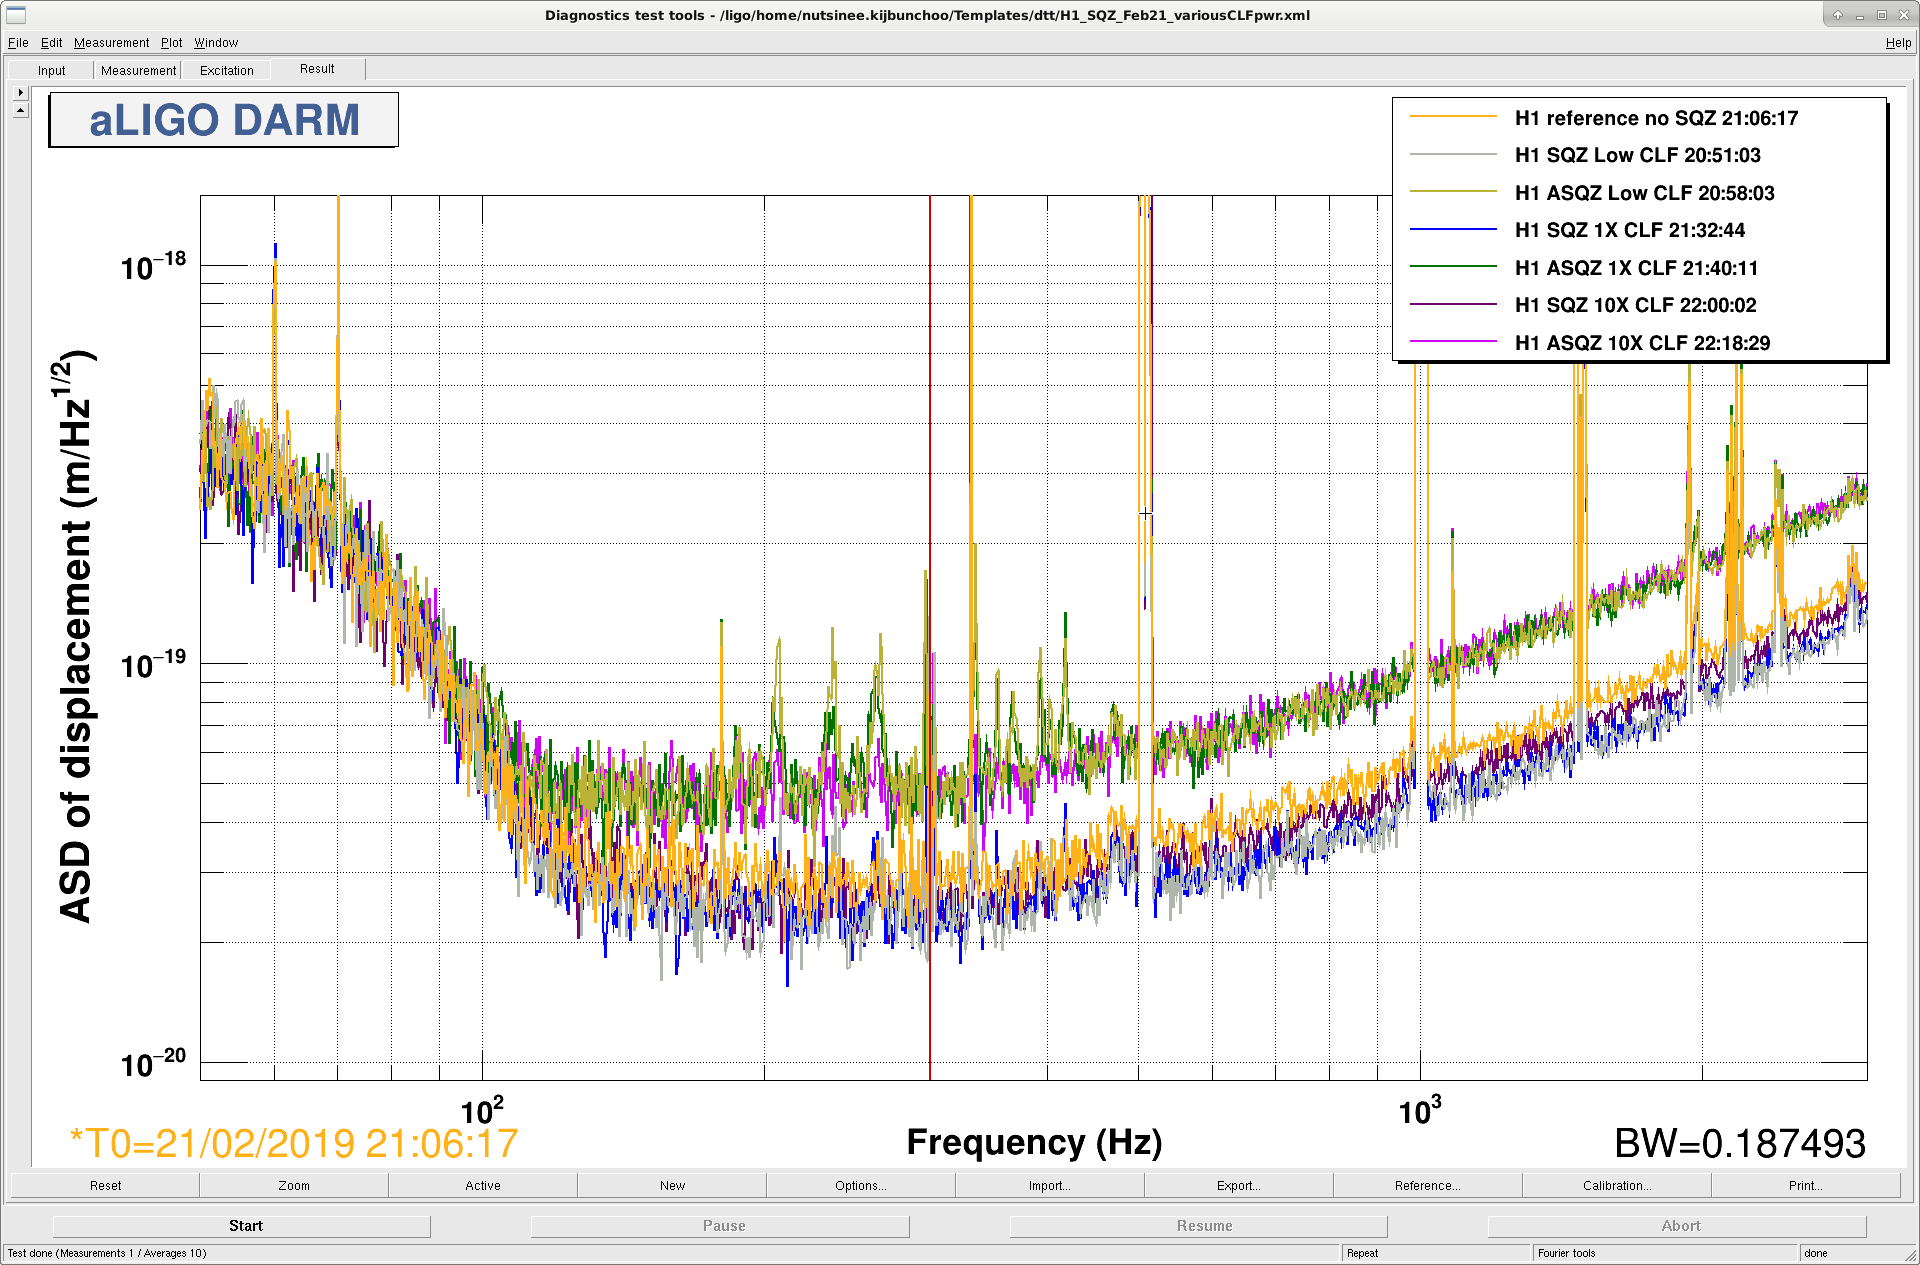
The second plot shows DARM at these power.The mysterious peaks that get better with higher power are between 200Hz-500Hz (well, not so mysterious in a sense that we know they correlate with acoustic from SQZT6, but how does it get into DARM?). I kept the UGF of CLF and LO the same at all these measurement. I also checked the alignment.


Another useful thing I found that at the same CLF power, the optimal squeezing phase stay the same between the two injections (on Feb 19 and Feb 21). 30.4deg on spare phase delay slide bar, 69.21 everywhere else, CLF sign positive is the optimal place for 0.05mW CLF launch. Note that the green power is kept stabilized at 20mW. 


Images attached to this report
Non-image files attached to this report
LHO VE
kyle.ryan@LIGO.ORG - posted 17:48, Friday 22 February 2019 (47092)
1655 - 1725 hrs. local -> operated crane at Y-mid

1730 hrs. local -> shut-off Y-mid instrument air compressors.

1740 - 1745 hrs. local -> drove back from Y-mid.

H1 TCS
daniel.brown@LIGO.ORG - posted 14:02, Friday 22 February 2019 - last comment - 18:17, Friday 08 March 2019(47081)
Initial ITMY mask test and 9MHz RIN line

Danny, Dan

9MHz RIN line over locks

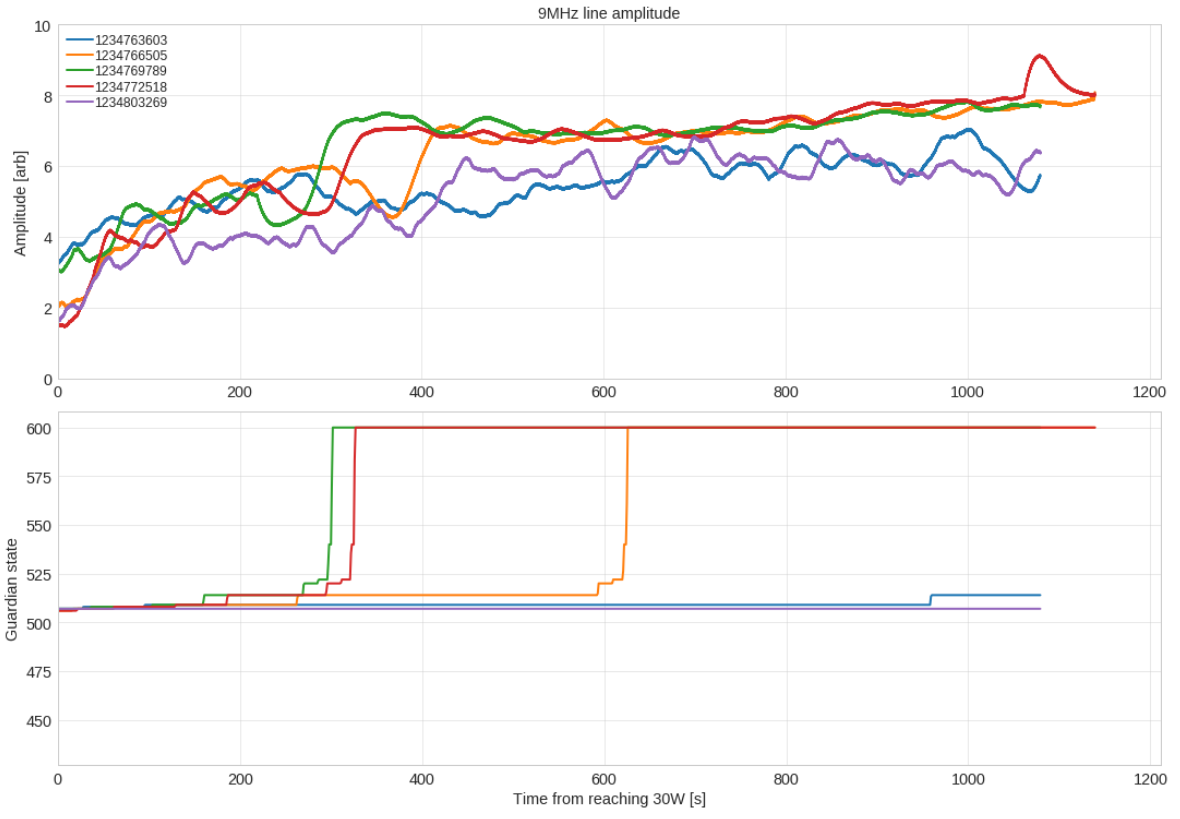
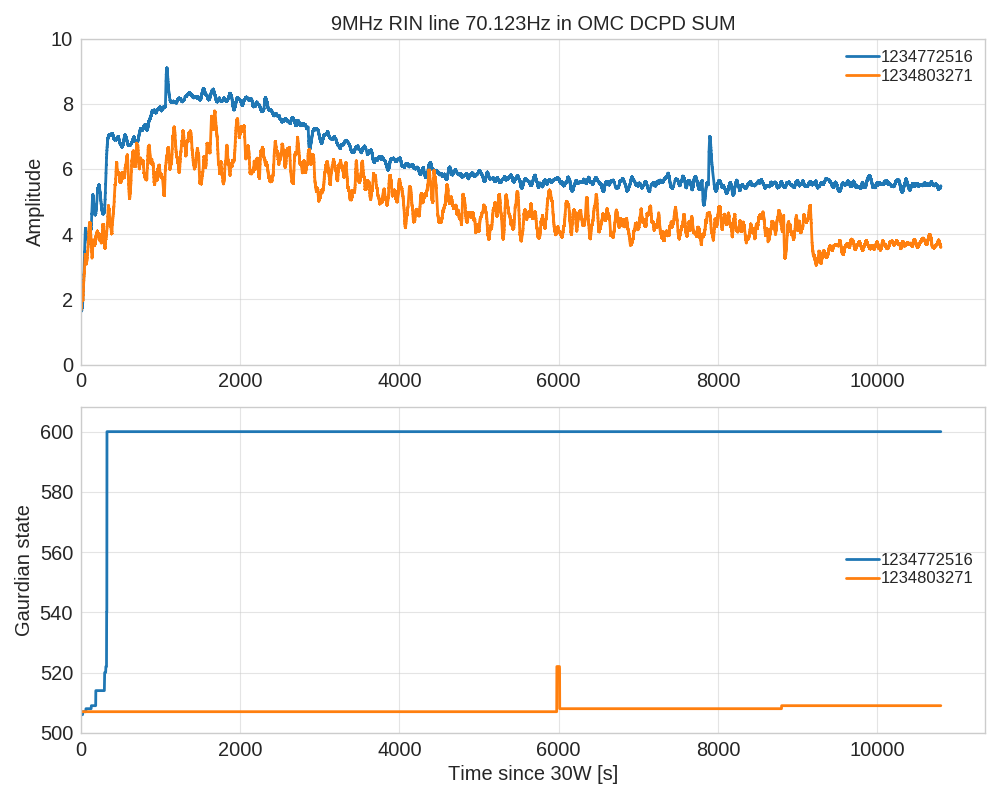
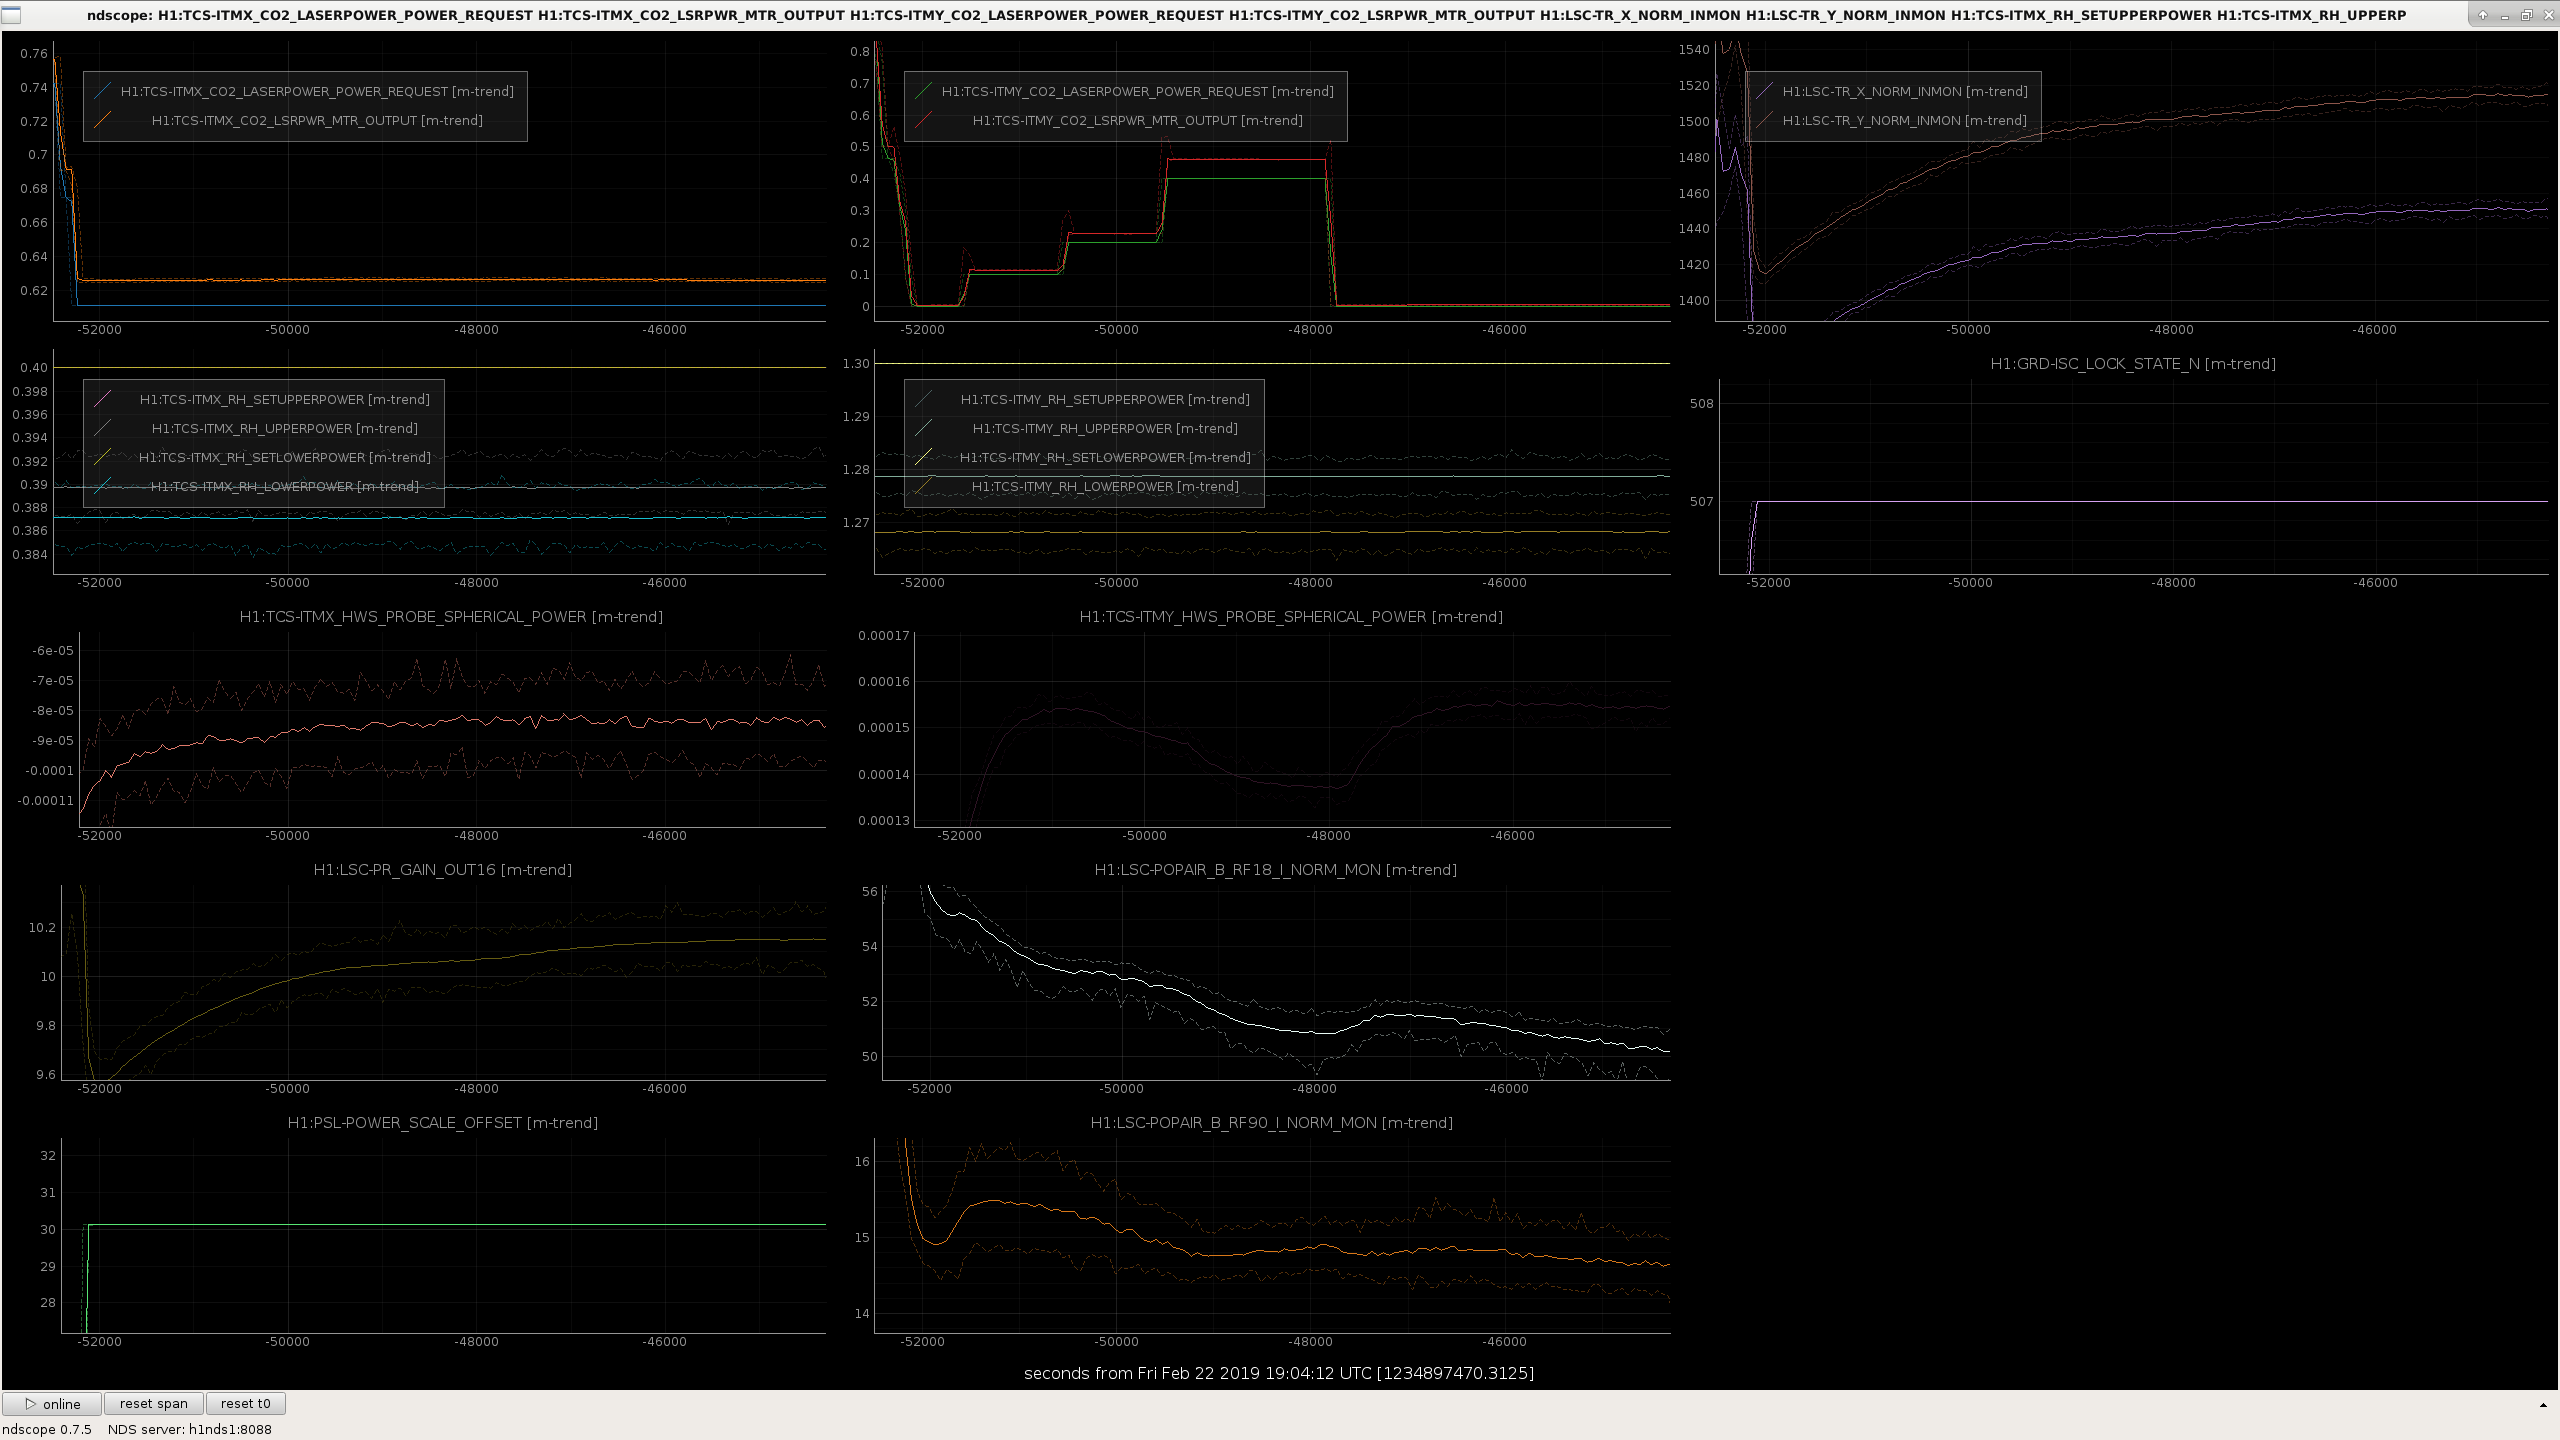
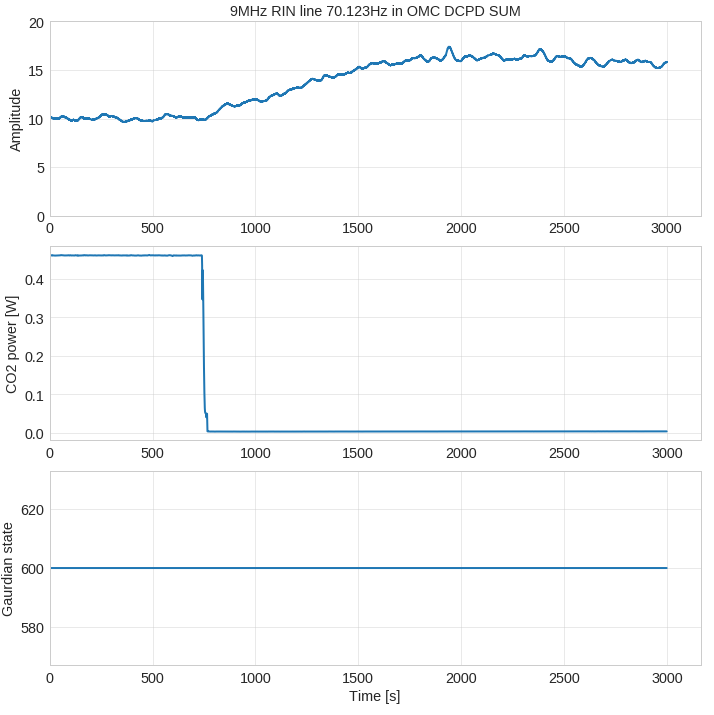
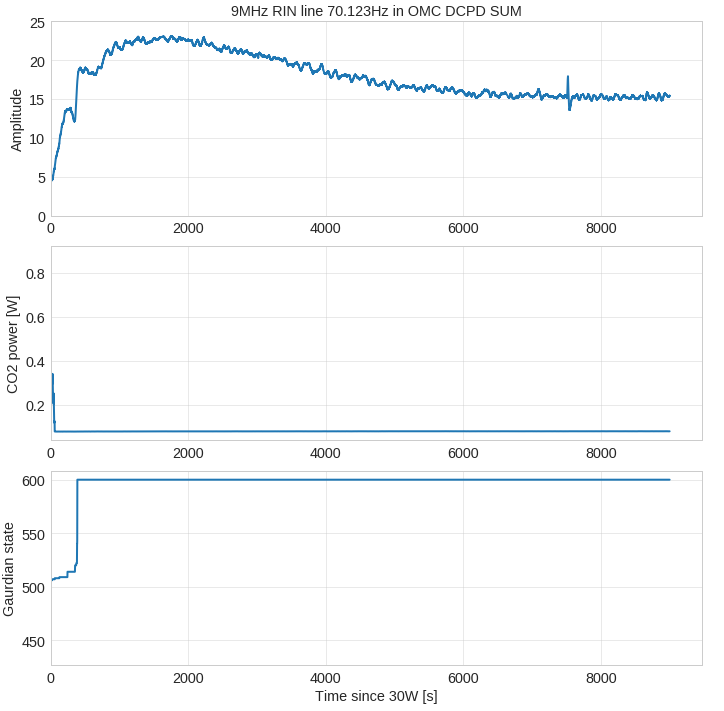
We put a line at 70.123Hz in the 9MHz for a few locks to see how it was behaving over time. When it was one we had a few short locks and two longer ones so far. It seems there are two states in which the coupling finds itself, one that peaks around "8" and another "6". This may coincide with going to LOWNOISE_ESD_ETMX (Guardian state 514) - the jump up in RIN coupling for red/green/orange seems to happen at roughly the same time after we go up to state 514. During the two long locks it's clear there's some long time constant to the RIN coupling, it takes around 4000s after going to 30W for this to settle. So depending on the thermal state we took the RIN measurements previously this might be a reason we got confused.

ITMY Mask

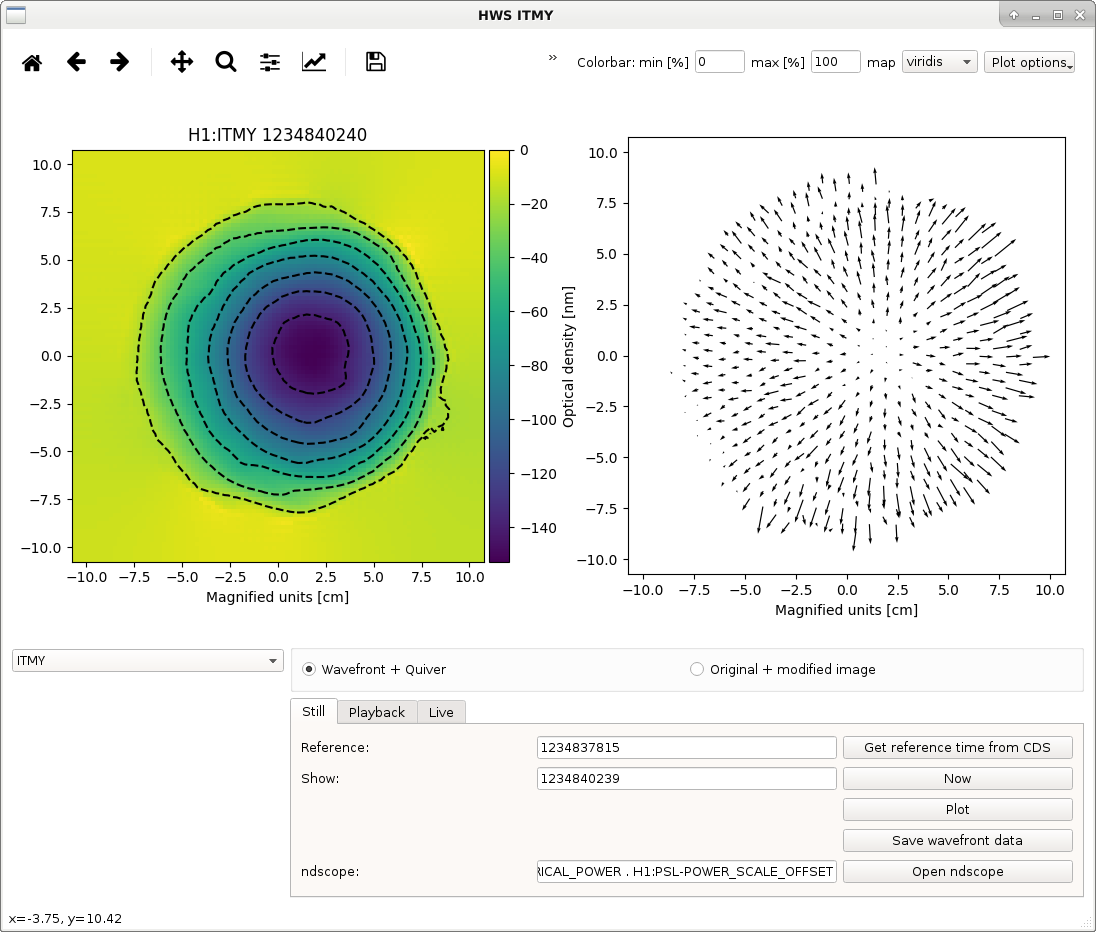
Last night we tried out the ITMY mask. The initial plan was to just apply the mask with the IFO unlocked to see how the induced OPD compared to what we expected. Then as we had the IFO to ourselves we decided to just go for it and try it out in a full lock to see what happened. Edit: this test was just to get the CO2 mask on at the expected power without causing a lockloss, the expected implementation requires changing ring heaters as well which is something to try another day.

Initially the OPD doesn't look quite like we expected. What isn't obvious is the crescent moon like shape seen in alog 46976 (Top right figure). This could be because the HWS probe beam isn't illuminating the full area so we just see a small section of it. I took the 30W point absorber OPD and added it to the offline mask OPD to get a rough idea of what might be the total effect, from this it reduces the overall optical depth and the larger spatial frequency heating from the absorbers.

From initial inspection the alignment of the minimum is not too far off from the point absorbers, we might want to try shifting the mask slightly in future. However it looked reasonably well aligned enough to try in a full lock.

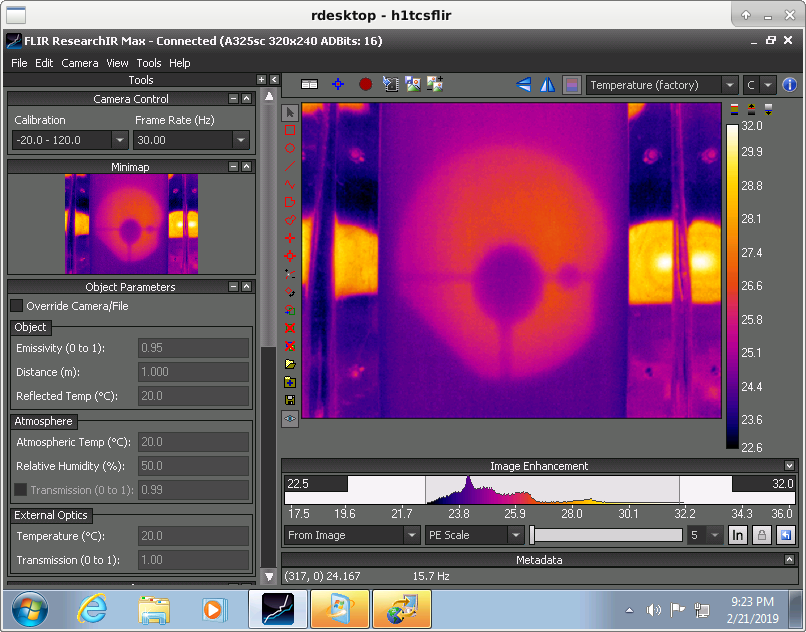
FLIR image of mask

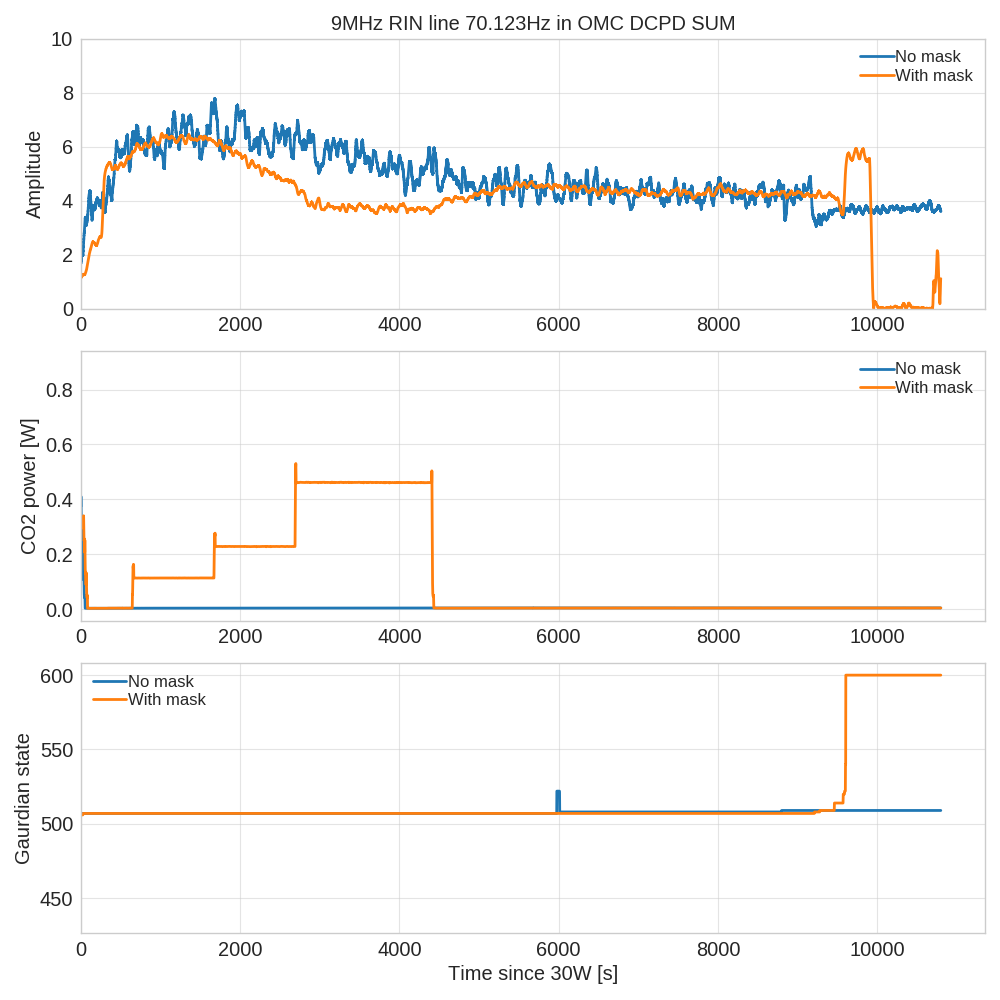
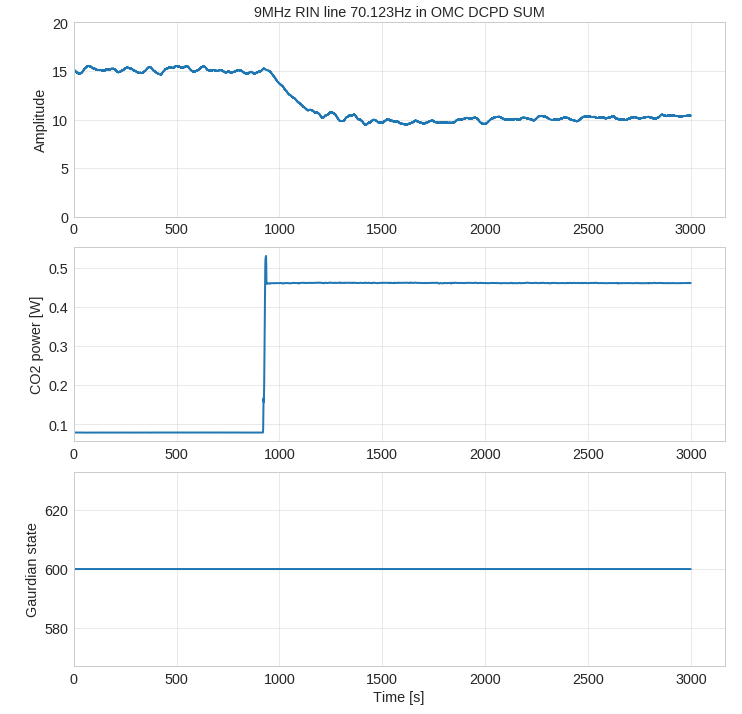
We powered up to the 30W state but didn't go to low noise ASC. We then put the mask in and stepped up in CO2Y power 100mW, 200mw, 400mW in 1000s intervals. We compare this with the 30W lock we had yesterday with the 9MHz RIN line on where we also didn't go to a low noise state. Looking at the RIN coupling we can see an improvement as the mask is introduced, then when we switched it off it goes back to as it was before. I injected a line that was 10x larger than the previous day by accident so the amplitude is rescaled and the line is less noisy. In hindsight we should have left it on a bit longer to see how it affected the steady state after 4000s, however we wanted the thermal state to return to normal for the night shift commissioning. From the data it looks as if the RIN coupling levels off between 3000-4000s. It looks to be at roughly the same level as the steady state case without the mask. Perhaps there is another dominating coupling effect at that stage where the mask no longer helps.

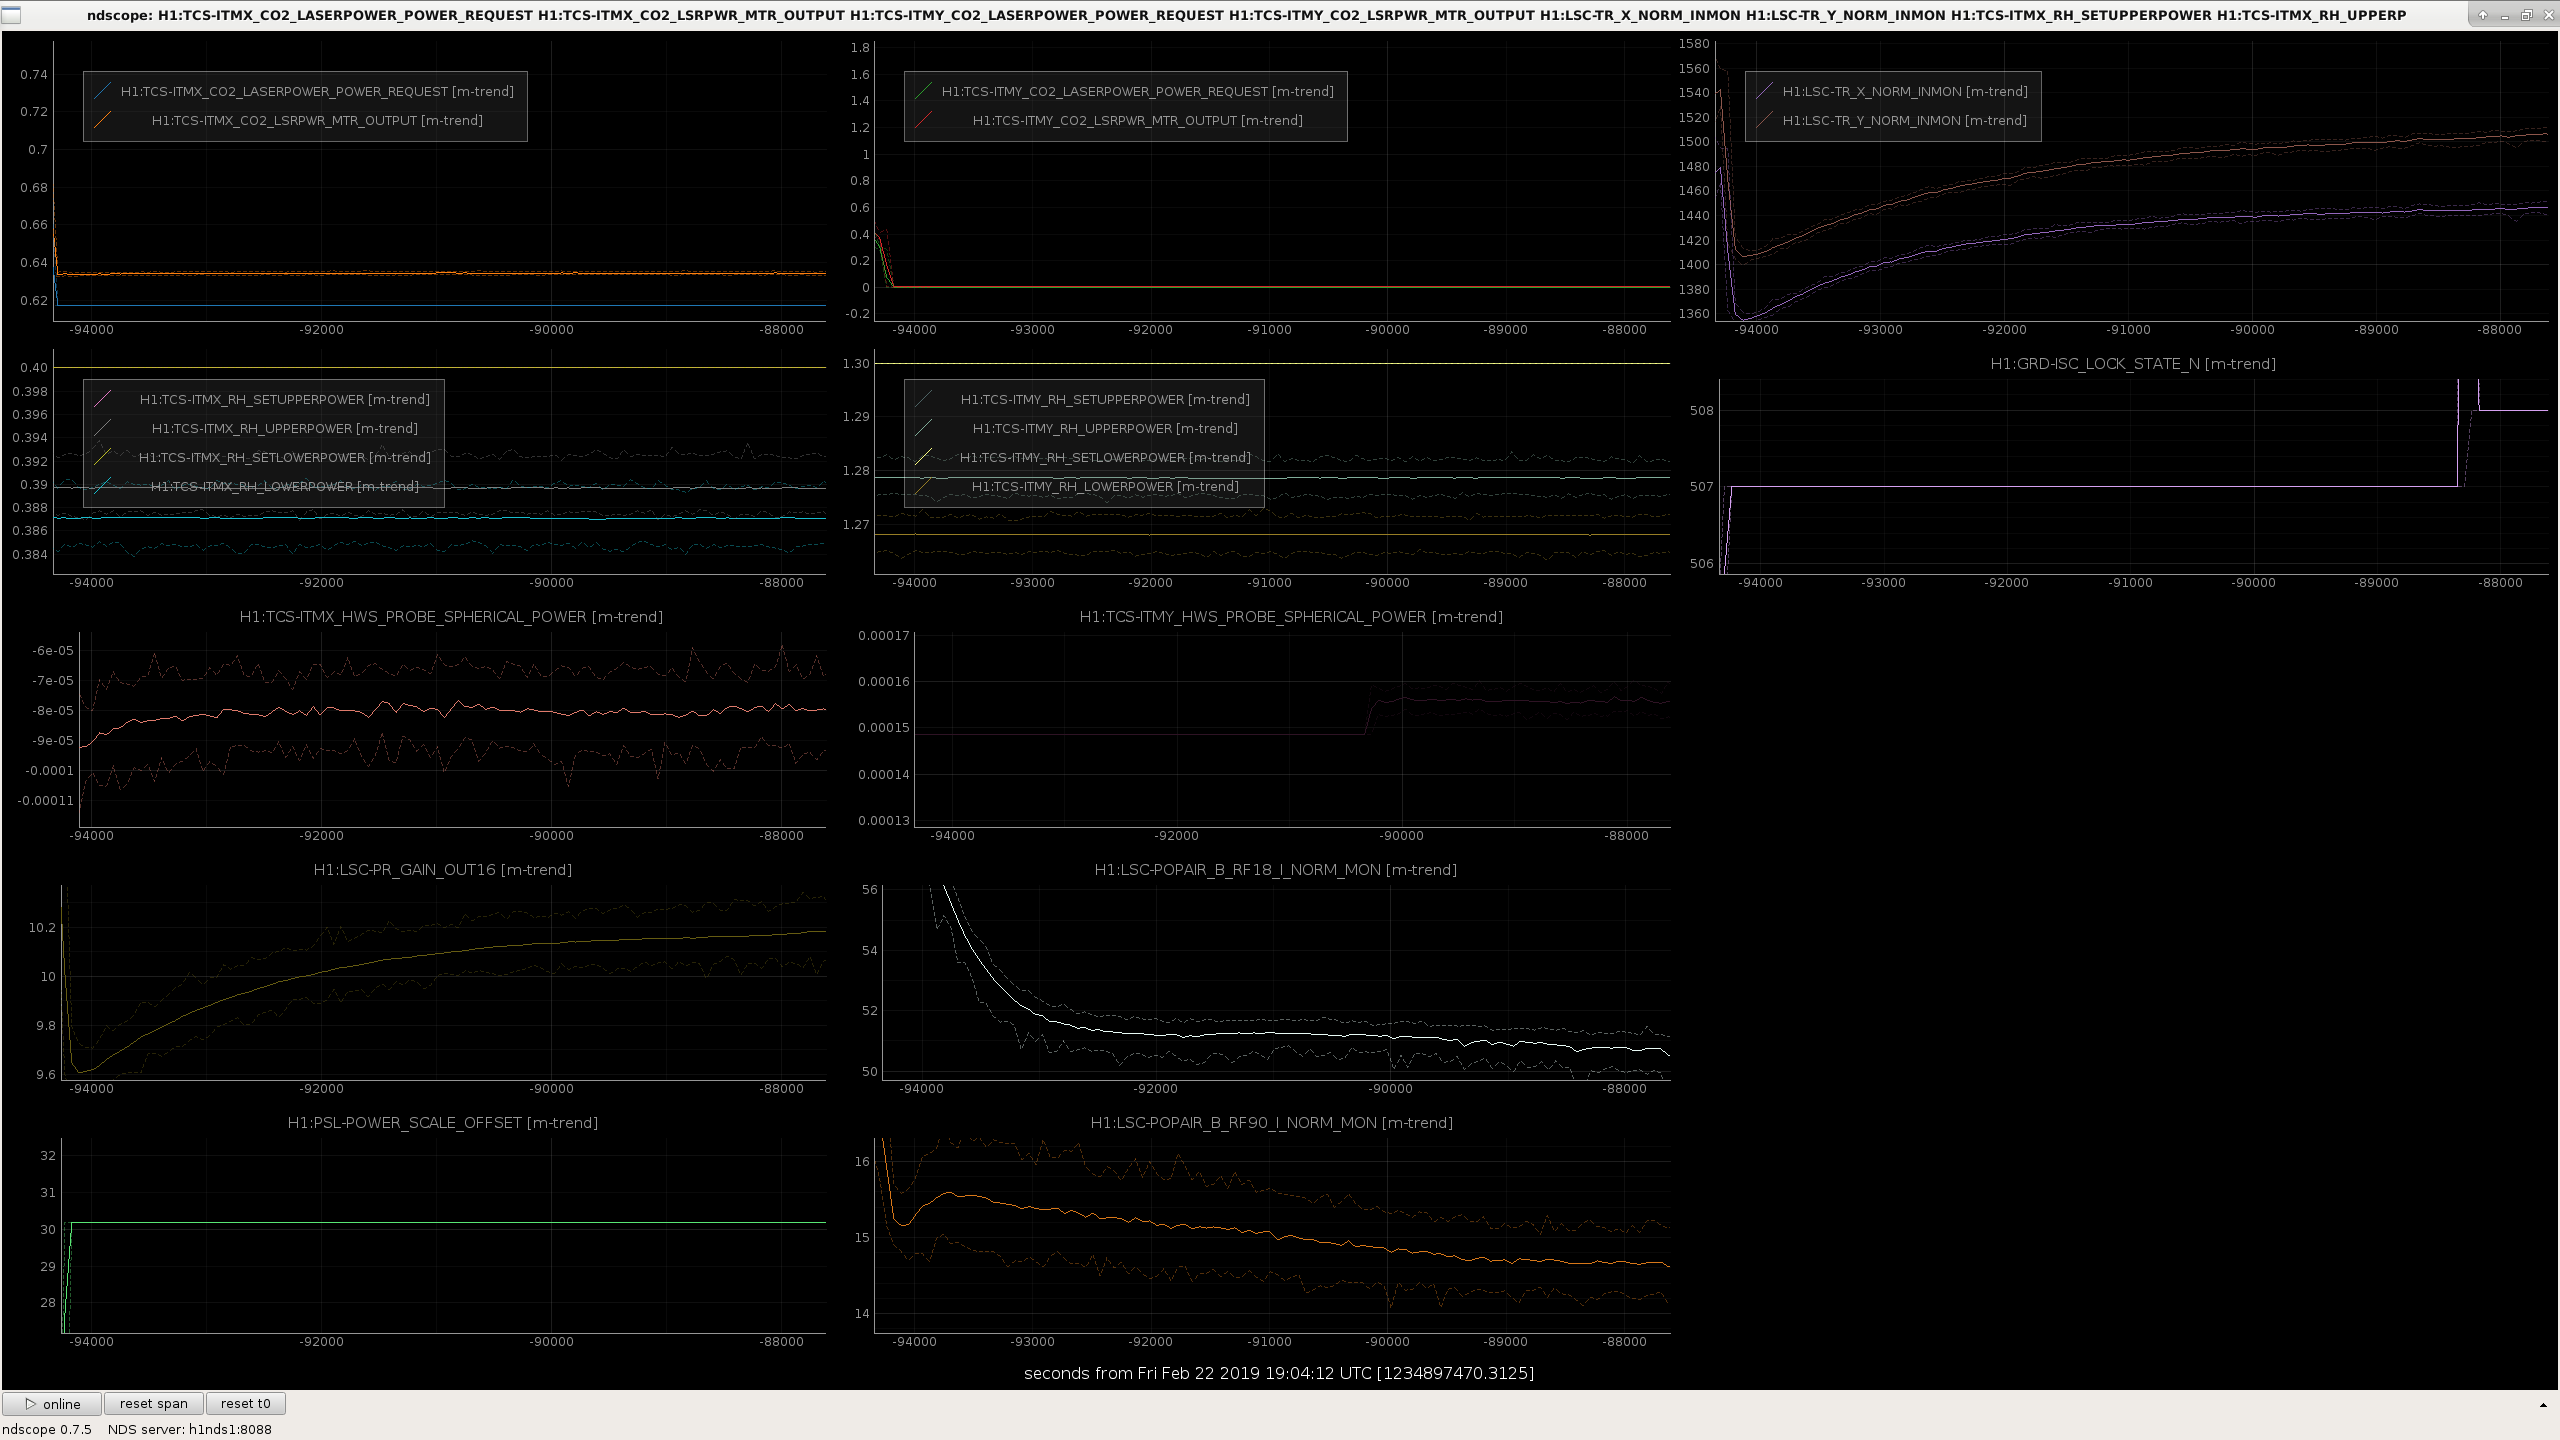
RF90/RF18/PRG/HWS traces with and without the mask.

Comparing with and without the mask we can see:

Things to try next:

Images attached to this report
Comments related to this report
craig.cahillane@LIGO.ORG - 21:11, Friday 22 February 2019 (47094)
Adding a plot of power levels of the two locks with mask and without.

PRG and arm power remain lower with CO2 ITMY mask on, but POP18 is higher.
Non-image files attached to this comment
daniel.brown@LIGO.ORG - 10:01, Monday 25 February 2019 (47118)

The other night we put the mask on once the IFO had thermalized alog 47097. The effect of the mask looked to be leveling off. However when applying the mask at a later date we also saw an improvement in the coupling.

Here is the 9 MHz RIN line amplitude at the start of the lock, when we switched the mask on, and when we switched it off. Overall saw ~30% reduction in coupling.

Images attached to this comment
daniel.brown@LIGO.ORG - 16:43, Tuesday 05 March 2019 (47315)TCS


Attached is a breakdown of the mask test with a thermalised IFO at 30W. We switched on the mask for two hours. Plotted is the OPD changes between several points:

  1. OPD change during power up before any mask is applied
  2. OPD change with the mask switched on
  3. The change in the OPD due to the mask (Difference between 1 and 2)
  4. The steady state OPD of the mask after 2 hours

What's confusing us is that we now see an OPD change that is different to when we applied the mask separately. i.e. case 4 does not look like this.

The magnitude of the optical depth change is completely different too. Case 4 has an OPD change of 40nm, whereas applying the mask out of lock gave us ~140nm. I can't think of why this would be the case, perhaps the mask induces a change in the beam which introduces a different OPD, so some non-linear effect is in play. If so, it will be difficult to predict what mask shape to actually use.

It does however have a crescent like shape similar to aidans model Aidan's model (top right image here), although that may be a coincidence.

Images attached to this comment
aidan.brooks@LIGO.ORG - 09:27, Thursday 07 March 2019 (47362)

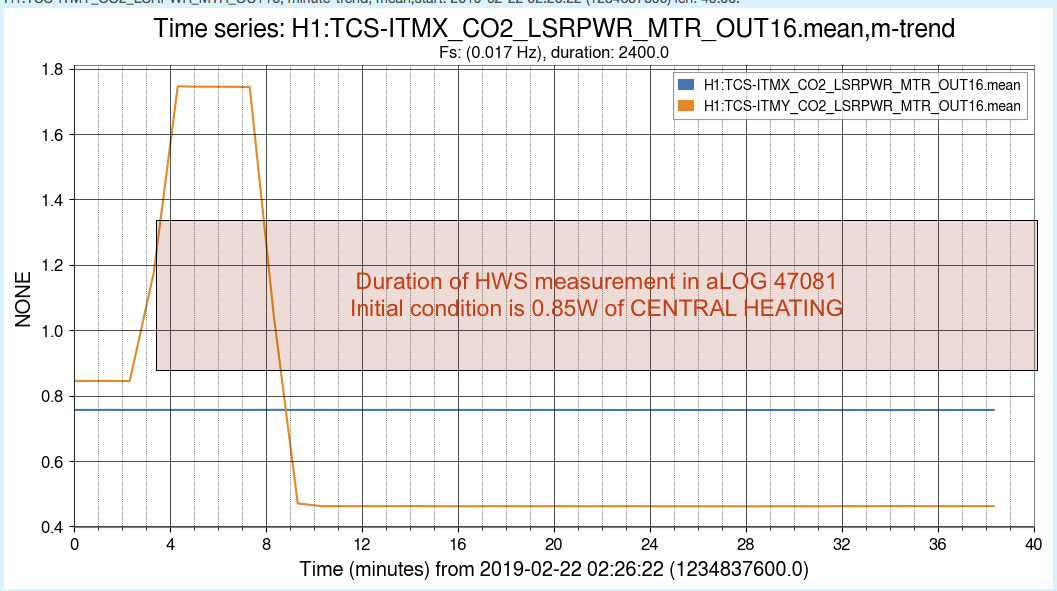
The reference for the "140nm measurement" of the CO2Y mask thermal lens was not taken at a cold state but rather with 0.85W of CENTRAL heating on. This yields a strong positive lens. If this positive lens is taken as a reference (or zero) point and then central heating is turned off, we will see a strong negative lens in the measurement.

Probably best to repeat the calibration of the CO2Y mask from a genuine cold state.

So the "140nm OPD measurement" is looking at the difference between a reference state of "0.85W central + 0.0W custom mask" and "0W central + 0.45W custom mask".


Images attached to this comment
alexei.ciobanu@LIGO.ORG - 18:17, Friday 08 March 2019 (47411)TCS

Alexei, Dan

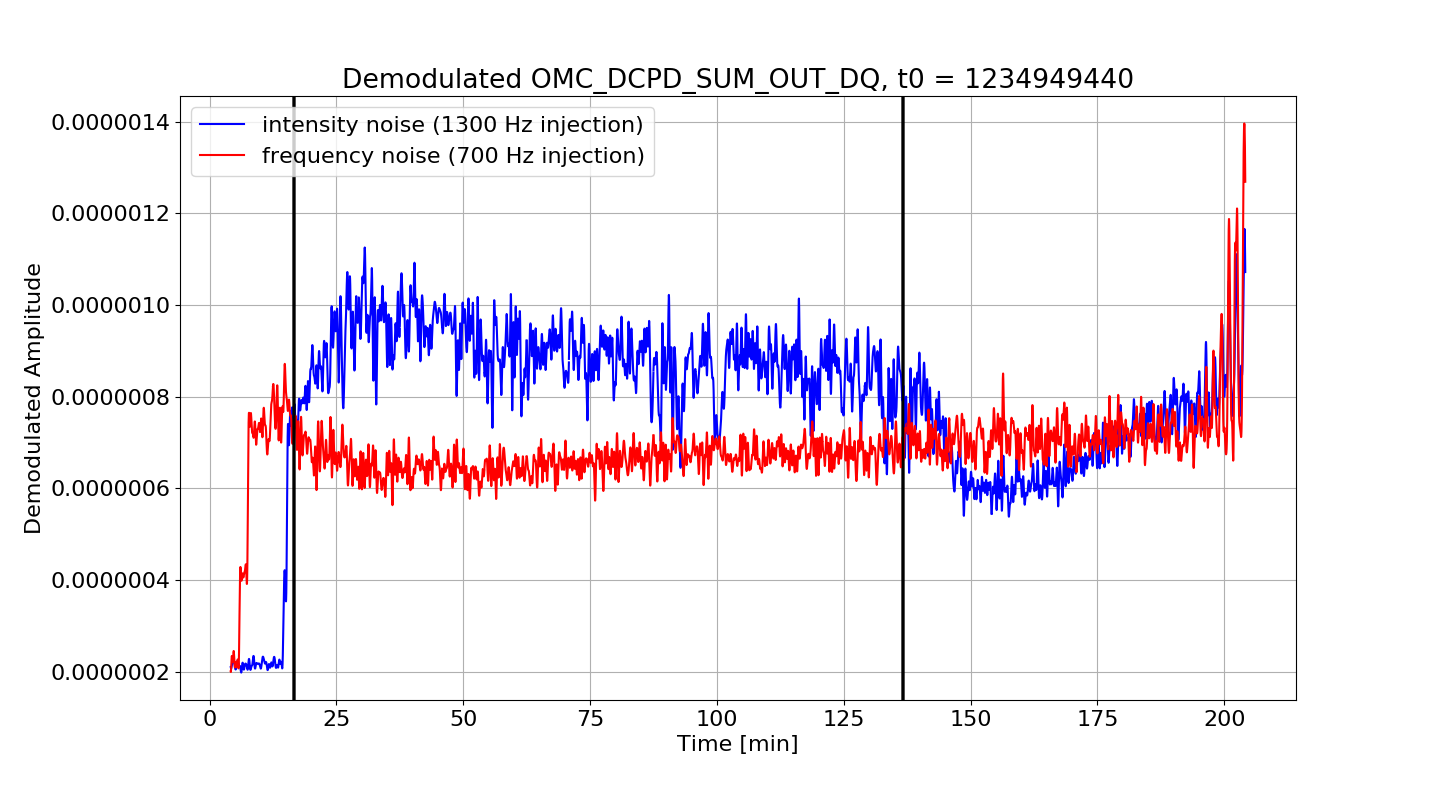
Pulled the data from OMC_DCPD_SUM_OUT_DQ corresponding to the injections of frequency and intensity noise lines as outlined in alog 47097.


The first black line is when the CO2 was switched on the second black line is when it got switched off. Looks like the mask increases intensity noise coupling but doesn't do much of anything to the frequency noise.

The ringing towards the end is likely some instability as there is a lock loss about 10 minutes after the data ends.

https://alog.ligo-wa.caltech.edu/aLOG/uploads/47411_20190308181222_alog_47081_demod.png

Images attached to this comment
H1 SEI (FMP)
jim.warner@LIGO.ORG - posted 12:14, Friday 22 February 2019 - last comment - 17:21, Friday 22 February 2019(47084)
HVAC control changes at ends seem to help BRSX stability

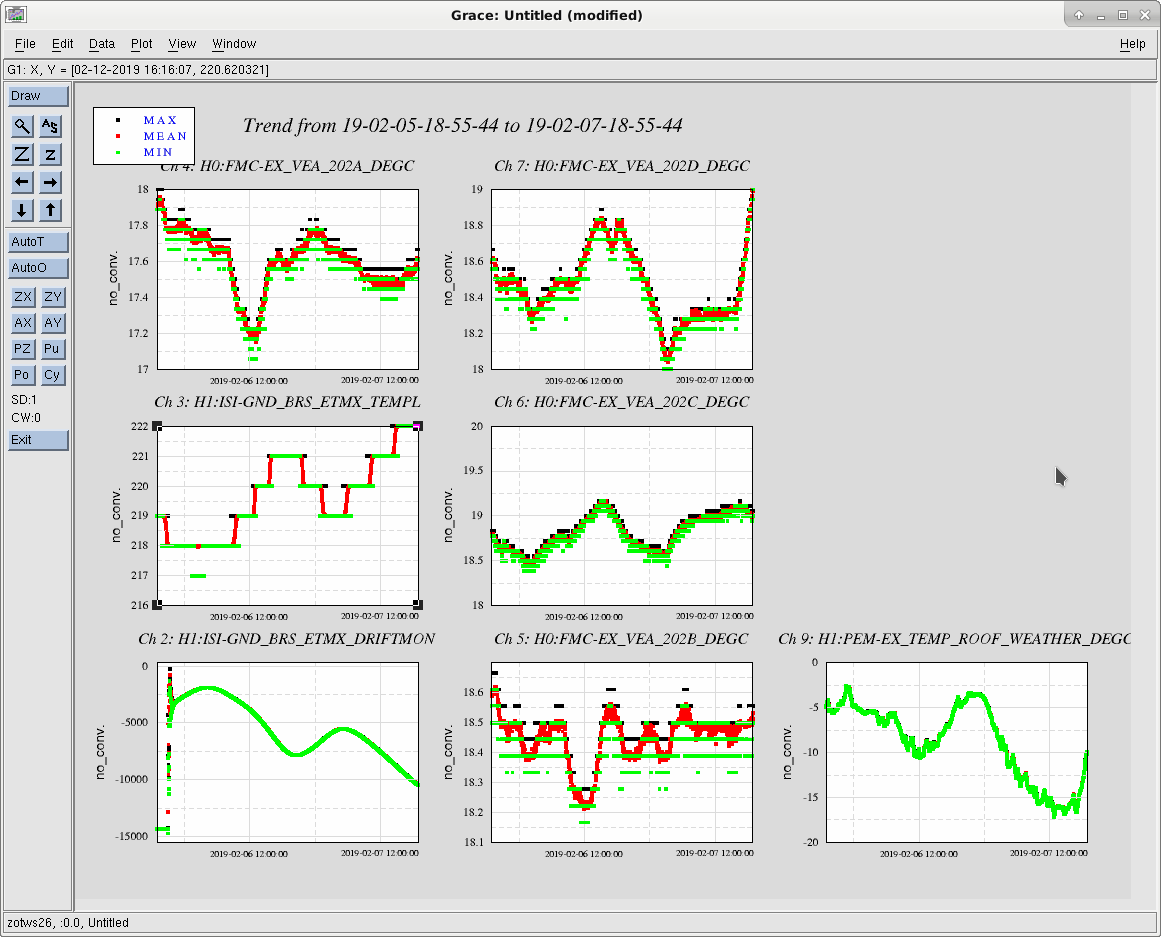
A couple weeks ago, Bubba changed the HVAC controls at the endstations, removing the B sensor from the loop, and just using the A C and D sensors. This seems to have helped the temperature stability of BRSX. First attached trends are for the last 2 days, the outside temps dropped about 10C, the driftmon moved about 3000 counts peak to peak, but the average position didn't really seem to move much. The second image are trends from 2 days around the 7th of this month, before Bubba's change. For this earlier time, the outside temps dropped about 10C outside, BRSX moved about 8000 counts peak to peak, with the average moving maybe 4000 counts.

Images attached to this report
Comments related to this report
arnaud.pele@LIGO.ORG - 17:21, Friday 22 February 2019 (47091)

Nice set of data Jim.

From the first set of plots, it looks like your EX BRS drift sensitivity to temperature is 0.2degC / 3750 cts * 32000 cts / CCD= 1.7 degC / CCD. 

In other words when the box temperature changes by 1.7 degC, the brs would drift full range on the CCD.

For comparison, our least sensitive BRS at LLO is IY ~ 1.3 degC / CCD and most sensitive EY ~0.5degC / CCD.

H1 PSL (PSL)
peter.king@LIGO.ORG - posted 09:38, Friday 22 February 2019 - last comment - 22:03, Friday 22 February 2019(47068)
FSS adjustments
Following on from yesterday's FSS work and taking advantage of the earthquake, I carried out some
further FSS work.

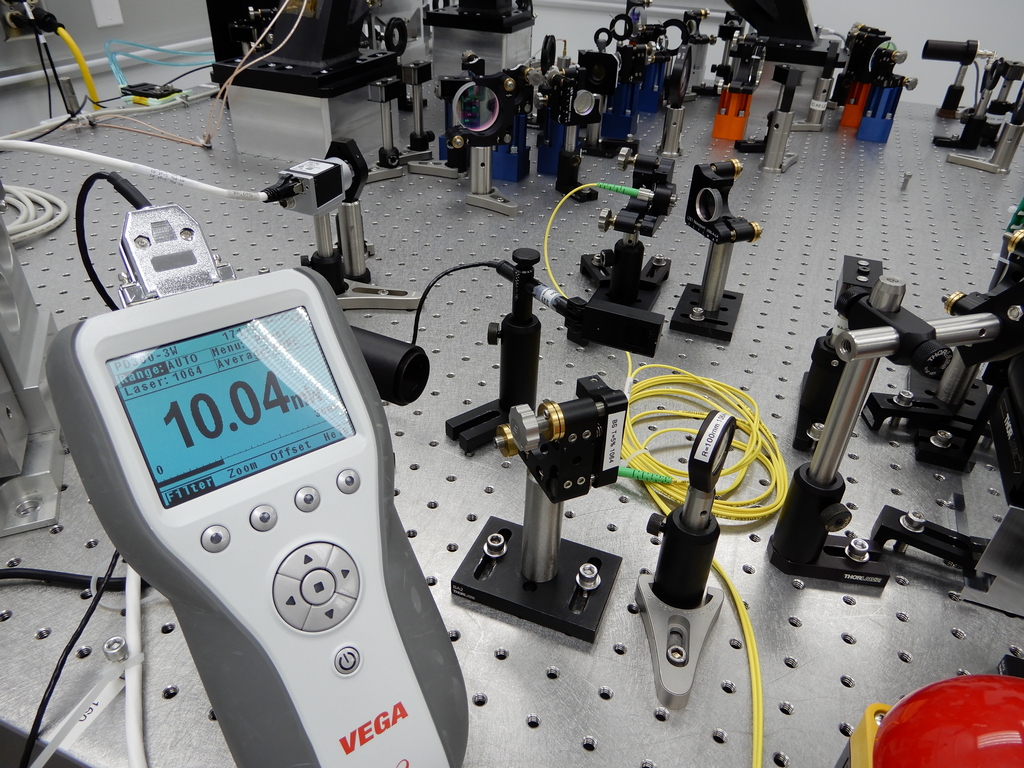
    All power measurements were done with the Ophir PD300-3W.

 - ~29 mW at base of periscope
 - ~1.5 mW incident on RF photodiode

    Noticed that there was a bit of beam clipping on the 21.5 MHz EOM, with the beam hitting around 9 o'clock
looking at the input face.  After correcting for this the power on the RF photodiode increased to ~2.8 mW.
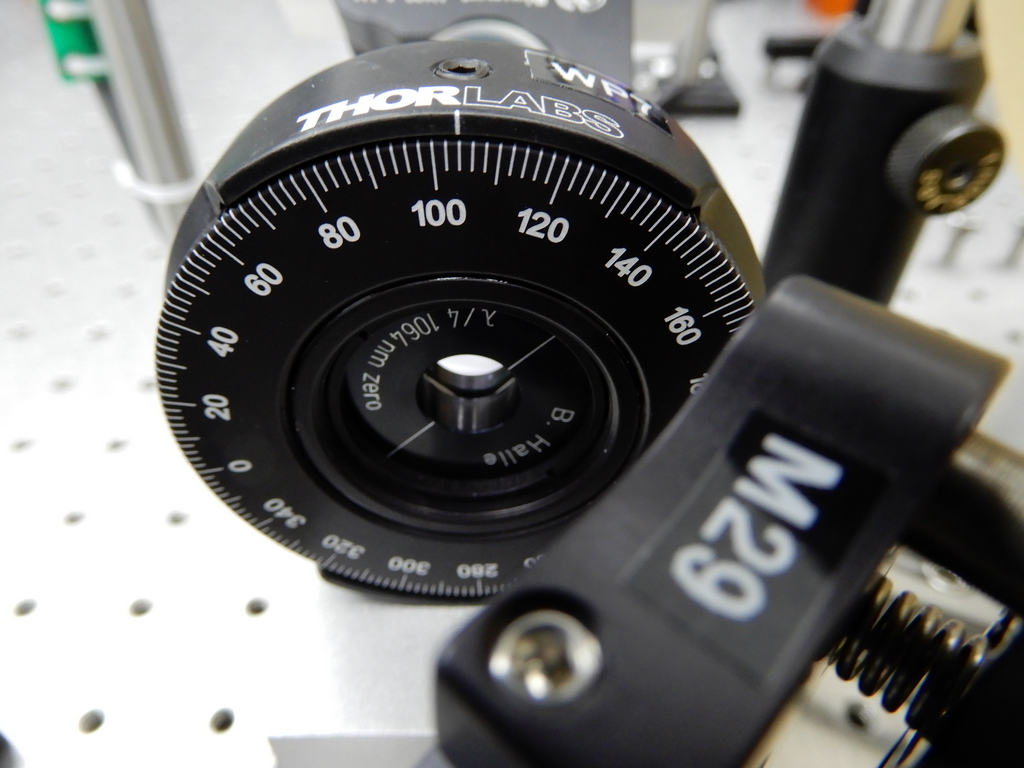
Adjusted the quarter-waveplate at the base of the periscope to give 3 mW on the RF photodiode.  The UGF is now
back up over 500 kHz.  At this point the transmission monitor was saturated at 10.95 V.  (C28F15.TIF, C28F15.TXT
for data).  Measured the power before the turning mirror in front of the ALS fibre to be ~7 mW at this point
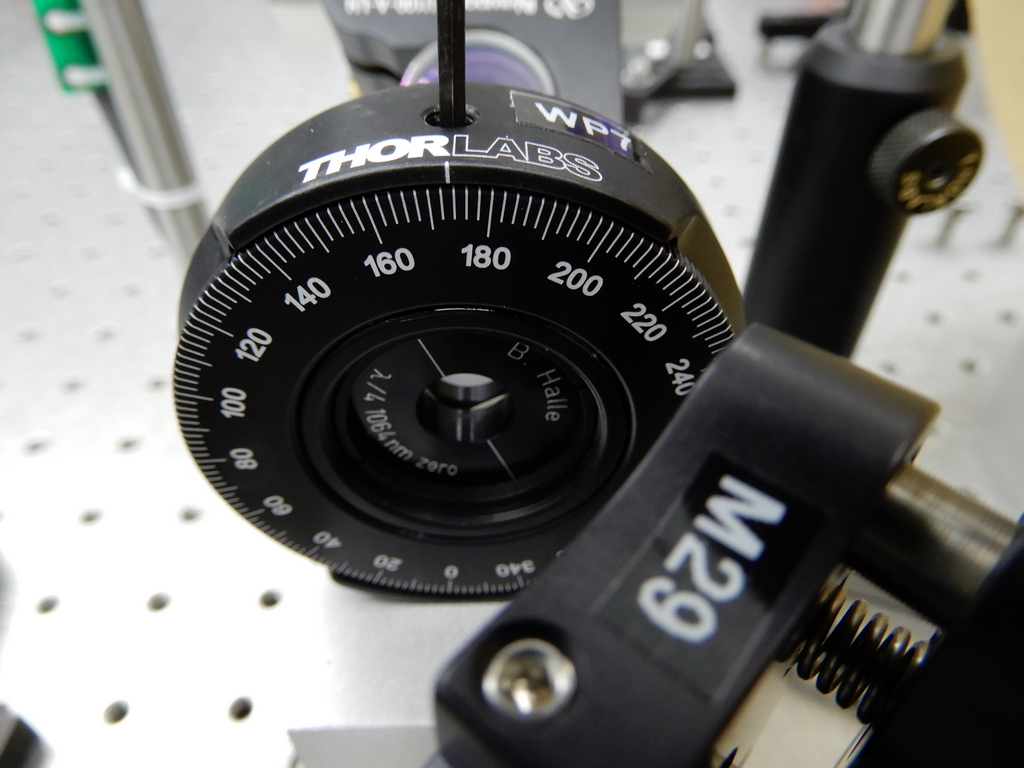
(see Before.jpg for quarter waveplate angle).  I adjusted the quarter waveplate located after the reference cavity
and this increased the power at the ALS fibre and decreased the transmission signal (see After.jpg and Power.jpg).
The transmission signal at this point was ~2.1.  The maximum power to the ALS fibre appears to be somewhere between
11-12 mW and the transmission signal drops as low as 1.5 V.  Thus far I haven't thought too much about what all
the polarising optics do.

Data files attached to this entry:
  TP3-1.txt mixer monitor signal when the FSS was locked
  DARK.txt mixer monitor signal when light to the RF photodiode was blocked
  LOCKED.txt mixer monitor signal when the FSS was locked (data memory was recorded)
  OLTF.txt open loop transfer function taken just prior to my exiting the enclosure (a reality check)
  CG28FG15.txt transfer function out to 5 MHz

    Richard trended the ALS fibre monitor signal, there was a small increase noted.
Images attached to this report
Non-image files attached to this report
Comments related to this report
peter.king@LIGO.ORG - 09:16, Friday 22 February 2019 (47076)
RF photodiode signal level:
  unlocked 290 mV
  locked 58-59 mV
daniel.sigg@LIGO.ORG - 16:54, Friday 22 February 2019 (47090)

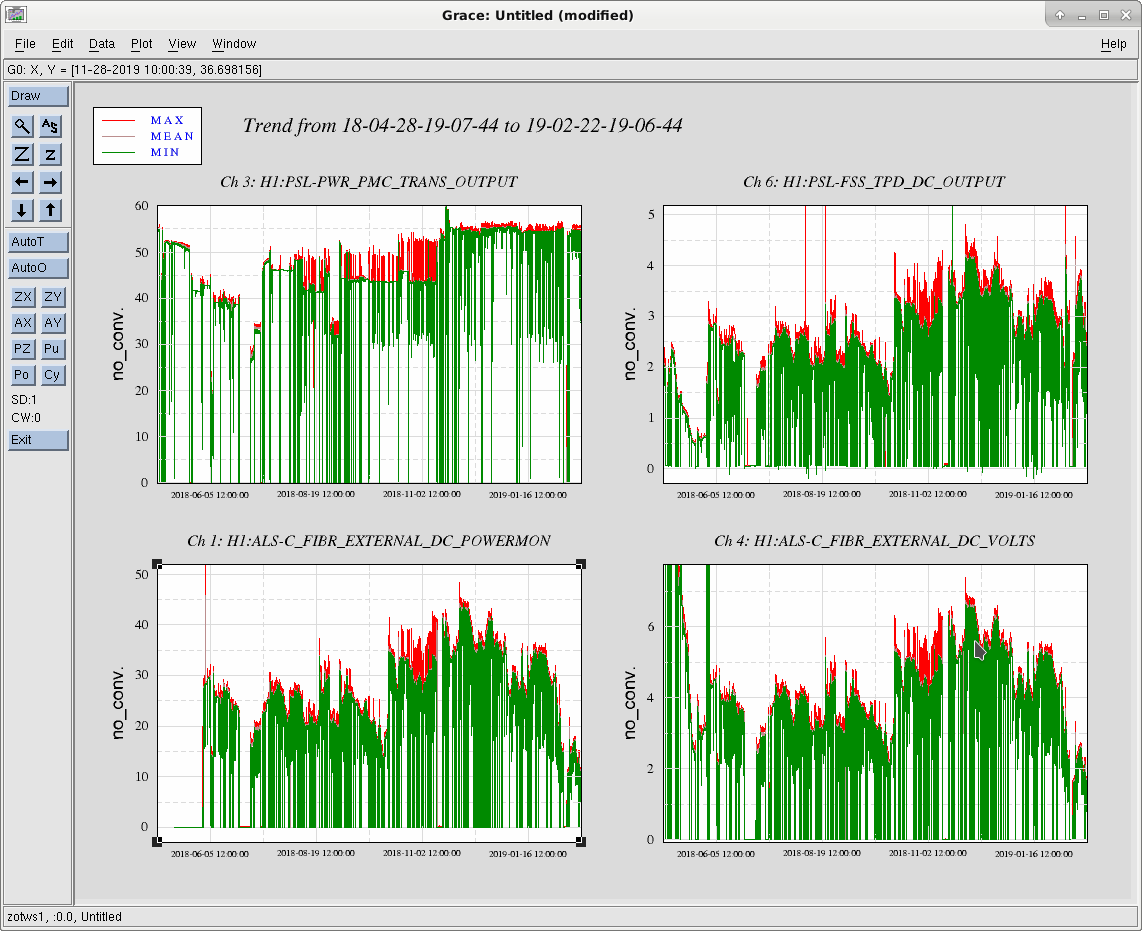
The astute reader will have noticed that with ~30mW input, there is ~6mW in reflection and 12mW or less available to the ALS fiber.  The attached plot shows a 300 day trend of the PMC power, the reference cavity transmitted power and the power available to the ALS fiber. In general, the transmitted and ALS power are tracking until about 2 weeks ago, when the ALS power started dropping relative to the transmitted power. As of today, there is about a factor of 2 missing.

Images attached to this comment
craig.cahillane@LIGO.ORG - 22:03, Friday 22 February 2019 (47095)
Attachment One: Peter's three FSS OLGs plotted together.
Attachment Two: Full 30W Lock CARM, IMC, and FSS OLGs together. (FSS OLG not taken during full lock)
Non-image files attached to this comment
H1 ISC
jenne.driggers@LIGO.ORG - posted 07:55, Friday 22 February 2019 - last comment - 19:55, Friday 22 February 2019(47067)
OMC DCPDs to Low Z

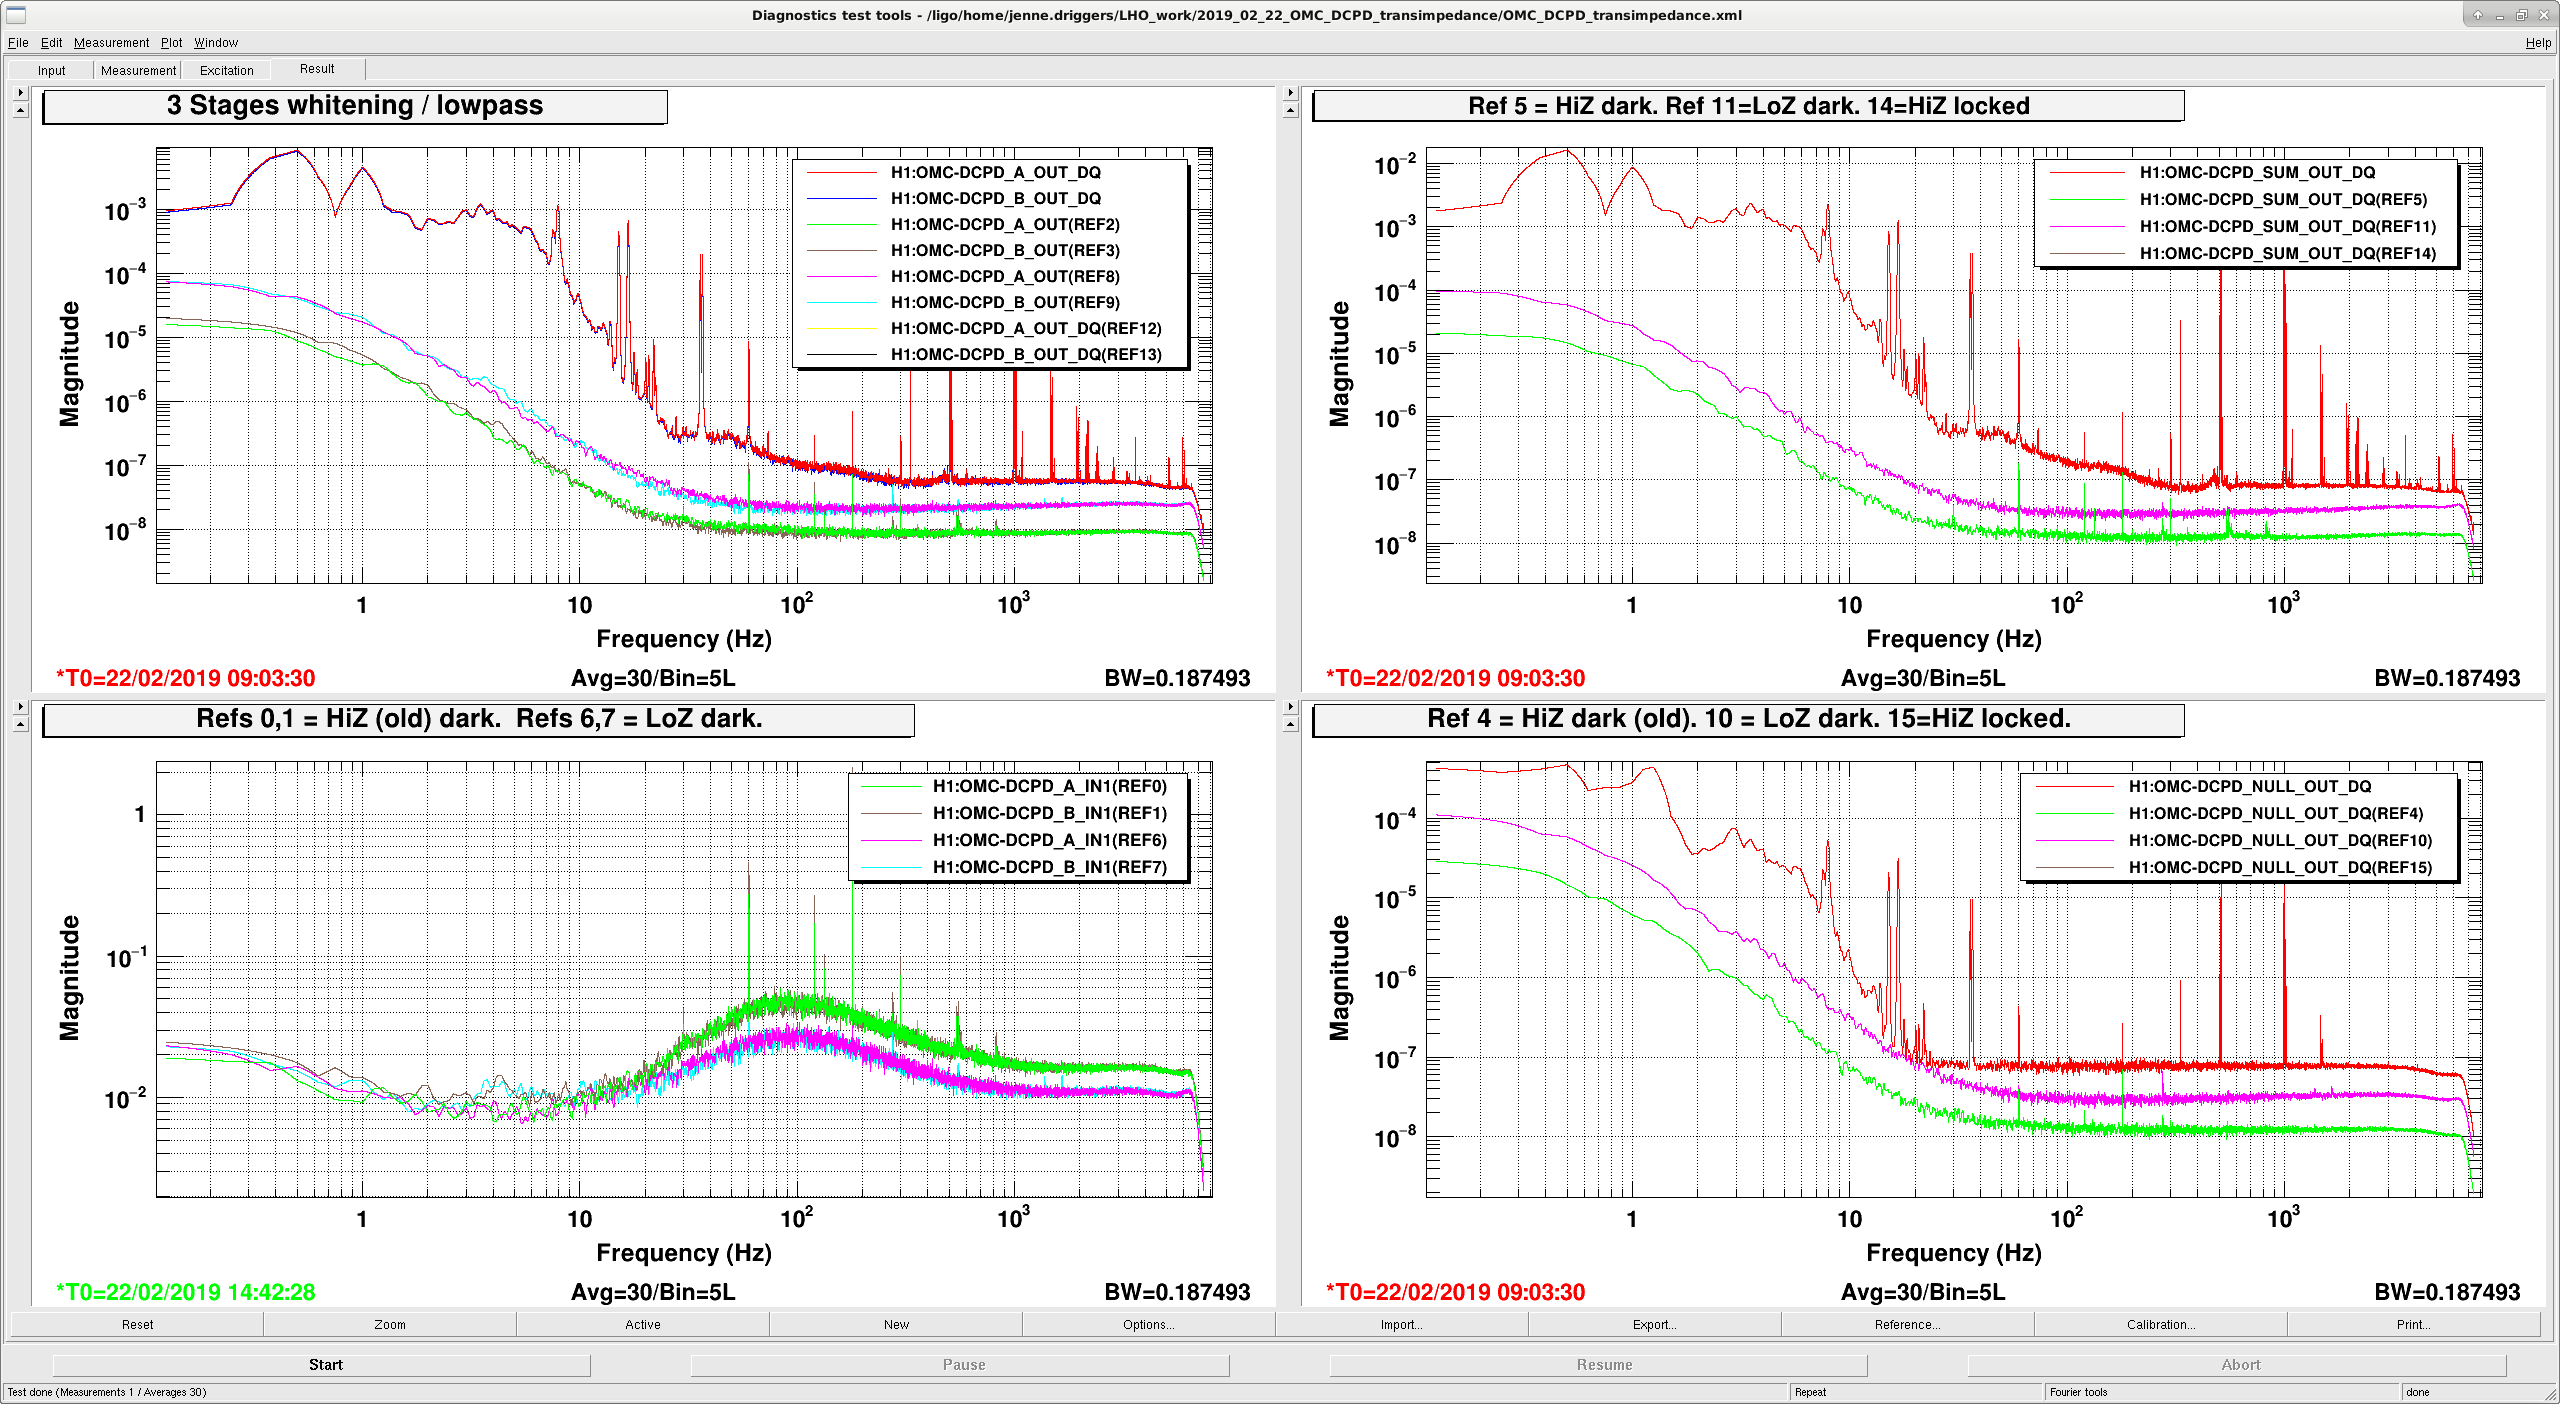
As a step toward trying larger DARM offsets, I have flipped the rocker switch on the OMC DCPD whitening chassis to its LowZ state.  To match this, I have turned off the HiZ filter in the H1:OMC-DCPD_A and H1:OMC-DCPD_B filter banks.

Attached are some spectra showing the dark noise measured this morning in both the old HiZ and new LowZ states, as compared to last night's 30W lock at NomLowNoise.  All of these spectra are taken with both stages of whitening on, as well as the lowpass.  Green and brown are with the old HiZ settings, pink and cyan are with the current LowZ settings, and the red and dark blue (also refs 12-15 underneath the red and blue) are from last night's lock with the usual 20mA of light.

Images attached to this report
Comments related to this report
jenne.driggers@LIGO.ORG - 08:42, Friday 22 February 2019 (47073)

In prep_dc_readout, with OMC locked, I changed the height of the dither line from 750 counts to 630 counts, to match the OMC length UGF of 6 Hz measured 2 days ago.

sheila.dwyer@LIGO.ORG - 19:55, Friday 22 February 2019 (47093)

We reverted these changes (dither amplitude, HiZ switch and compensation for HiZ) so that people can get to low noise tonight without redoing the feedforward.  

Displaying reports 42941-42960 of 88648.Go to page Start 2144 2145 2146 2147 2148 2149 2150 2151 2152 End