This message was sent to LHO-all at 13:46: All, With deteriorating weather conditions, personnel are advised to leave early today, especially before it gets dark and temperatures fall. Please exercise extreme caution with roads, traffic and weather. Best Regards, Jeff -- Jeffrey D. Jones, Operations Manager LIGO Hanford Observatory P.O. Box 159 Richland, WA U.S.A. 99352 phone 509-372-8136 http://www.ligo-wa.caltech.edu/
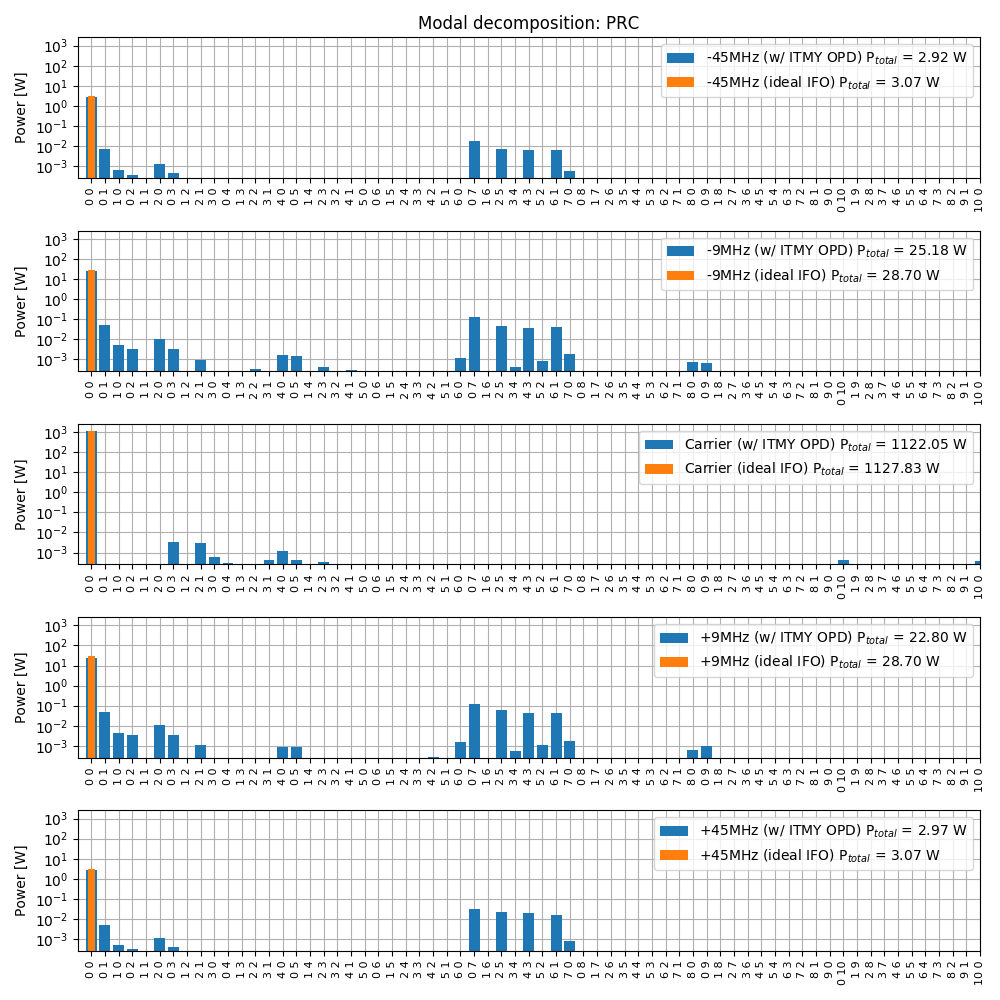
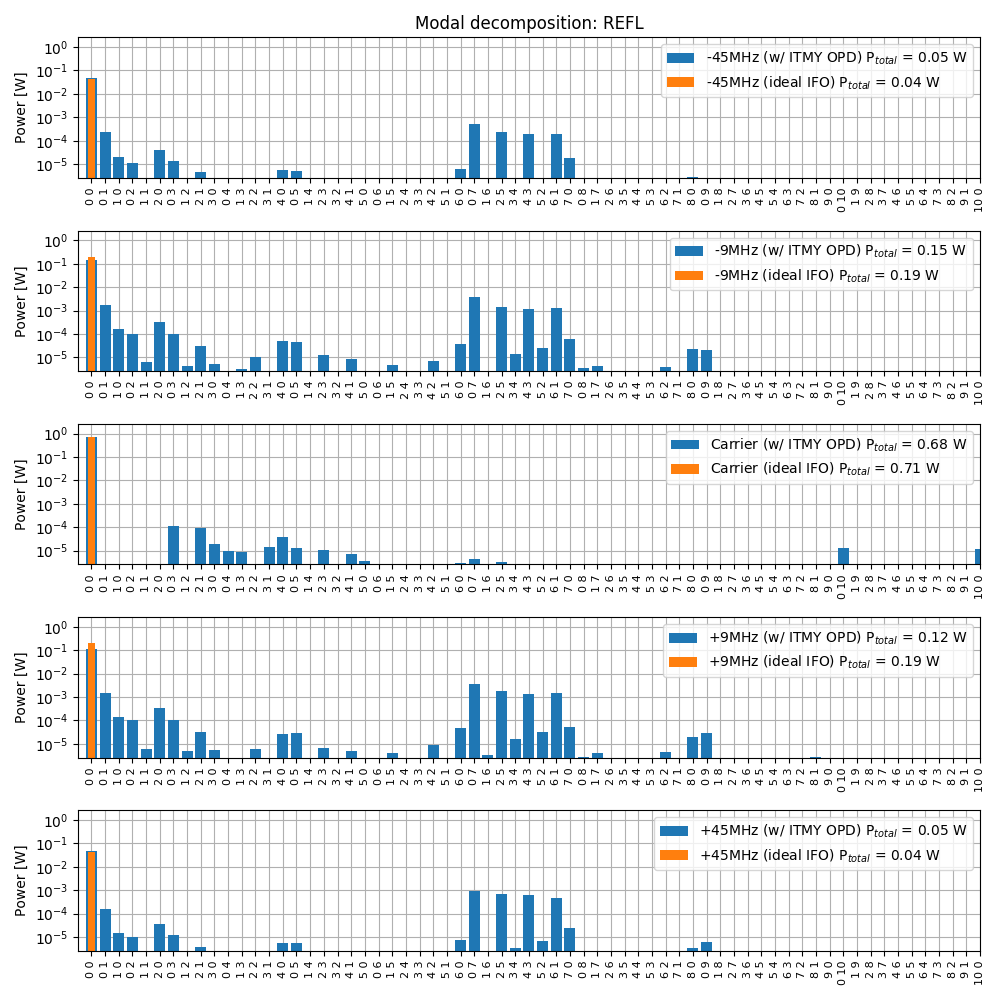
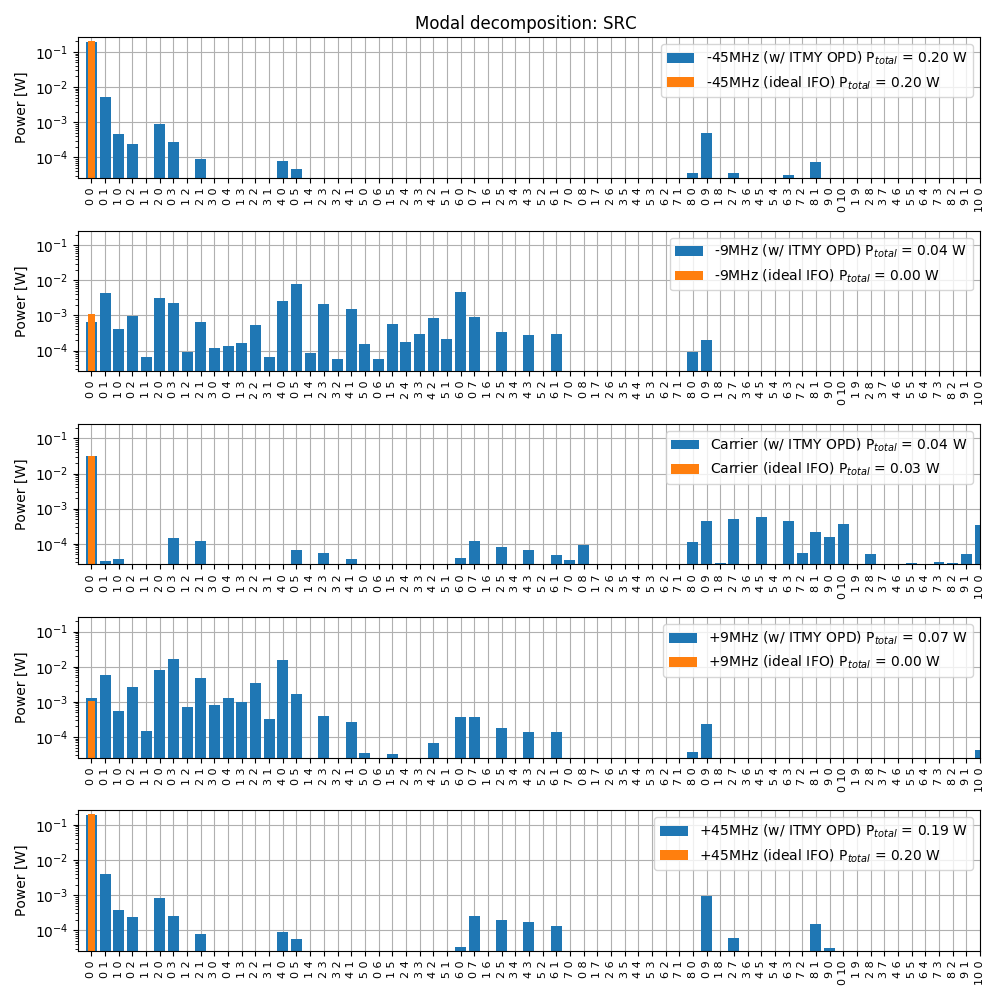
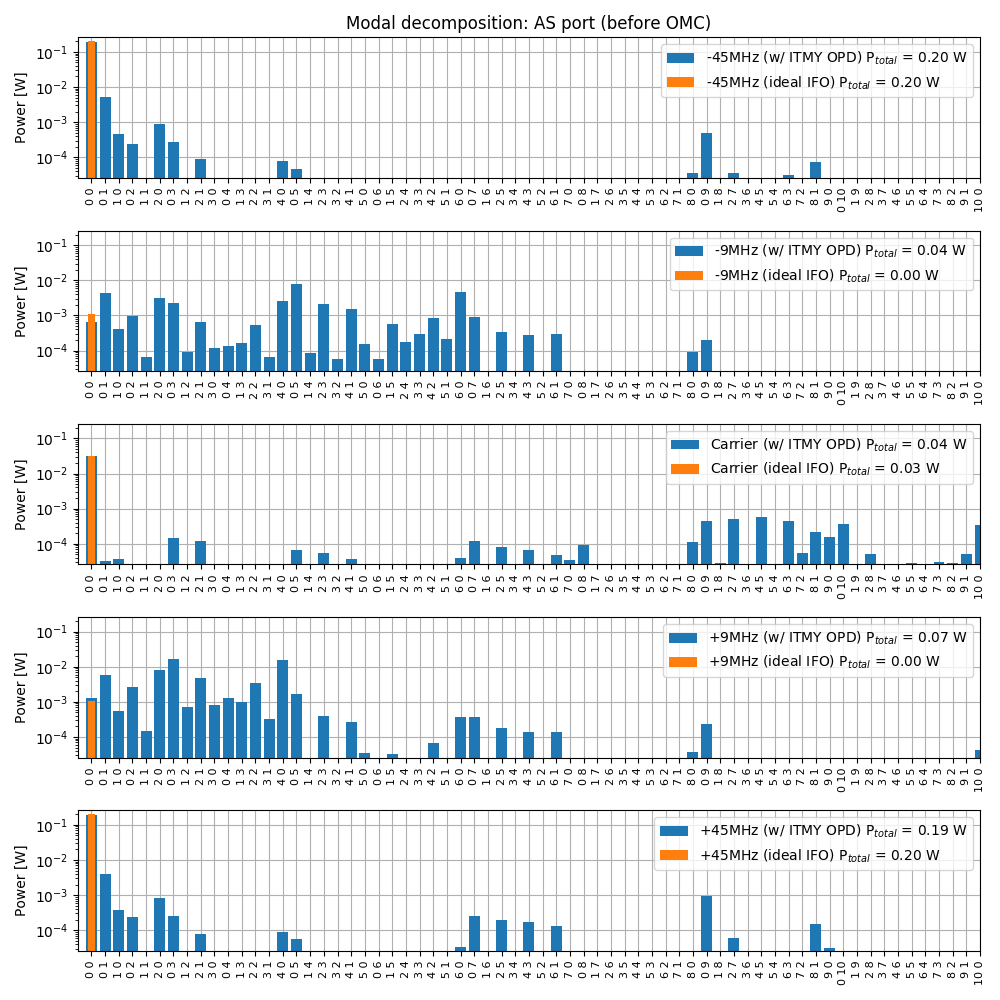
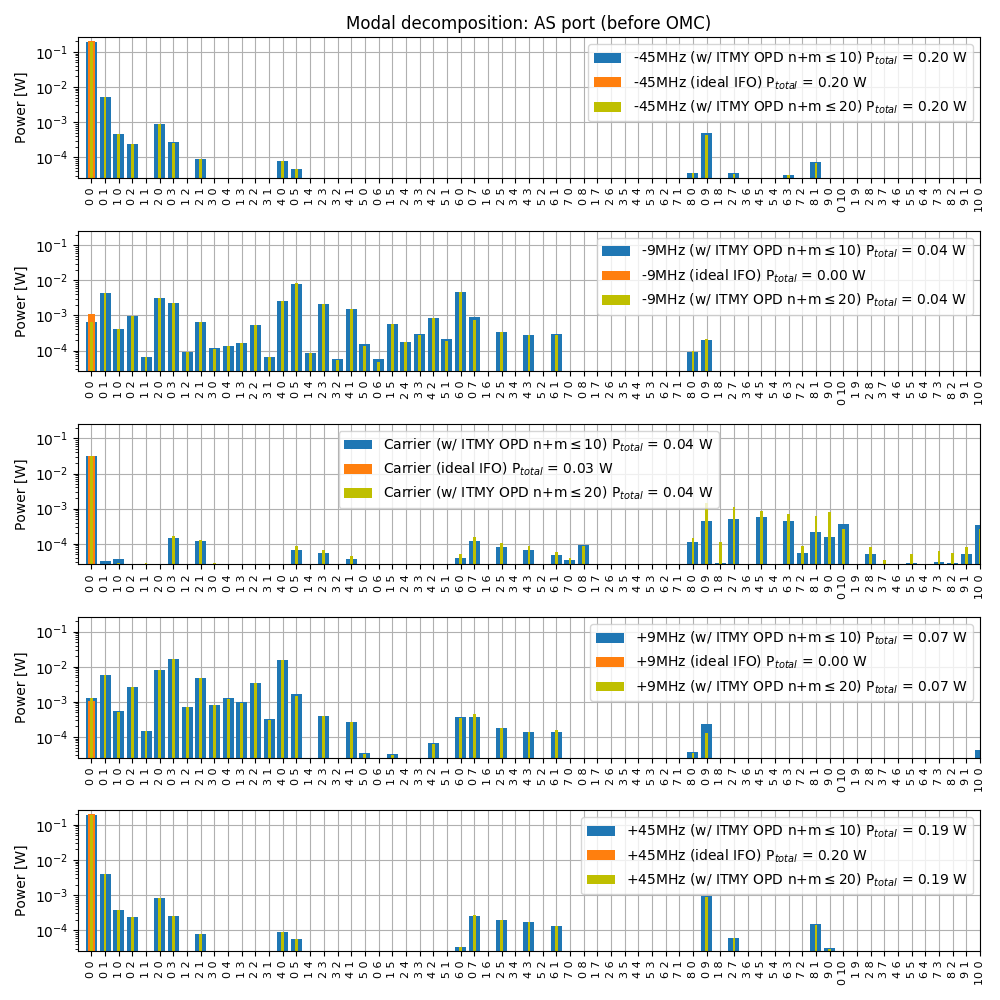
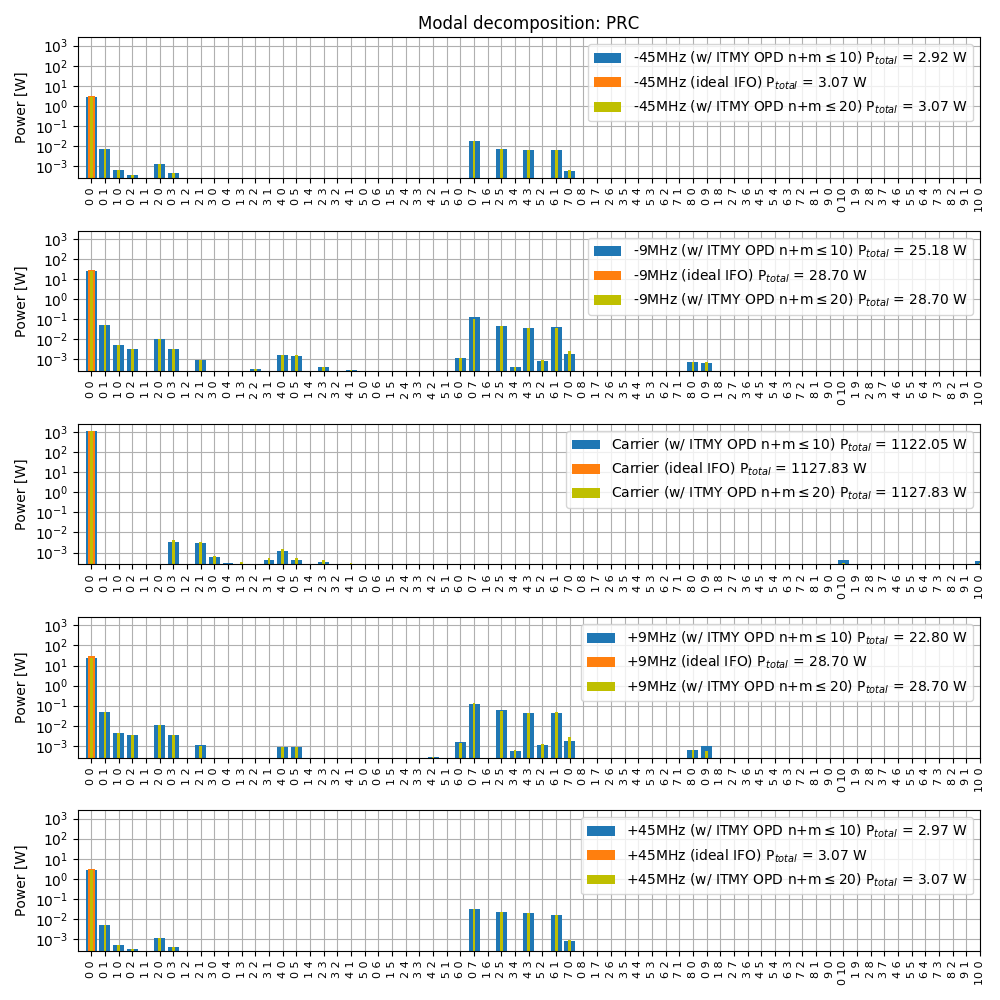
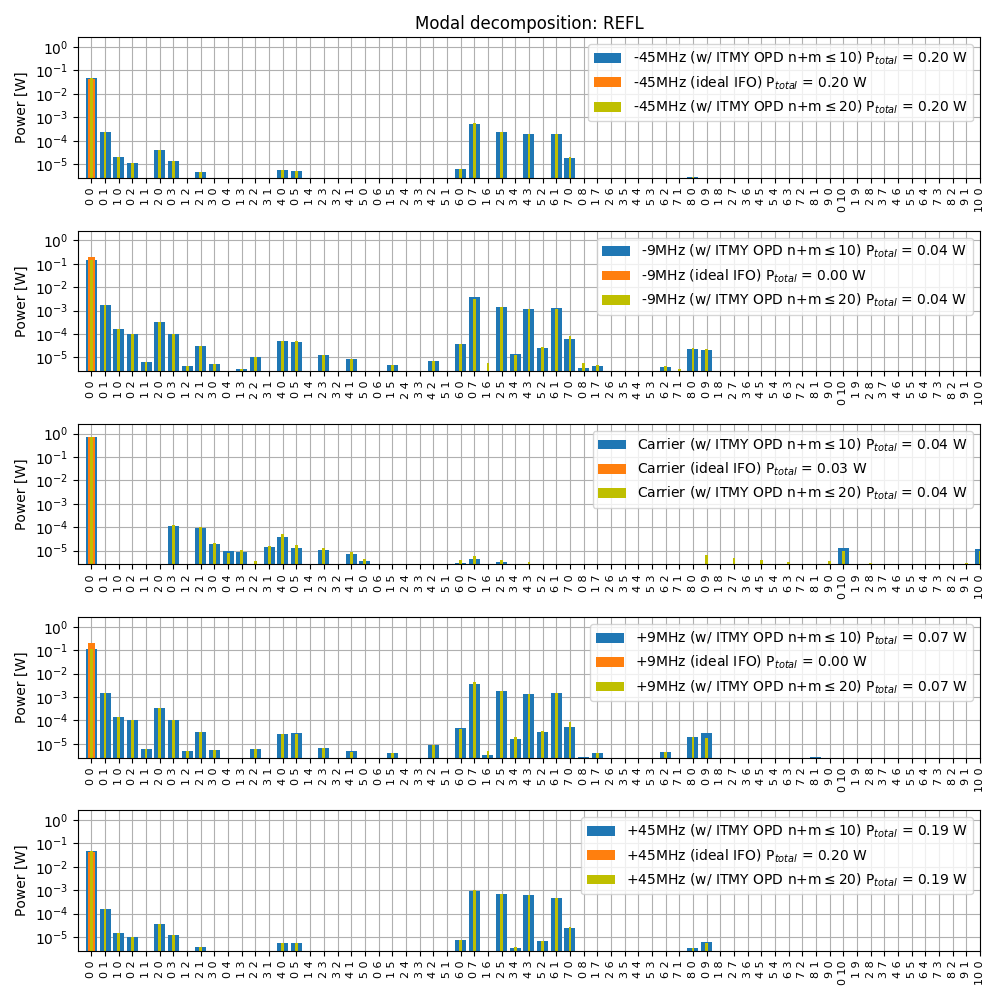
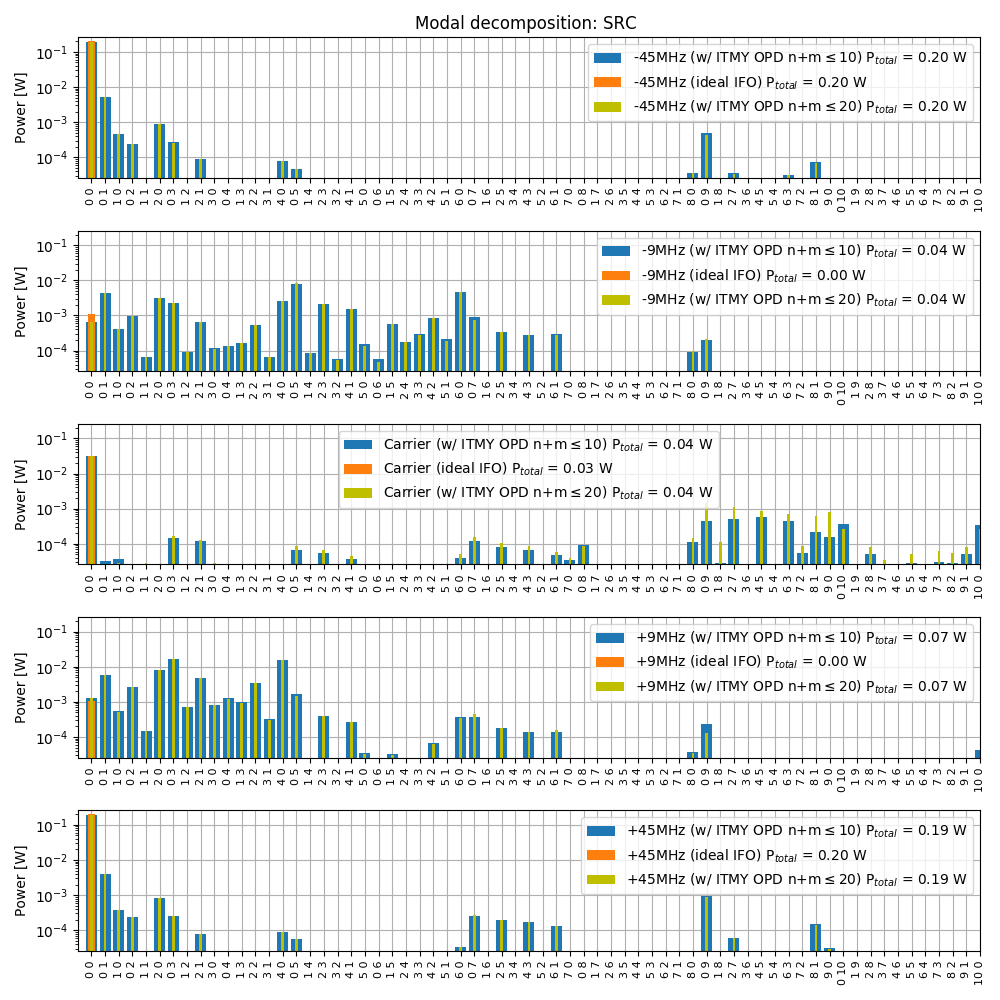
Using the optical path distortion measured by the HWS (provided by Aidan, see also 46127 and 46888) I simulated the mode content at various ports in a dual recycled Fabry-Perot Michelson interferometer. The simulation is done with MIST, using Hermite Gauss modes up to order 10, and locking the interferometer using simulated error signals.
Only the optical path distortion in the ITM is included, there is no deformation of the HR surface.
Each of the attached plots show the distribution of power into each modes, assuming 26 W of input power, 60ppm or round trip losses per arm. The orange traces are there for comparison, to show that in a ideal IFO, all power is in the fundamental TEM00 mode.
Interestingly, the point absorber seems to create some 9MHz sideband power in modes of order 9 at the AS port, which we believe are the culprit for the high RF9 modulation noise coupling.
Nice.
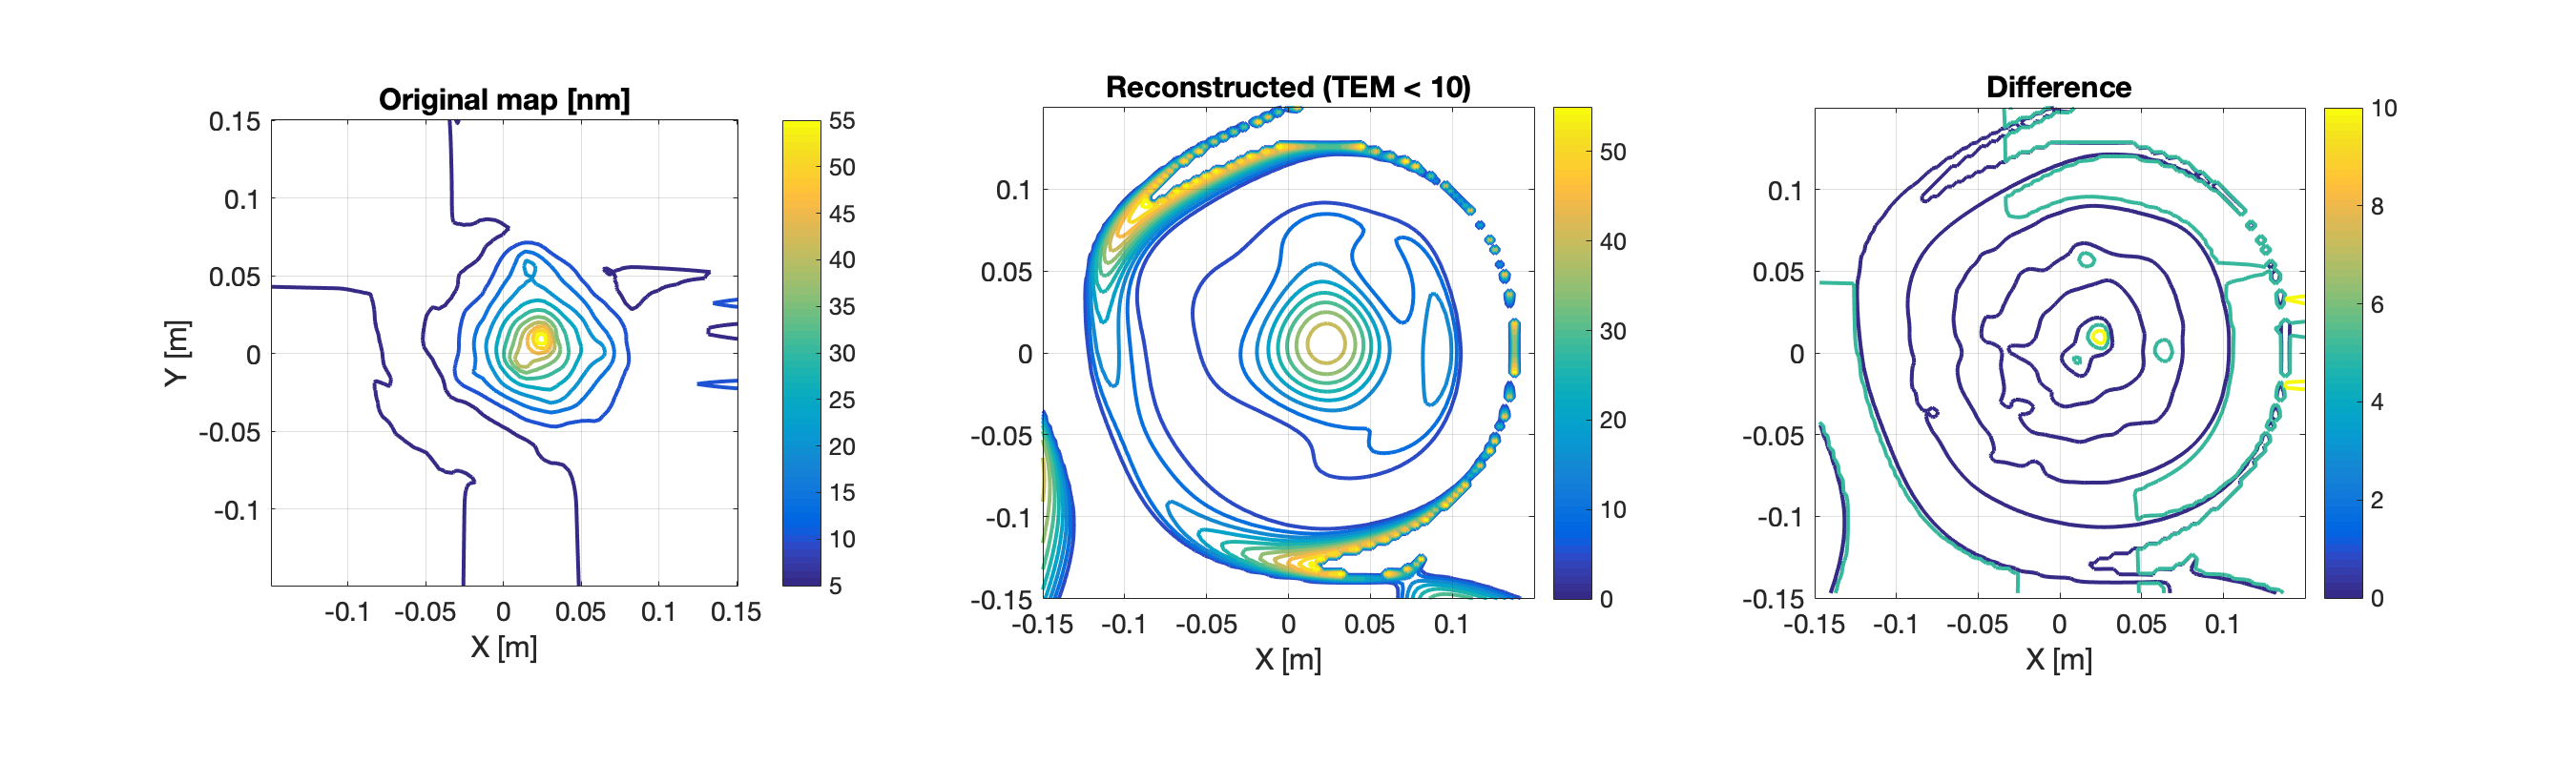
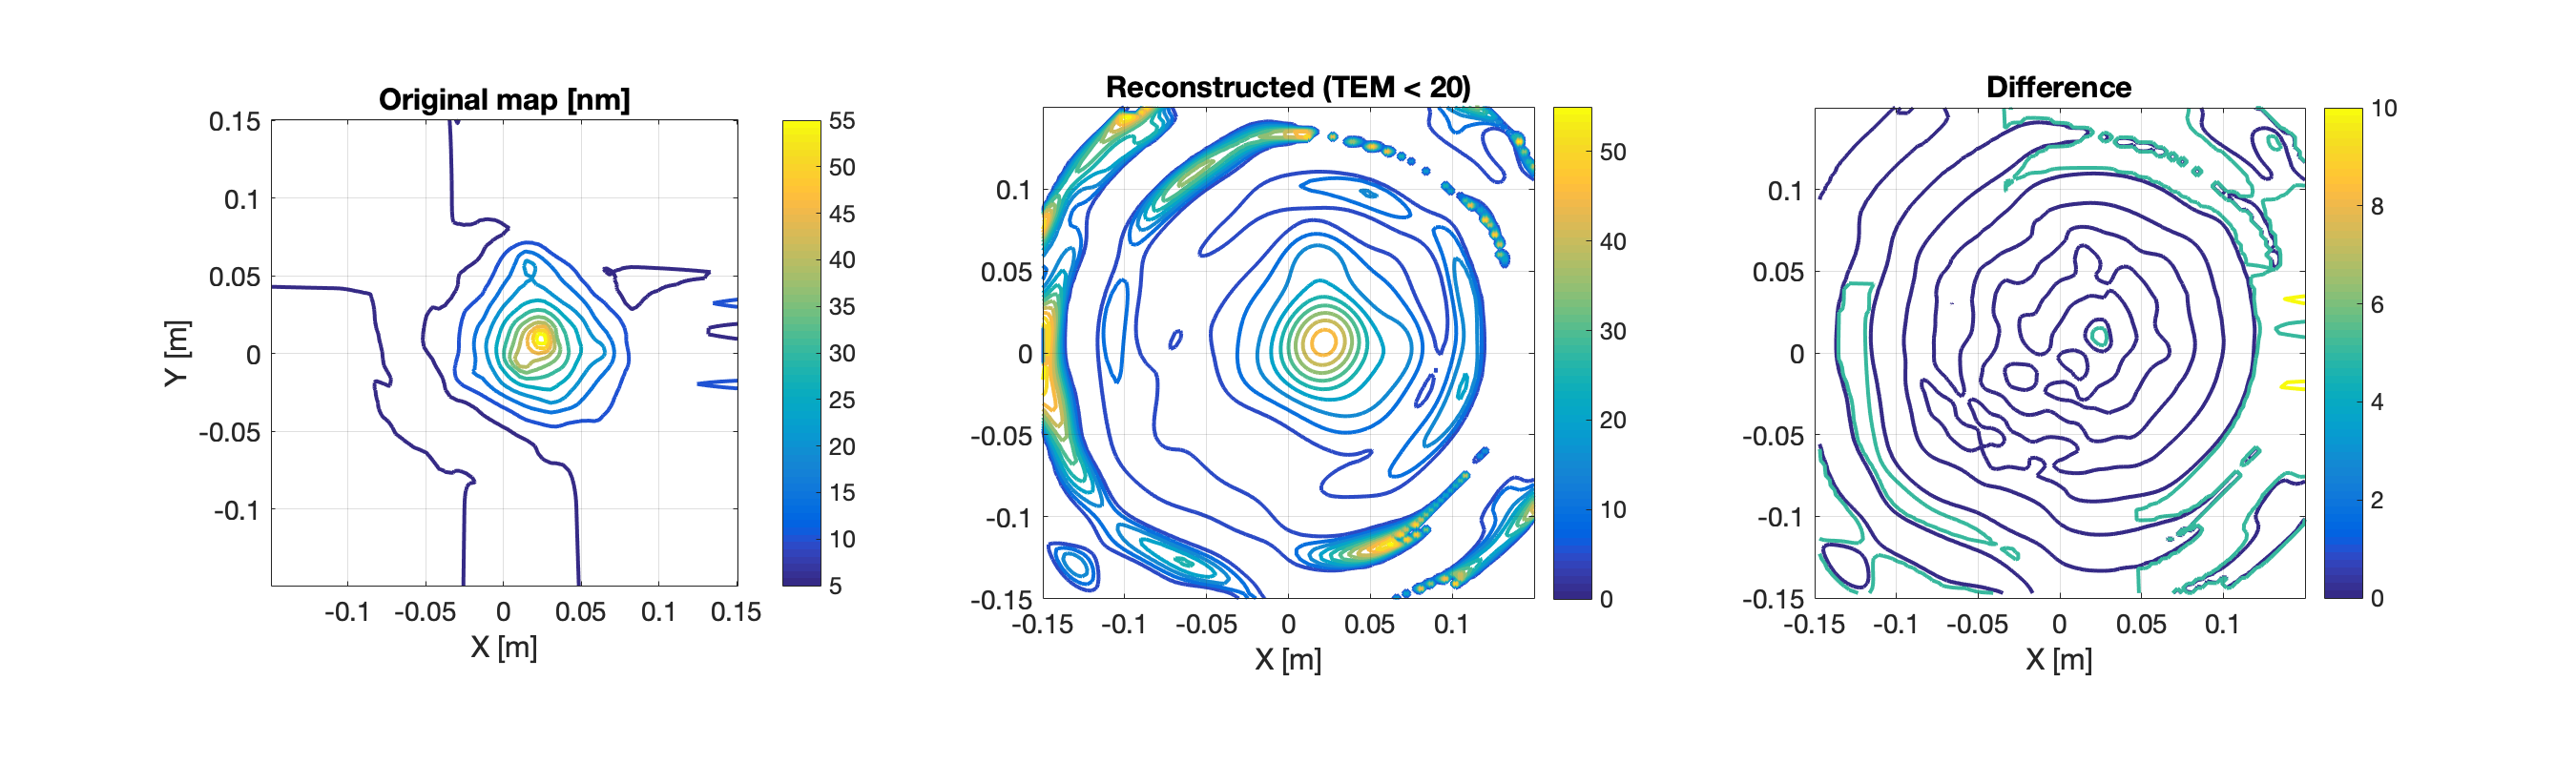
Can you post a comparison of the original wavefront distortion, the 10-th order reconstruction with HG modes and the difference between them?
Aidan, there it is. Left the original single pass map, in nm. Center the map reconstructed from the simulation (take the ratio of the beam transmitted by the substrate over the beam at the input of the substrate, then take the phase, rescale with lambda/2/pi). Right the difference. Clearly the reconstructed map is no good for radii larger than 7-8 cm, since there is no significant laser power there.
The difference shows also that Hermite Gauss modes up to n+m<=10 are not quite enough to really capture the high spatial frequency feature at the absorber (since there's a residual peak there).
FYI.
Wavefront maps are available here: https://ldas-jobs.ligo.caltech.edu/~aidan.brooks/
They're not yet calibrated for the incident power but the general shape is clear and the GPS times are included.
Using Hermite Gauss modes up to n+m<=20 do not change significantly the mode content for the sidebands. There is however a larger amount of carrier power at the AS port for modes of order 8-10.
[Aidan, Danny VDH]
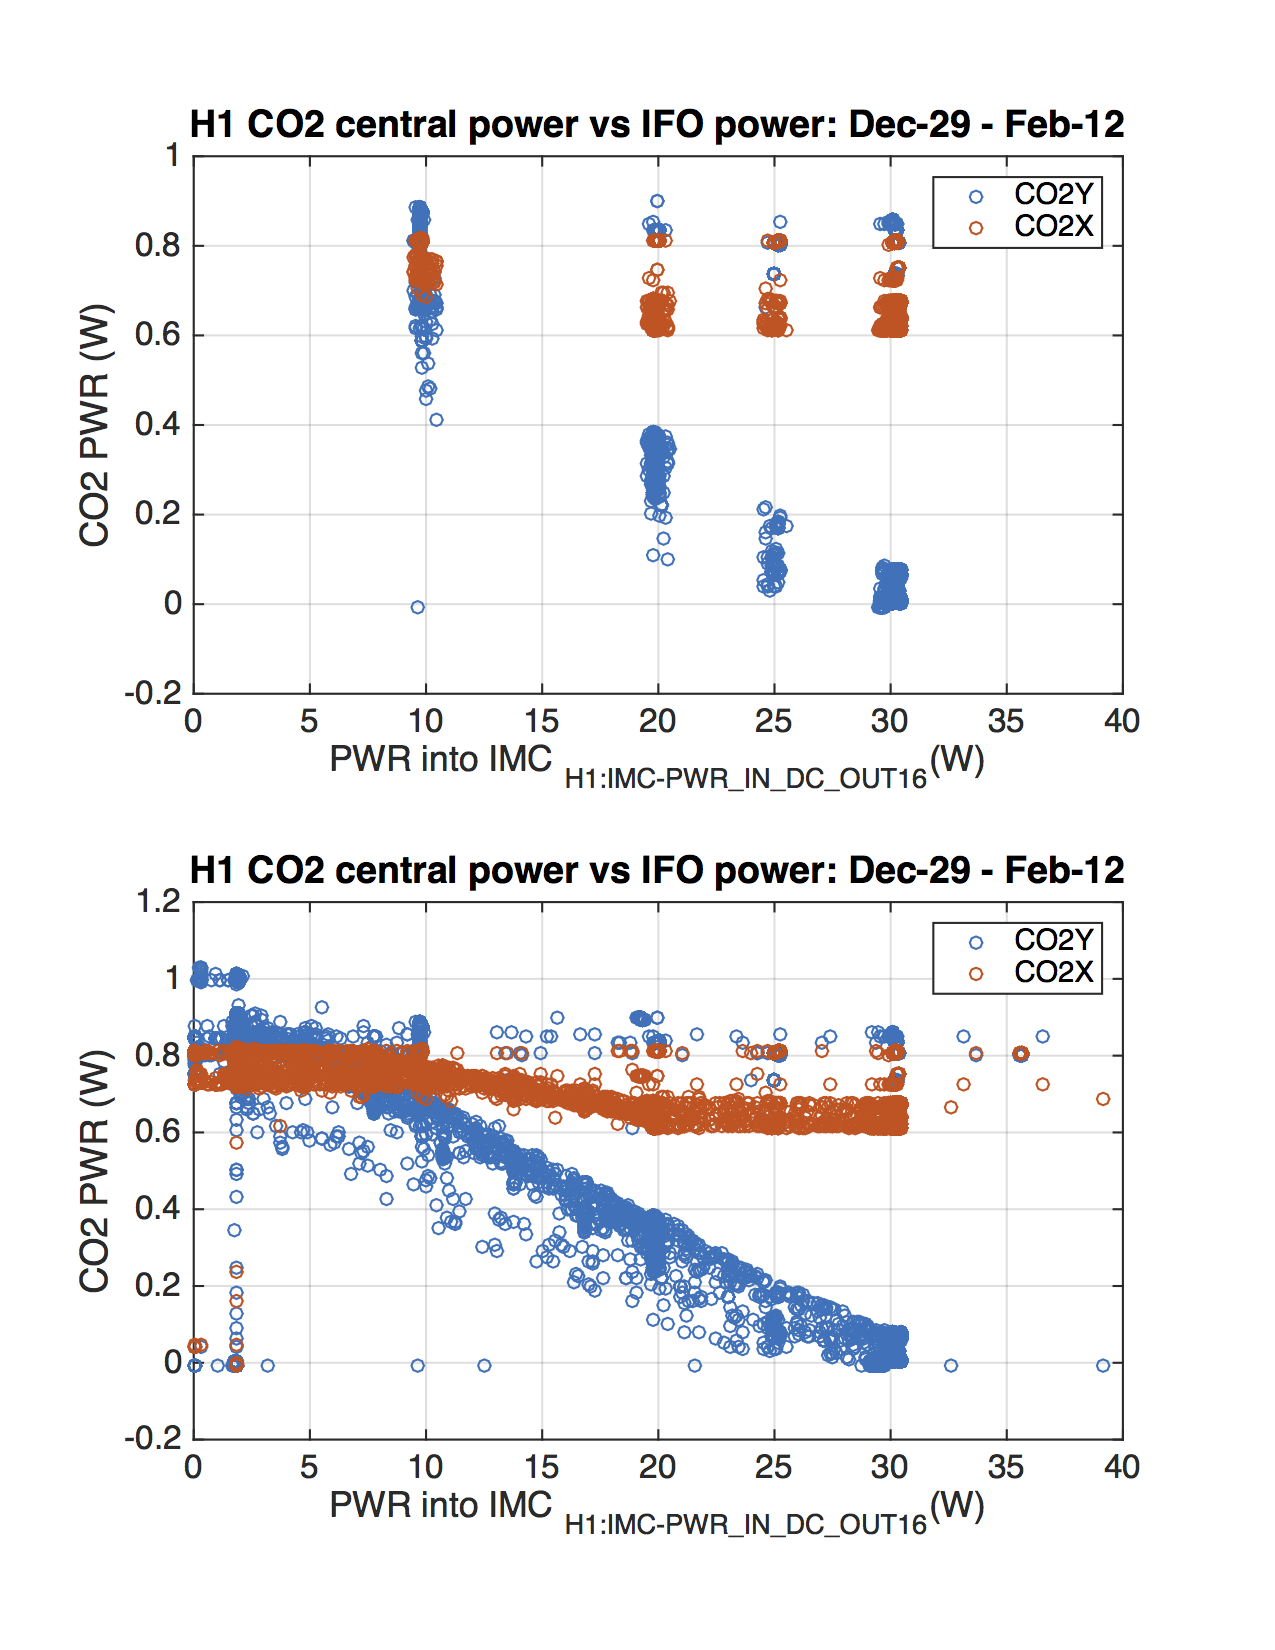
In order to determine how the H1ITMY mask should be used, I wanted to determine how much CO2 power was currently used at different power levels. To do this, I looked back over about 45 days worth of data and plotted the delivered CO2 power vs the power into the IMC.
There is a significant amount of fluctuation in the applied CO2 power from lock-to-lock, perhaps 100mW. This means that the amount of thermal lensing will also vary from lock to lock by. We should look more closely at the functioning of the rotation stage.
The two plots show the same set of data, but the top plots had isolated the regions around 10W, 20W, 25W and 30W for clarity.

Apparently the tolerance on the actual power is "within 0.08W" of the requested power, so this is as expected. We should examine if this is too loose a tolerance.
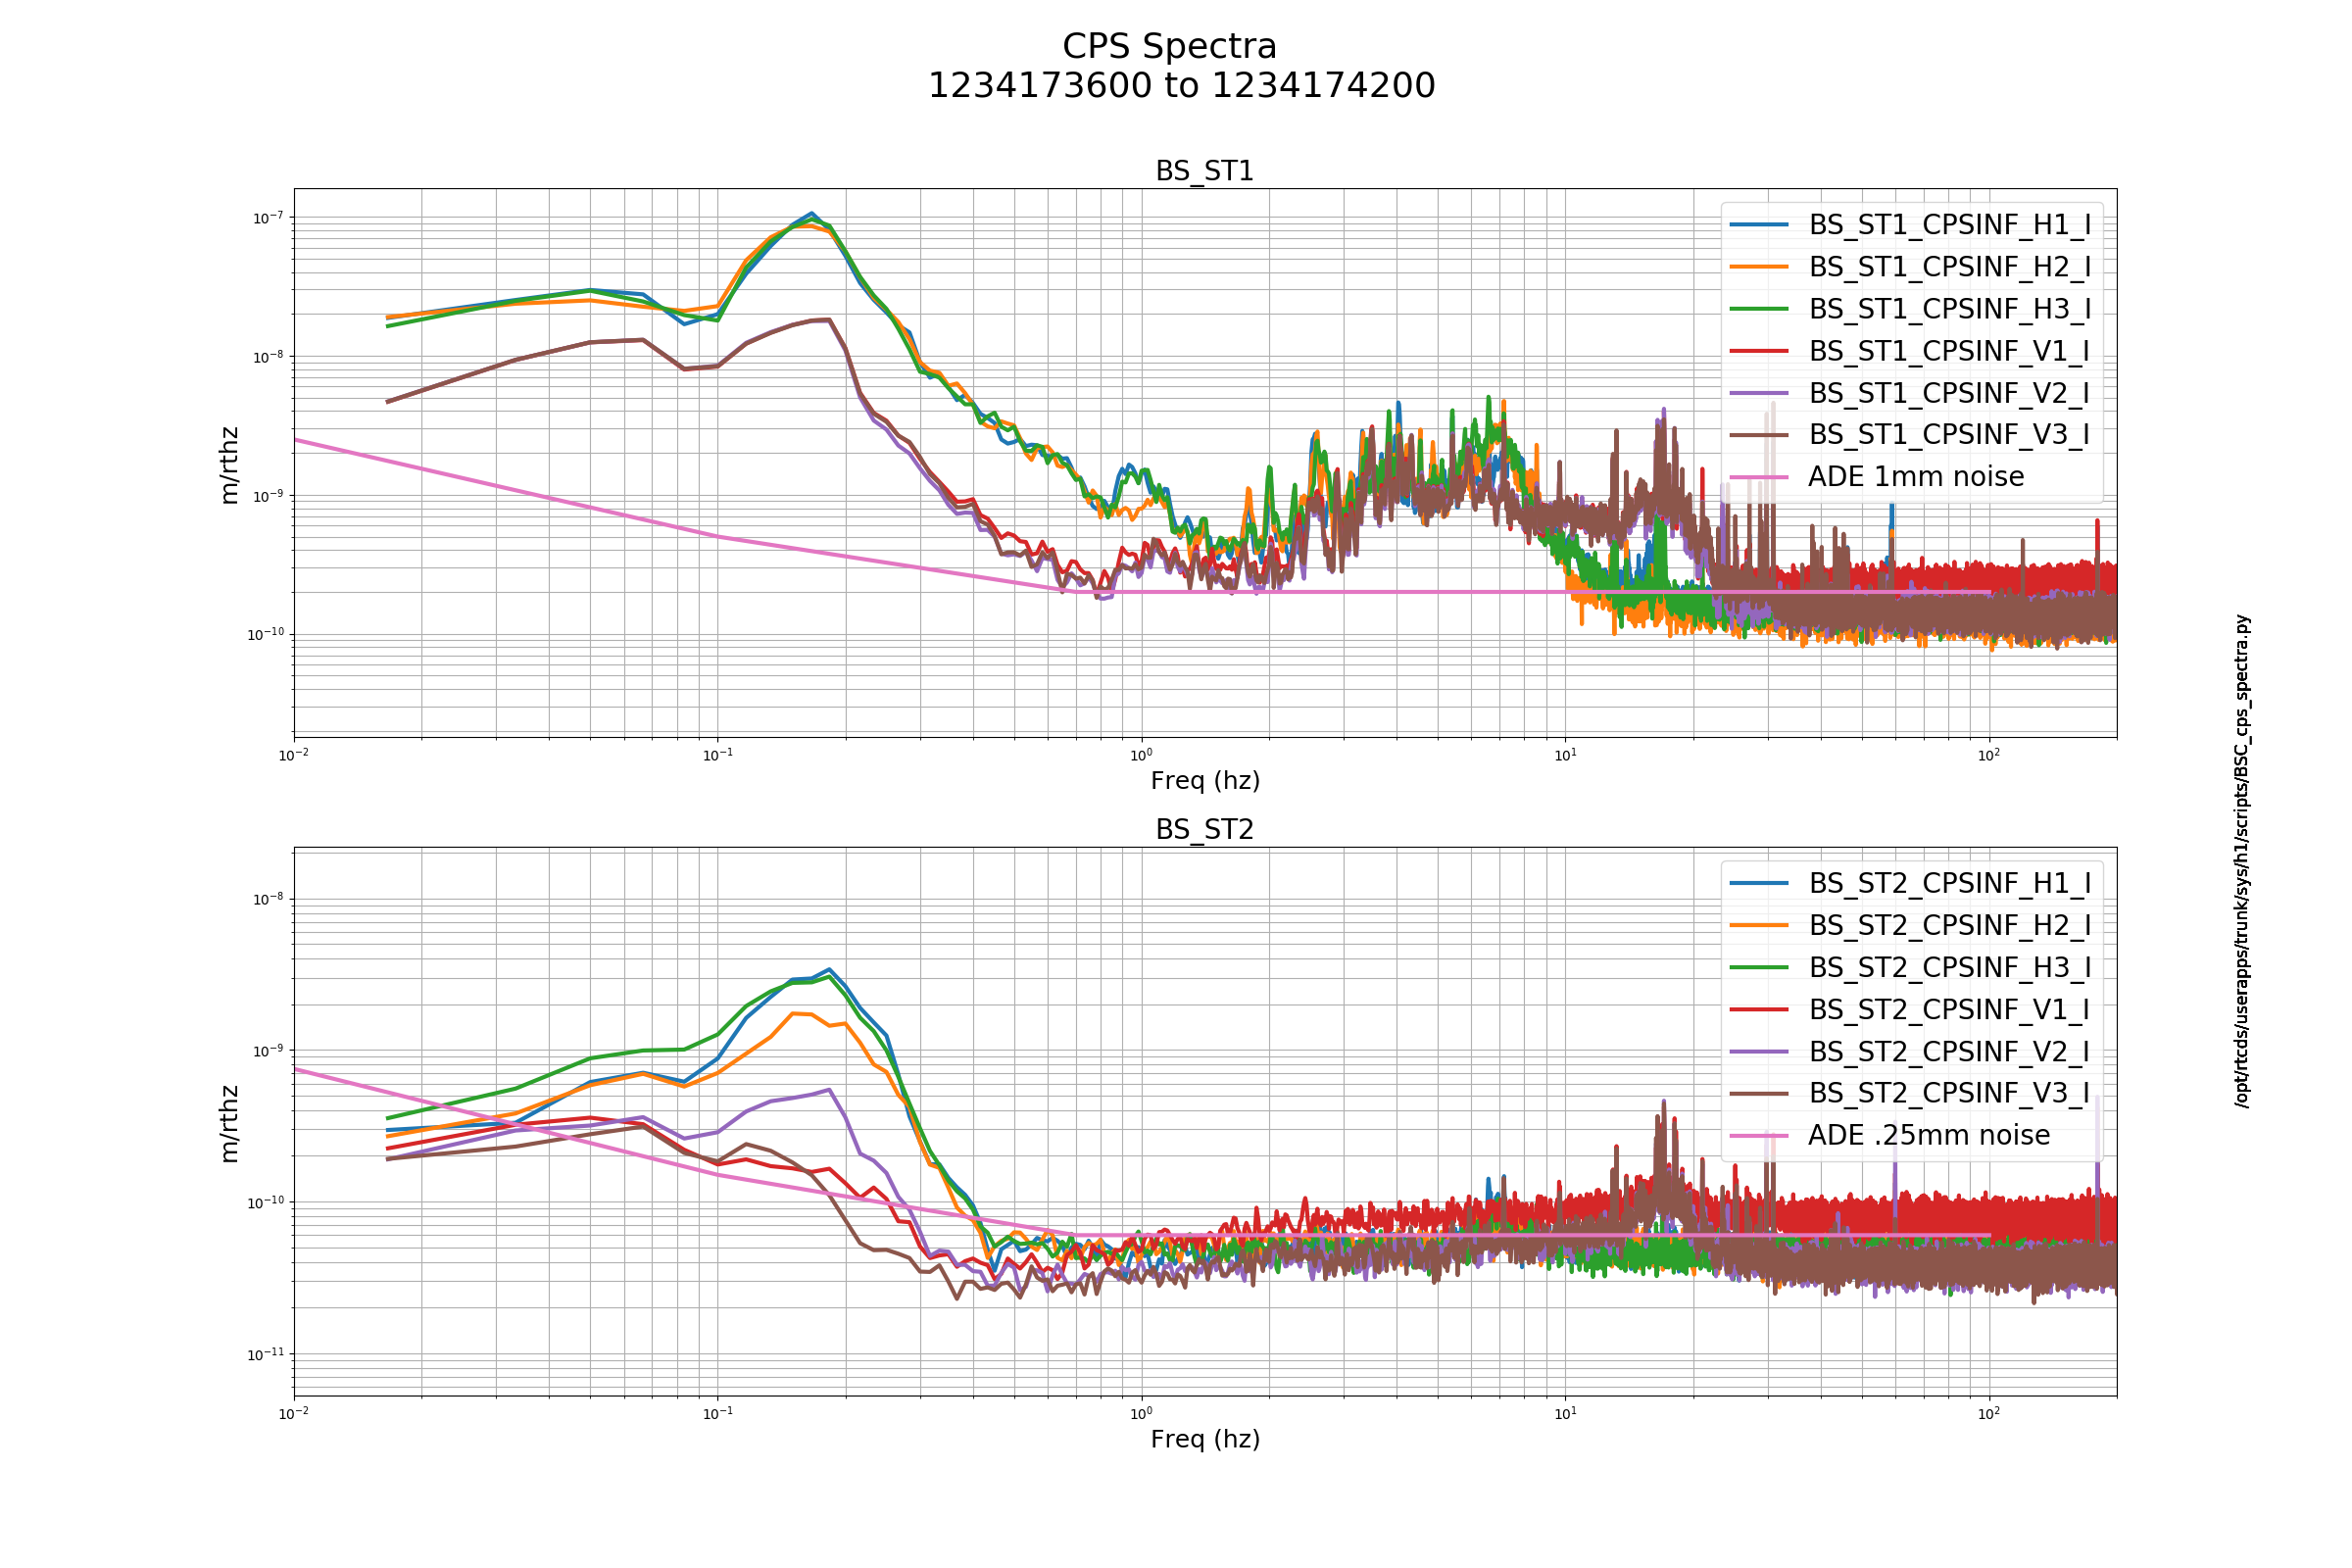
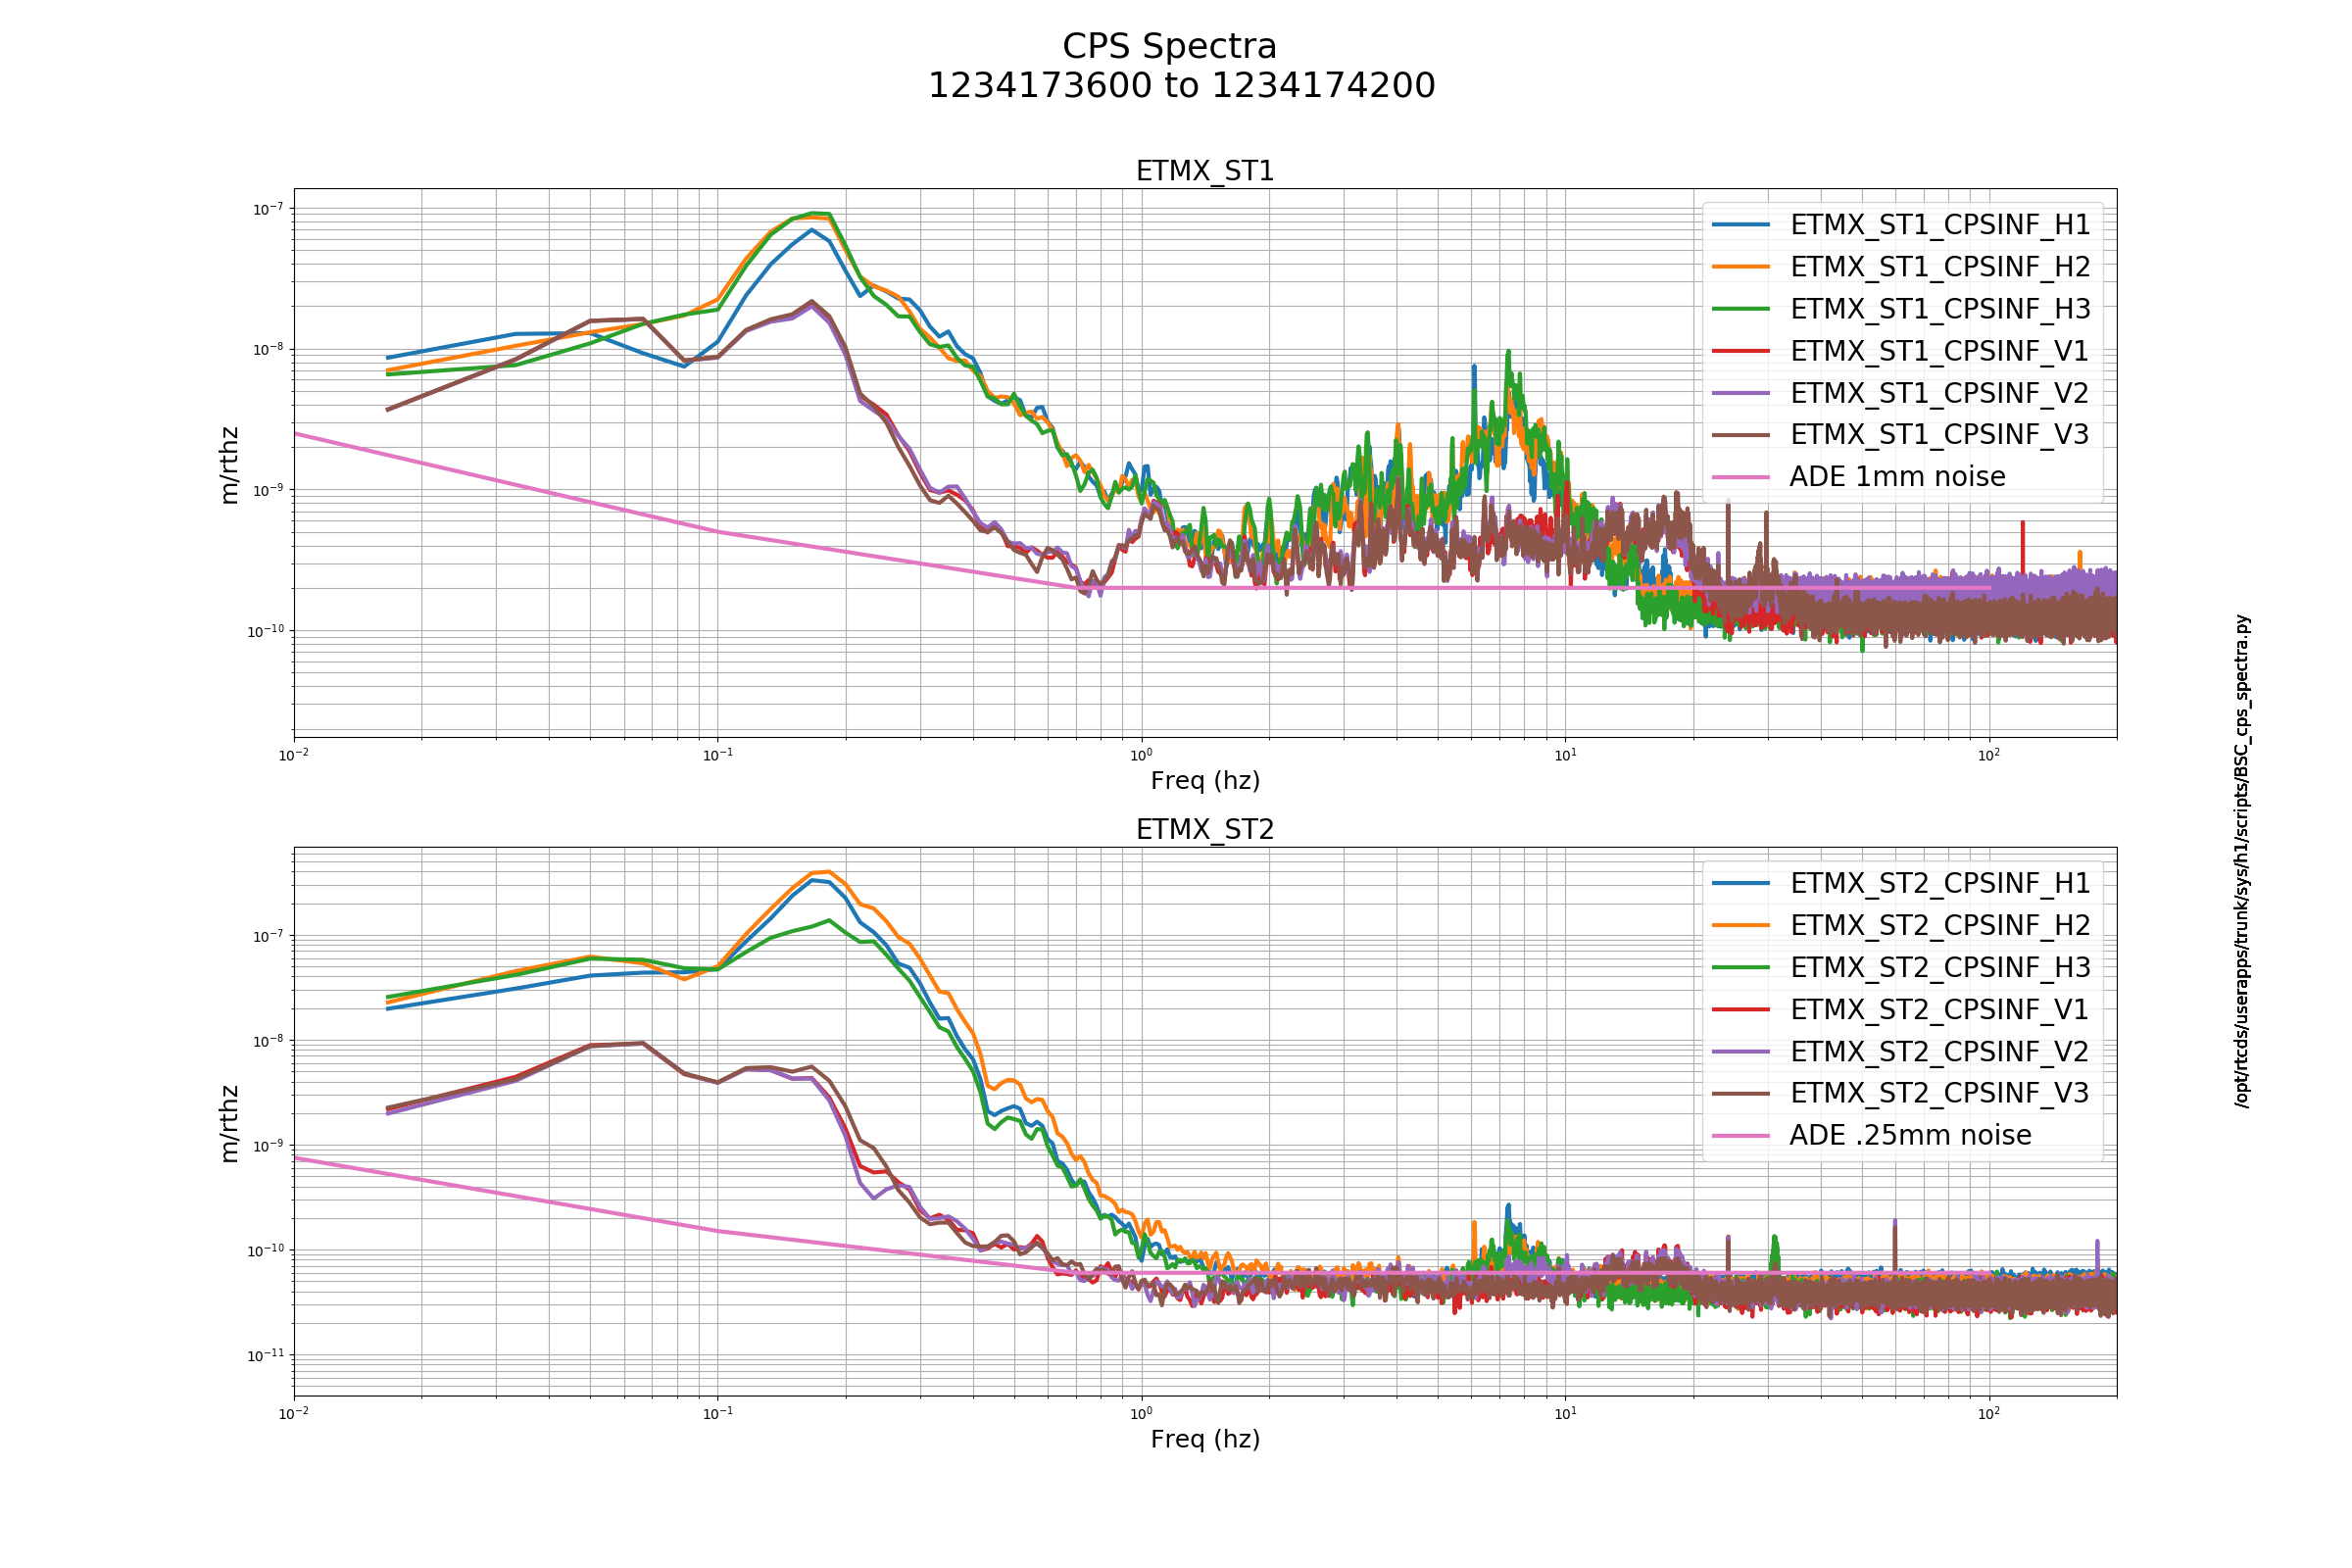
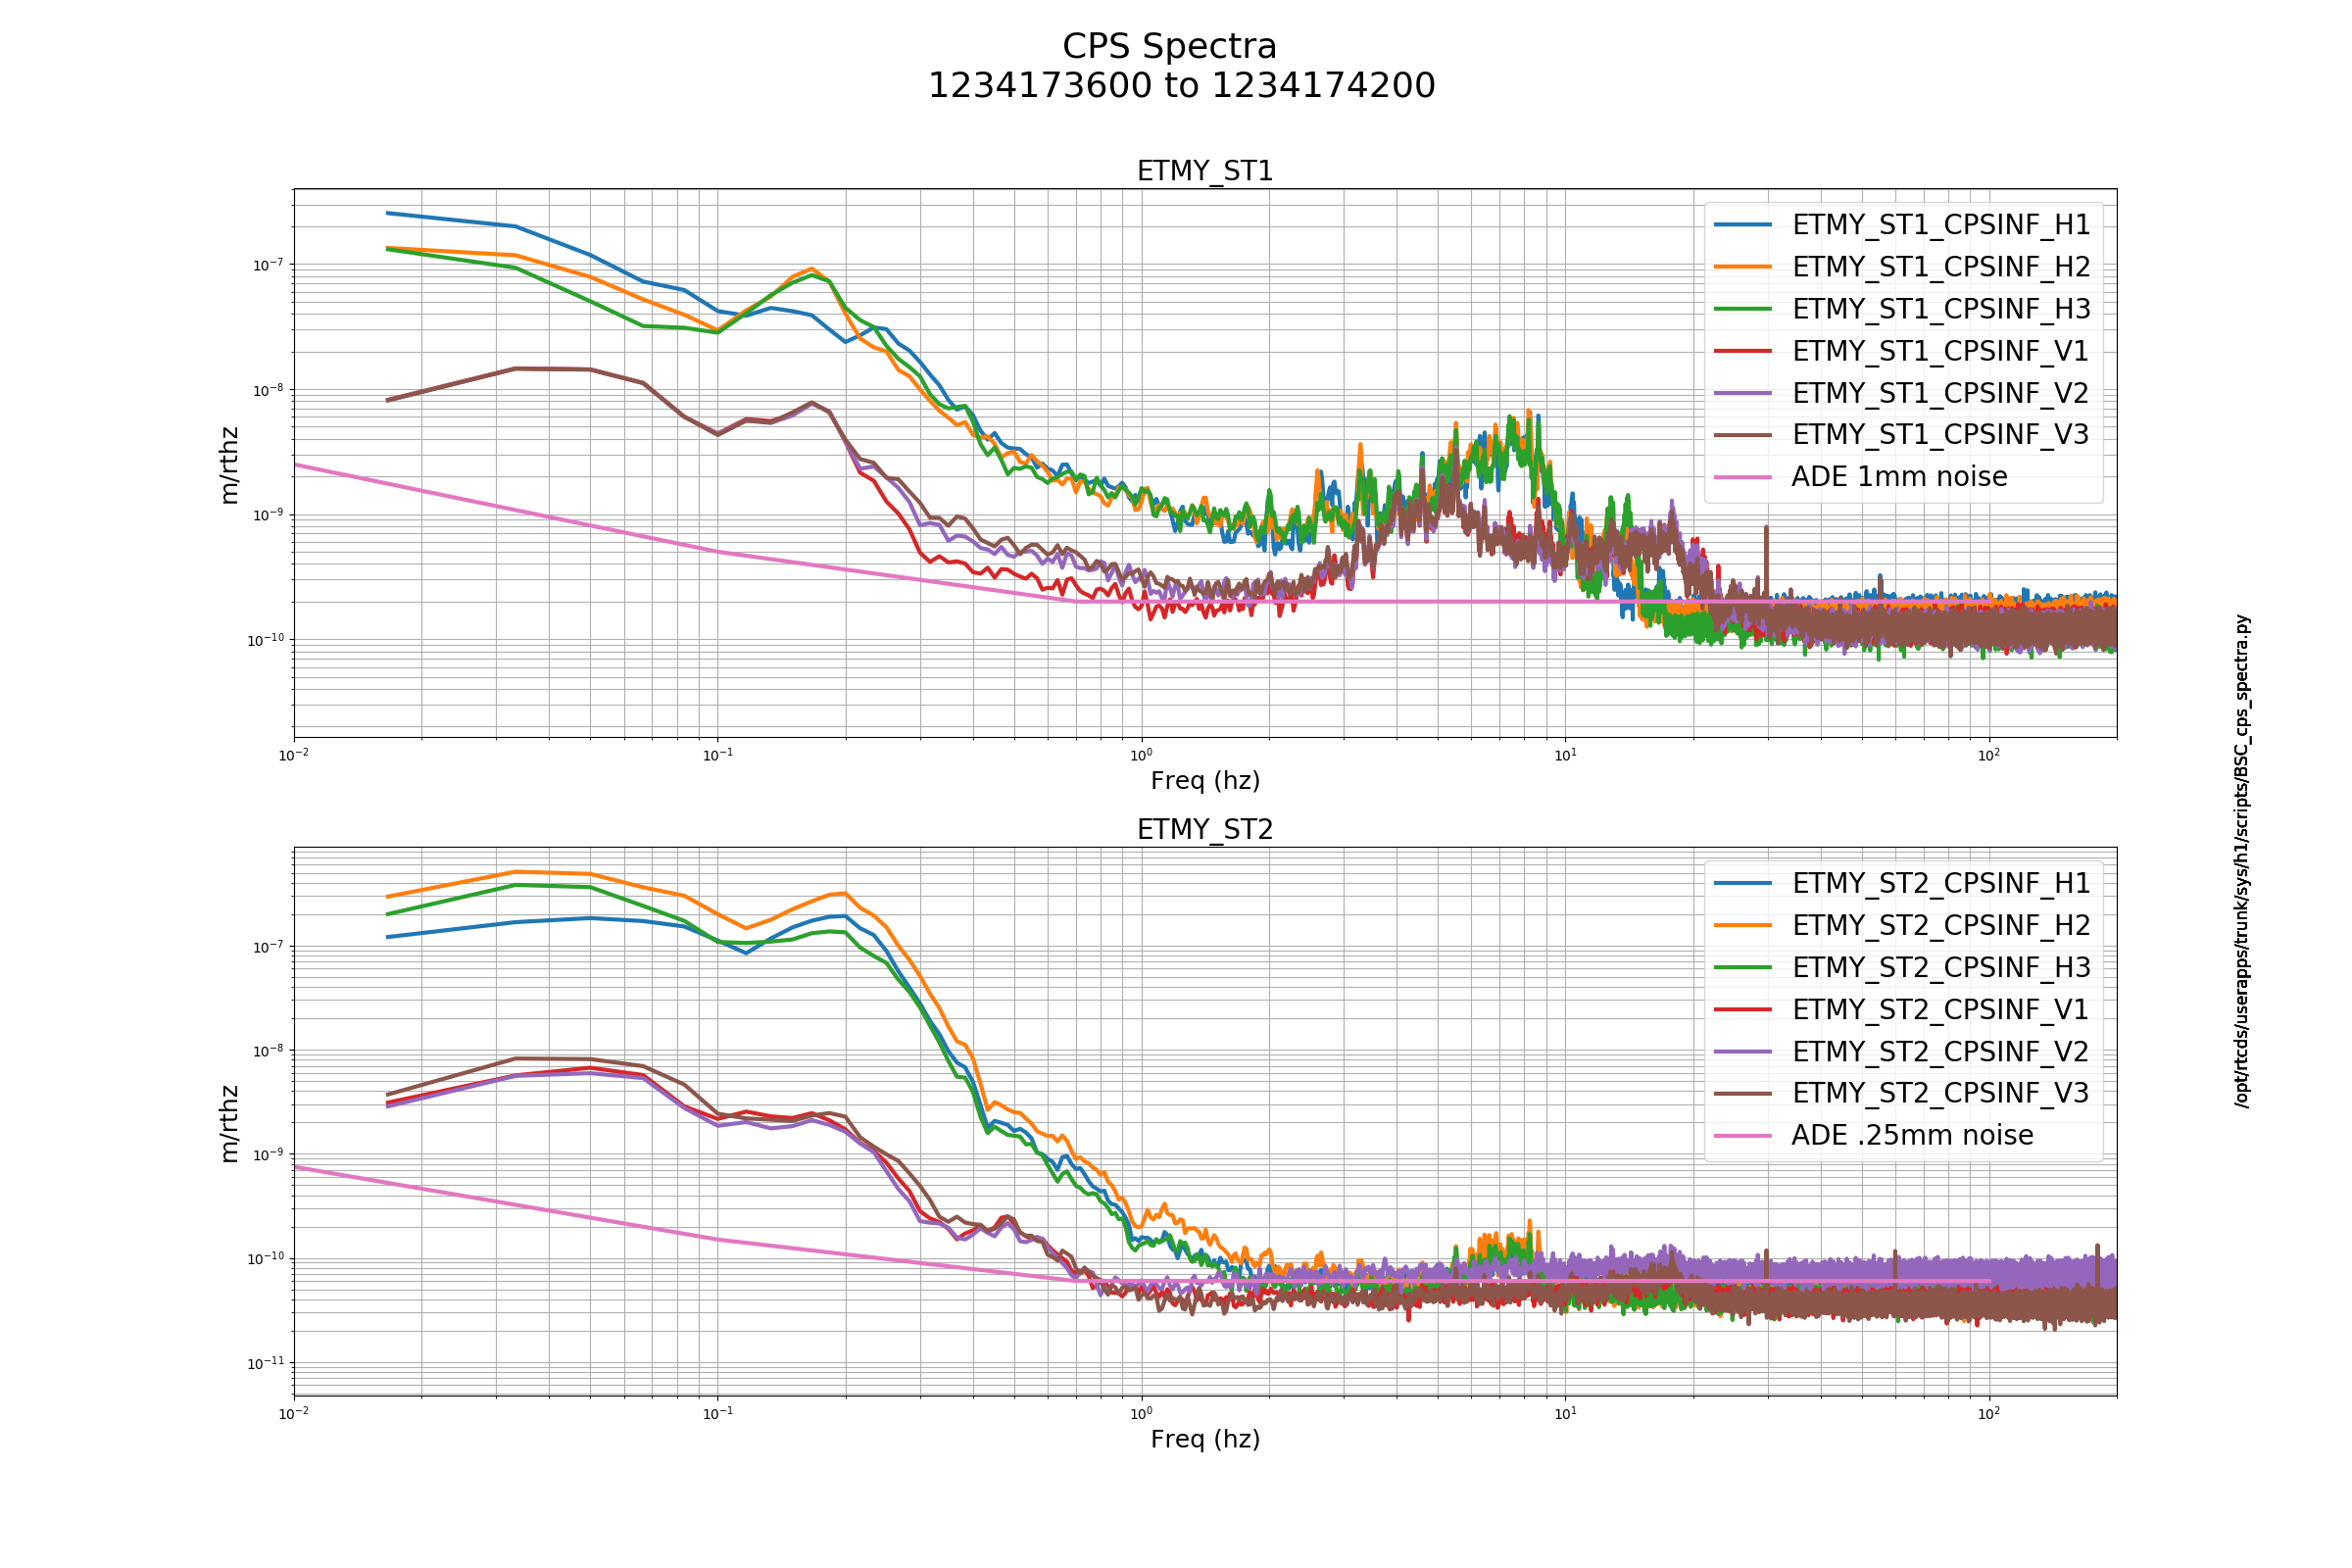
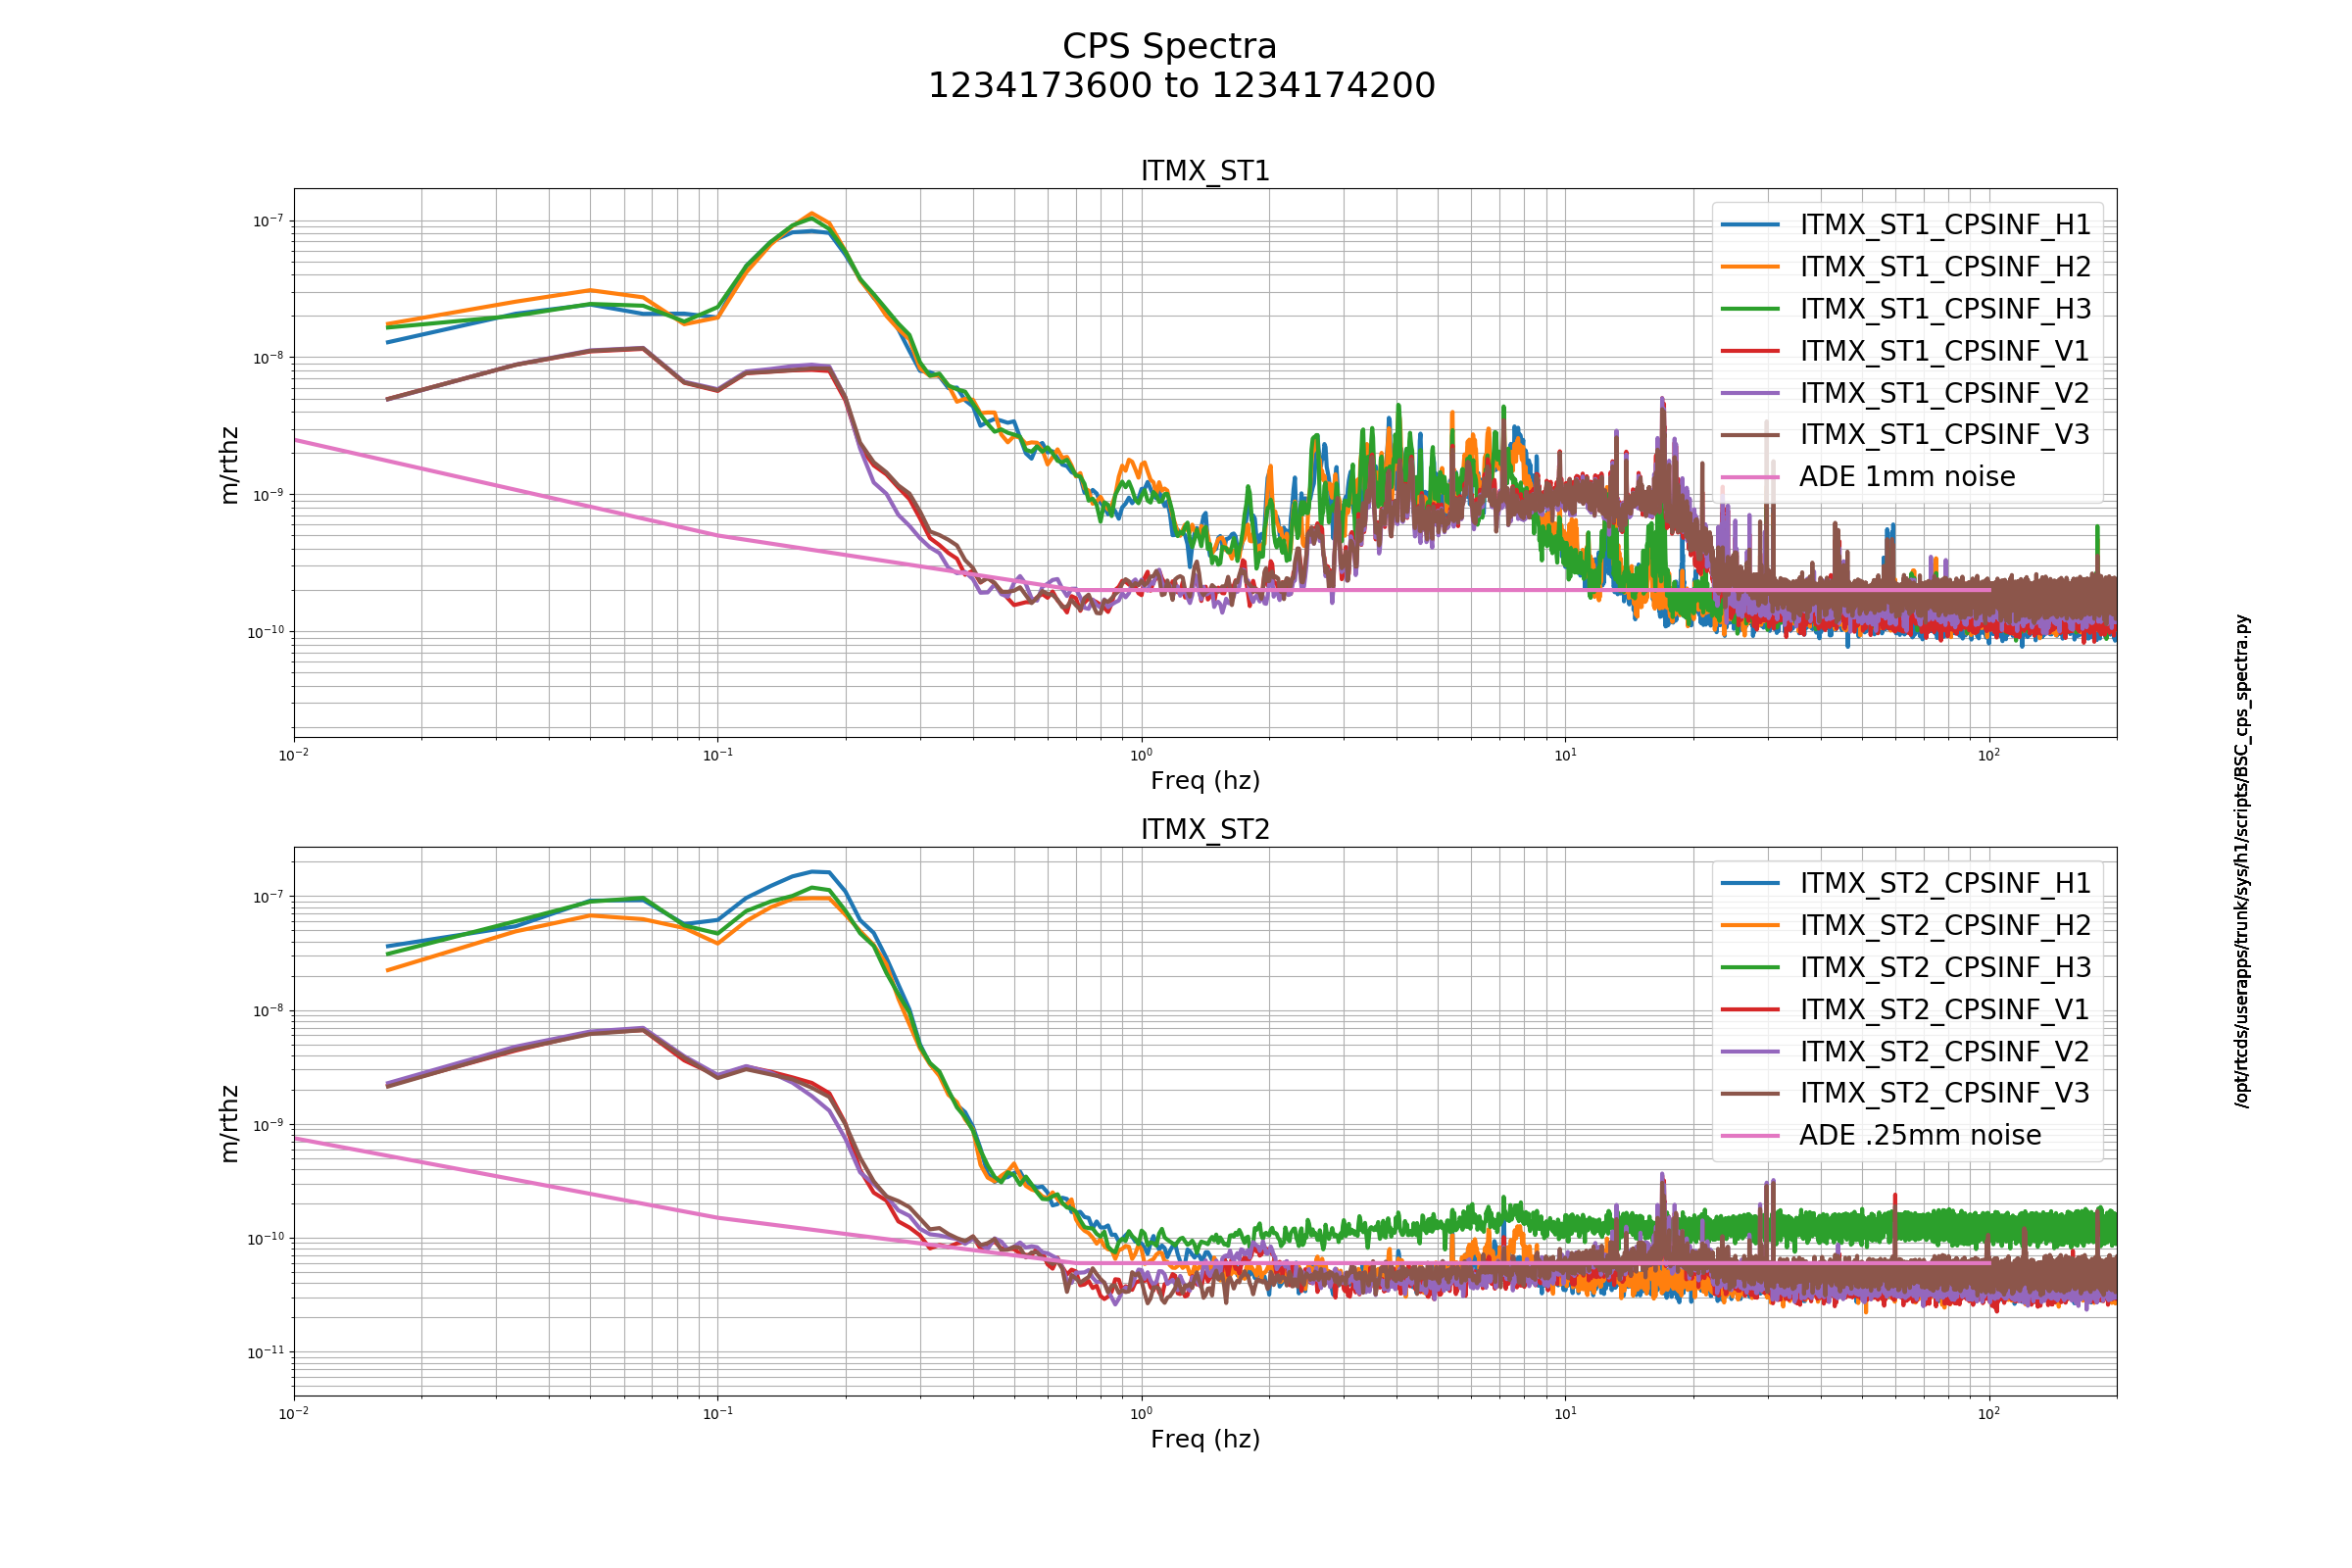
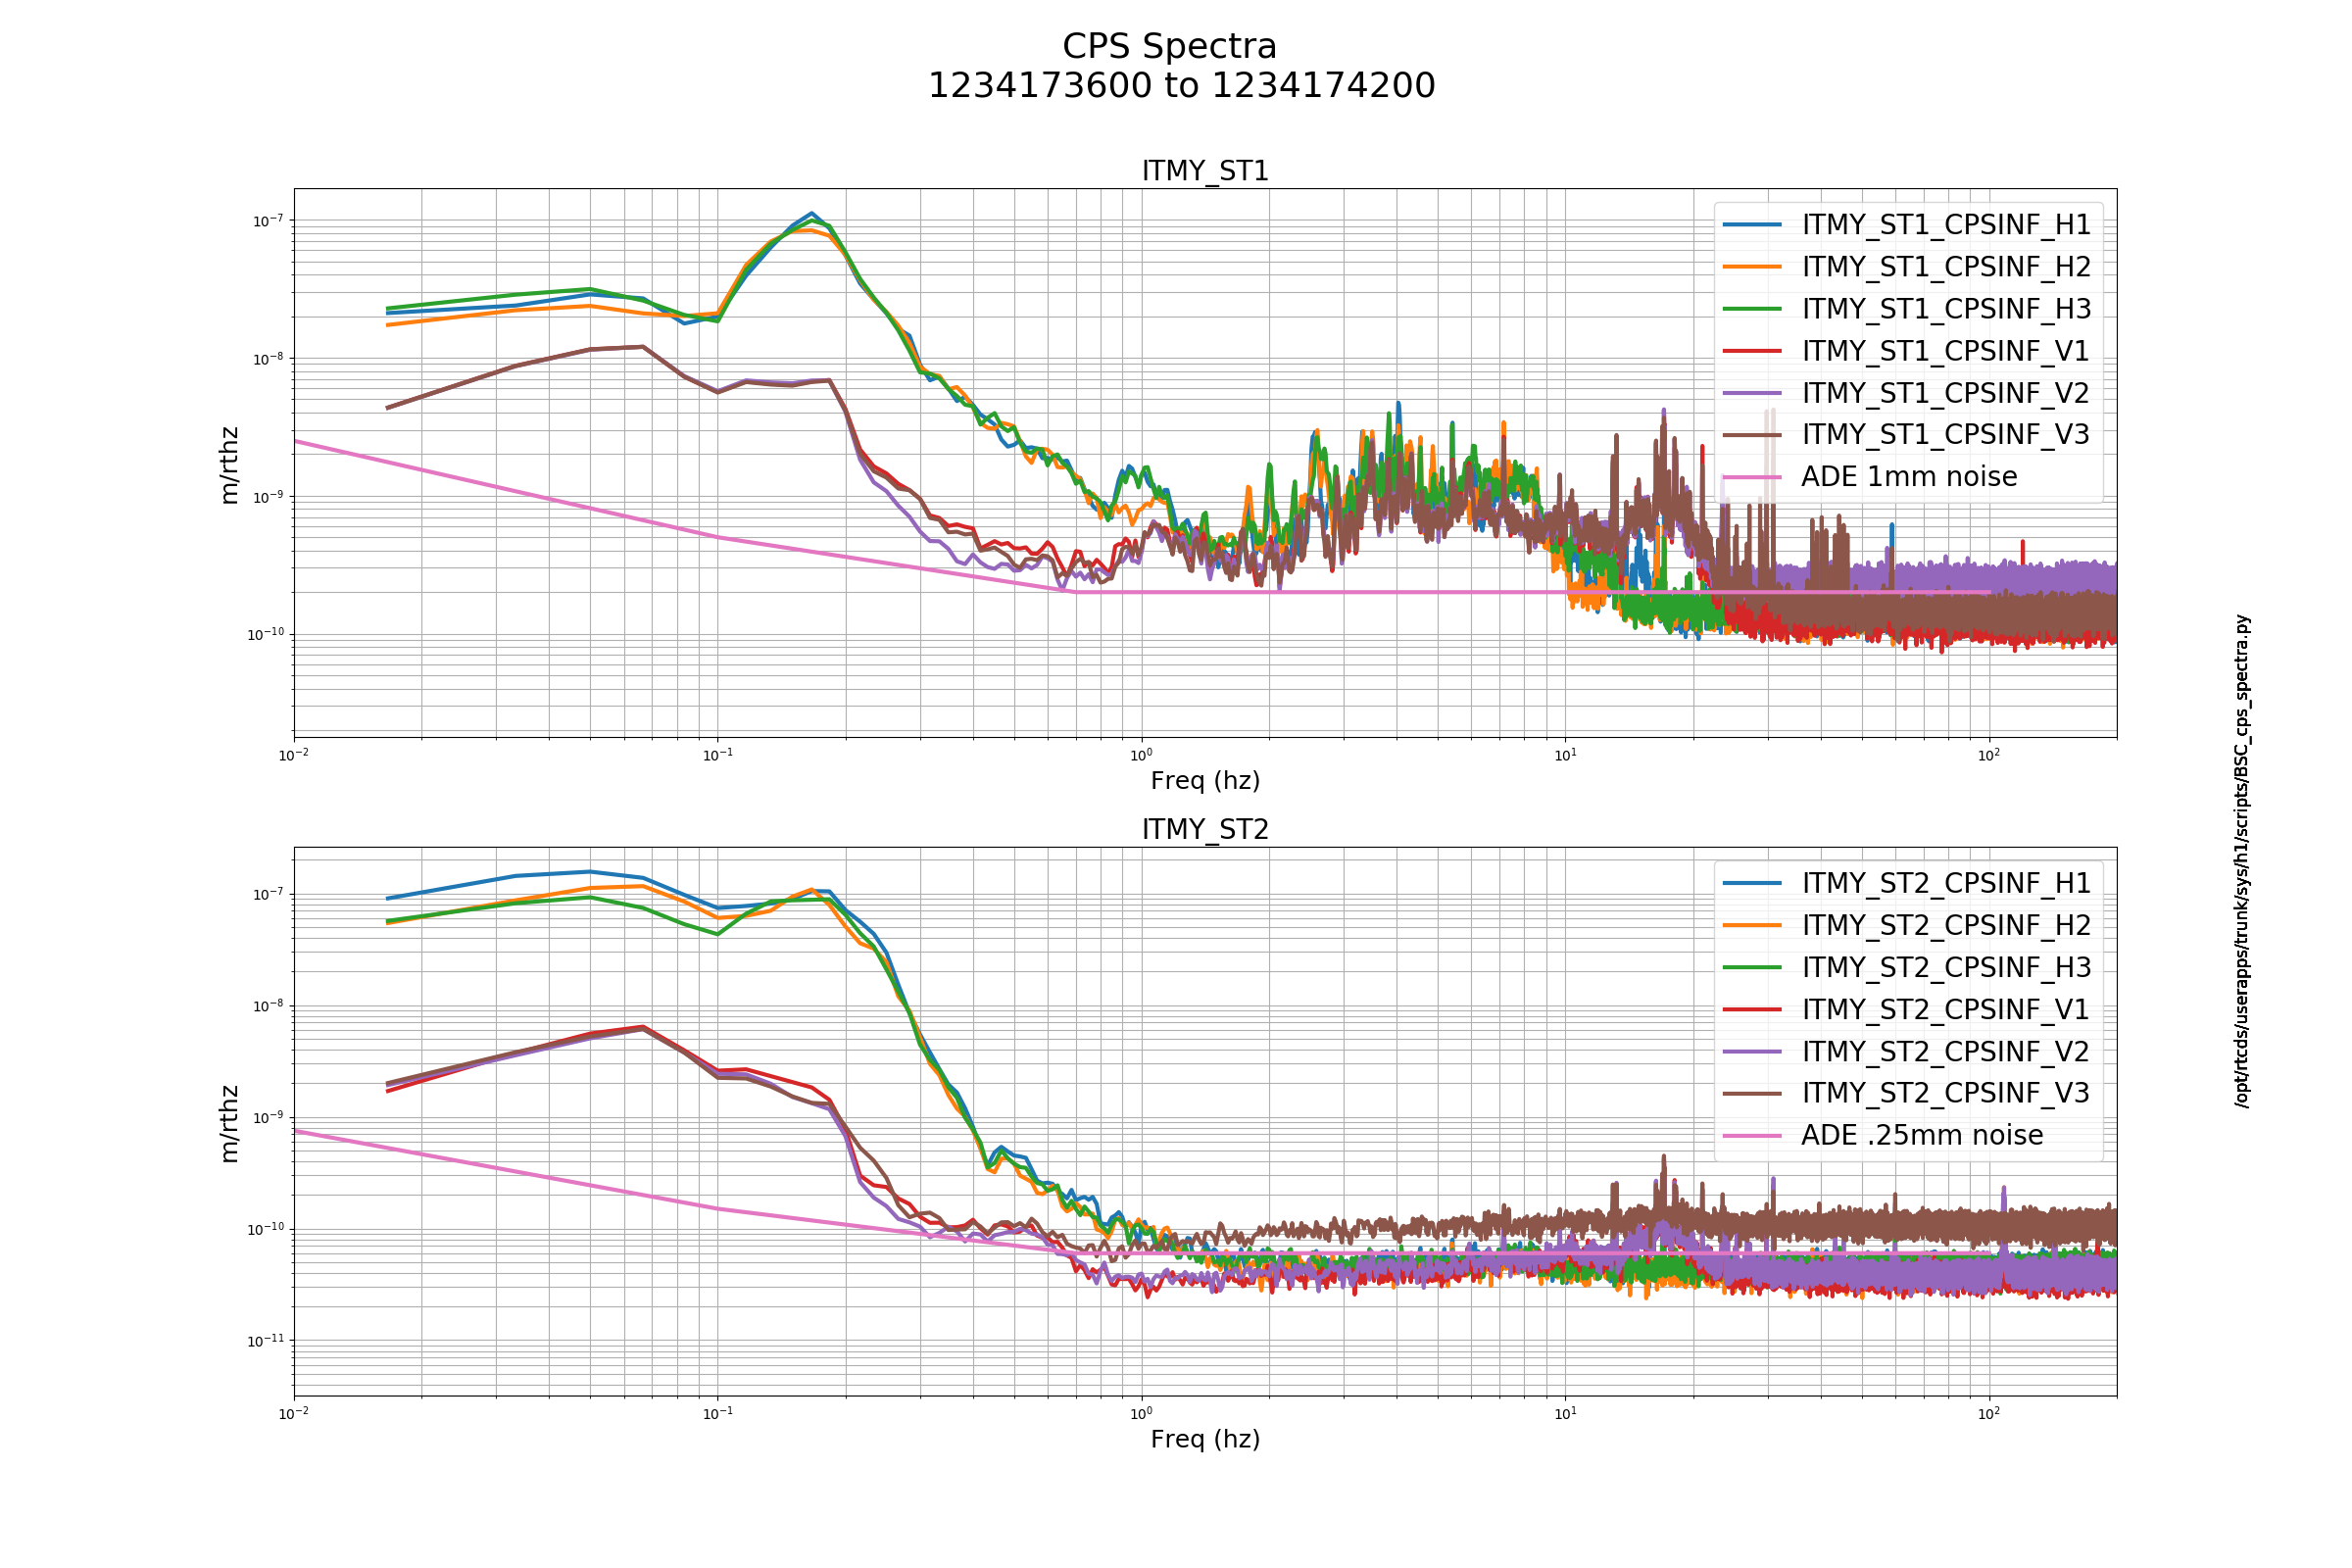
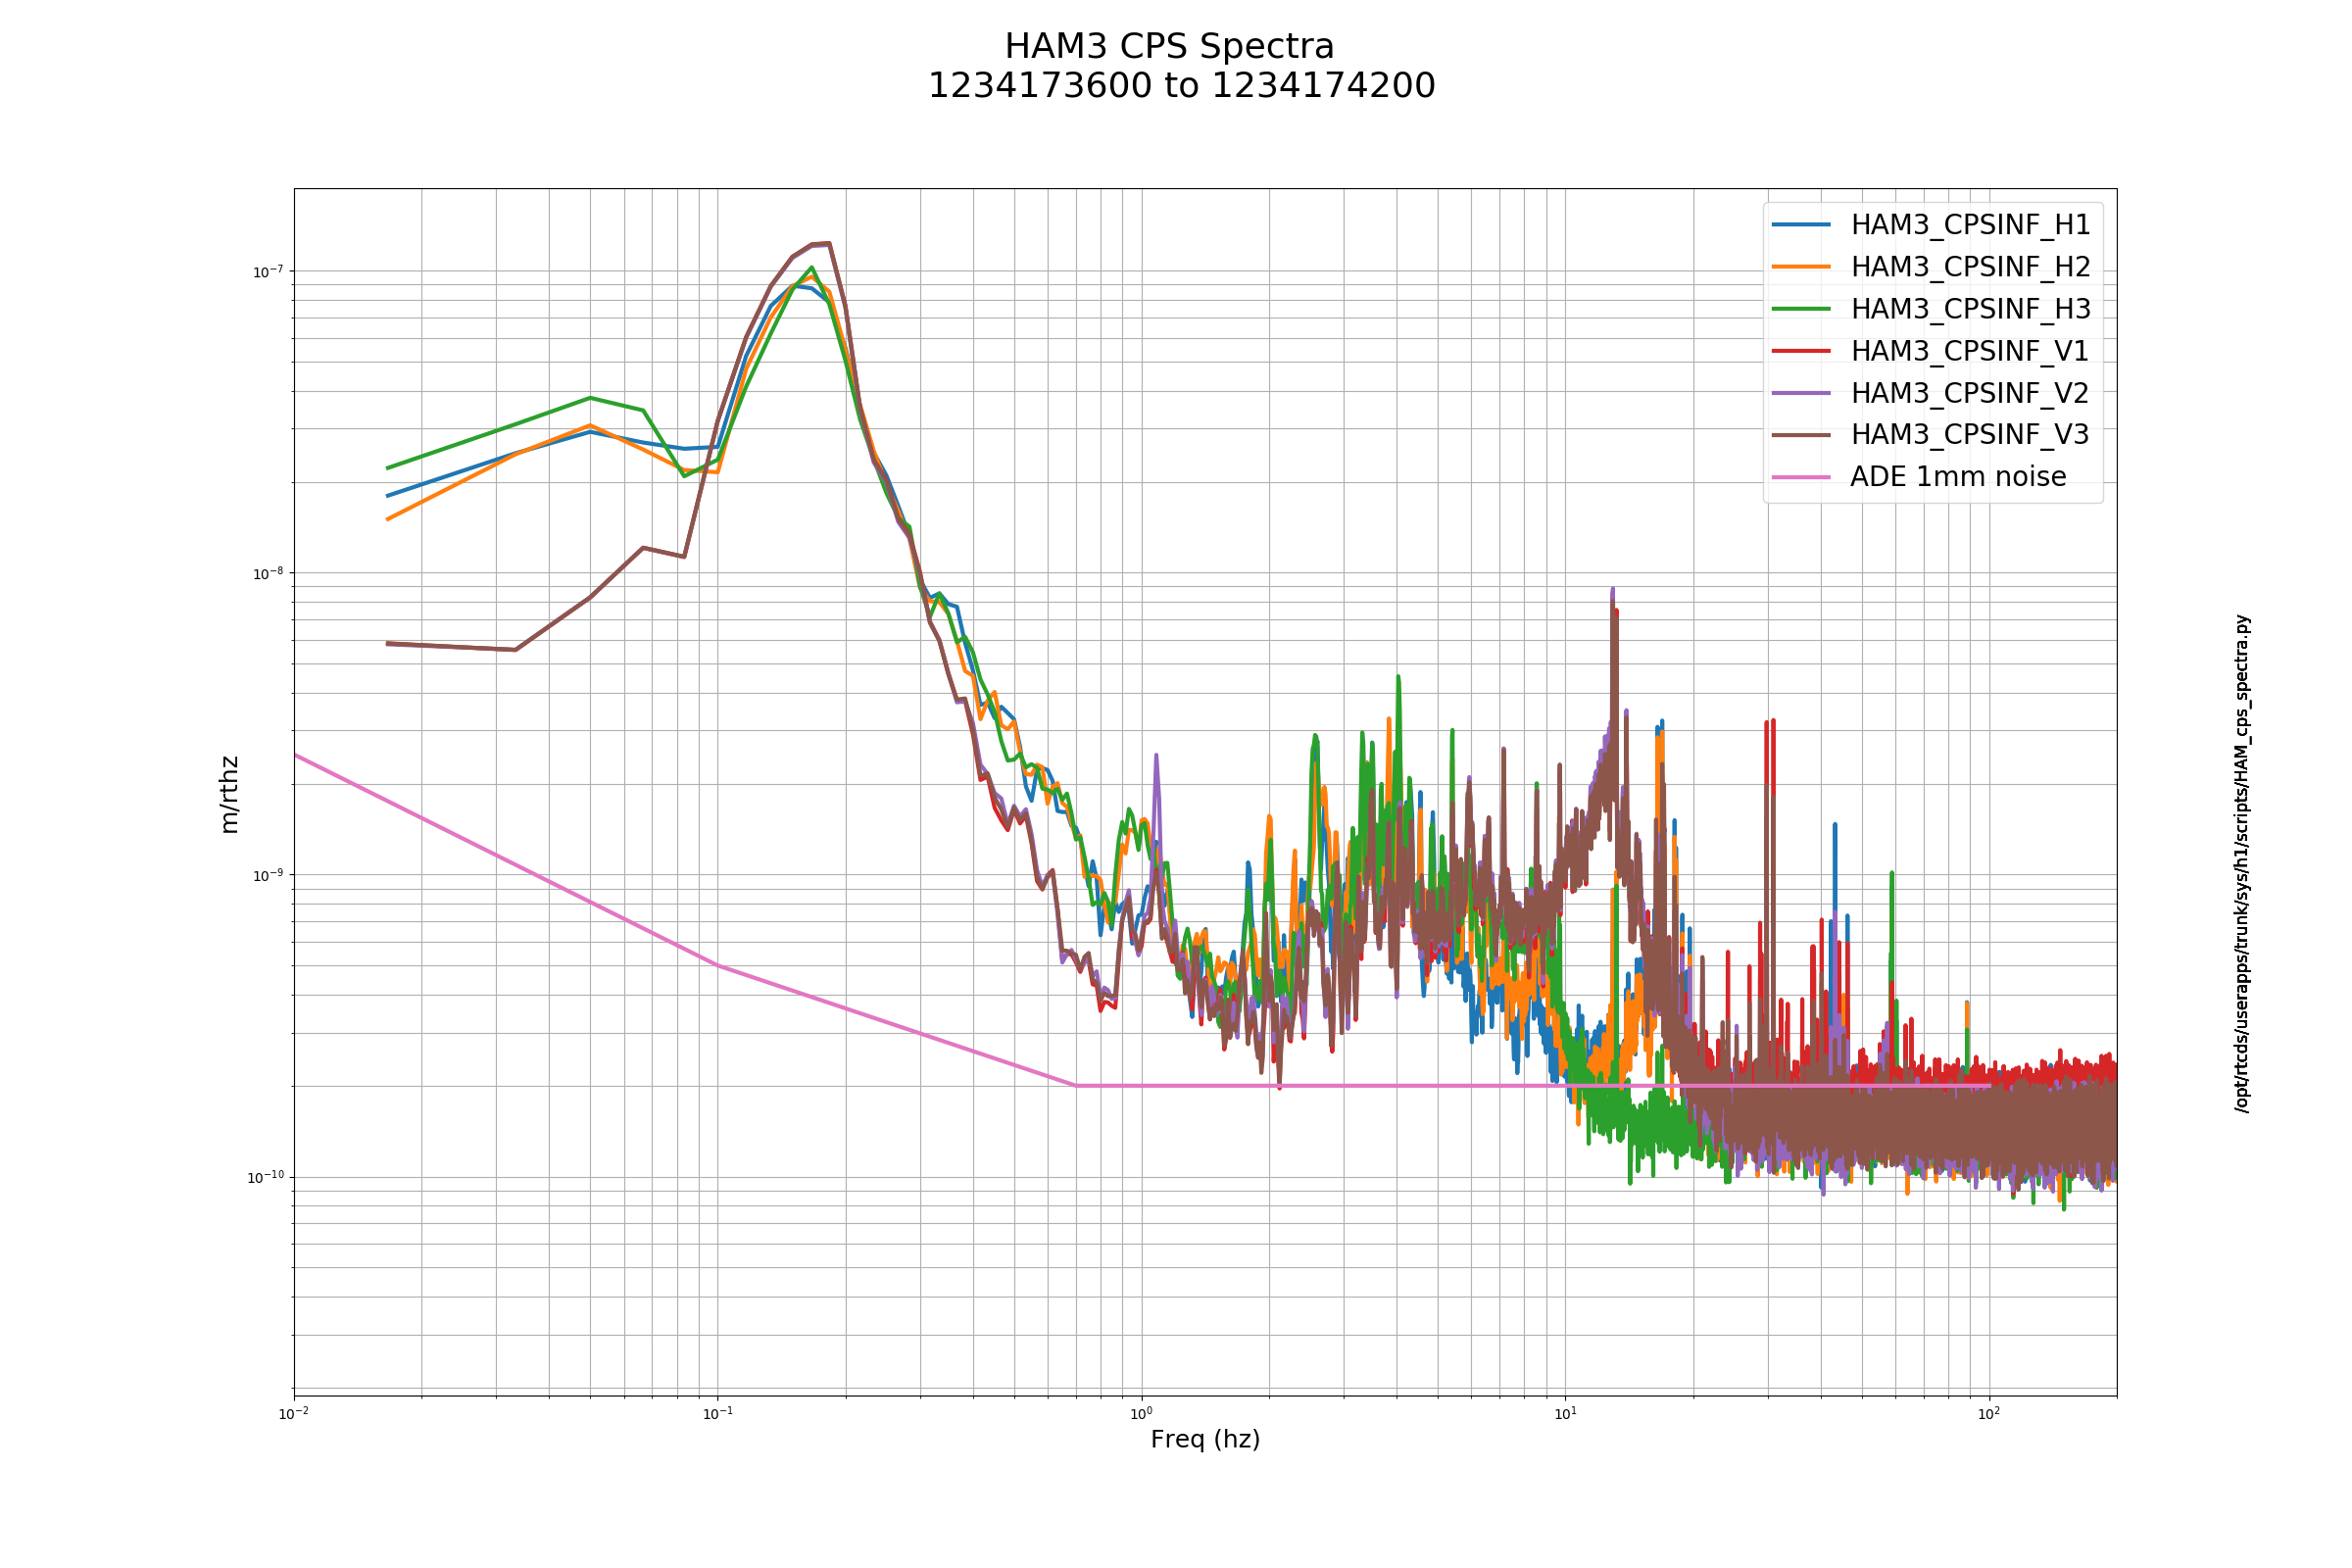
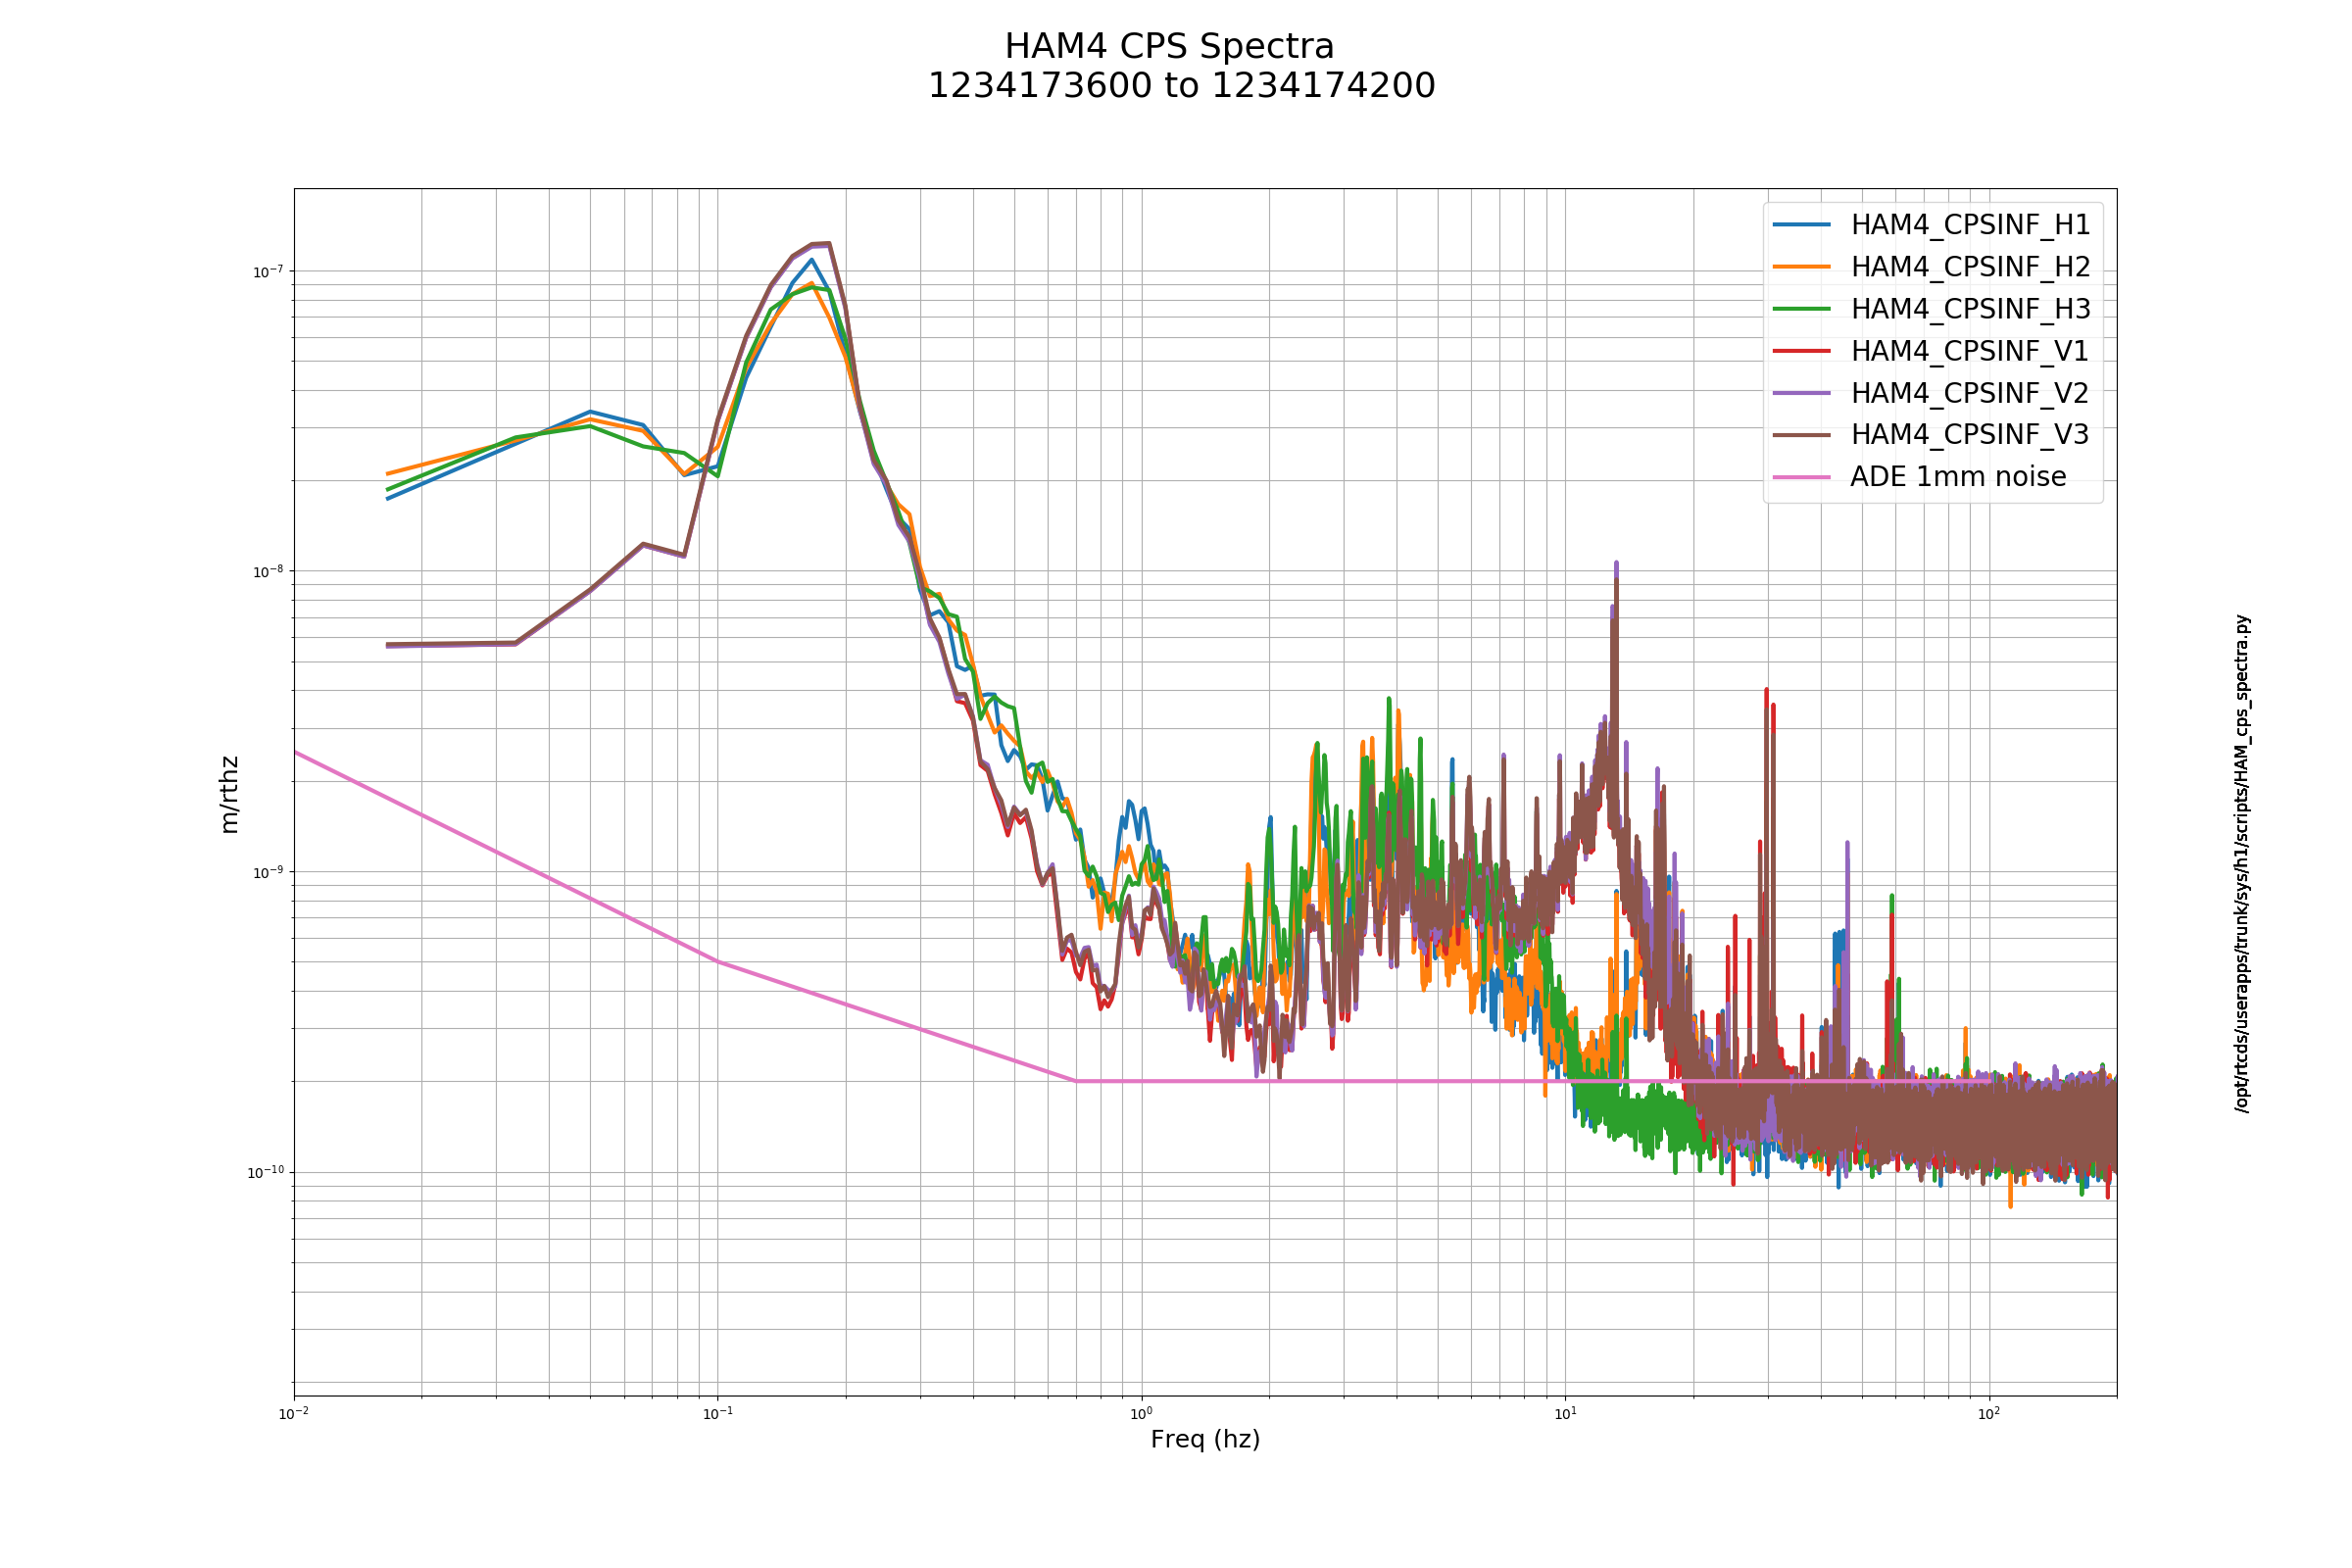
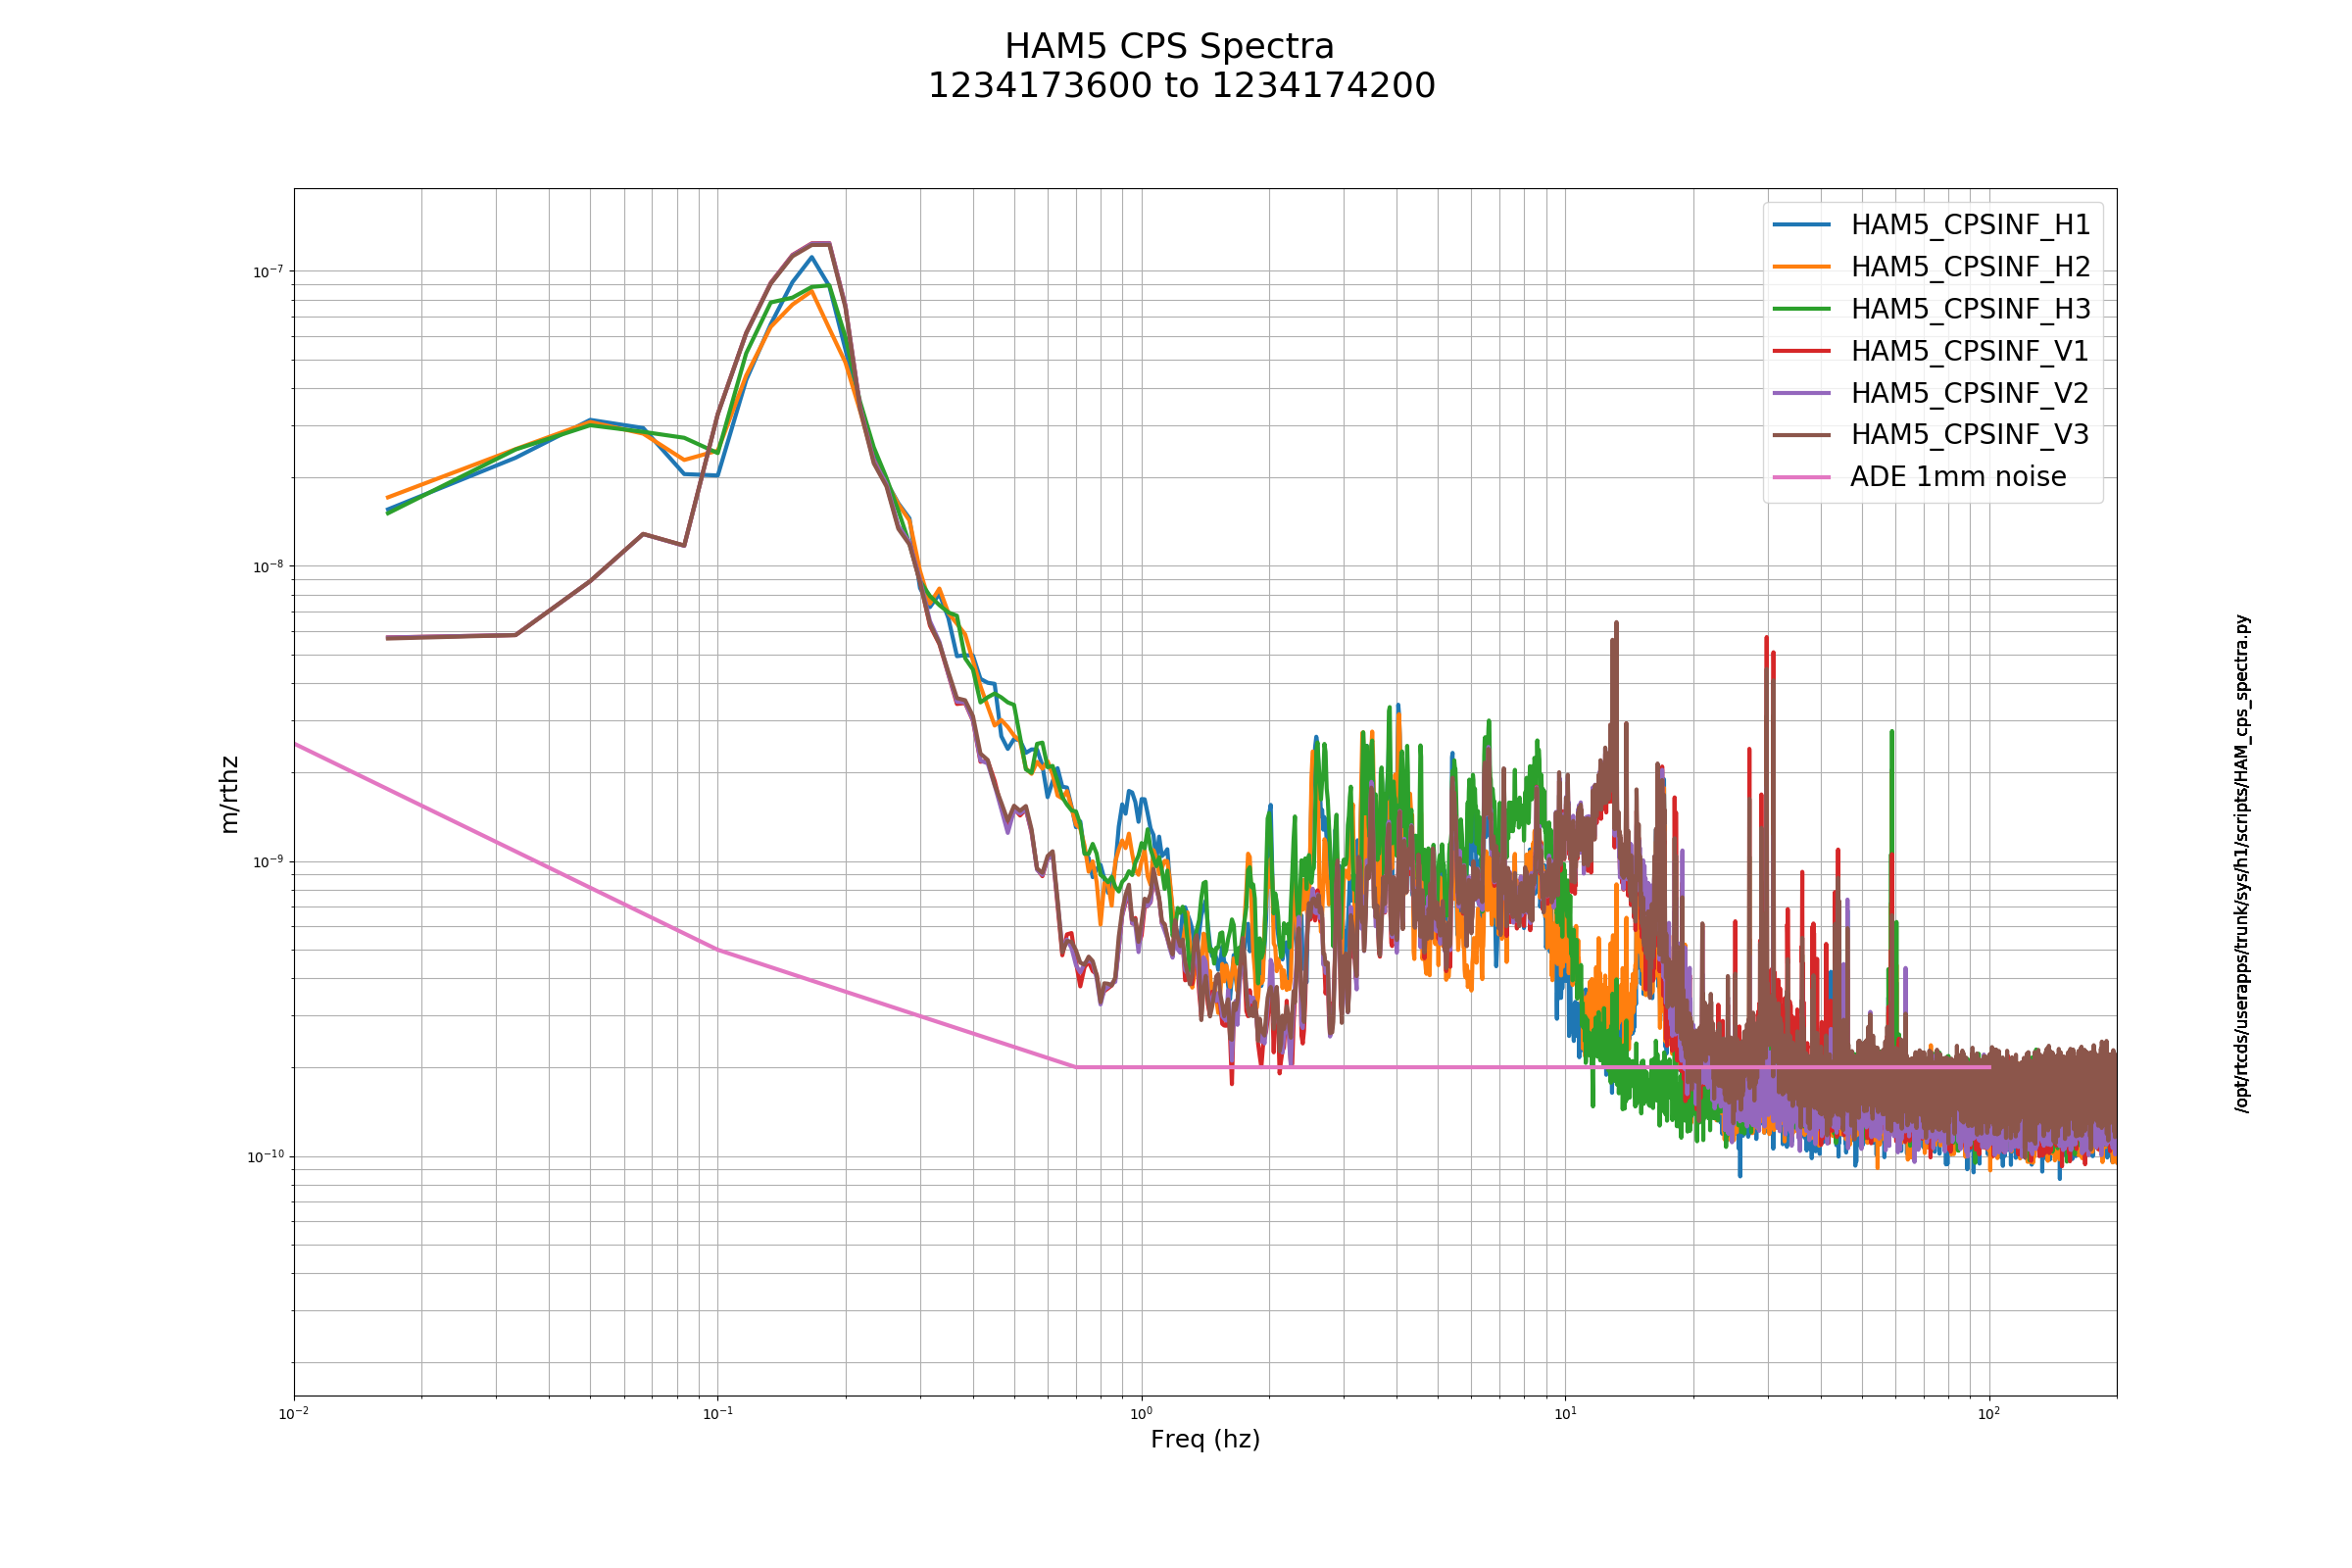
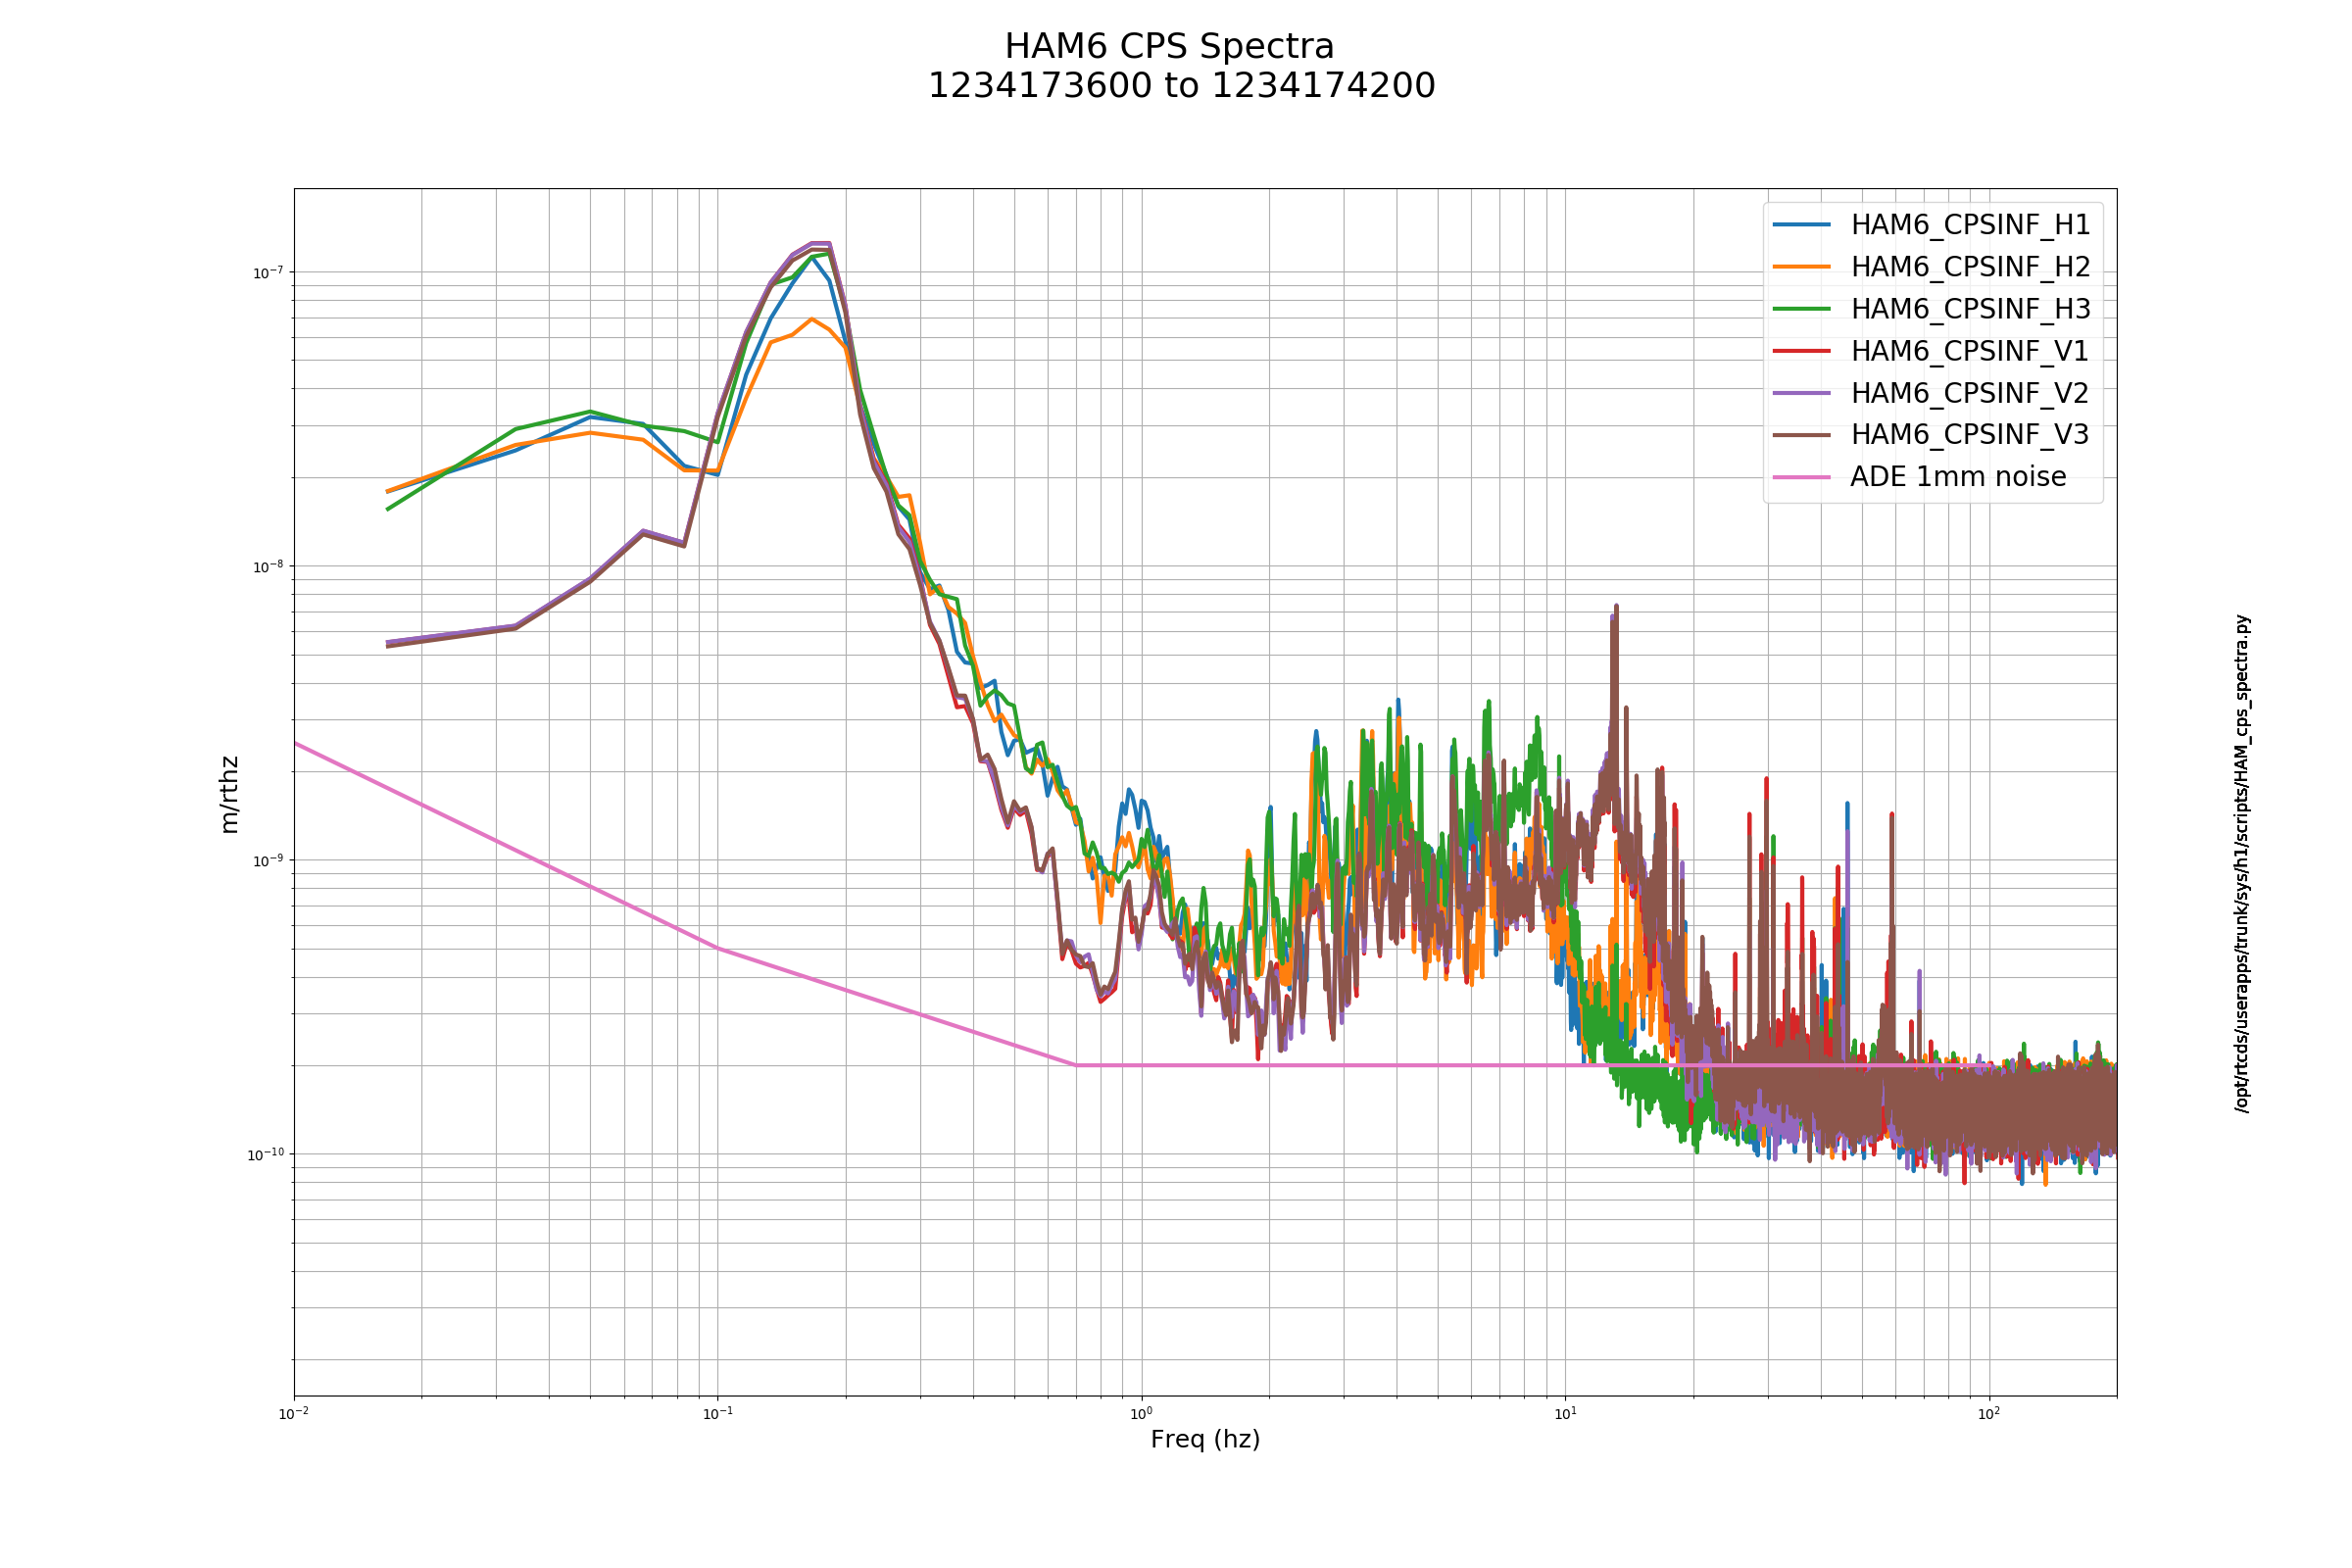
ITMY_ST2_CPSINF_V3 and ITMX_ST2_CPSINF_H3 both have higher than usual noise from around 1 Hz up
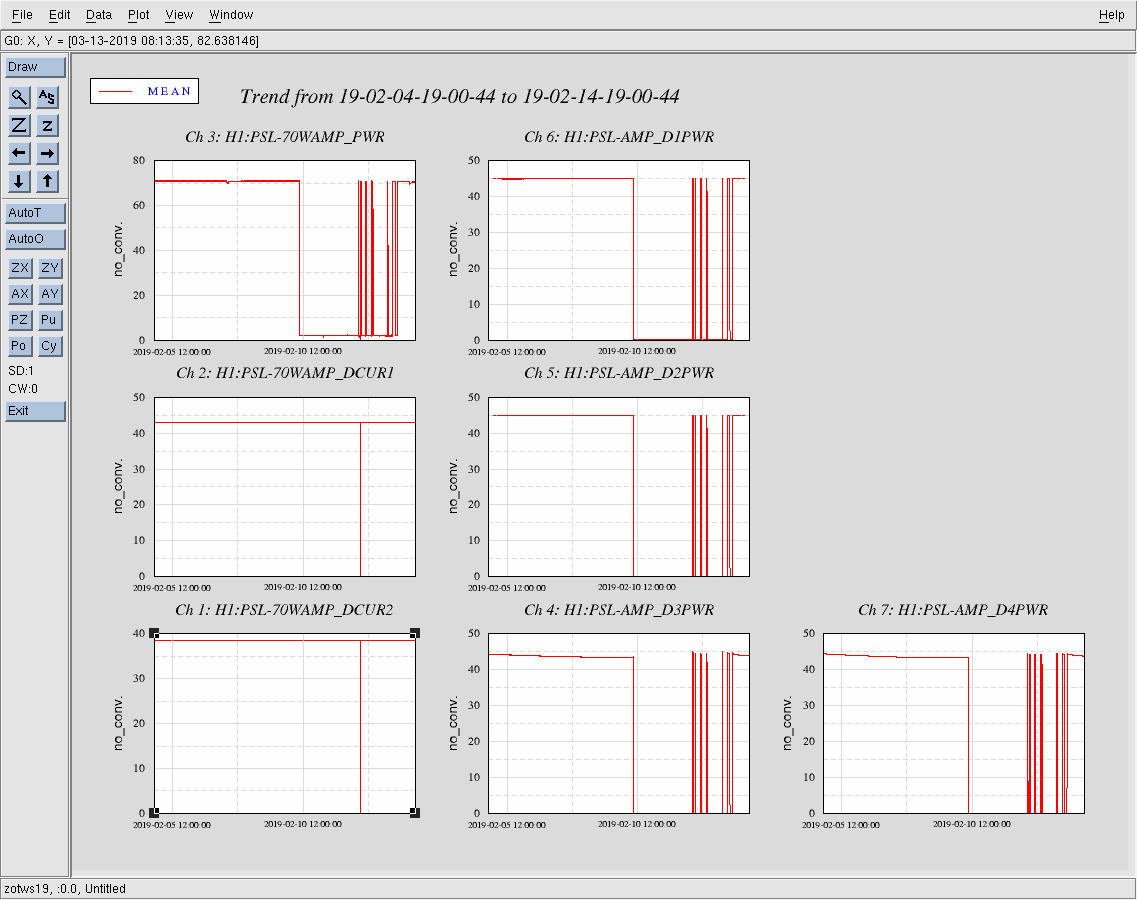
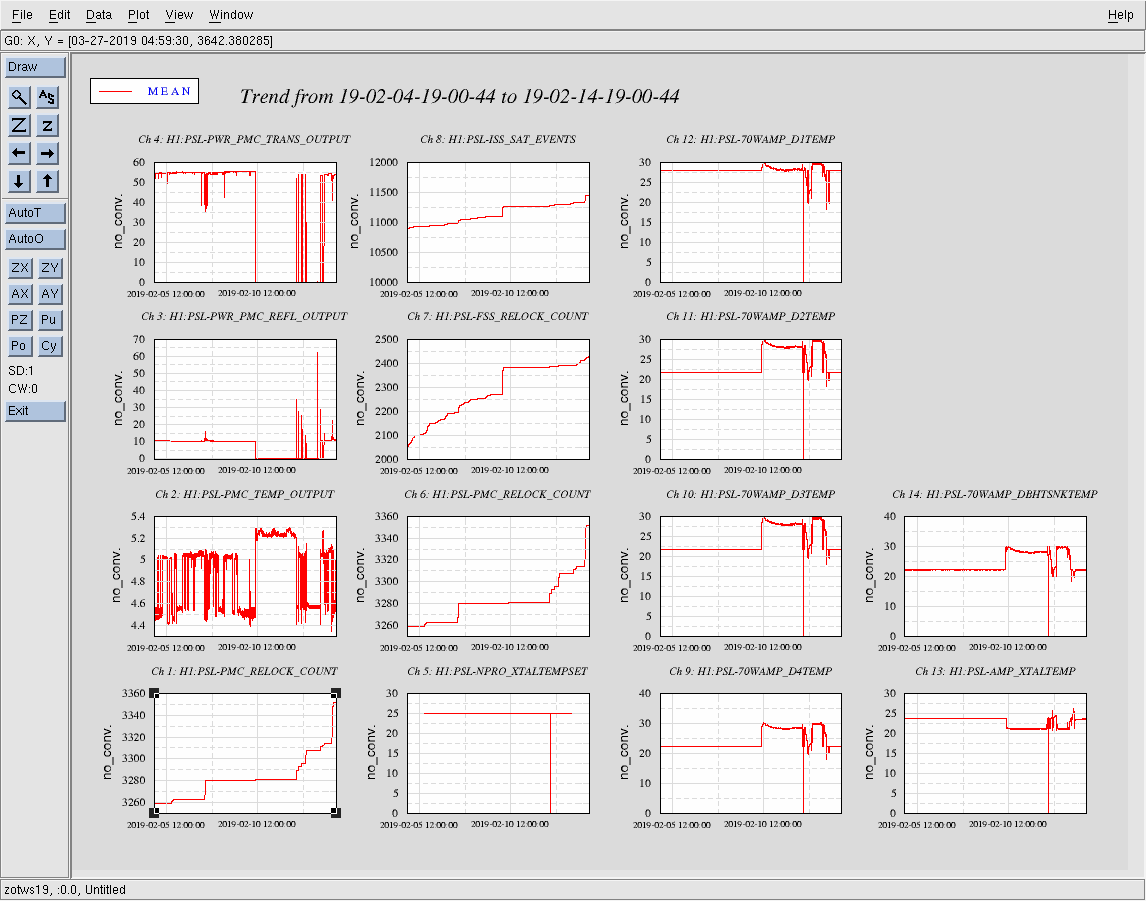
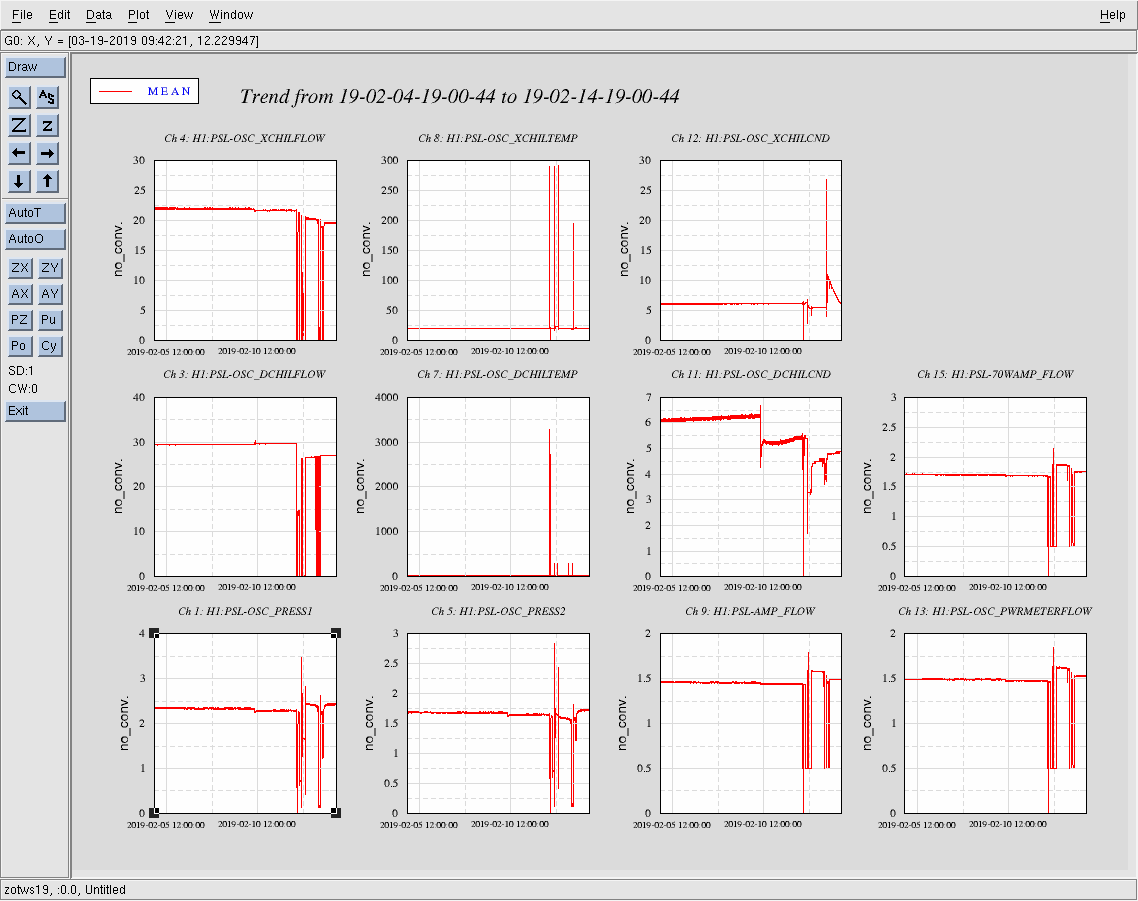
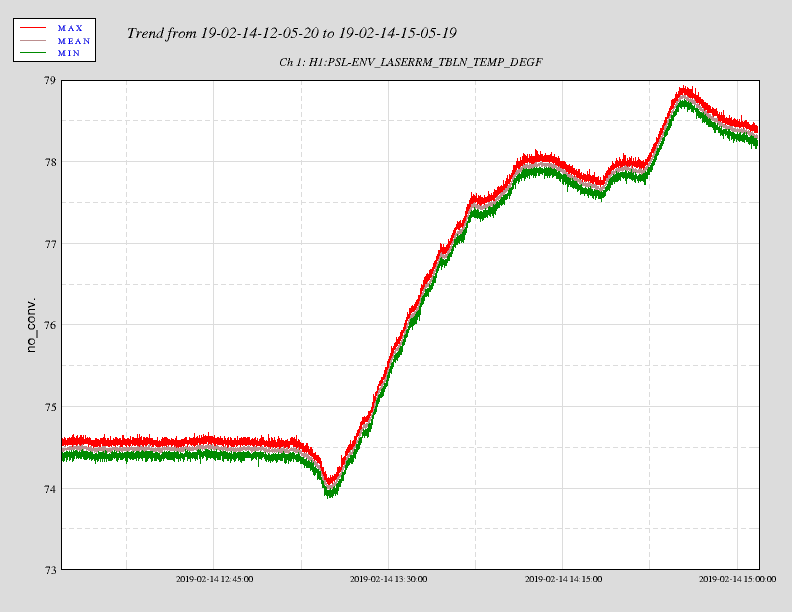
With the recent PSL chiller work going on (46939), I ended up adding 0 mL to the crystal chiller, as it seems recently filled. Filters look clean.
Addressed TCS Chillers (09:55 - 10:05 AM PST today/Thurs)
The CW injections appear to have crashed on Tuesday Feb 12 at 20:04:46 UTC. I have restarted them as of Thursday Feb 14 at 16:19:56 UTC (GPS 1234196414). See attached graph for turnon confirmation.
Tweaked alignment into the reference cavity.
When I exited the enclosure, as soon as the air shower door closed, all HEPA fans and the make up air fan died
and the controller indicated that the air conditioning units were off.
An observation I have noticed is that with the change made to the air conditioning set temperature, the heater
drive for the pre-modecleaner behaves quite differently - most likely because it no longers sits as high above
ambient temperature as it once did. As a result it limits the time that can be spent in the enclosure to about
half an hour before a dance between the pre-modecleaner losing lock and the reference cavity losing lock. As the
FSS is trying to re-acquire, the pre-modecleaner PZT voltage heads towards the low end causing a delay as to
when the FSS re-acquires because the pre-modecleaner drops out of lock. All of which makes re-alignment an exercise
in patience.
After getting the FSS to lock, I went back outside to the LVEA to find that all the HEPA fans and air conditioning units were now on. They were switched off. There's something not quite right with the controller panel at the moment - for what ever reason.
I've turned the make up air fan to 100% to aid bring the temperature down a little faster.
The make up air fan was turned off at ~08:30 am.
Sheila, Jamie
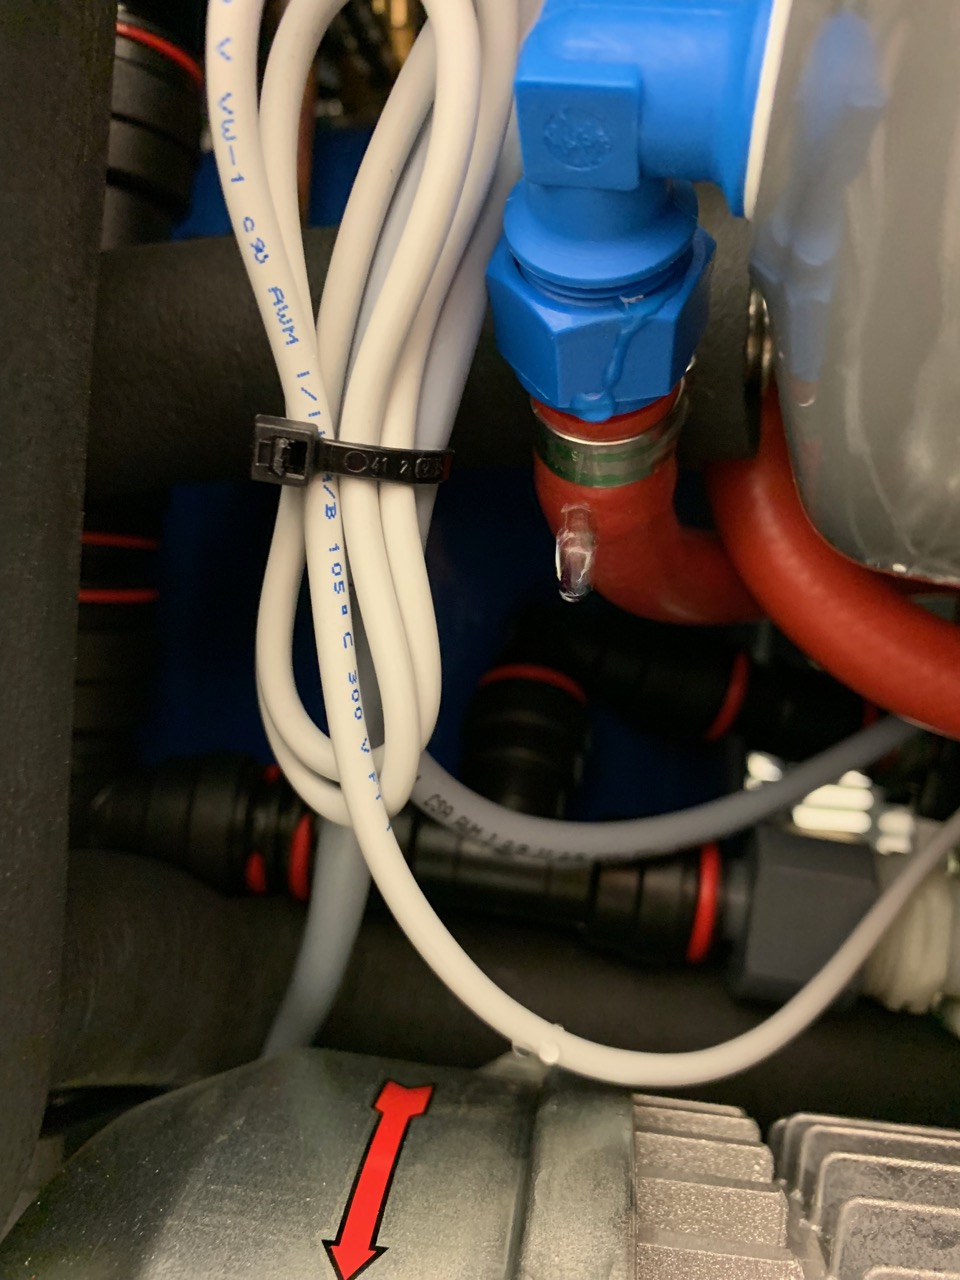
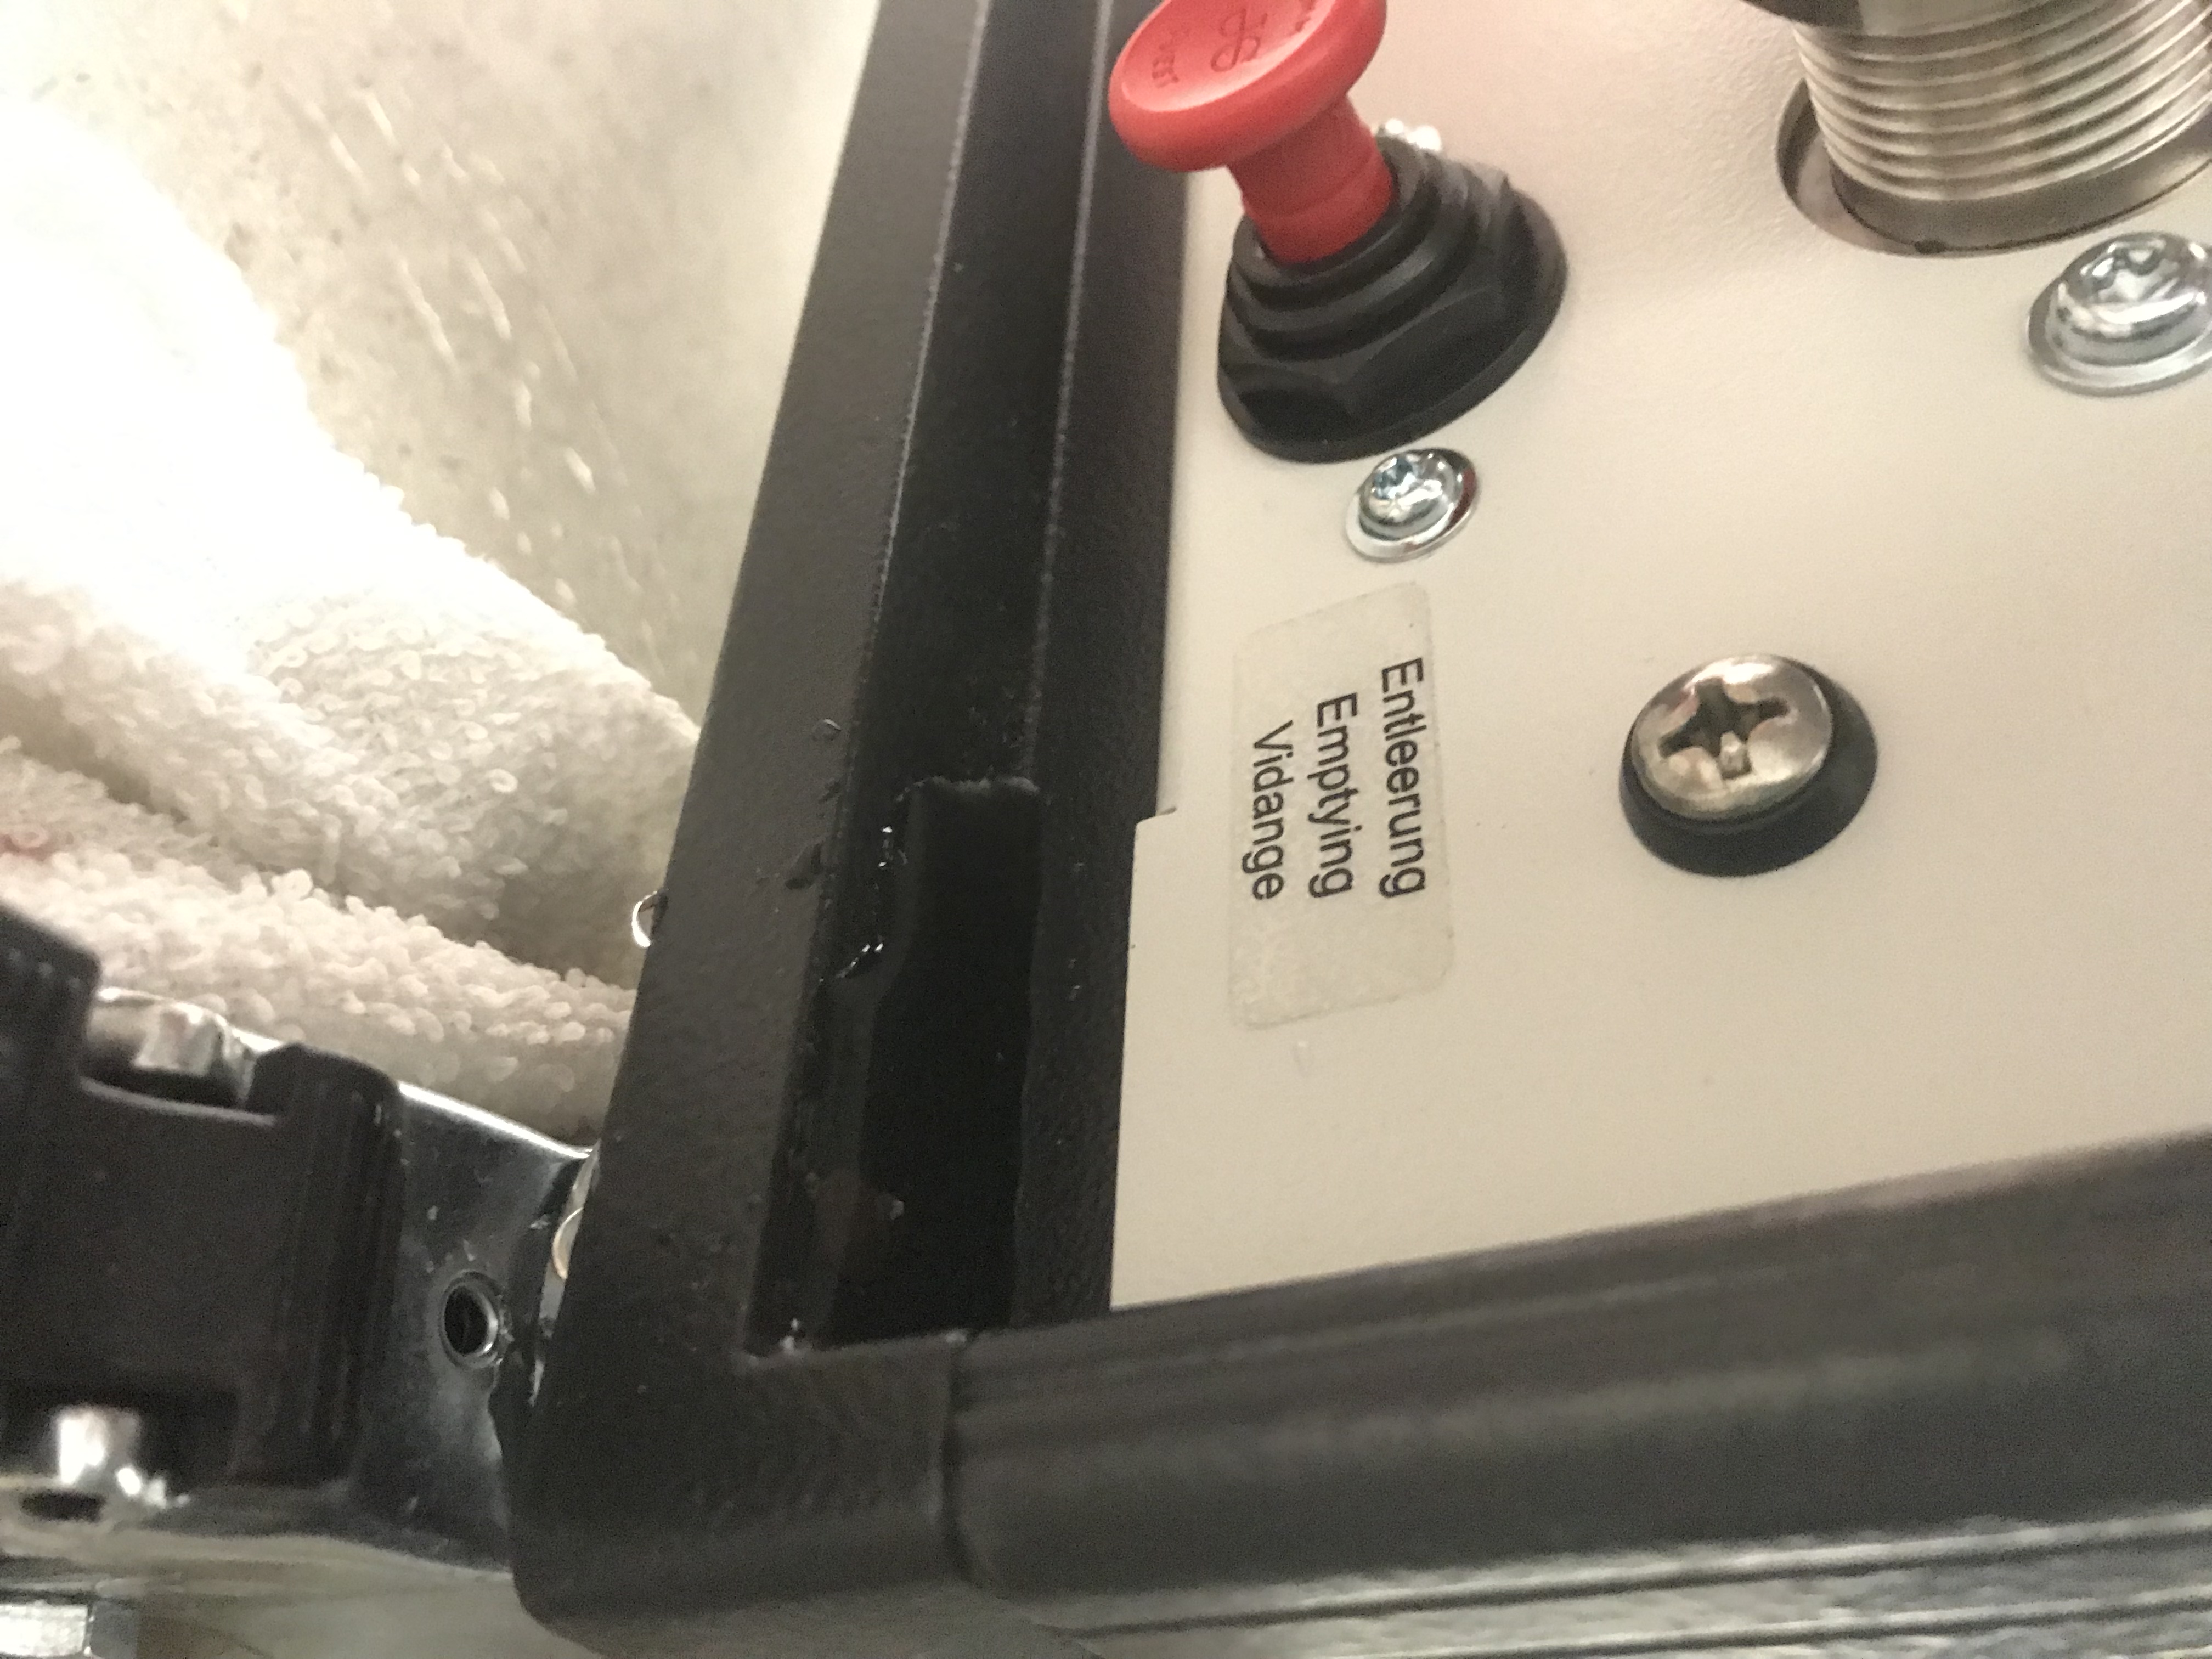
There was a small water leak at one of the (blue) plastic fittings at one end of the deionizer cartridge (gray cylinder in attached photo) in the Crystal chiller.
Re-seating and carefully tightening (trying to make sure not to over-tighten) the connection seems to have fixed the leak.
Topped off the water, installed the stopper, then re-started the laser. All the servos locked on their own and the MC locked right away.
Seems we are back in business.
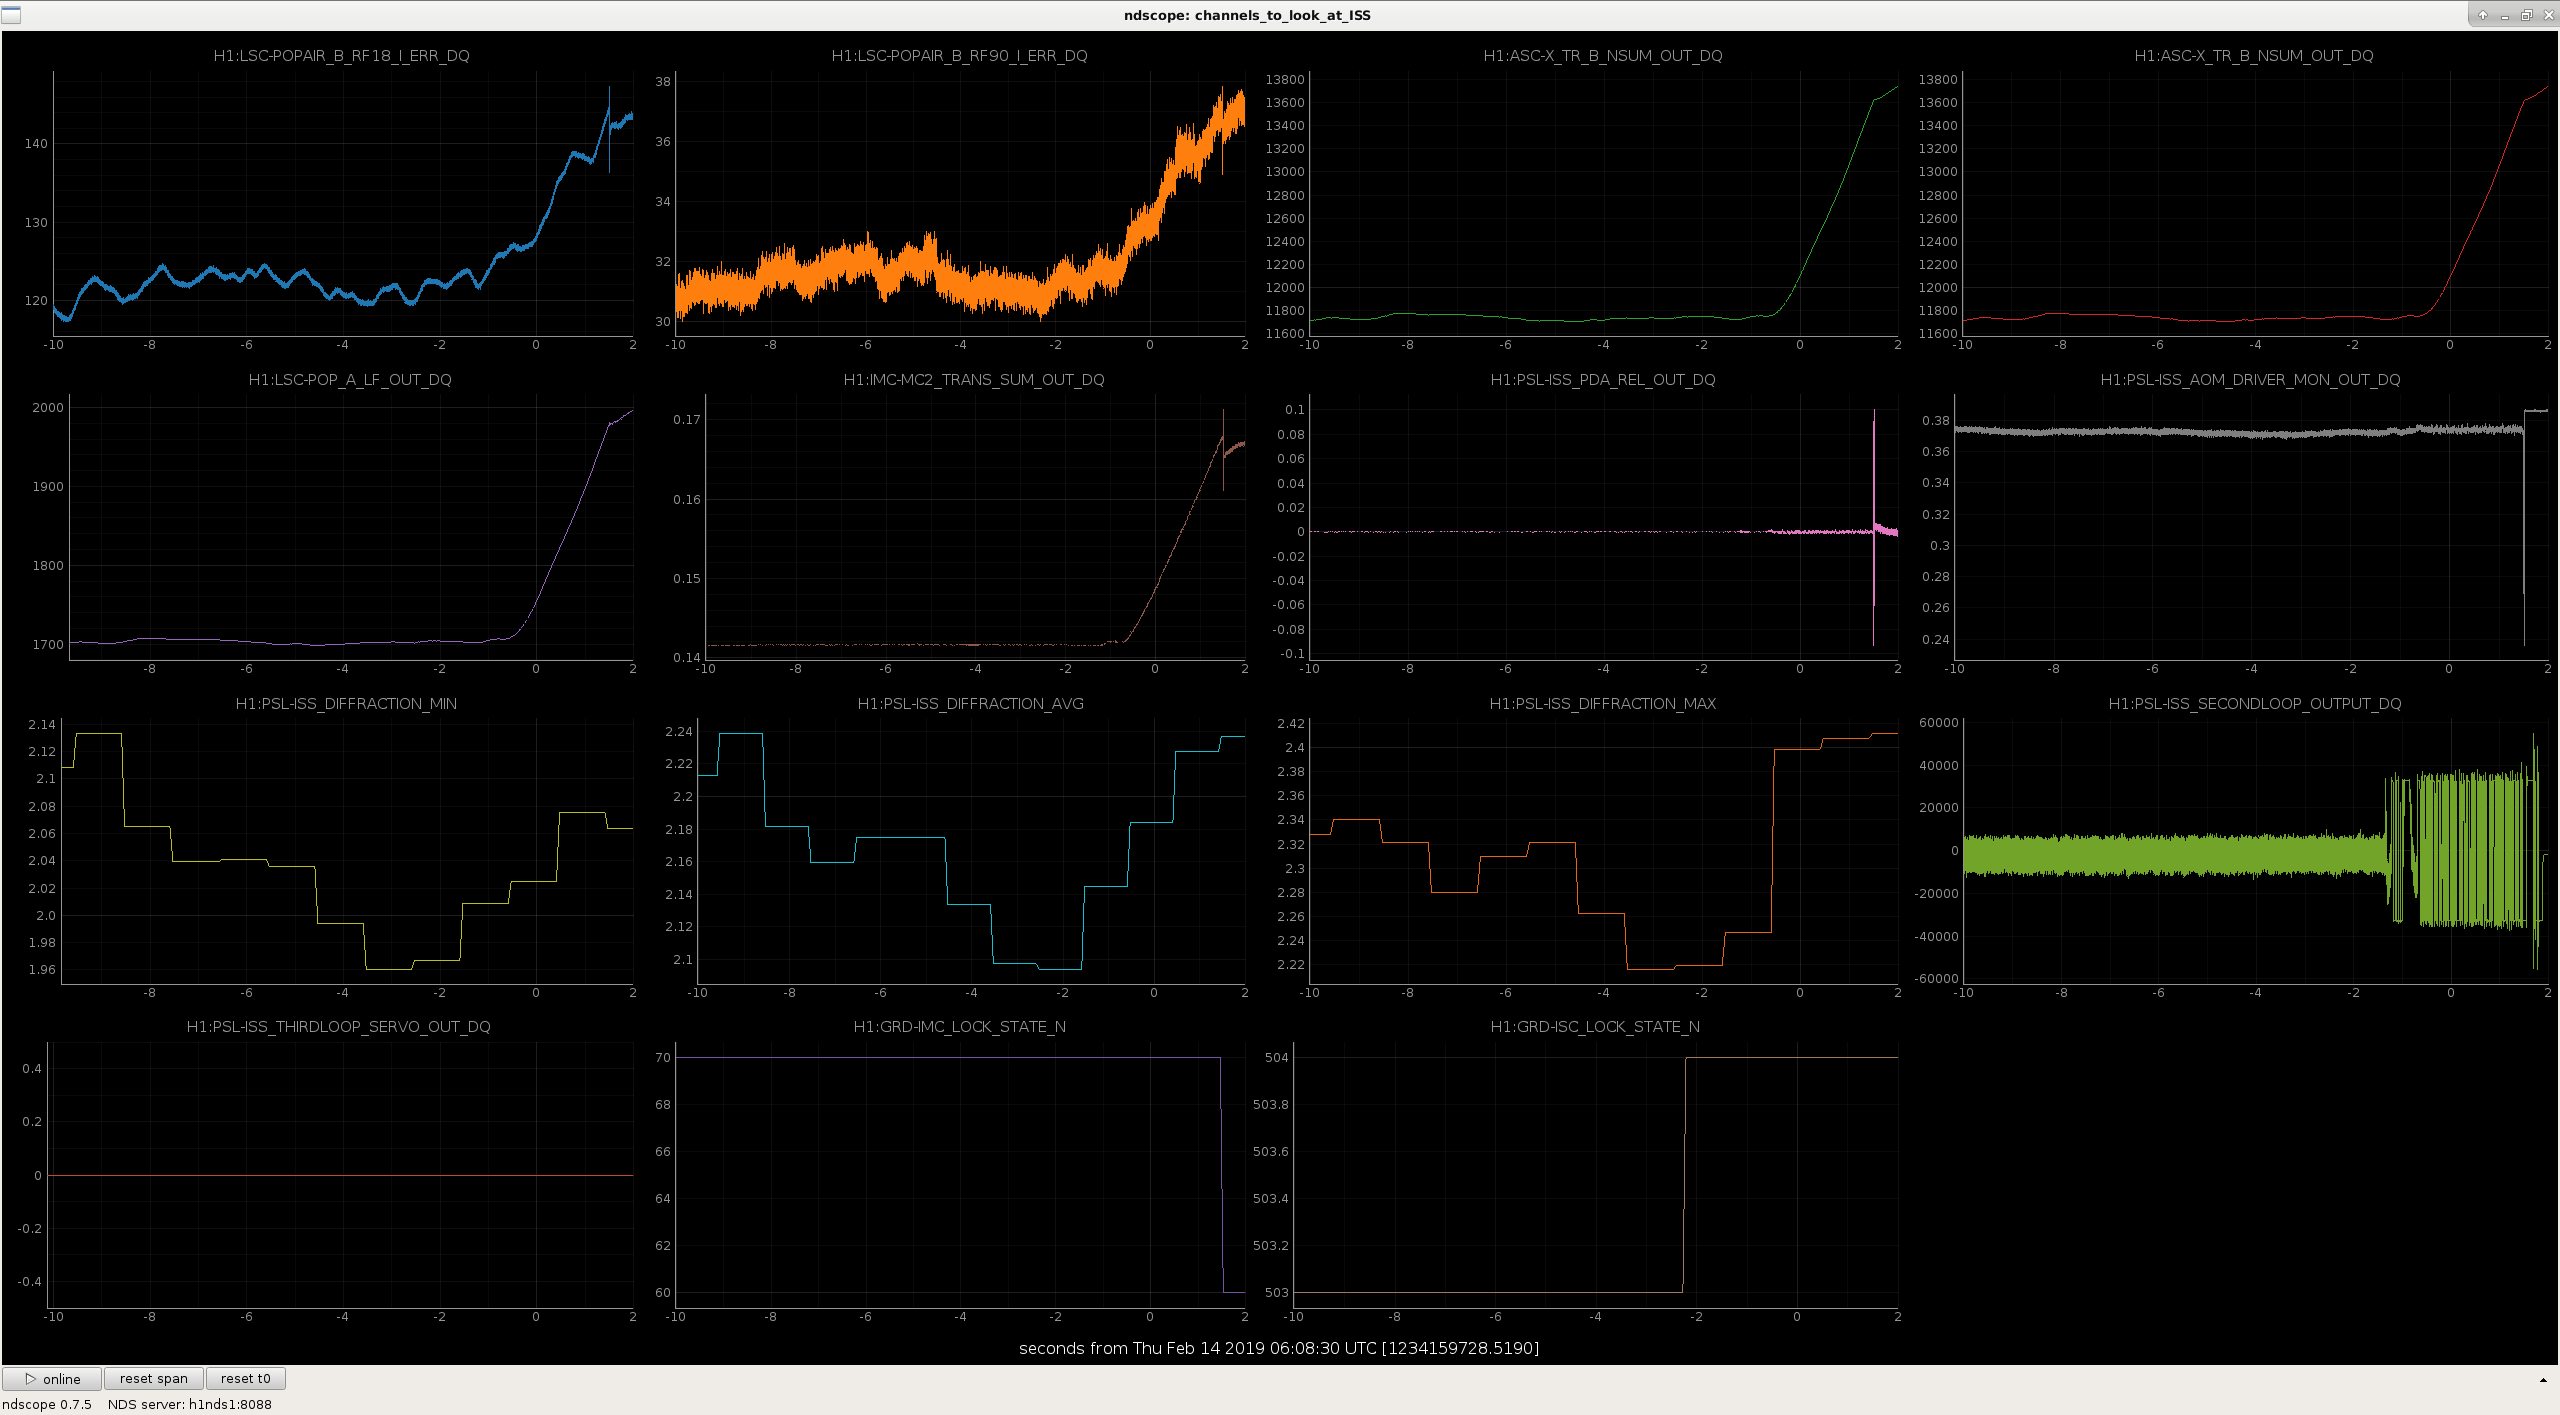
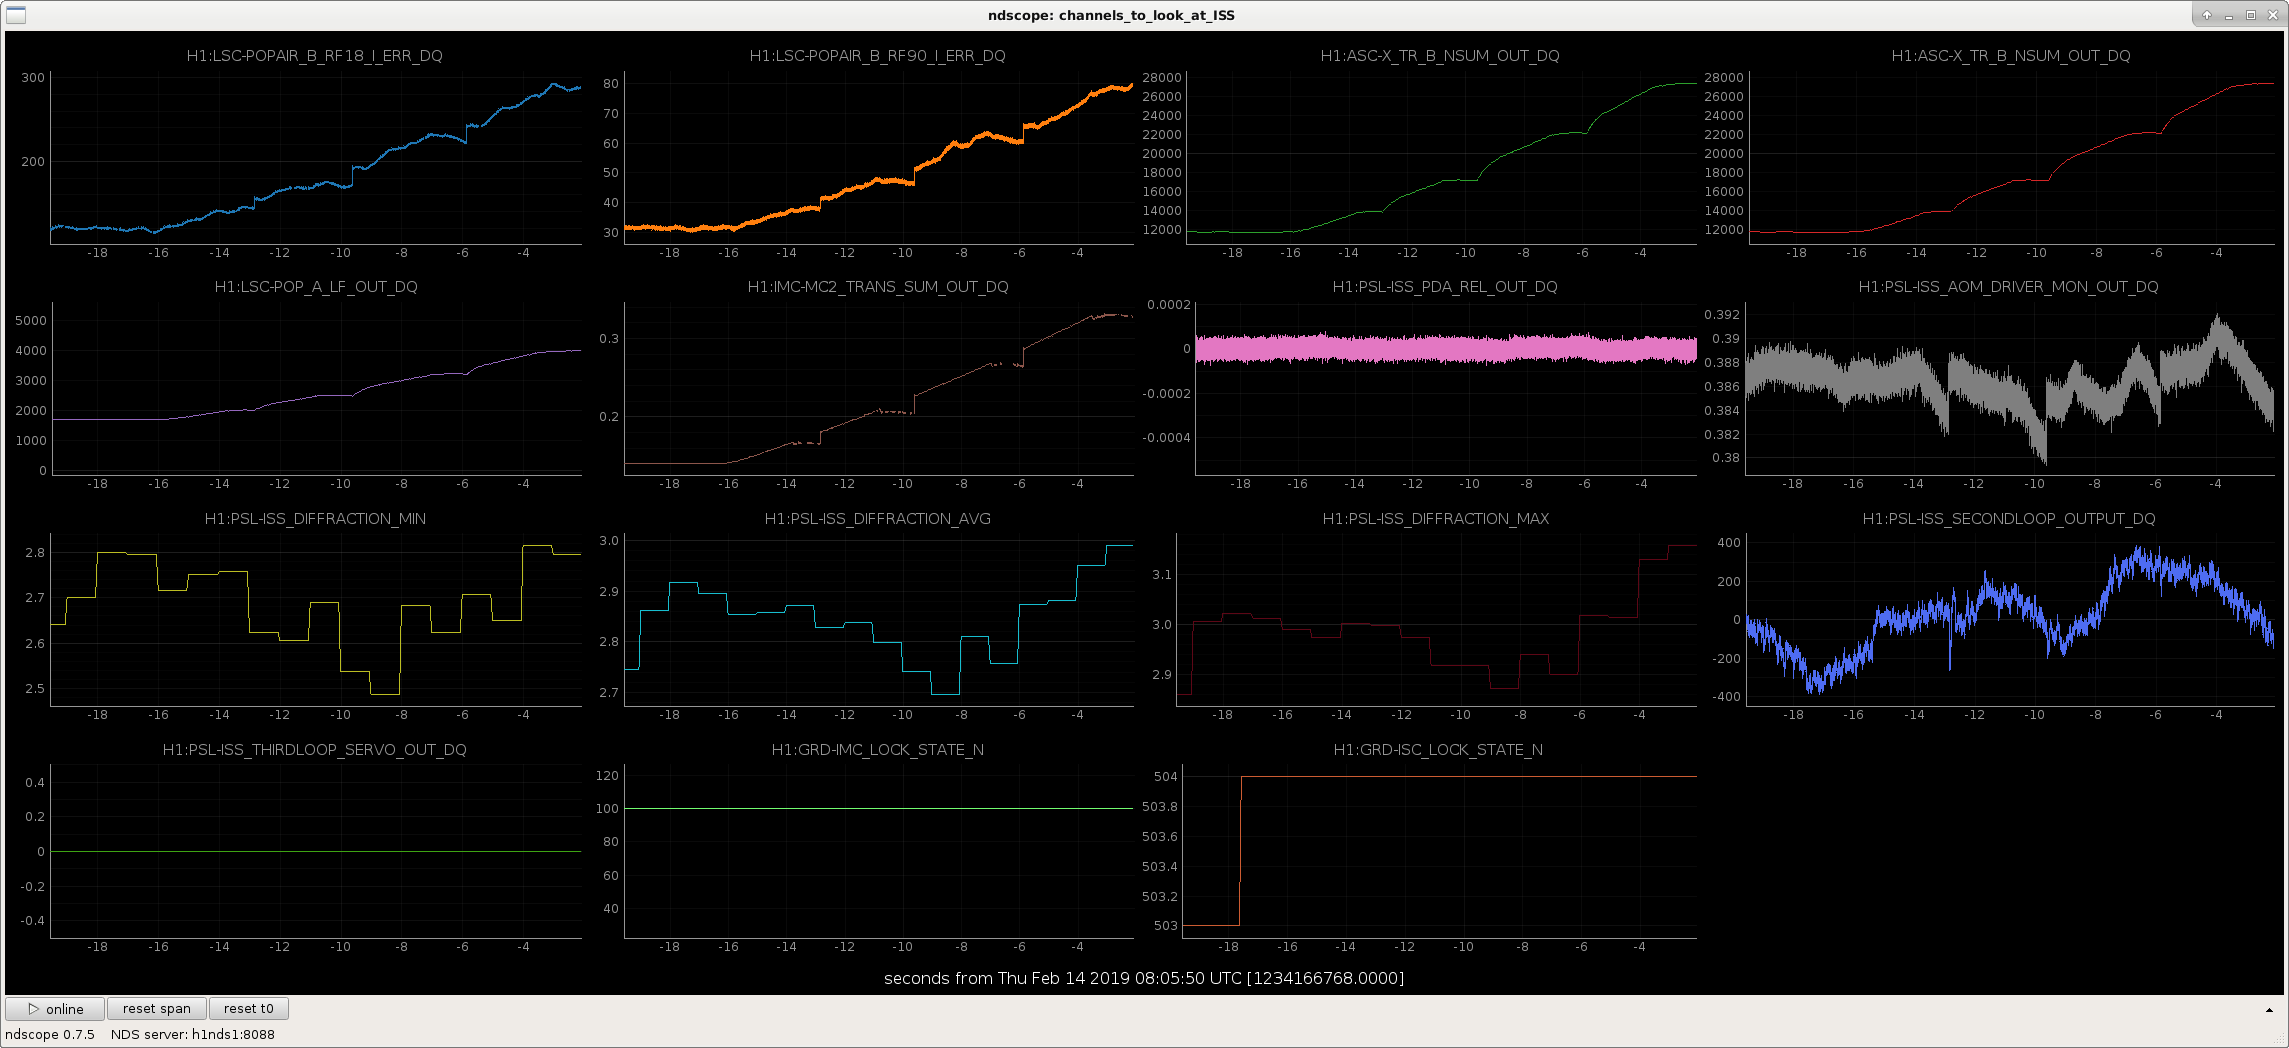
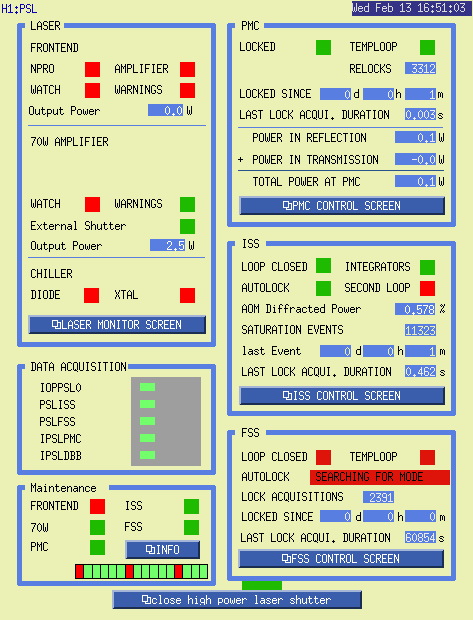
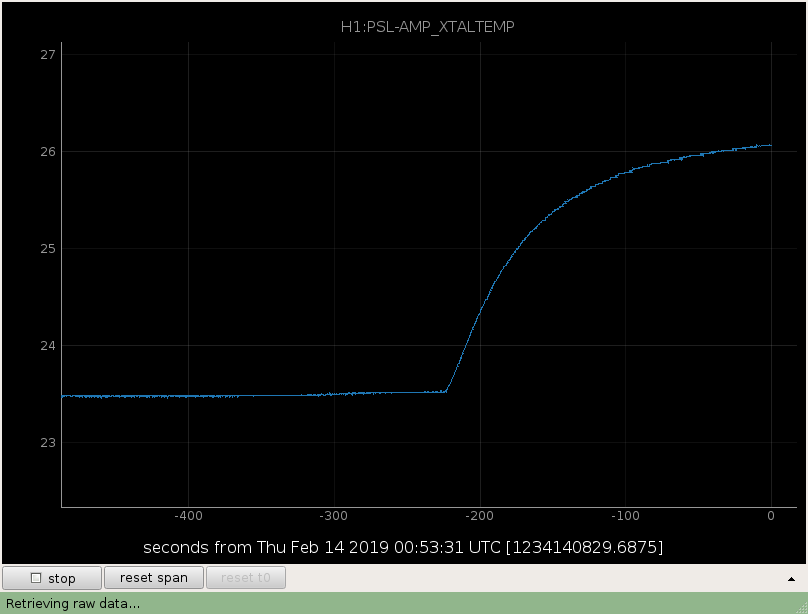
The PSL is offline again. Seems the chiller tripped again. XTALTEMP started rising about 5 minutes ago.
We went to the chiller, in the upper chiller we see no water in the tube where you fill the water. The display says Outlet temperature 20.7C setp: 20C, and cycles through error messages: flow senor 1, conductivity too high, level low.
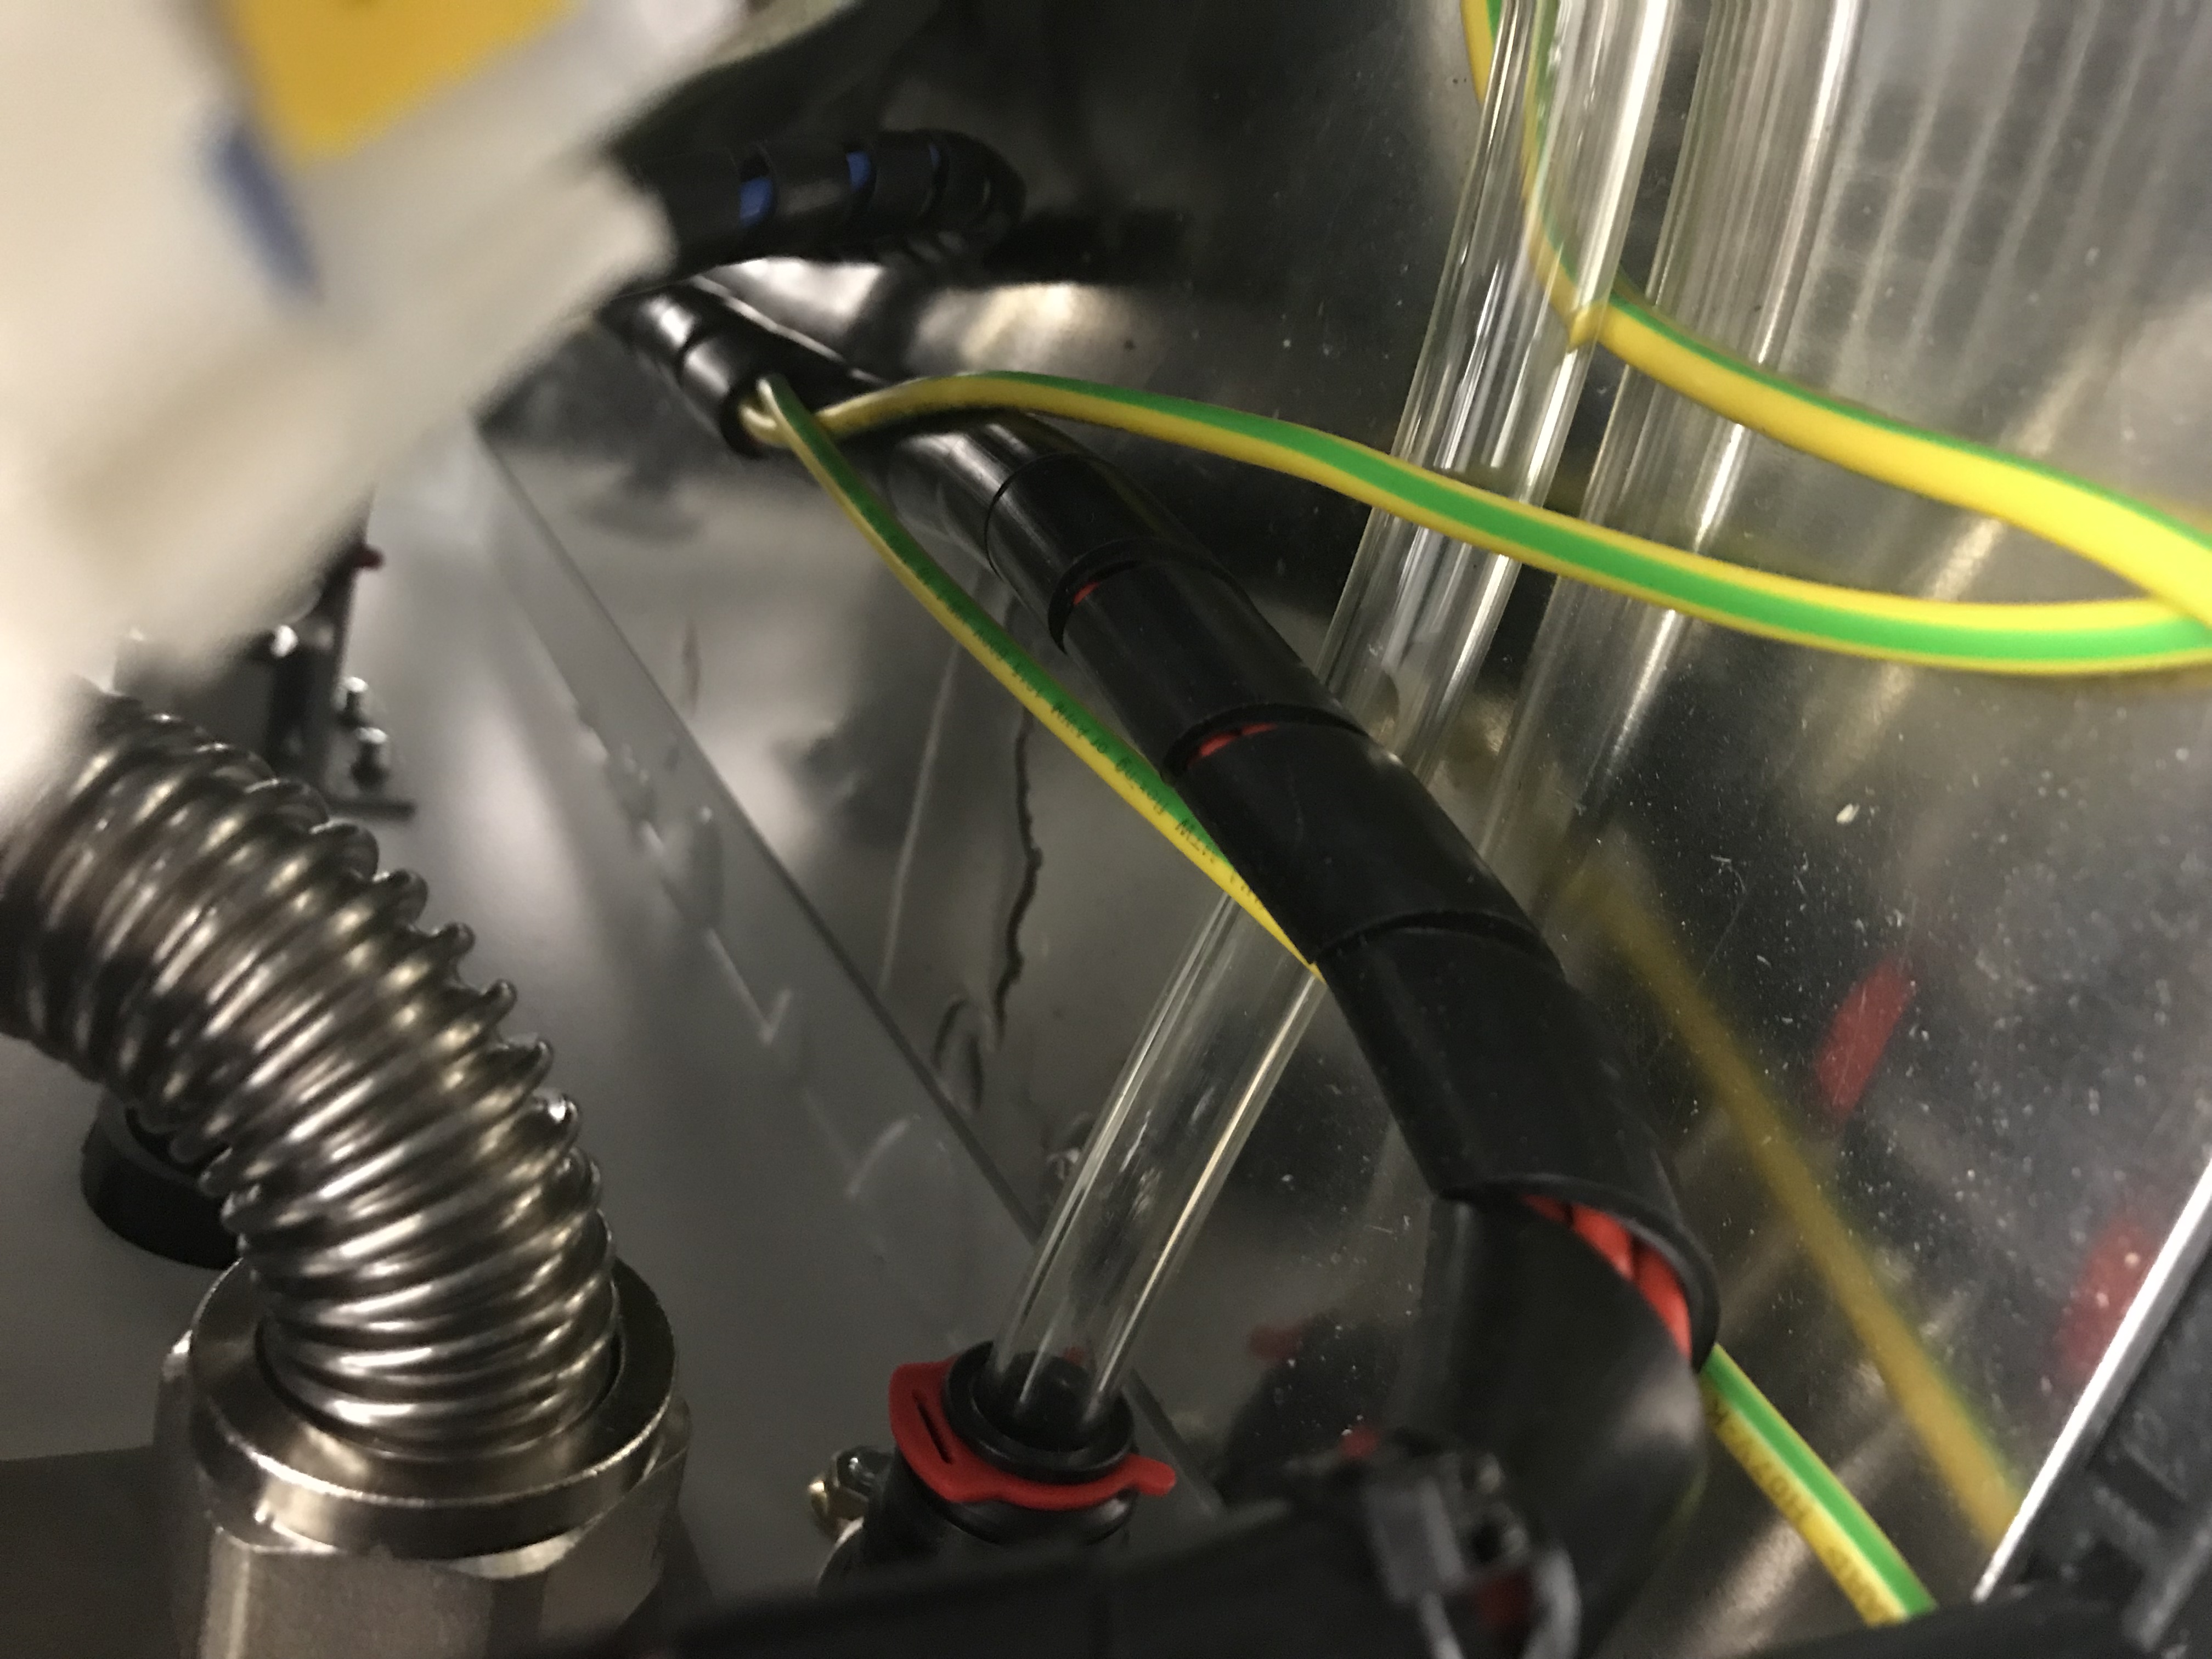
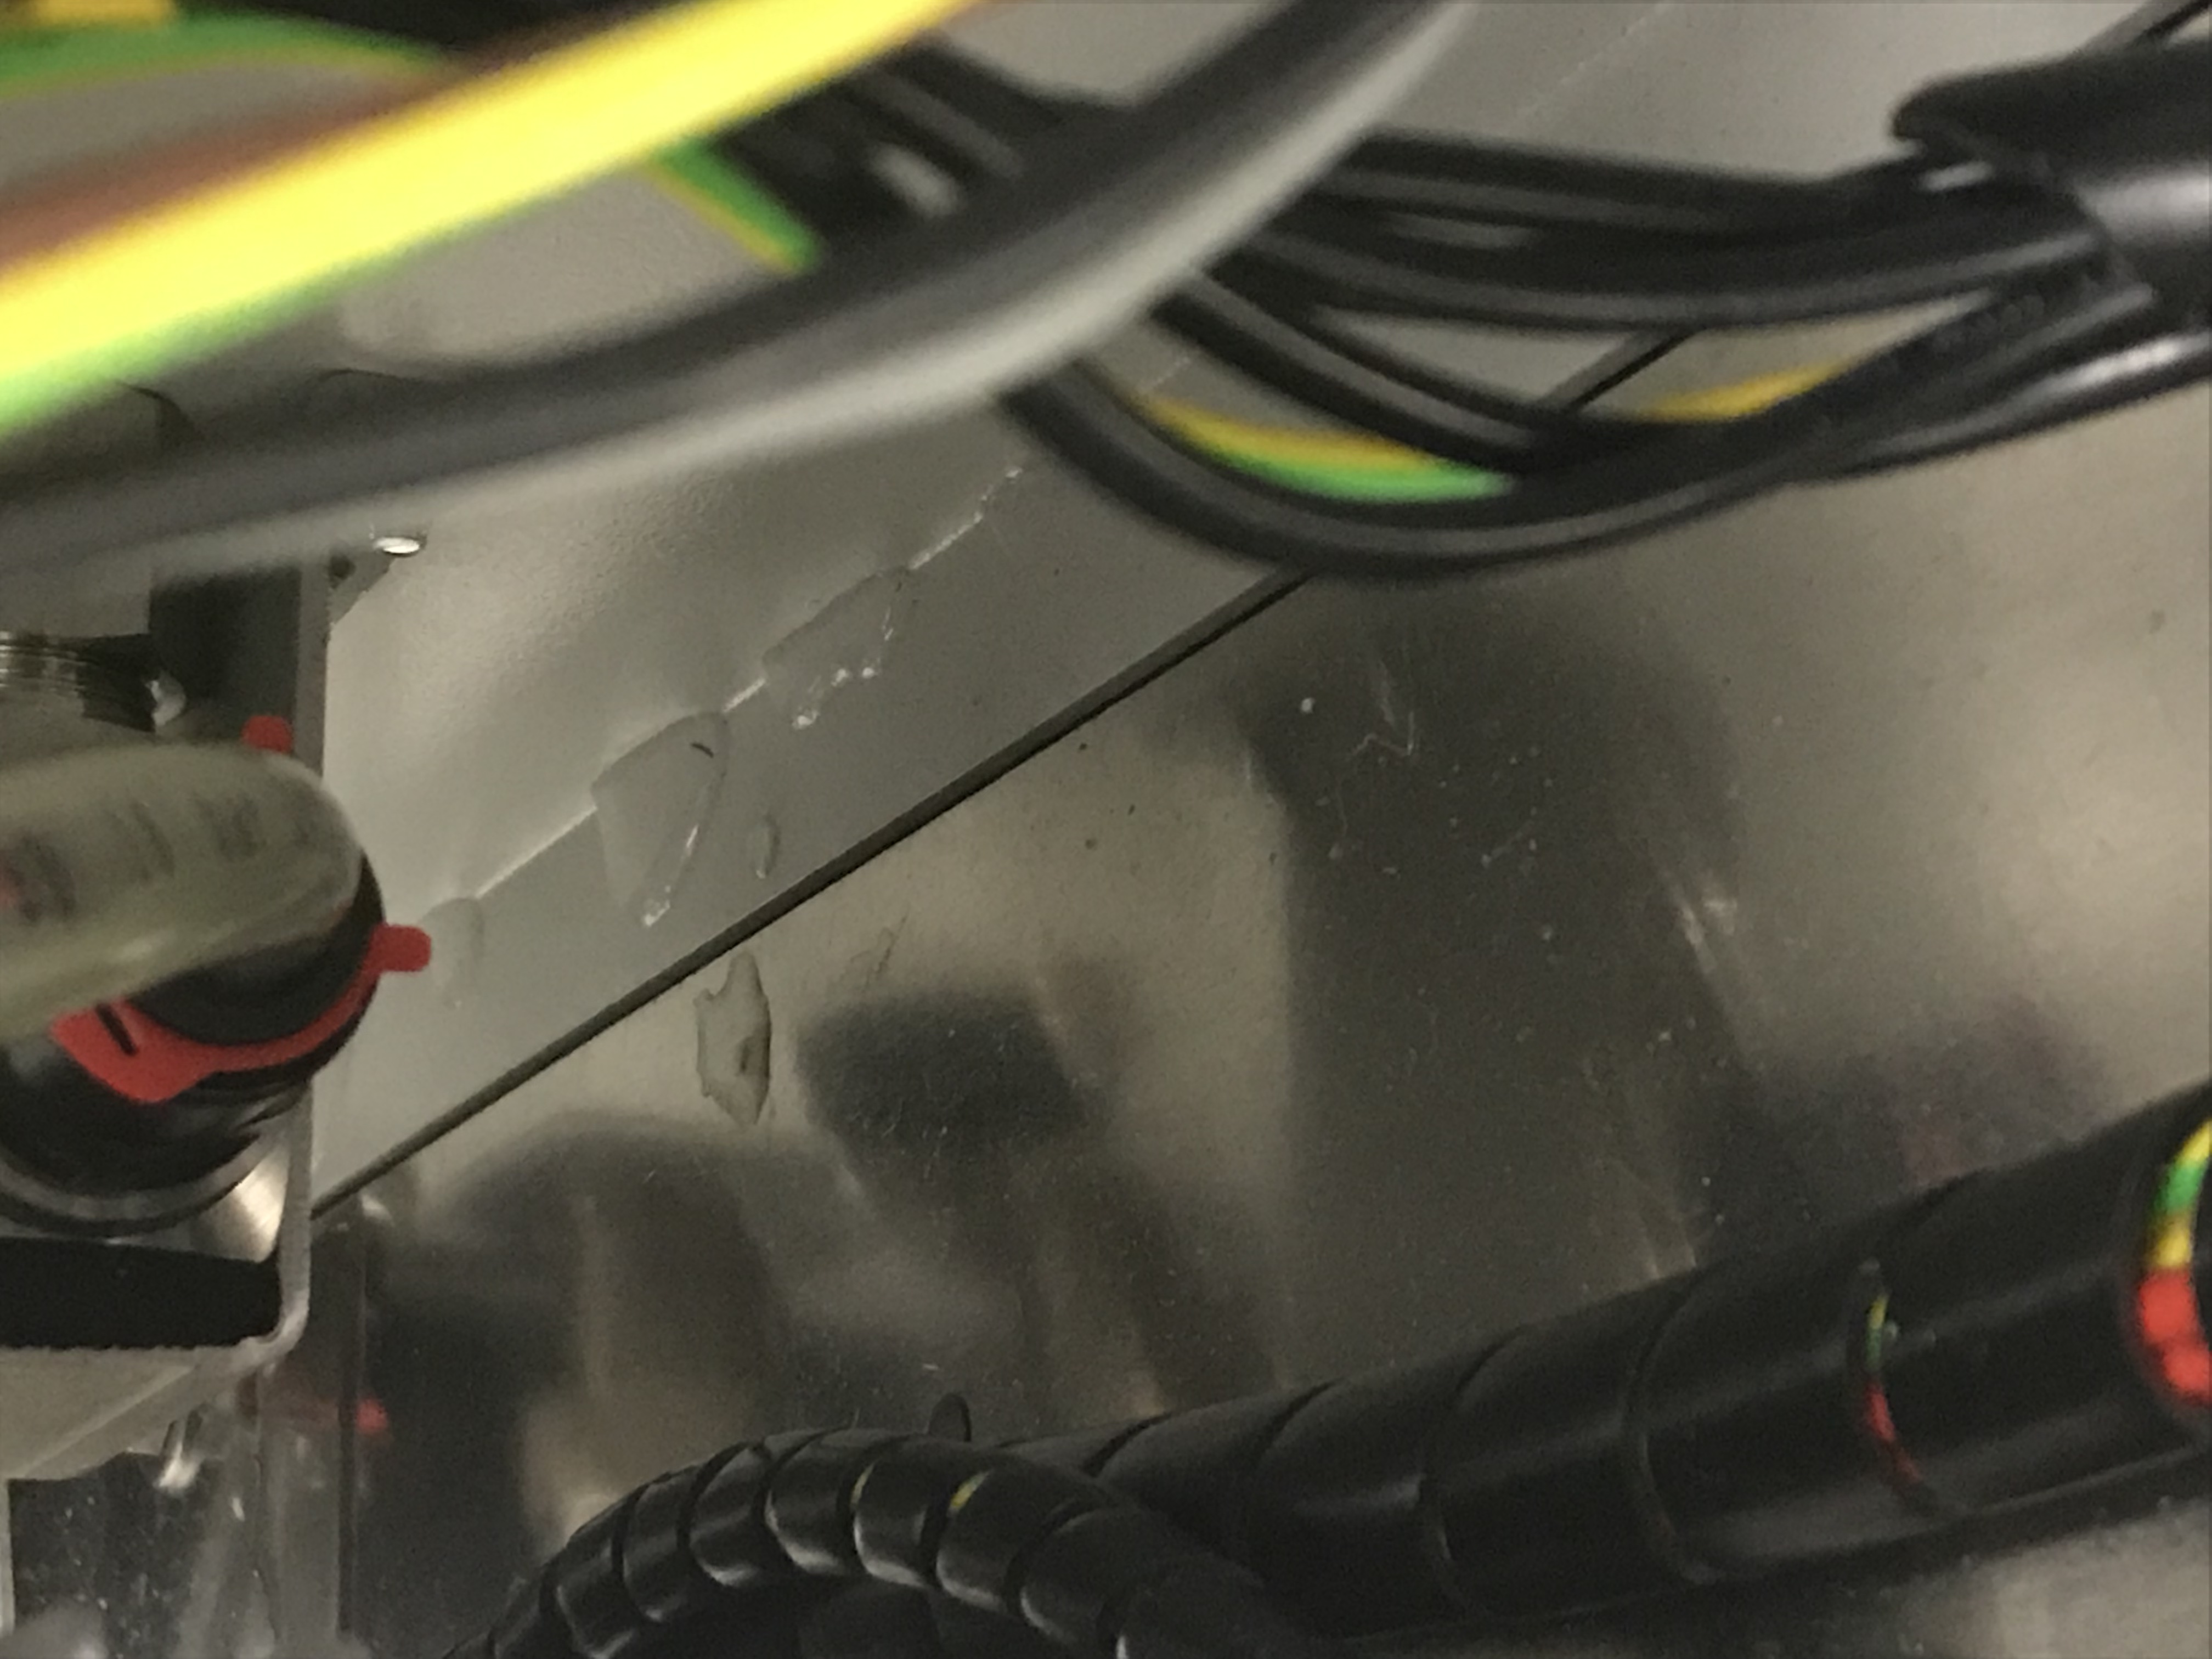
We saw some water on the floor about 1-2 cups of water. Some photos that show where the water was are attached. We wiped all the water up that was outside the chiller, but didn't reach in and around the cables to dry up inside the enclosure. The gray canvas in the back seems completely dry.
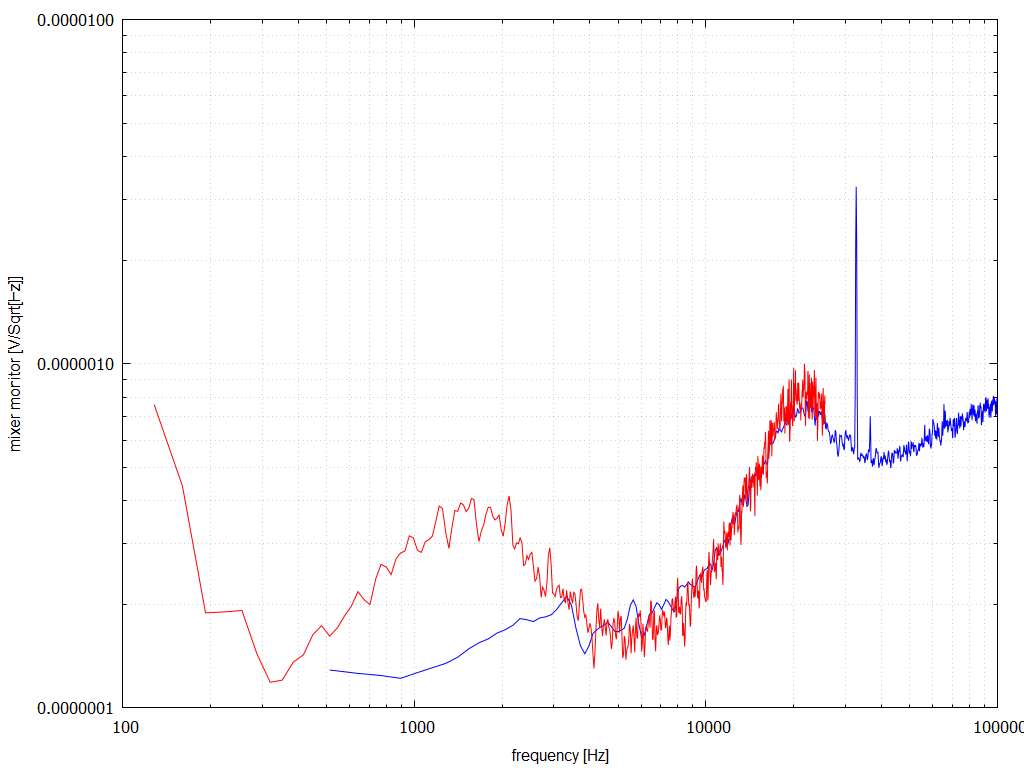
Yesterday Craig asked if there were any recent spectral measurements of the FSS mixer output - there weren't any.
This morning I set out to do the measurements.
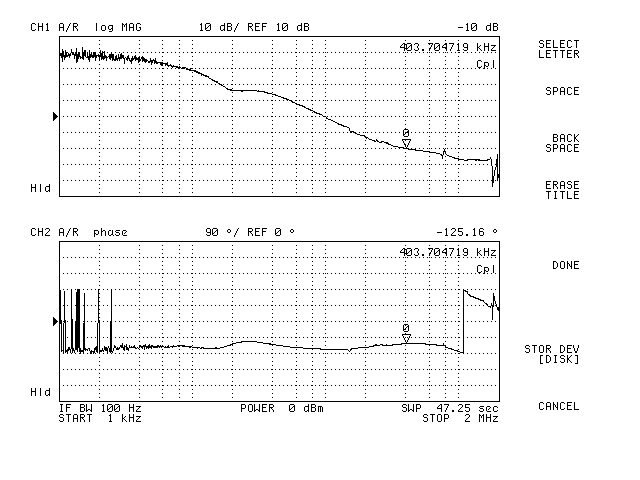
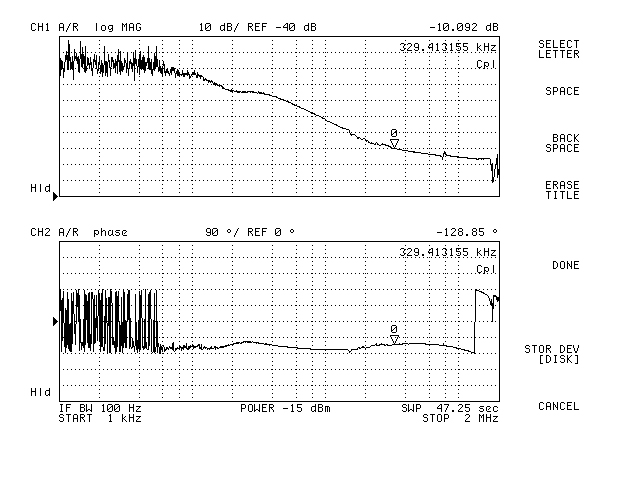
With the input modecleaner locked, a transfer function measurement was made (CG20FG9.jpg, data file has .txt
extension). There was nothing unusual with the measurement. A noise measurement was made (mxr.png, data files
are mxr0?.txt). Whilst the measurement was done the spectrum was moving as if a sweep was being done, even though
the network analyser was physically disconnected (see DSCN0648.MOV). I had noticed that the IMC MEDM screen
flashed the message that the IMC WFS were not centred. Even with the IMC in the down state this behaviour did not
stop.
Not long afterwards I noticed at the PZT monitor strip chart on the FSS MEDM screen was wall to wall black
and that reducing the common gain had no effect. The mixer monitor signal was constantly greater than 1.2 Vpp.
I then remembered that work was being done on HAM2 and thought what I was seeing might be related. However when
that work was completed, the behaviour remained. I then noticed that the metal block over the PA85 was stone cold,
whereas it is normally warm to the touch. A quick check of its output voltage indicated that it was almost always
close to zero suggesting a blown PA85.
The spare FSS was deployed. It locked readily enough, however for unknown reasons the common gain could not be
increased much beyond -6 dB without the PZT railing. Clearly there is some difference between the two units,
although I seem to remember bringing them to the same hardware level 4 years ago. The PA85 was replaced in the
original FSS, and things locked up straight away. The PZT was not oscillating, gain sliders were restored. The
transfer function with the repaired FSS is in PA85.jpg (data file PA85.txt).
It was there I left things, since the input modecleaner needed to be back online by 08:30 am local.
It is not obvious why the PA85 died. One possible reason is due to overheating. With the FSS located under
the PSL table not as much air gets blown over the PCB. With the lid off the FSS box, the conducting surface area
is reduced somewhat. Unfortunately accessing the test points requires removing the lid.
Peter / Richard / Ed
For future reference, the trans PDC FSS-TPC_DC was at around 3.1-3Volts when this was taken.