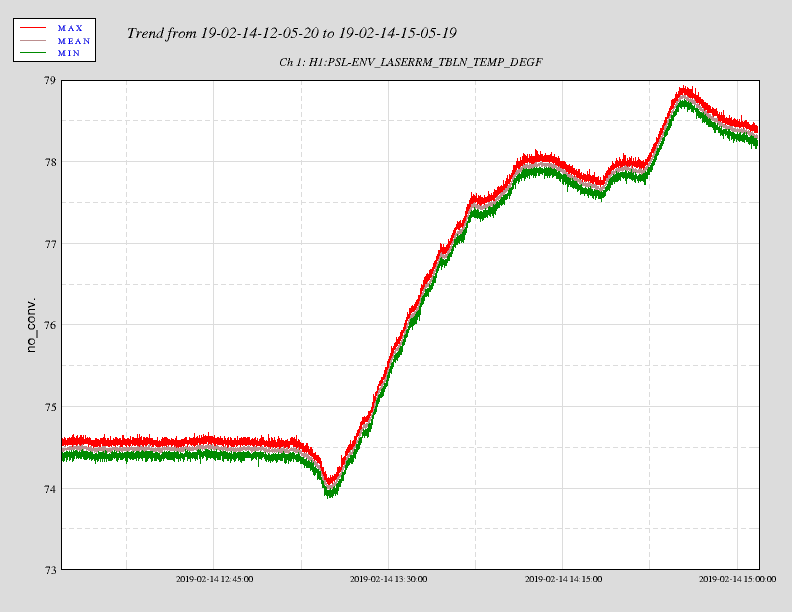
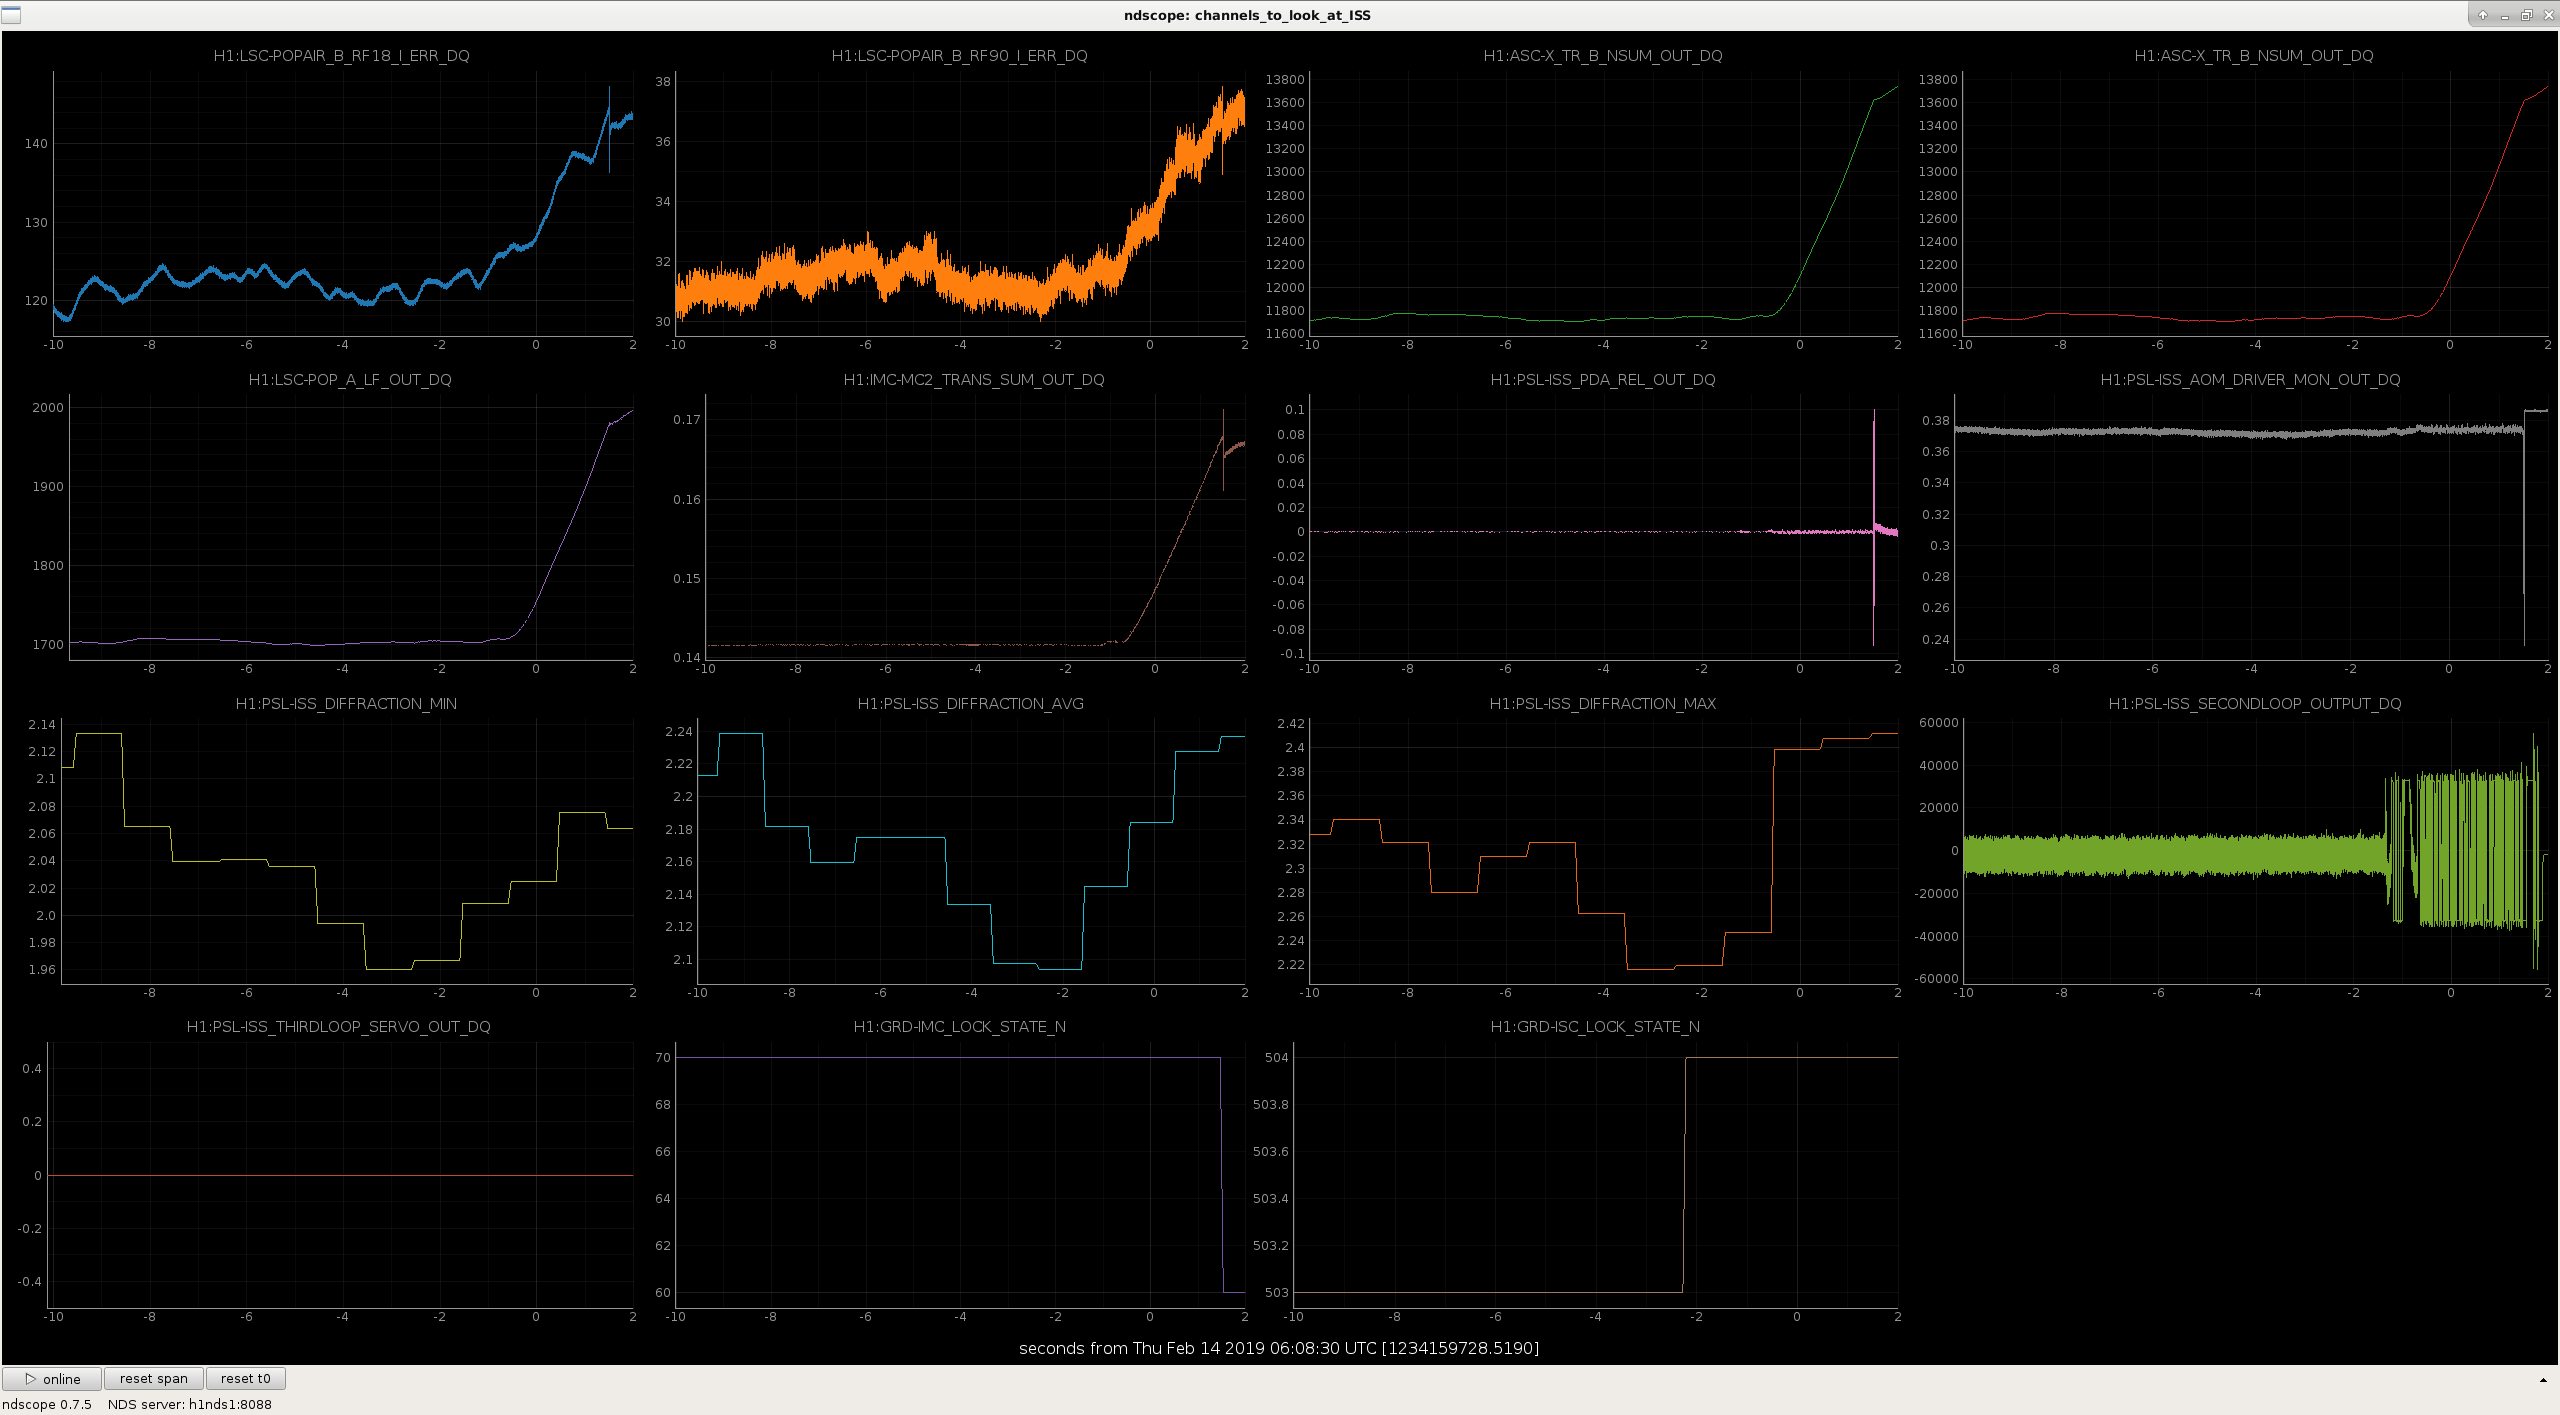
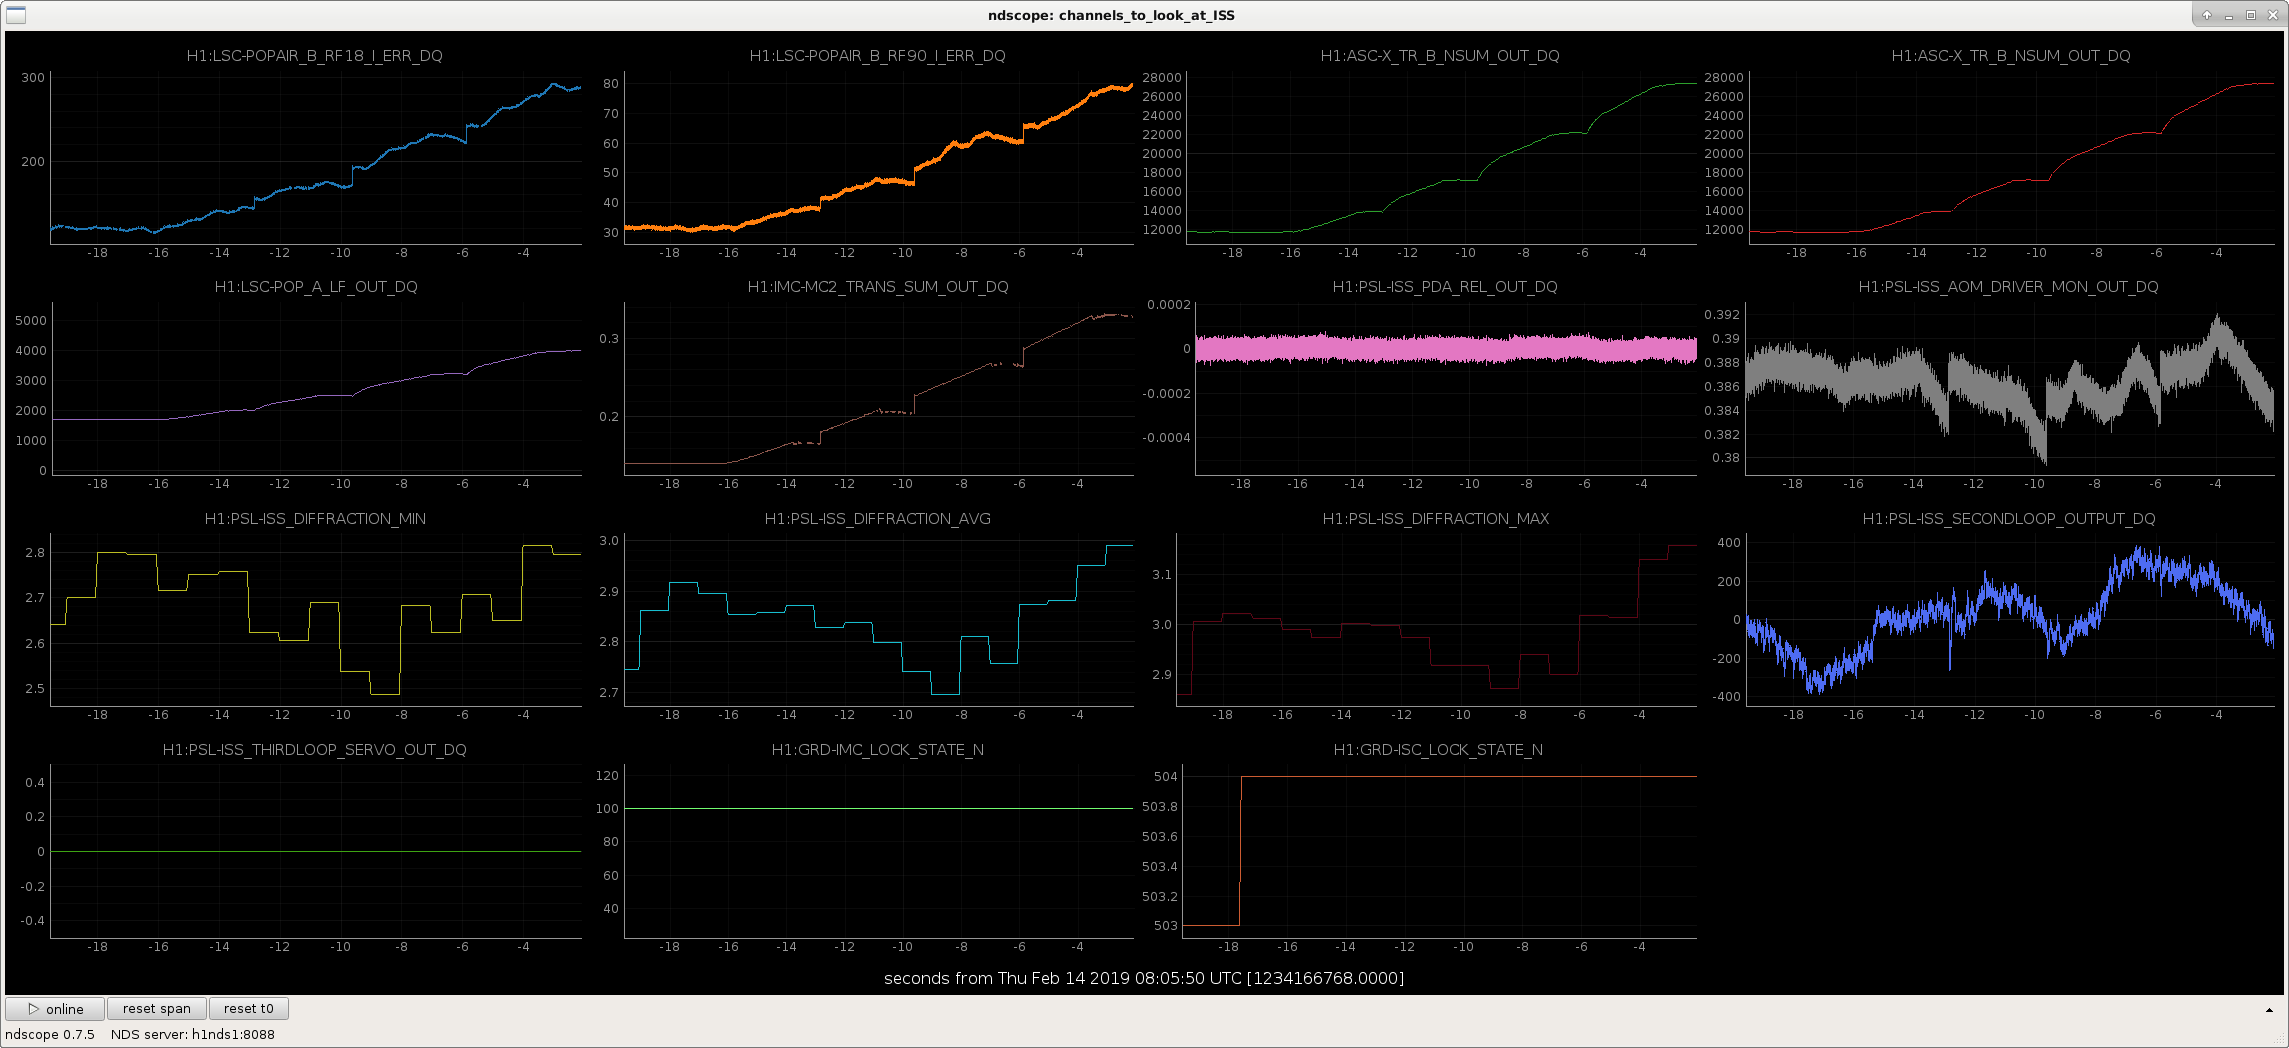
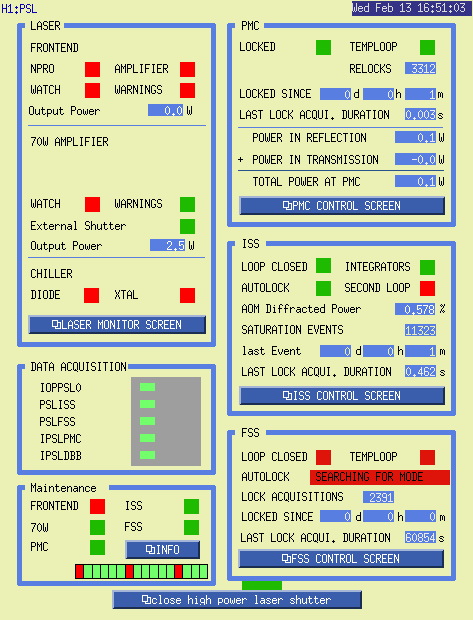
Addressed TCS Chillers (09:55 - 10:05 AM PST today/Thurs)
The CW injections appear to have crashed on Tuesday Feb 12 at 20:04:46 UTC. I have restarted them as of Thursday Feb 14 at 16:19:56 UTC (GPS 1234196414). See attached graph for turnon confirmation.
Tweaked alignment into the reference cavity.
When I exited the enclosure, as soon as the air shower door closed, all HEPA fans and the make up air fan died
and the controller indicated that the air conditioning units were off.
An observation I have noticed is that with the change made to the air conditioning set temperature, the heater
drive for the pre-modecleaner behaves quite differently - most likely because it no longers sits as high above
ambient temperature as it once did. As a result it limits the time that can be spent in the enclosure to about
half an hour before a dance between the pre-modecleaner losing lock and the reference cavity losing lock. As the
FSS is trying to re-acquire, the pre-modecleaner PZT voltage heads towards the low end causing a delay as to
when the FSS re-acquires because the pre-modecleaner drops out of lock. All of which makes re-alignment an exercise
in patience.
After getting the FSS to lock, I went back outside to the LVEA to find that all the HEPA fans and air conditioning units were now on. They were switched off. There's something not quite right with the controller panel at the moment - for what ever reason.
I've turned the make up air fan to 100% to aid bring the temperature down a little faster.
The make up air fan was turned off at ~08:30 am.
Sheila, Jamie
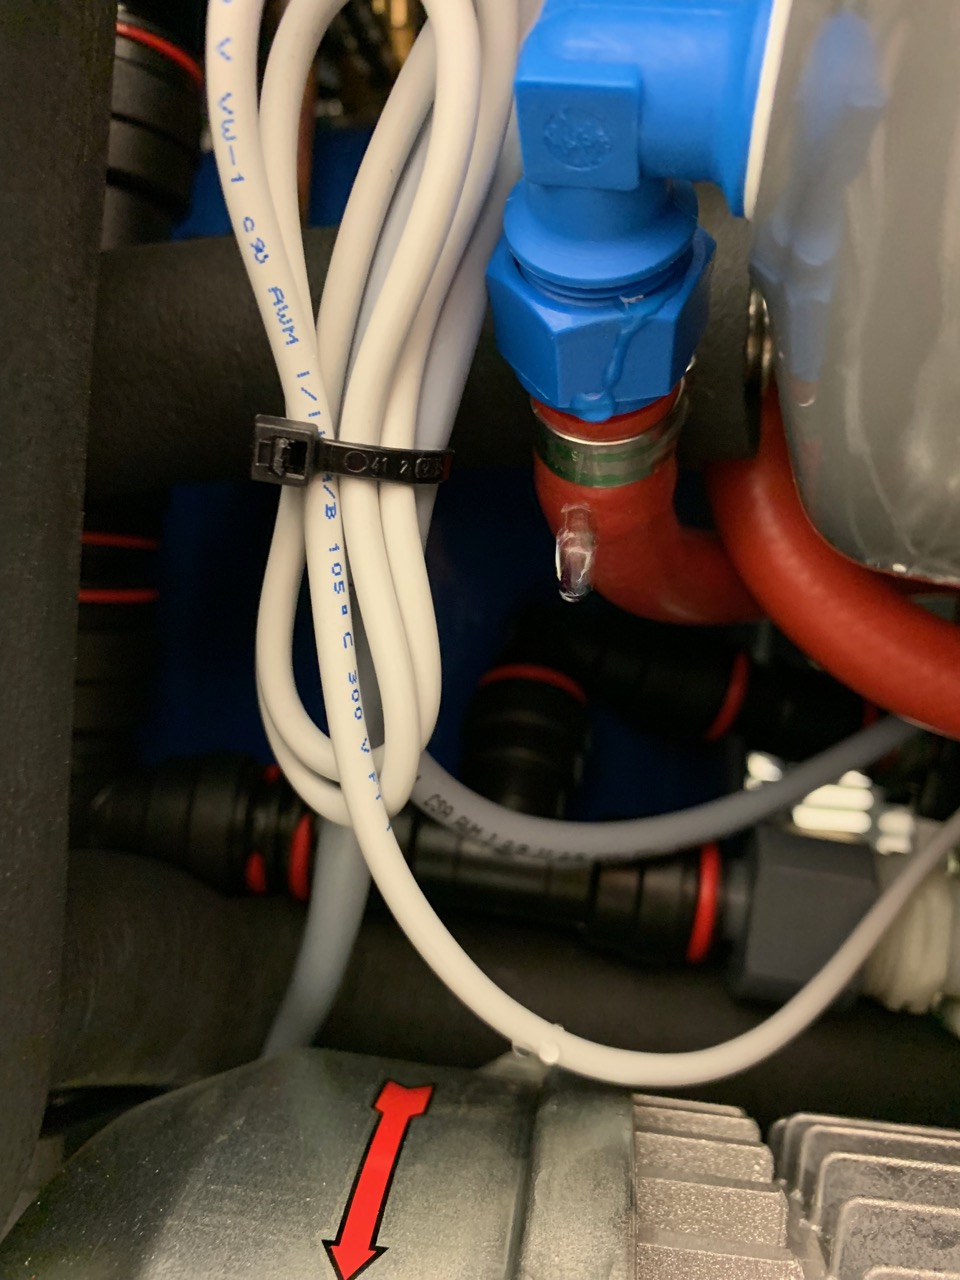
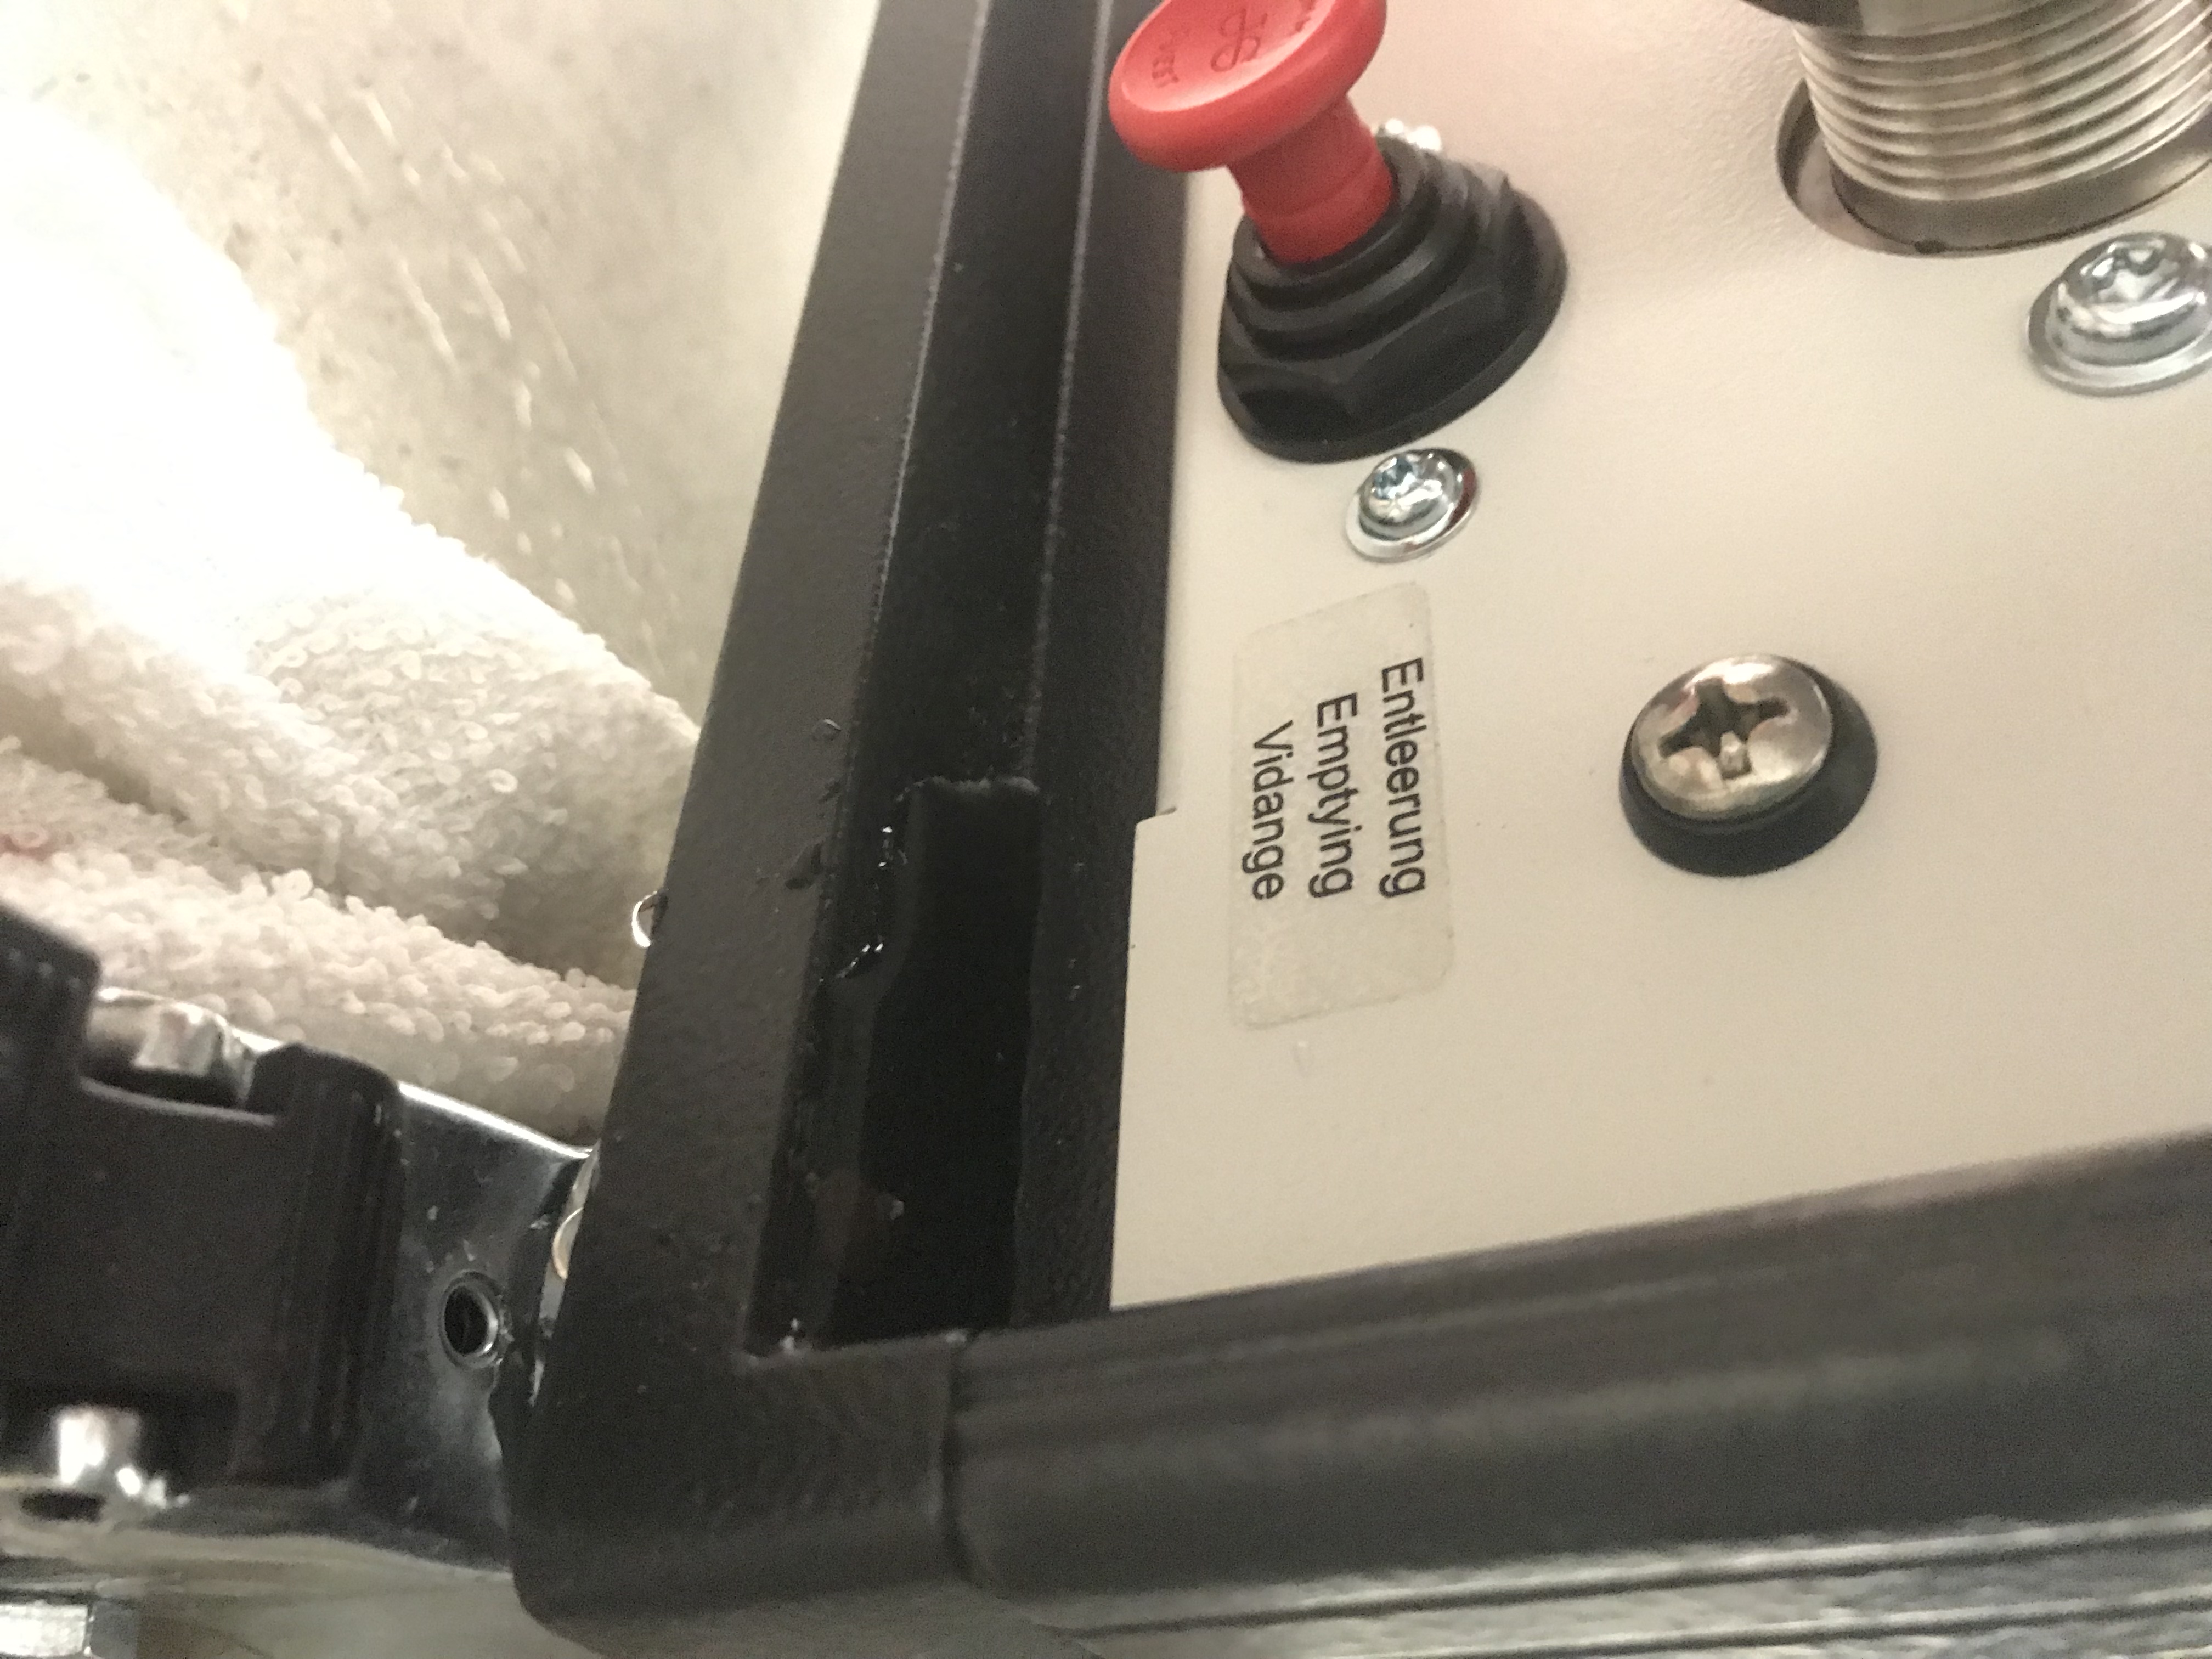
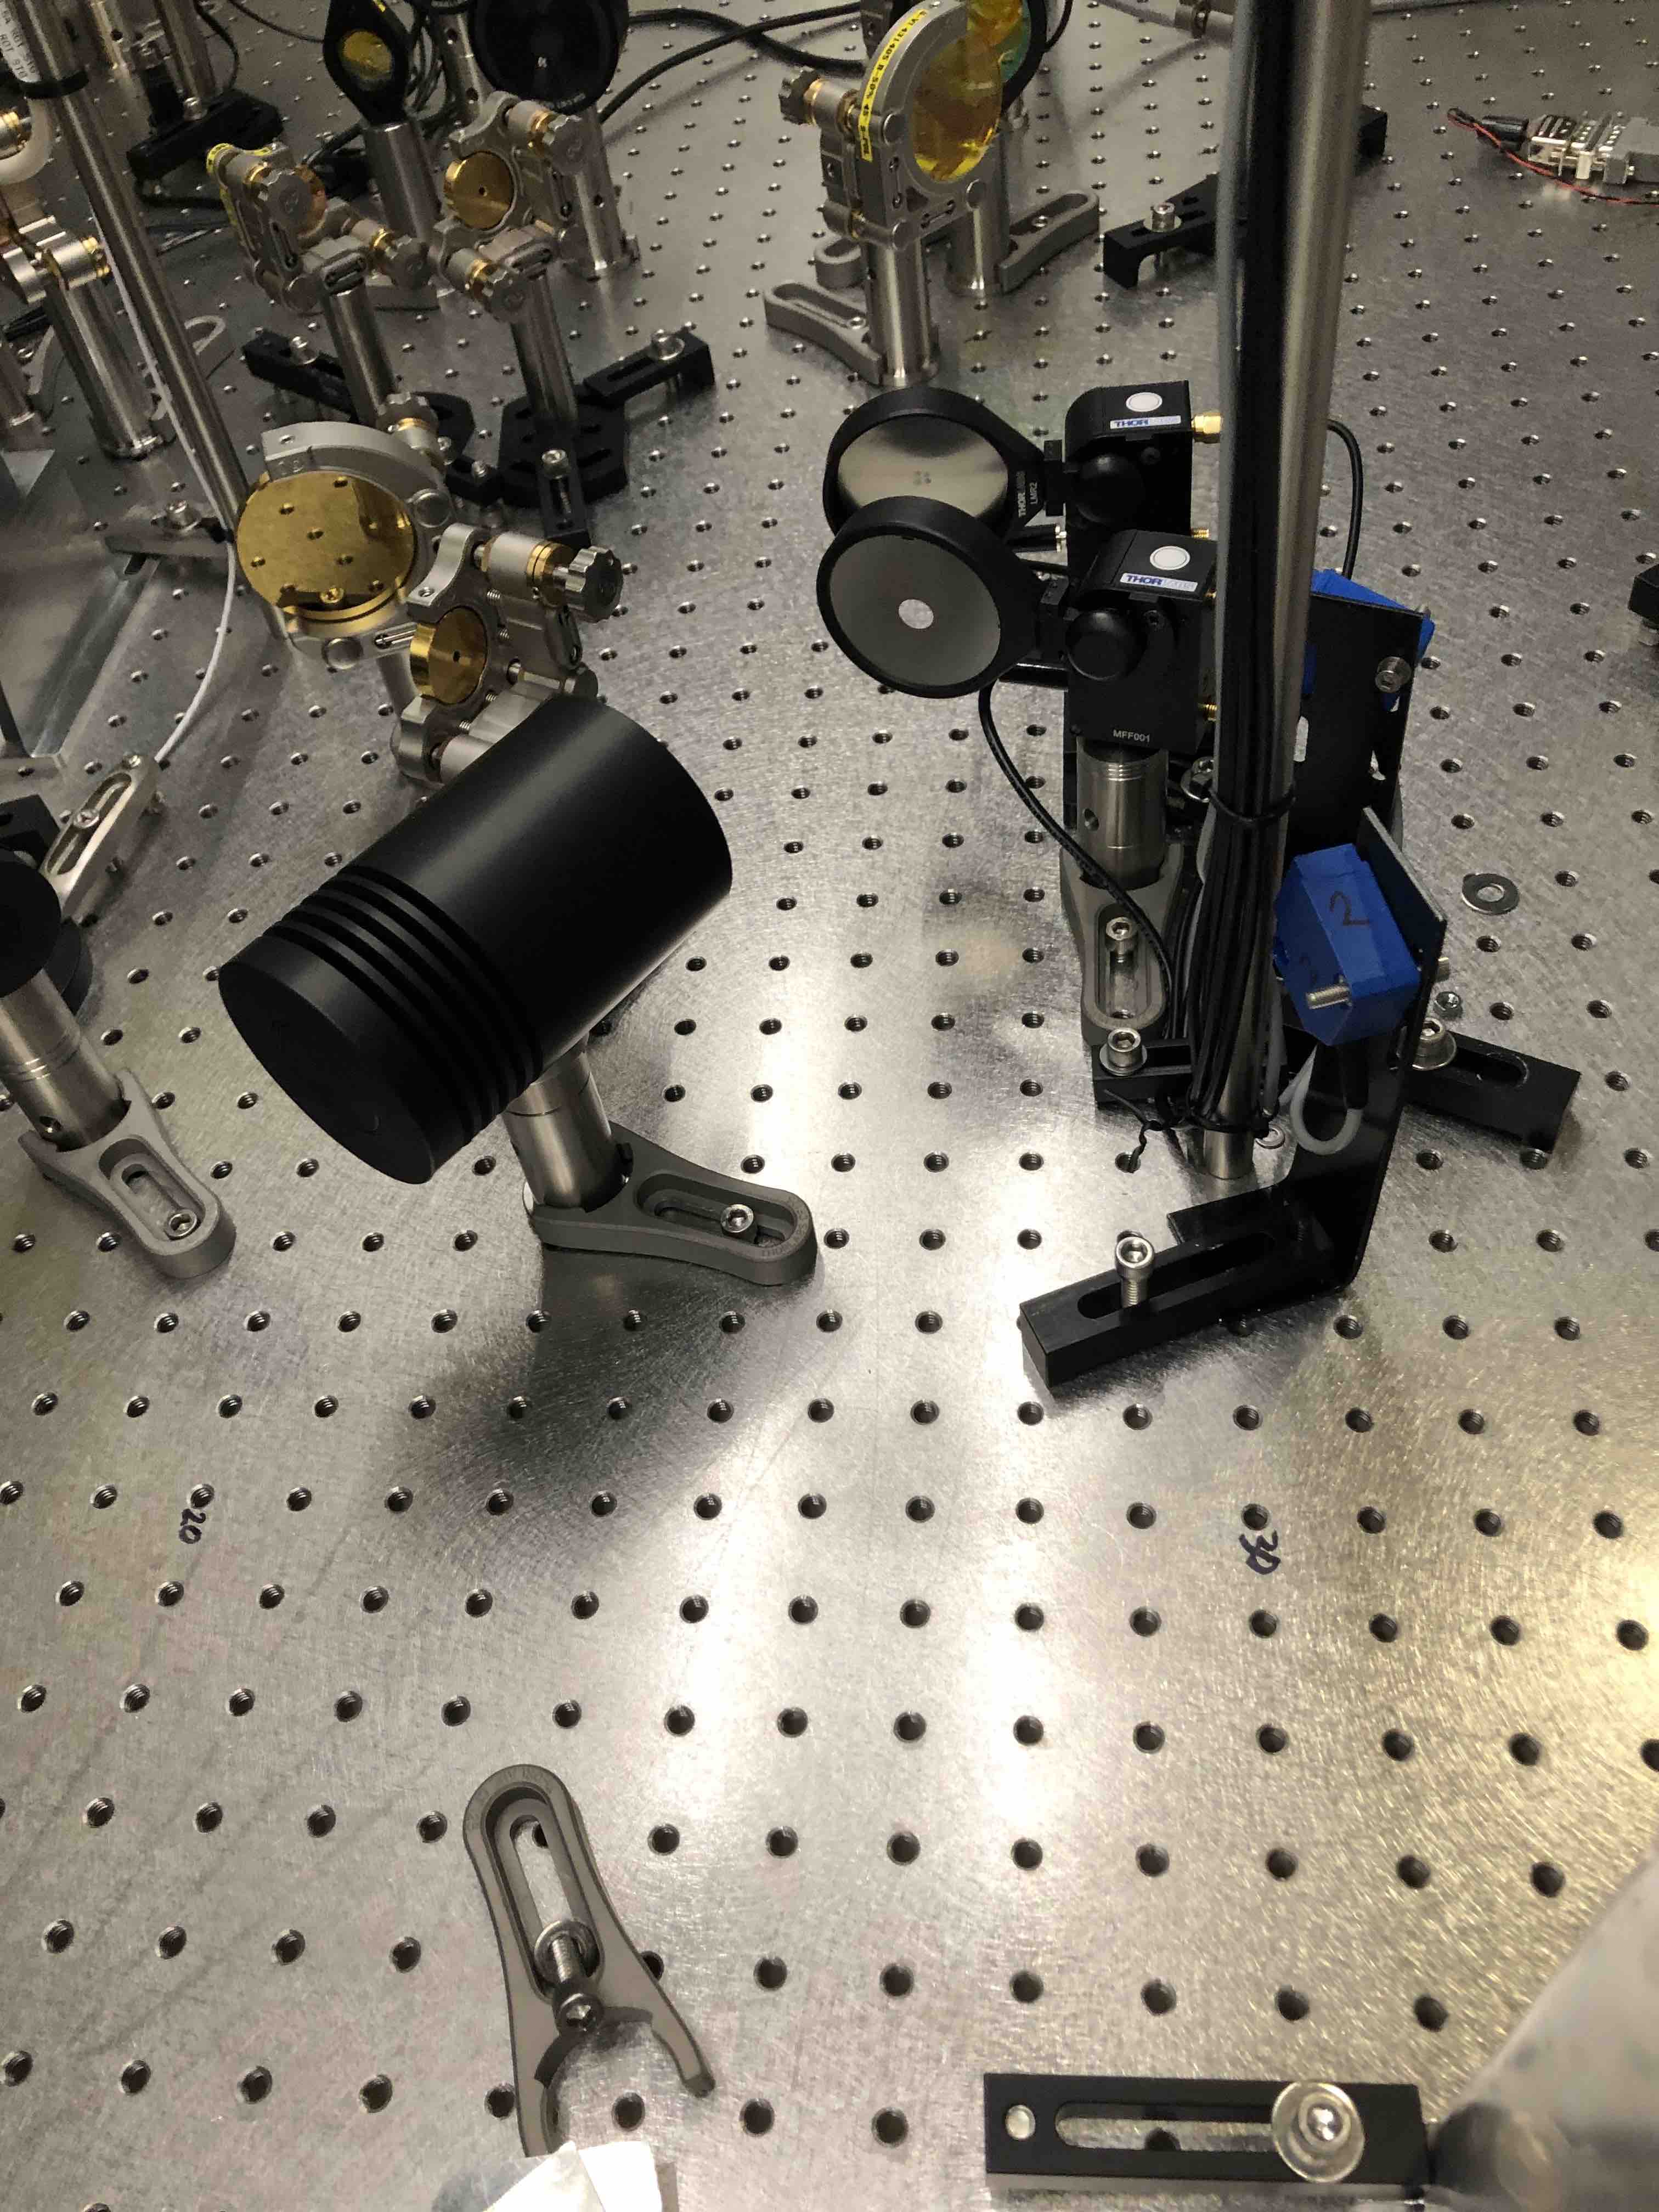
There was a small water leak at one of the (blue) plastic fittings at one end of the deionizer cartridge (gray cylinder in attached photo) in the Crystal chiller.
Re-seating and carefully tightening (trying to make sure not to over-tighten) the connection seems to have fixed the leak.
Topped off the water, installed the stopper, then re-started the laser. All the servos locked on their own and the MC locked right away.
Seems we are back in business.
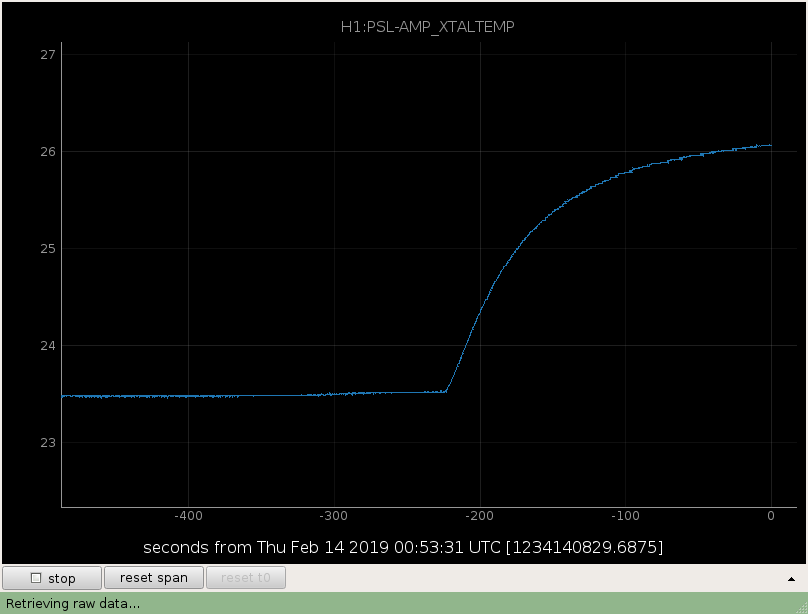
The PSL is offline again. Seems the chiller tripped again. XTALTEMP started rising about 5 minutes ago.
We went to the chiller, in the upper chiller we see no water in the tube where you fill the water. The display says Outlet temperature 20.7C setp: 20C, and cycles through error messages: flow senor 1, conductivity too high, level low.
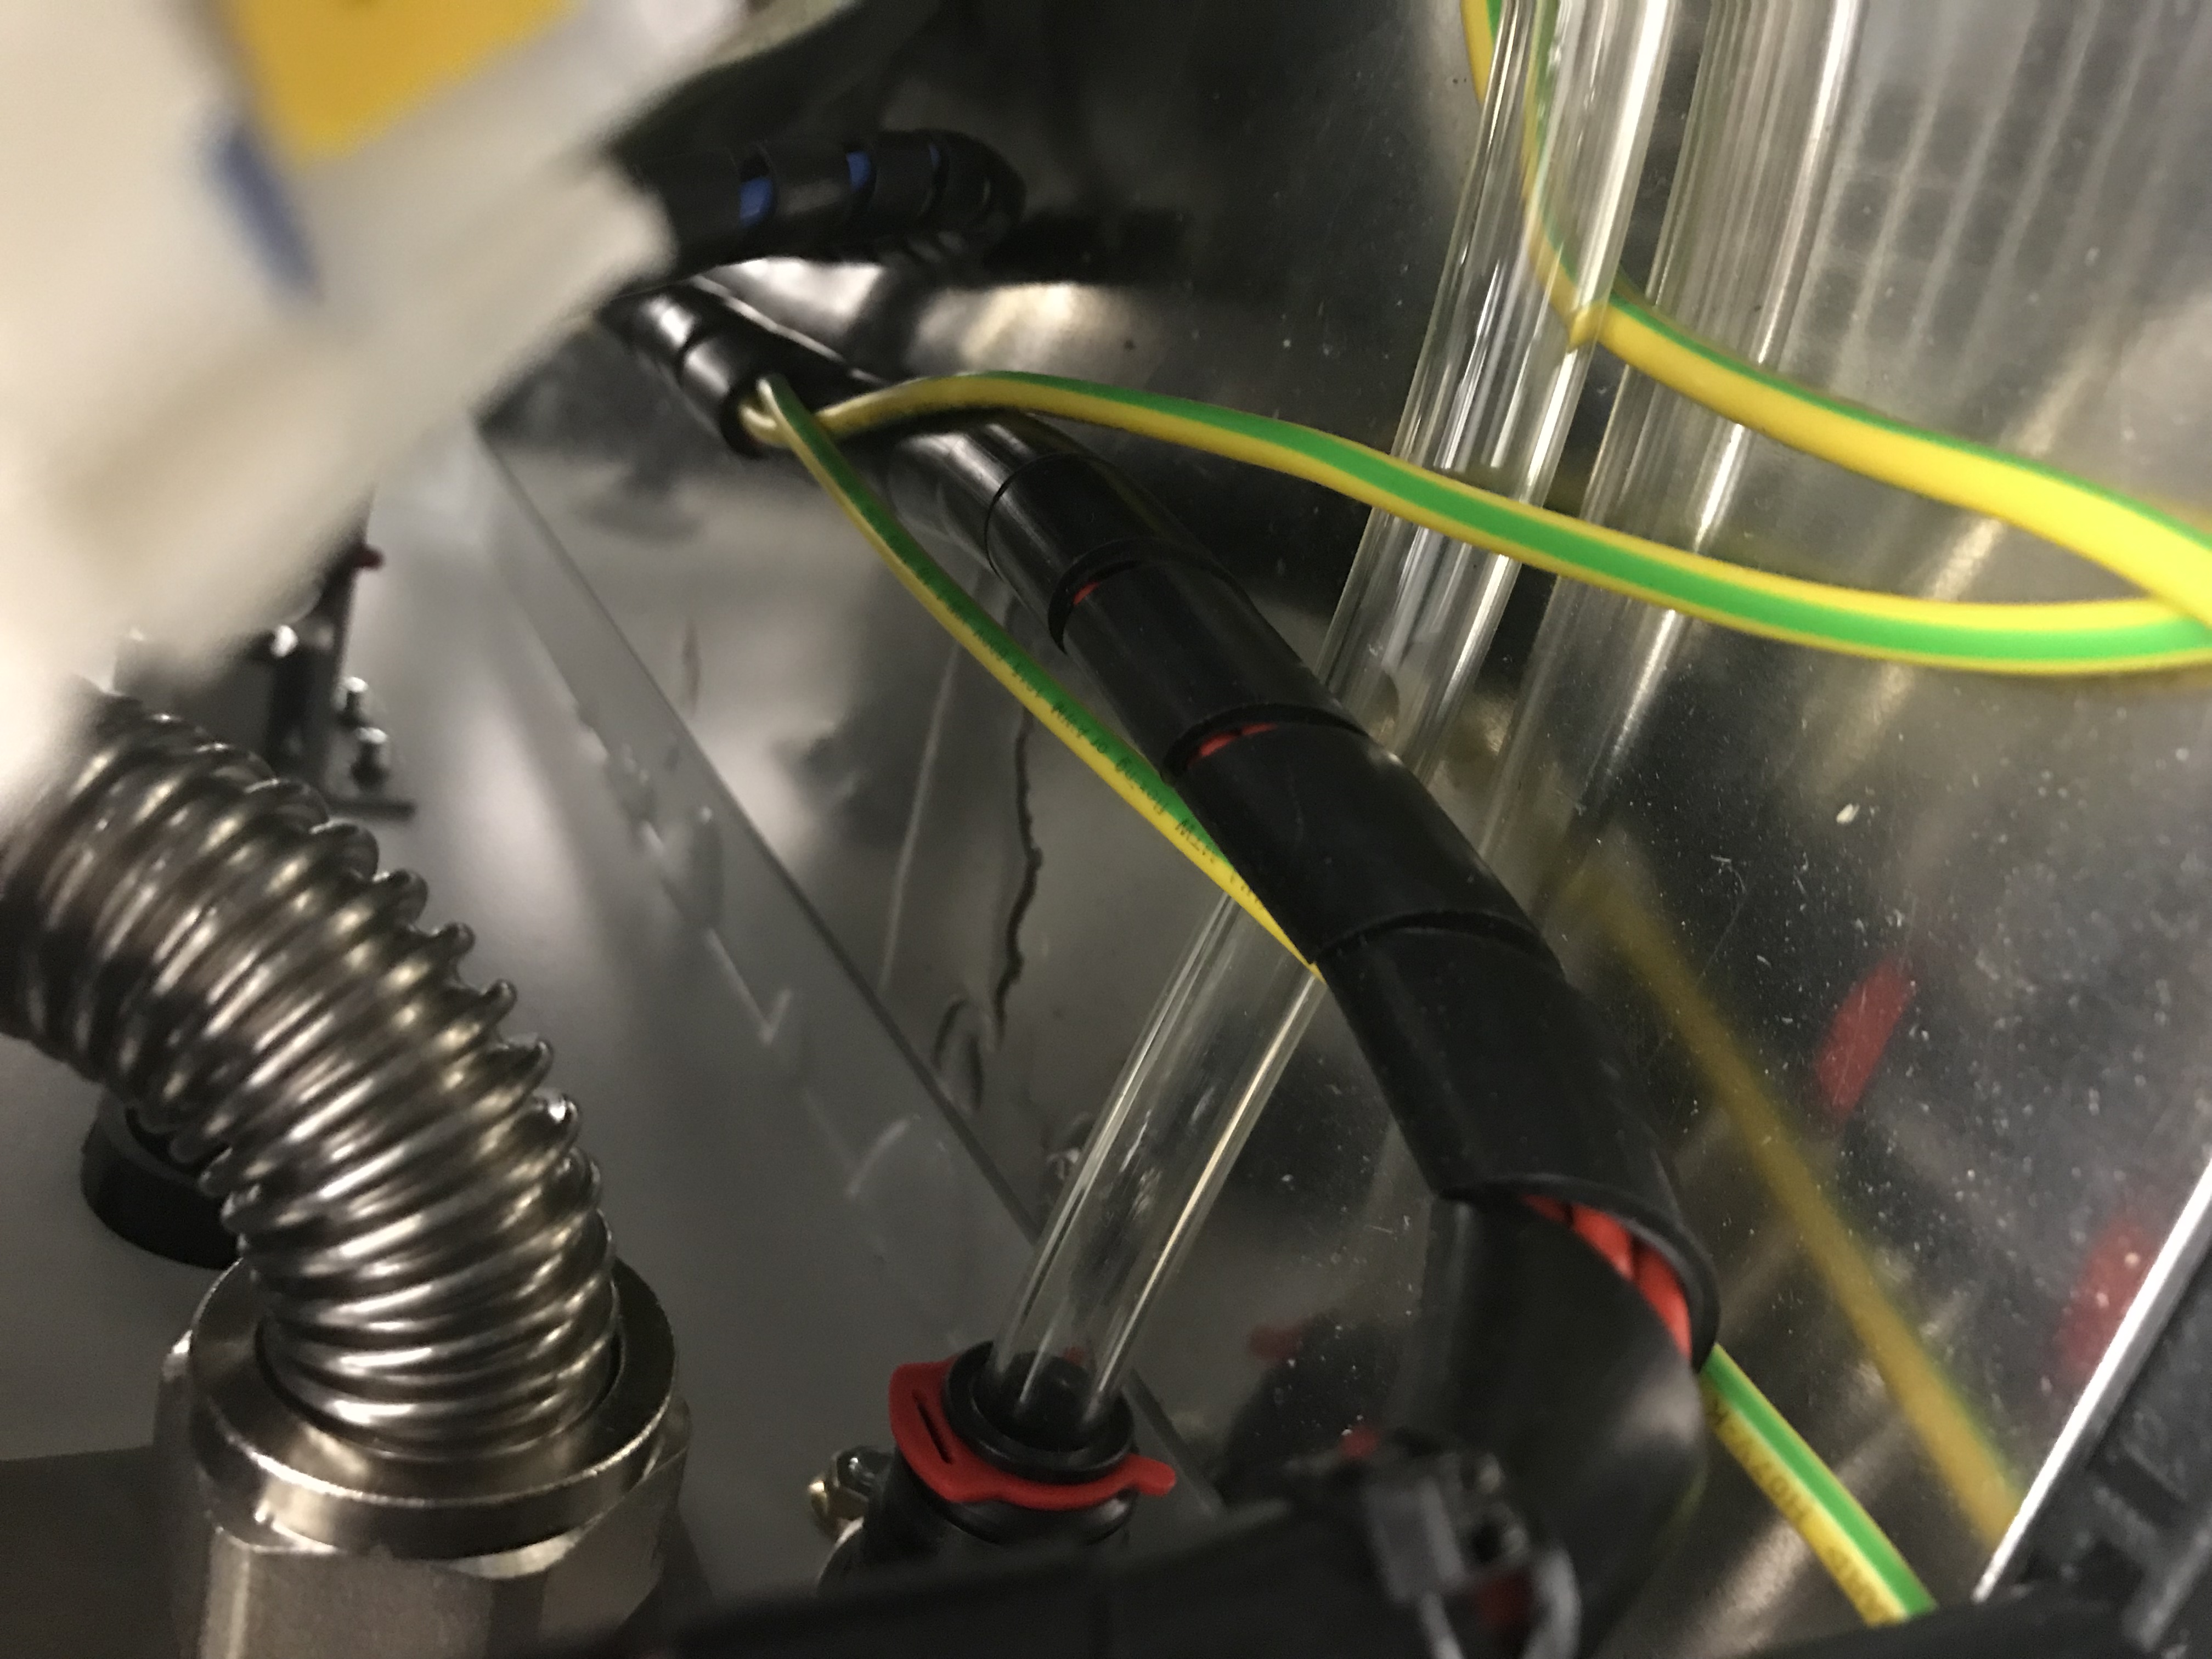
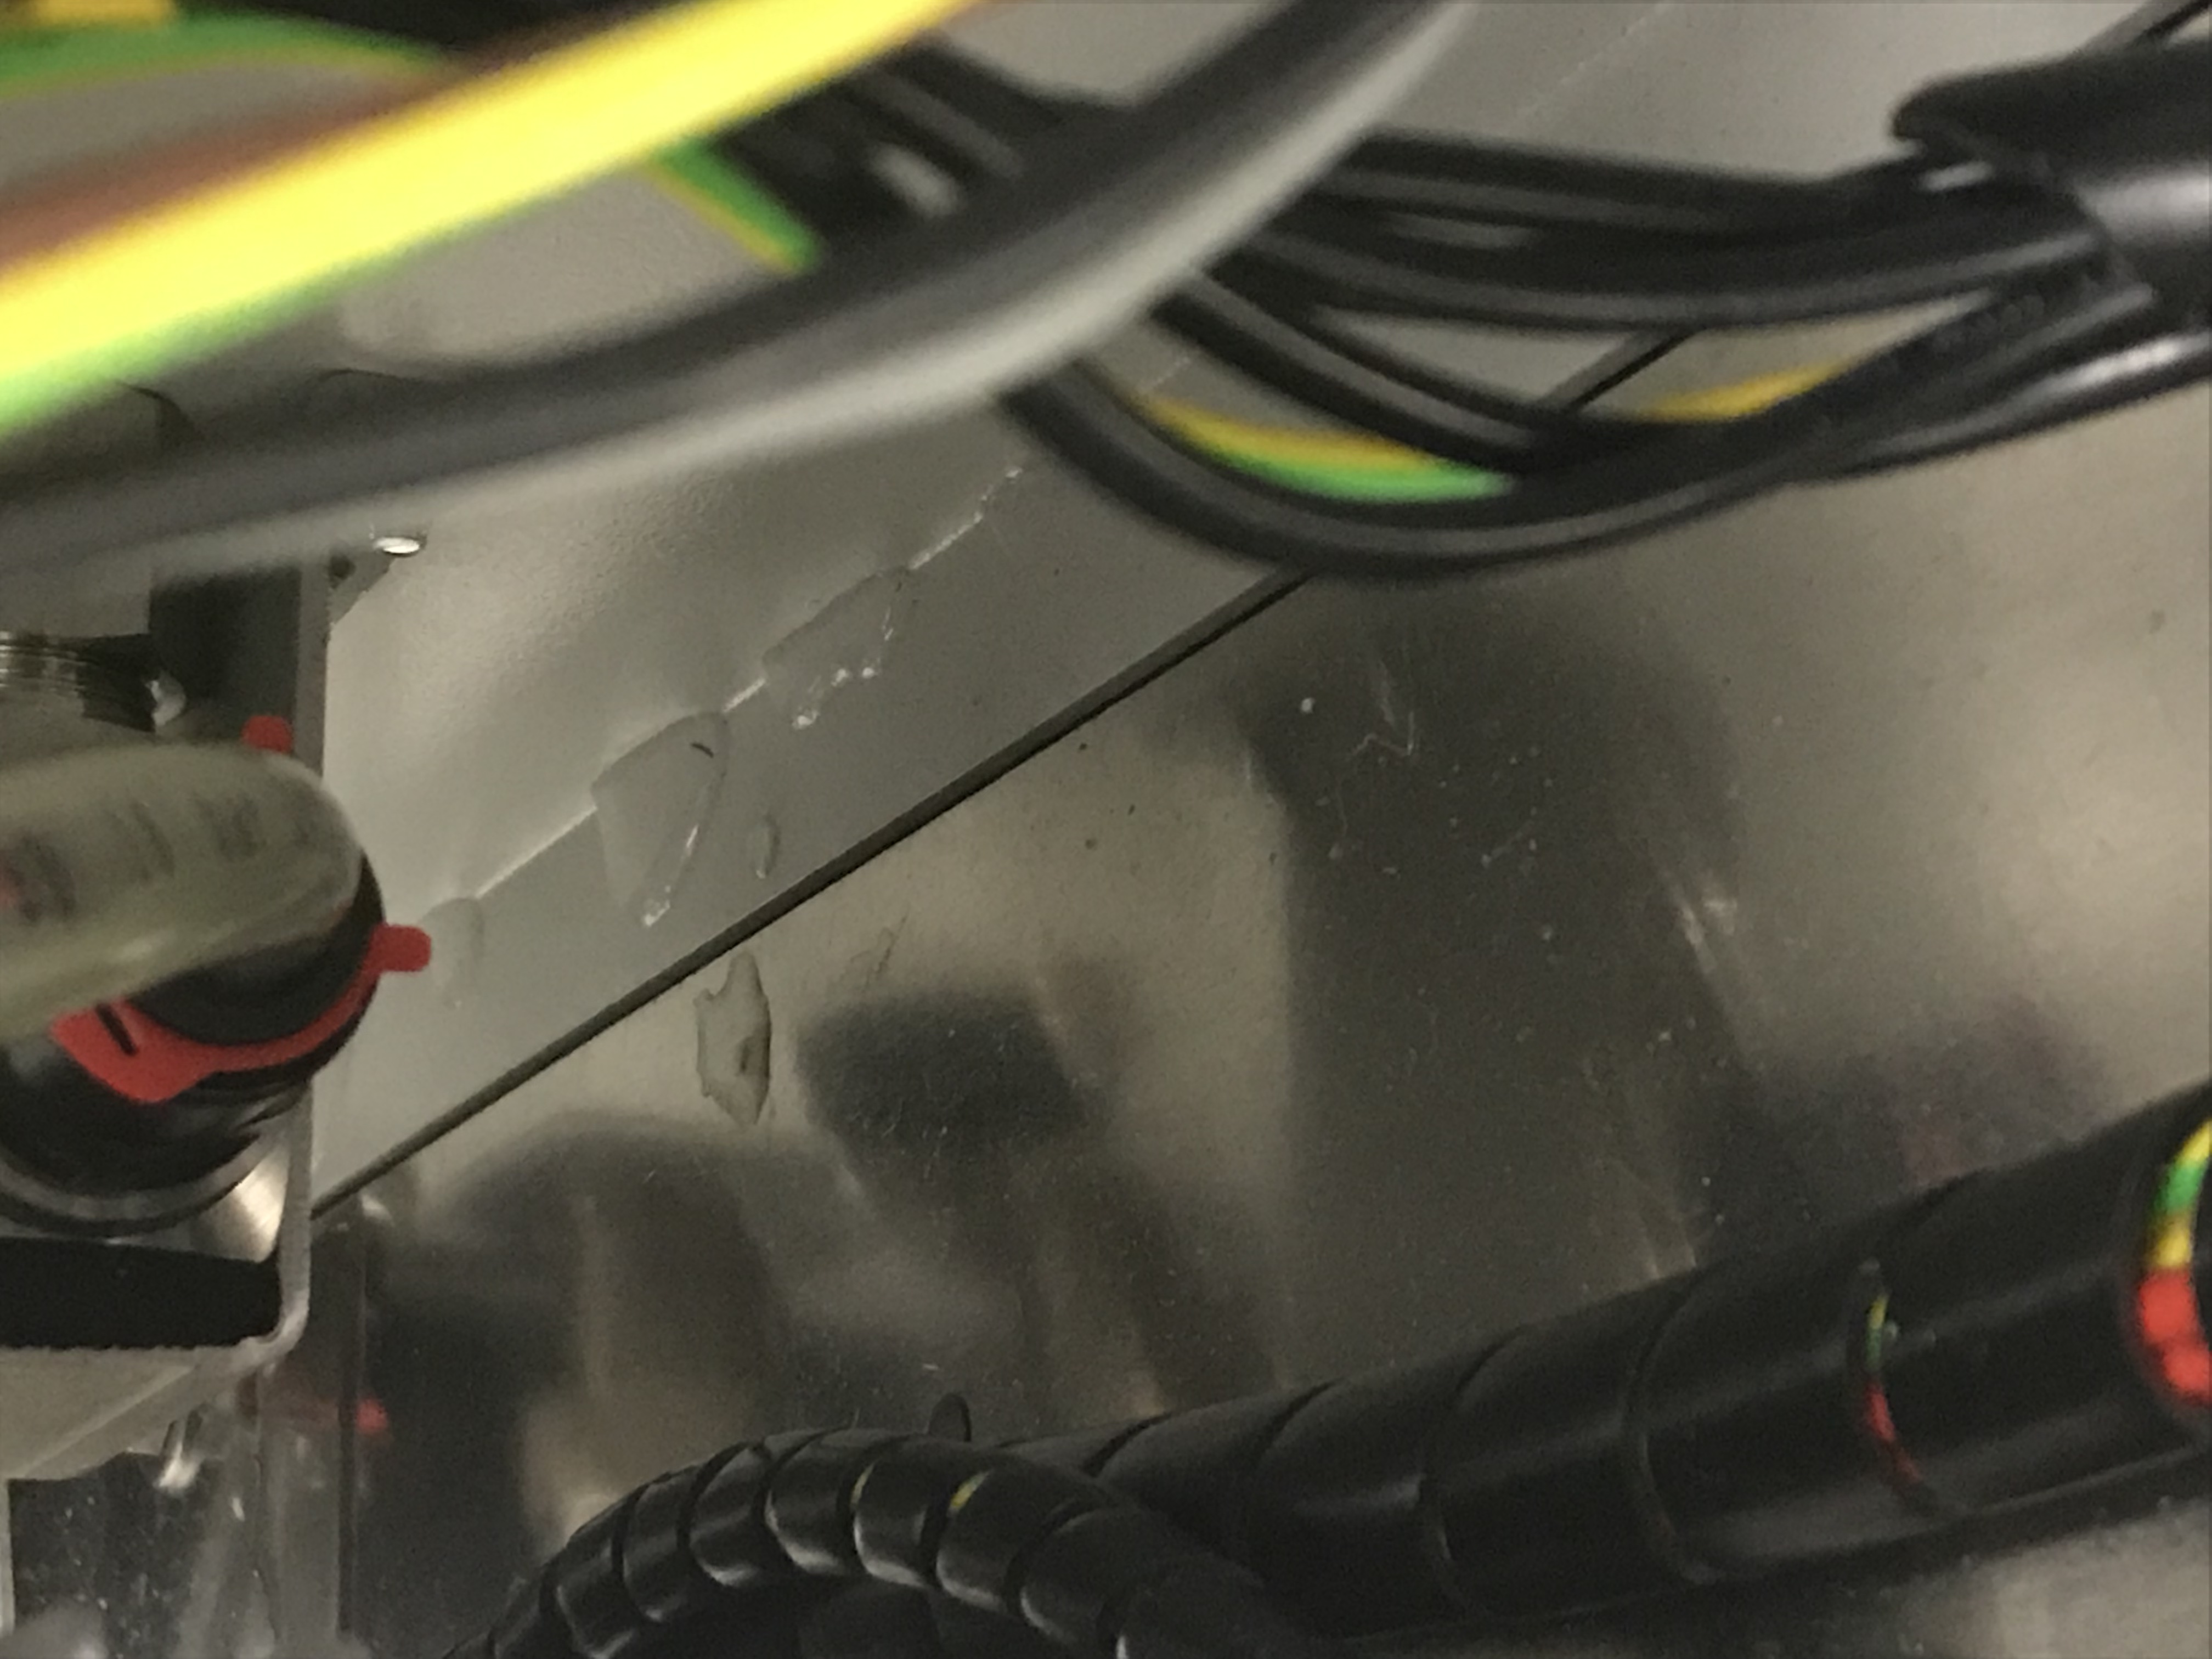
We saw some water on the floor about 1-2 cups of water. Some photos that show where the water was are attached. We wiped all the water up that was outside the chiller, but didn't reach in and around the cables to dry up inside the enclosure. The gray canvas in the back seems completely dry.
PeterK, RichardM, BubbaG, RickS
This morning, there were several attempts to diagnose the issues with the diode chiller that was swapped in yesterday (Peter on the phone with TechnoTrans reps.) and Peter tried swapping controllers. It appears that the Diode chiller needs a freon charge.
Bubba and Richard took the Cat frontloader to MidY to retrieve a chiller from the 3rd ifo. inventory and we swapped it in. Both the Diode and the Crystal chillers appear to be functioning normally. Note that we DID NOT swap the flow sensors over to the newer, vortex-style sensors.
The PSL is back up, servos are locked. Modecleaner is locked.
Note that all controllers are back in their original chillers except for the faulty controller for the Crystal chiller that was swapped in yesterday.
Nice work under tough circumstances, thanks all!
Anamaria, Arnaud
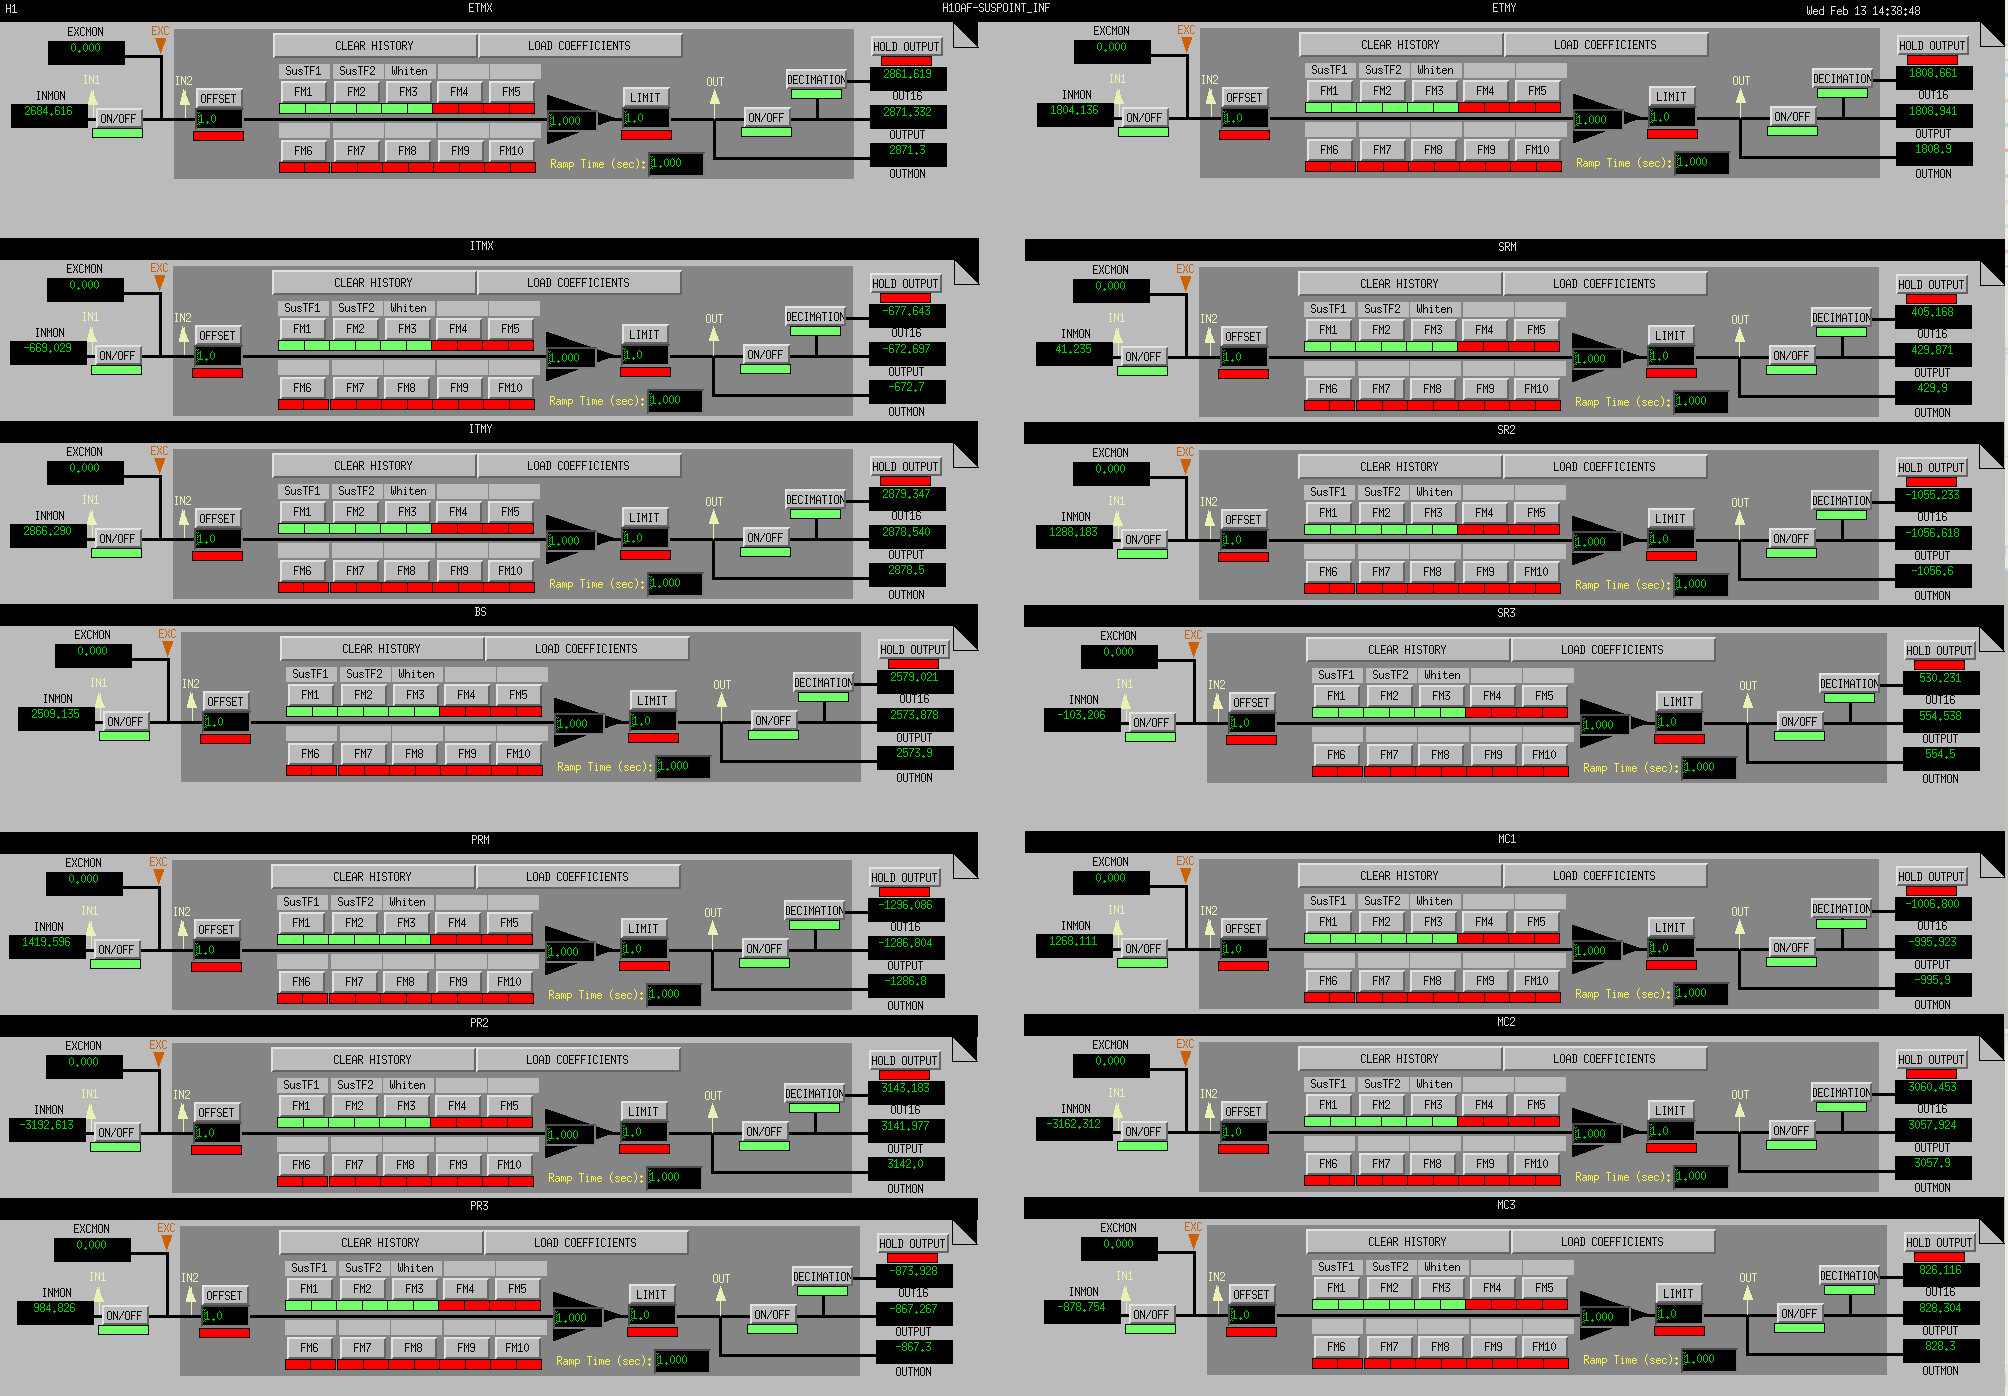
To be able to compare H1/L1 predicted cavity motion from the ISI sensors, we copied and loaded the suspension point to test mass projection filters for all suspensions in the SEIPROC model. Even though those tfs were generated with the LLO suspension damping filters (see here), they should be close enough to the LHO ones.
The laser was left off last night after tripping, as per Keita's alog entry. This morning the diode chiller outlet temperature was 30.7 degC, with a set point of 20.0 degC. This is a temperature reported by the chiller and is independent of the laser. The "new" diode chiller does not display an error message, unlike the unit that was switched out. Why the outlet temperature should be so high for two different units is a bit of a mystery to me. The little cartoon on the controller says 64%, which is some indication of how hard something in the chiller is working (just what exactly I need to read the manual to find out).
Has any attempt been made to change the diode chiller controller? This solved a similar issue at LLO last week (chiller cooling water up near 30 °C causing DB overtemp errors and shutting the laser down).
Entered FRS ticket 12318 to track this.
Swappimg controllers did not work.
TJ, TVo, Danny
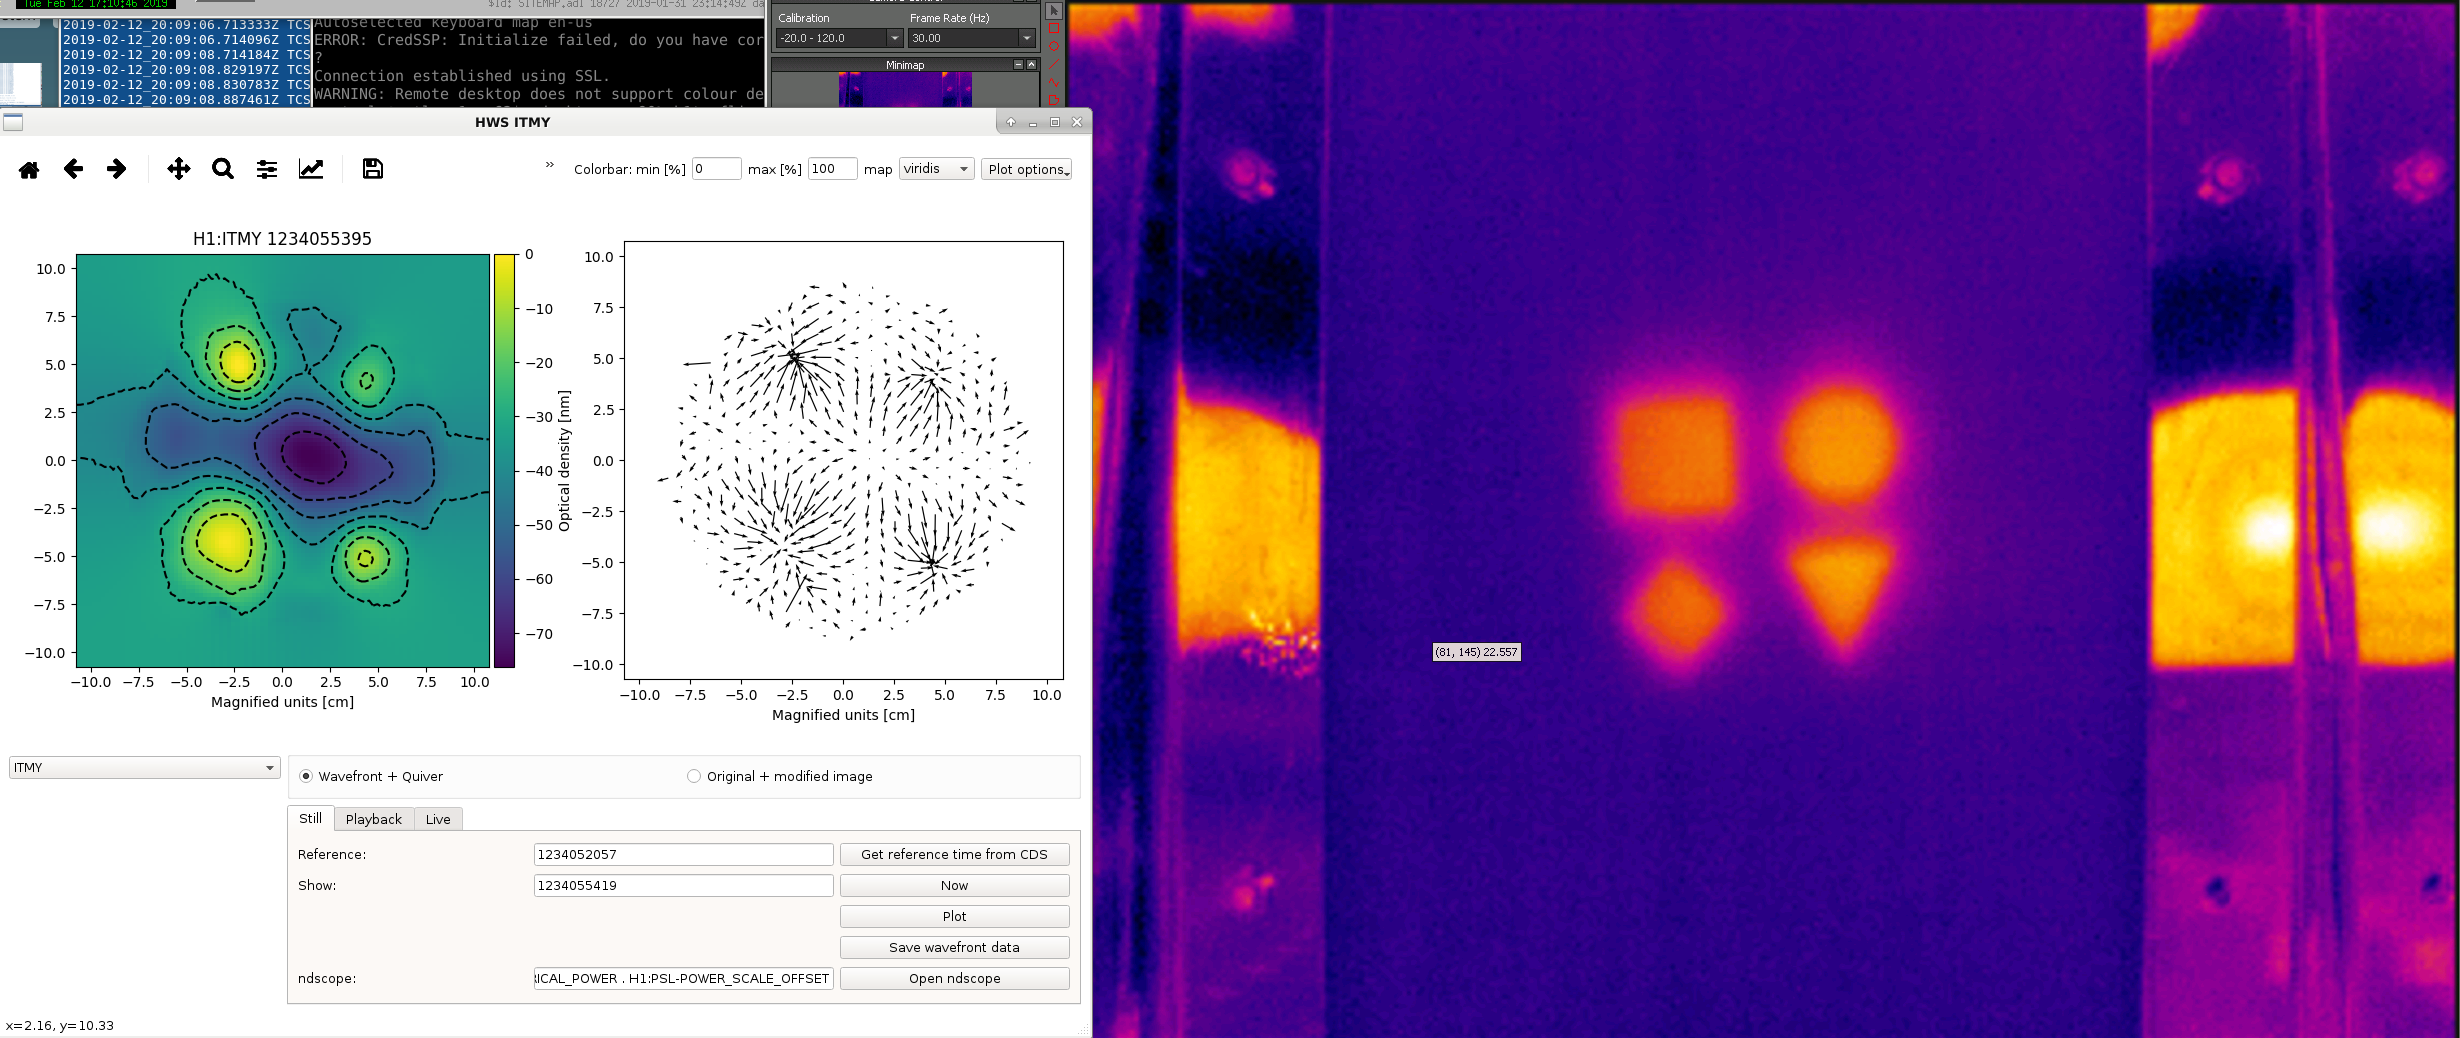
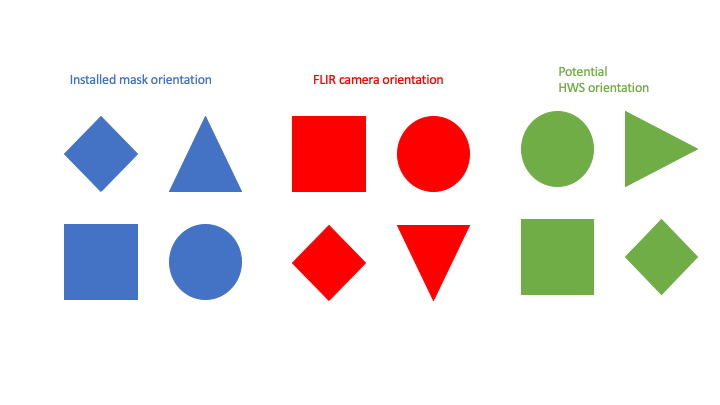
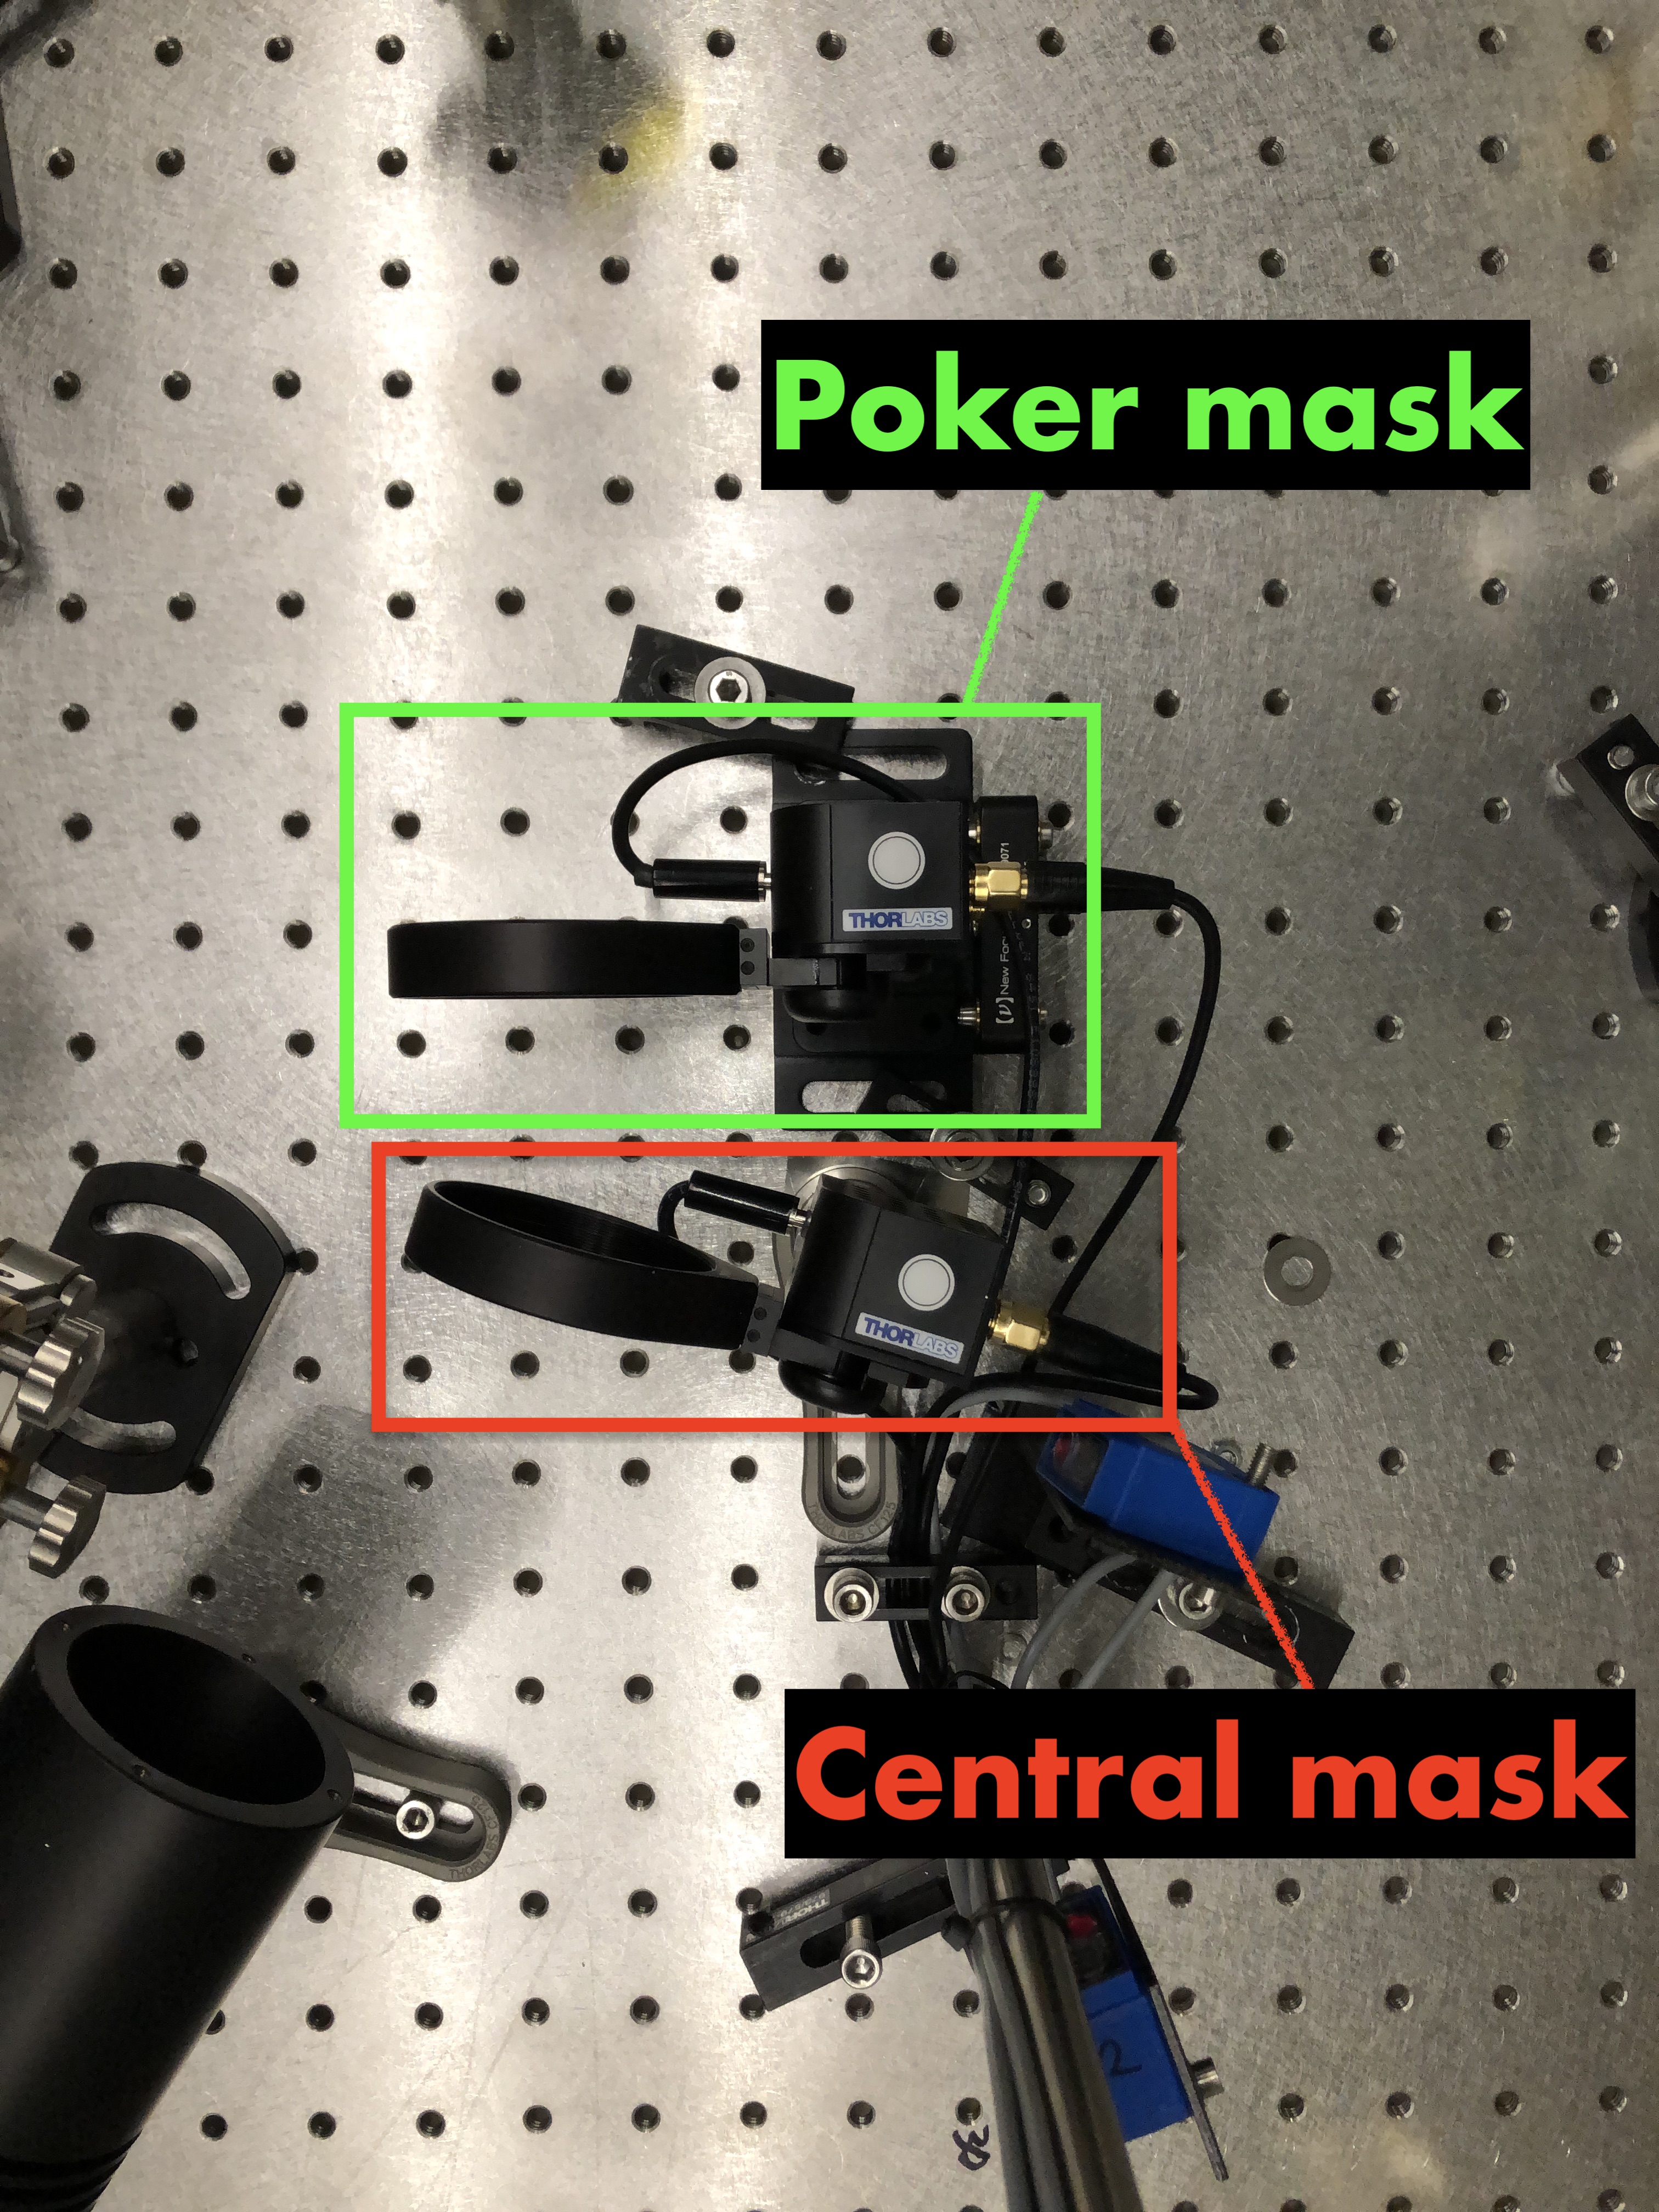
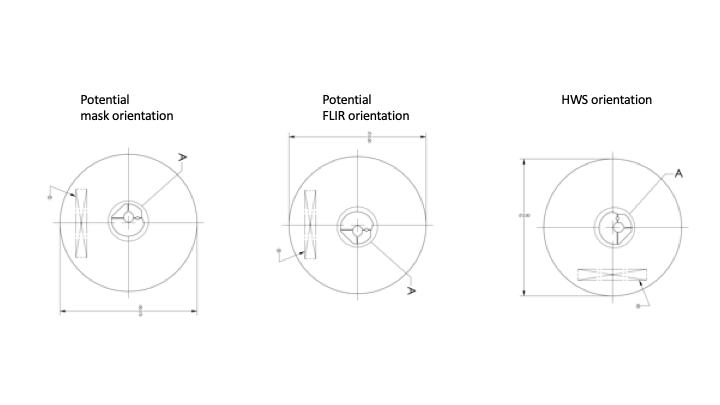
| Poker mask | FLIR | HWS |
|---|---|---|
| Up | Down | Right |
| Left | Left | Down |
| Down | Up | Left |
| Right | Right |
Up |
I had a look at the data from yesterday. I had expected to see features as sharp as previously measured: 14714 (and reproduced here). The reality is a lot more thermal diffusion of the features over the time-scale of the measurement. Using a shorter time-scale turns out not to work because the SNR of the HWS isn't large enough on the scale of the measurement
There are two possible fixes to this:

Ideally, we'd compare HWS measurements after one or two minutes rather than 60 to see the poker mask.
I tried adding the poker heat load map to a compensation plate in COMSOL to see what the induced optical depth change might be like. First plot shows the steady state solution for OPD, second the heat map I applied to the surface, scaling of OPD will be way off as I just guessed intensities. In order of OPD depth you'd probably see on the HWS largest to smallest: square, circle, triangle, diamond. So looks like your fourth plot is probably correct!
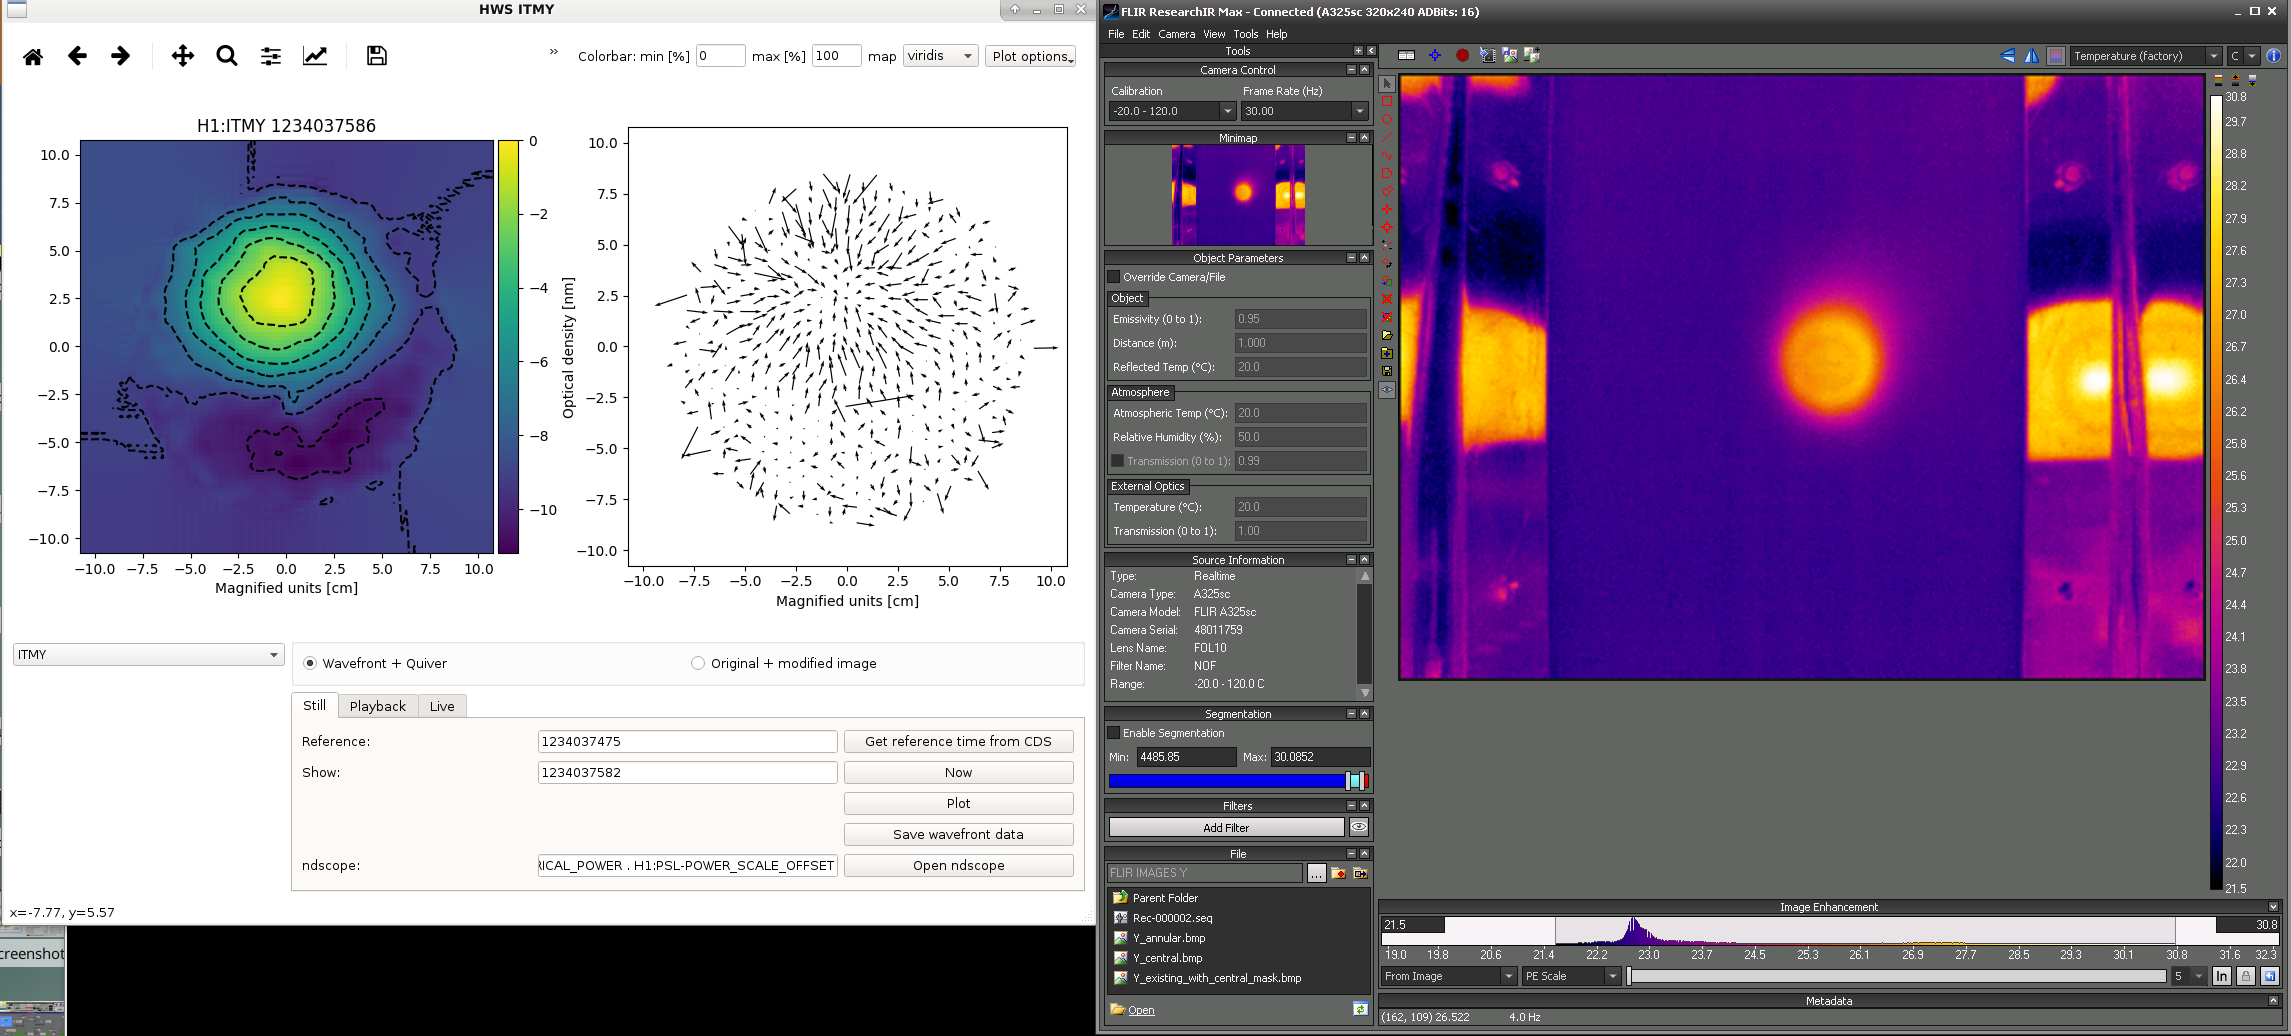
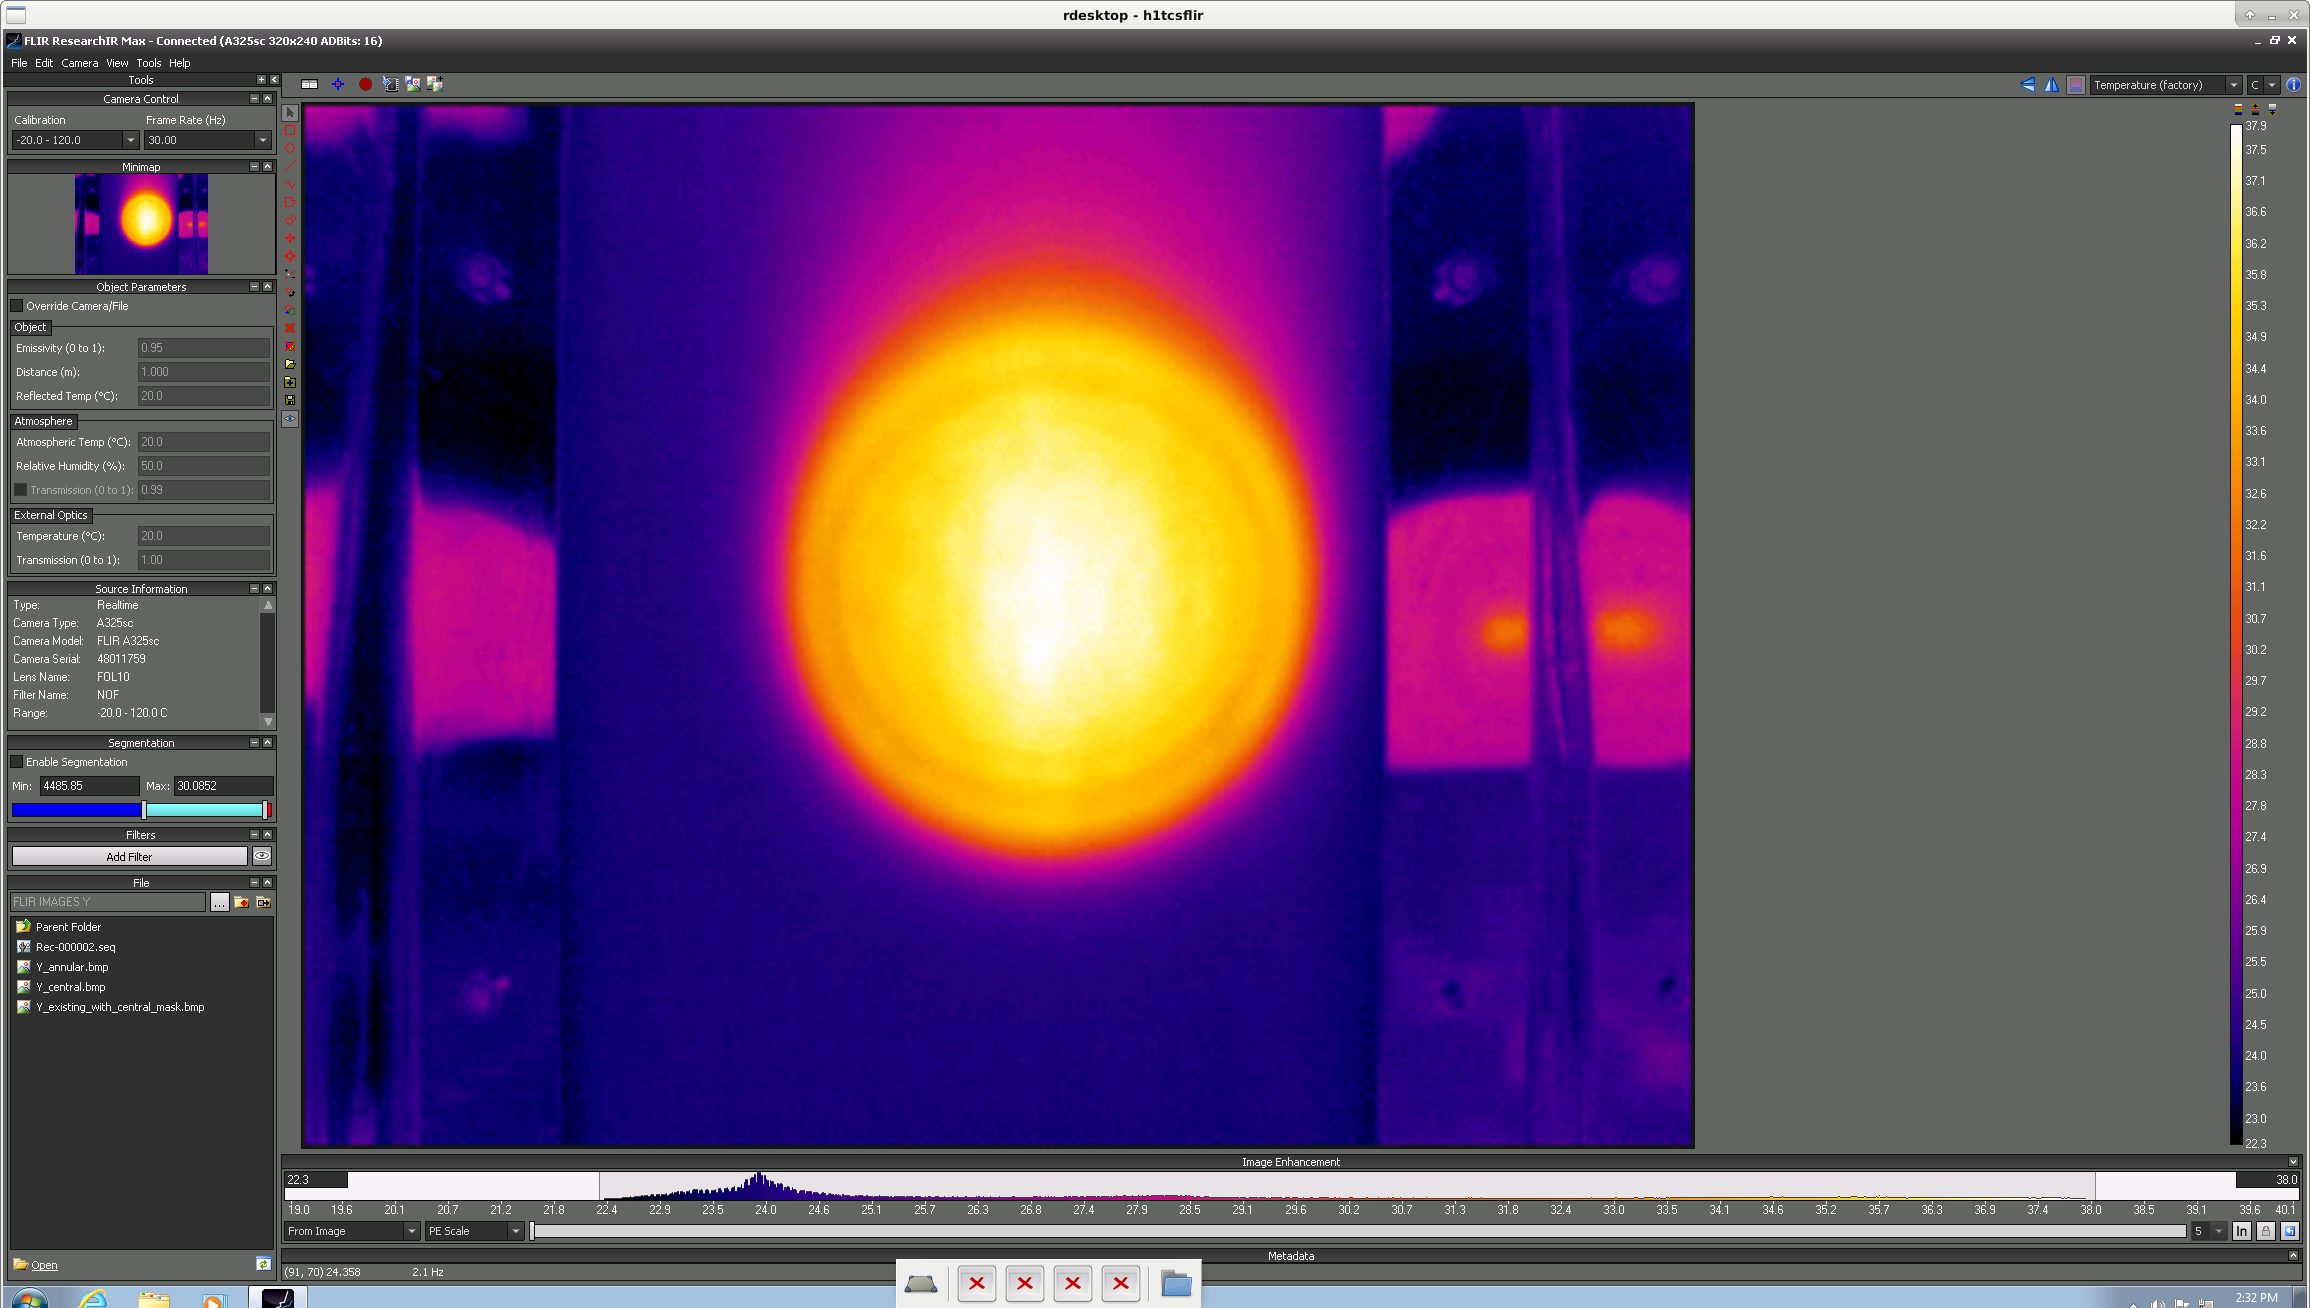
I overlaid the FLIR images of the central heating iris and the poker card. Then I found the center of the heat pattern and thermal lens of the central heating and circled that heat distribution and thermal lens on the poker card images. The upper left of the thermal lens image corresponds to the upper right of the FLIR image. Coupled with the large thermal lens in the lower left of the thermal lens image, this supports the hypothesis that the HWS image is the FLIR image rotated by 90 degrees counter-clockwise.

Correction on the fifth figure attached to this log post: The FLIR orientation and the mask orientation should be switched. Attached is a png with the correct orientations.
[Rana, Jamie]
We spent the evening trying to get more measurements of the 9MHz RIN situation, basically redoing what was done in LHO log 46586. We went to ITMY single-bounce and locked OMC on carrier, then went to PRMI and locked OMC on 9MHz. I'll post plots tomorrow.
FYI the OMC and PRMI configurations might be a little bit funky. We didn't get to reset everything yet to get back to low noise, just in case any one tries to brave the snow to get back out here.
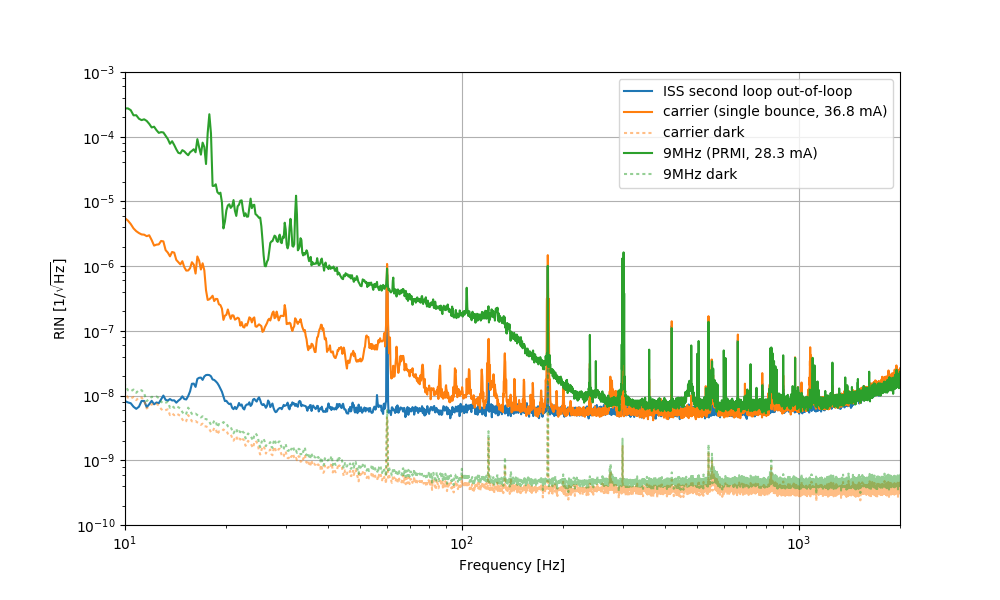
Friday night Rana and I re-measured the relative intensity noise (RIN) in the carrier and 9MHz sideband at the OMC DCPD. We believe we got a lower noise measurement (first attachment) than what Craig and Koji measured previously (LHO 46586) by:
For the carrier measurement used single bounce off of ITMX with 25W input, and for the 9MHz used PRMI (where the 9MHz sideband is largest) with 35W input.
We don't see any excess RIN in the 9MHz above 300 Hz.
1233733816 carrier measurement 1233738050 9MHz measurement 1233738400 dark noise measurement
1) the carrier RIN in your plot at 30 Hz is in the 1e-7 region. Do we believe this excess above the ISS second loop measurement and above the noise floor? Or is it OMC length noise?
I’m asking because a RIN of 2e-7 is what we need to be limiting DARM, see https://alog.ligo-wa.caltech.edu/aLOG/index.php?callRep=46759
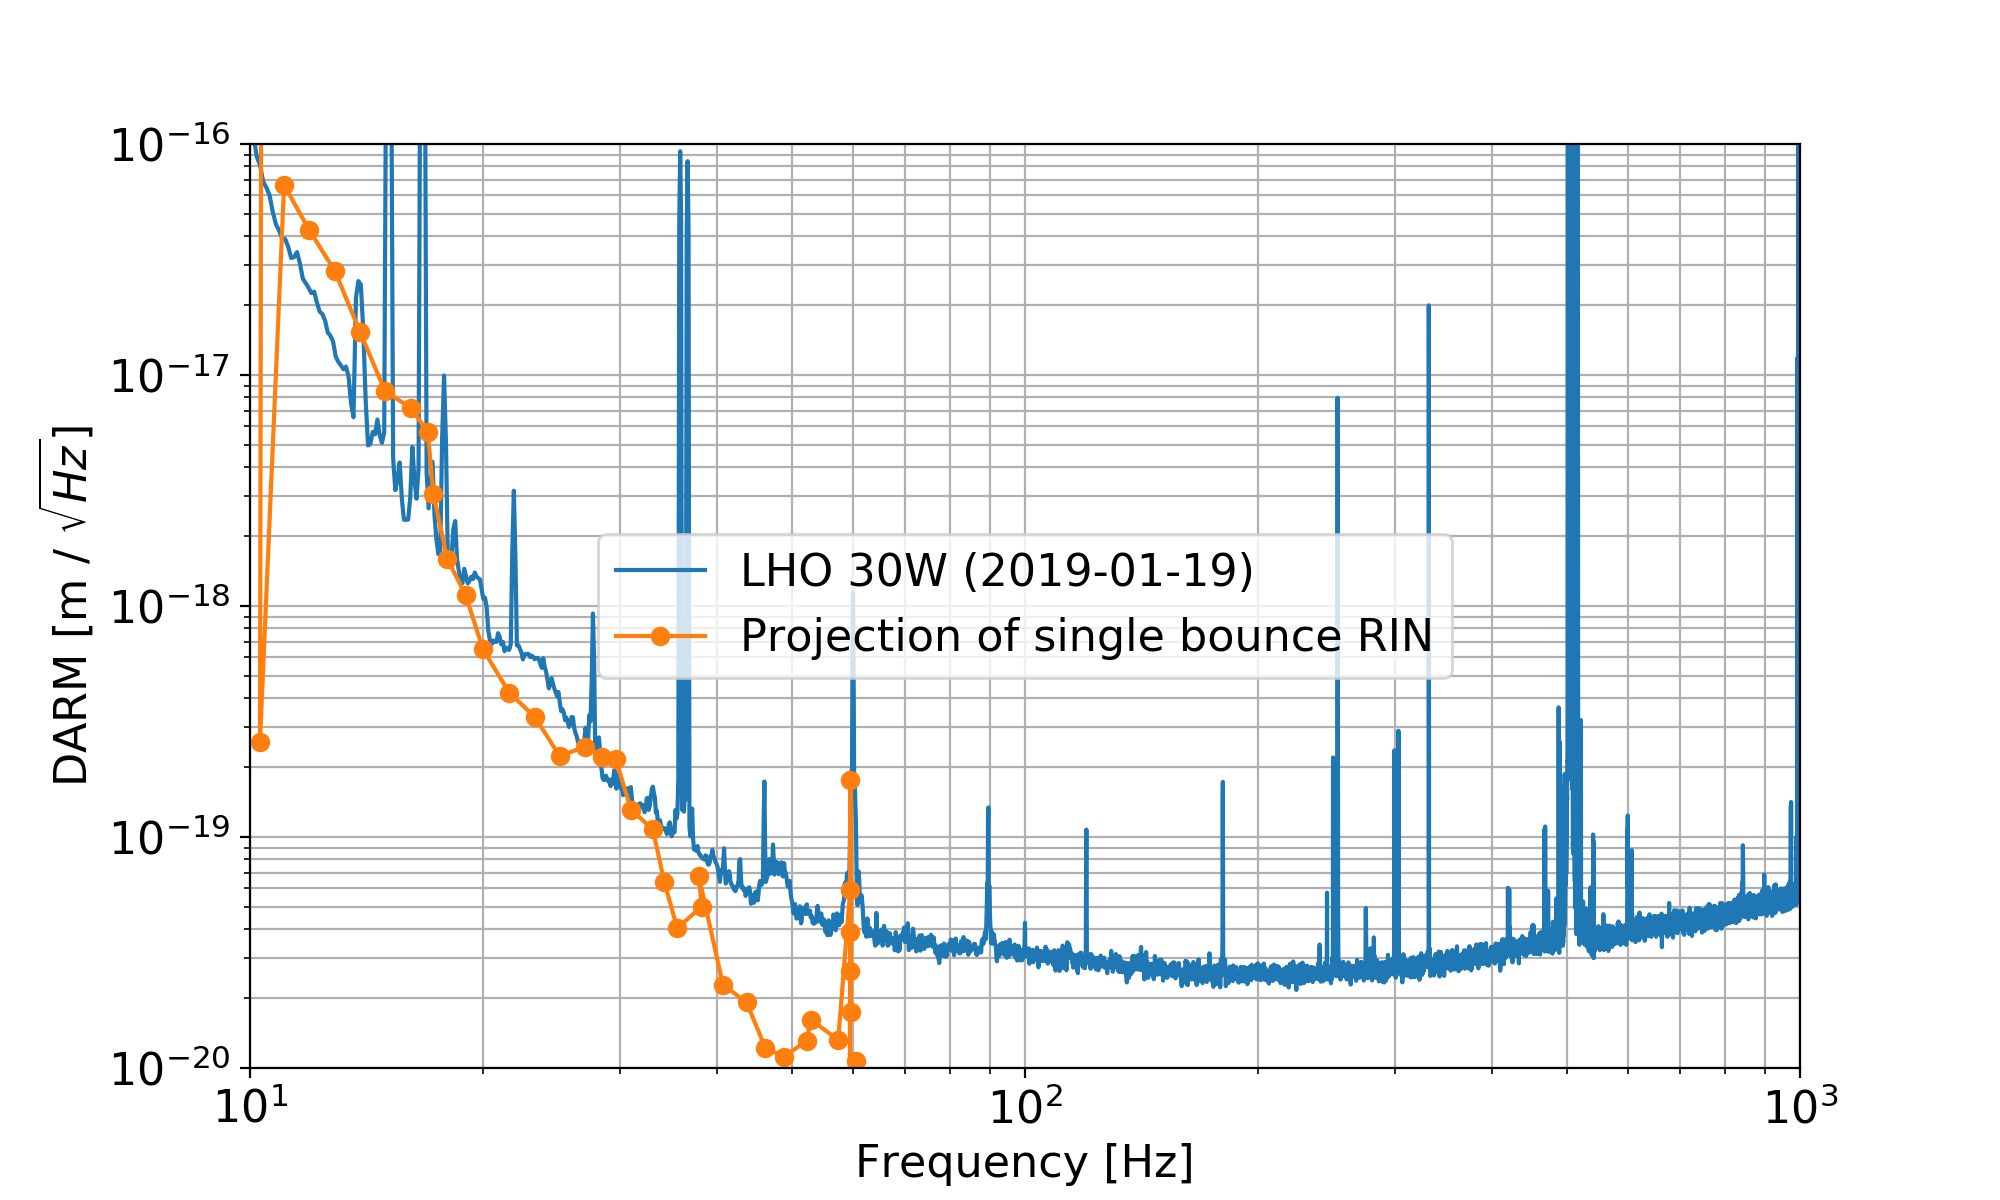
If we believe the carrier single bounce RIN measured by Jamie and Rana, and use the radiation pressure intensity noise coupling (based on 8% power imbalance and matching Craig's measurement in 46817), we get something pretty close to the DARM noise:
2) same question for the excess SB RIN? Is that PRMI control noise?
For 35W input power, the ISS inner PD shows 27.3mA, whereas the outer shows 29.7mA.
Note I think it's possible that we were looking at the 45MHz sideband in the PRMI lock, rather than the 9MHz sideband. We will attempt to retake this measurement once the IFO is recovered.
it seems that the OMC length lock is not strong enough to measure low RIN - this is why the increase of the OMC length dither decreases the RIN.
Most of the low frequency peaks are due to acoustics - we were using the QPDs for OMC-ASC instead of angular dither.
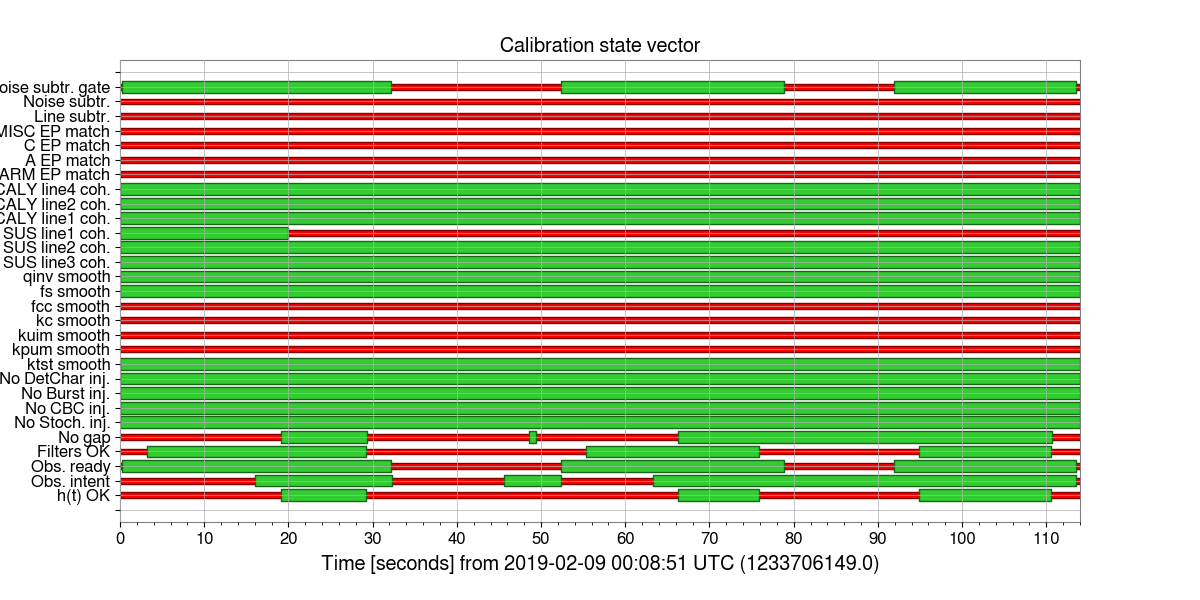
We are about to conduct a test of the H1 OBSERVATION bit behavior (see lho elog 46812). The following bits will be flipped during this test:
Will respond to this log when the test is complete.
This test is now complete. Times of bit flips will be posted soon.
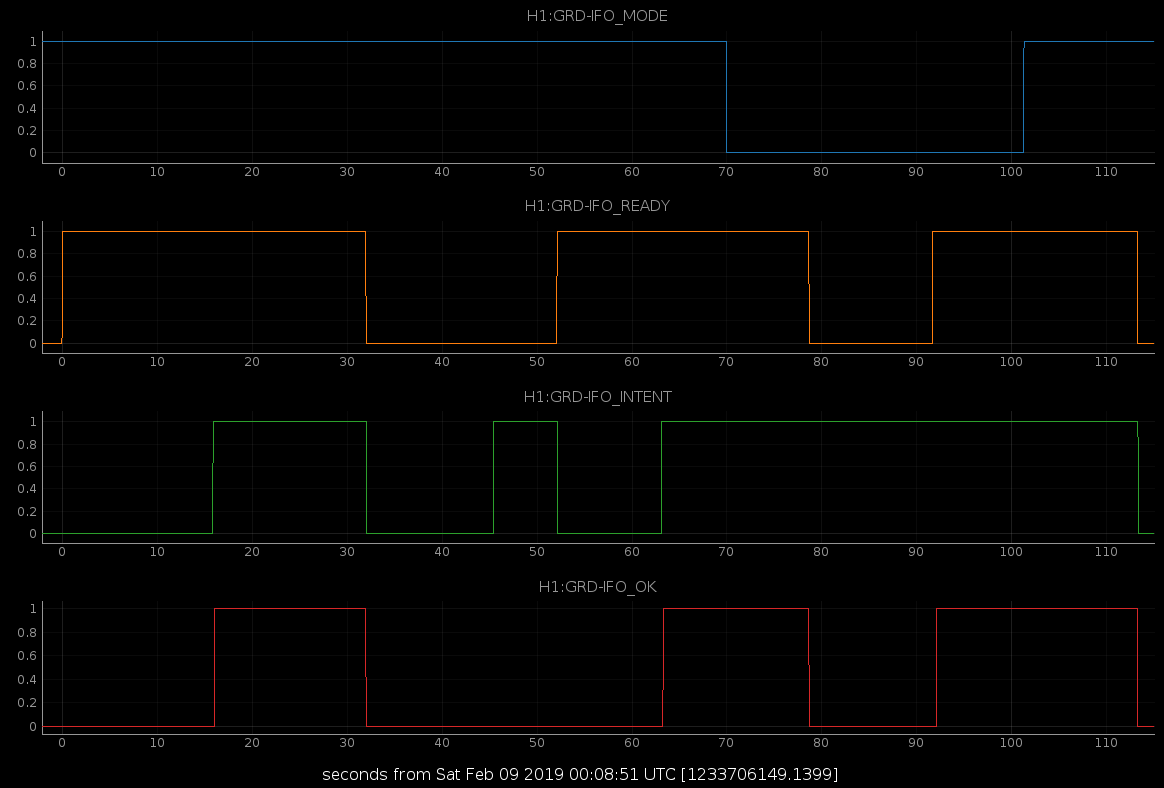
Test began at roughly 11233706149. IFO top node set to monitor a single TEST node used as a proxy for the entire system. Initial values:
Time sequence is as follows:

The GDS-CALIB_STATE_VECTOR did catch transitions, but we're off by 1-4 clock cycles on each of the transitions. The relevant bits in the attached plot are Obs. ready, which corresponds to the READY state obtained from the GRD-IFO_READY channel and Obs. intent, which corresponds to the INTENT state obtained from the GRD-IFO_INTENT channel. The first READY transition gets picked up by CALIB_STATE_VECTOR 1 clock cycle late and all future READY transitions are 3 clock cycles late. All transitions from INTENT=0 to INTENT=1 are 3 clock cycles late (I think, but see question in purple below), and all transitions from INTENT=1 to INTENT=0 are 4 clock cycles late.
Summary of relevant transitions from Guardian and how CALIB_STATE_VECTOR picked it up:
Maddie, this was my fault, being both imprecise and looking at the leading edge of the transitions instead of when theey land on the value shown. I've gone through with a finer toothed comb and updated the values to their precise values as recorded by the DAC (I also fixed the T0 GPS time, which accidentally had an additional digit):
I think this accounts for all the discrepancies that Maddie saw. Apologies, Maddie.
R. Abbott, J. Kissel
Rich and I measured detailed transfer functions of SUS ETMX's driver electronics today. More details to come, but we were at EX measuring from about 11a to 6p with things disconnected, the SUS ETMX guardian in SAFE, and the SEI chamber guardian in DAMPED. All driver electronics (and associated cabling) suspensions, platforms, and guardians have been restored to nominal functionality.
The raw data can be found here:
/ligo/svncommon/CalSVN/aligocalibration/trunk/Common/Electronics/H1/Data/SUSElectronics/ETMX/
UIM/2019-02-03/
PUM/2019-02-03/
TST/2019-02-03/
The file names are only labeled by date, so the key to translate the filenames into useful quadrant / coil and switch state information is found in the measurement notes in each directory,
/ligo/svncommon/CalSVN/aligocalibration/trunk/Common/Electronics/H1/Data/SUSElectronics/ETMX/
UIM/2019-02-03/2019-02-03_UIMdriver_measurementnotes.txt
PUM/2019-02-03/2019-02-03_PUMdriver_measurementnotes.txt
TST/2019-02-03/2019-02-03_ESDLVDriver_measurementnotes.txt
Here's the analog electronics measurement setups for this data. This time (unlike the 2016 attempt; see the last page of LHO:24725), we tried to cut corners by only driving the coil drivers with single-ended input directly from the SR785 -- so we can avoid having to characterize the details of the differential driver box that has been used previously. This failed, causing (what we believe to be saturations) of the coil driver electronics and wonky unphysical transfer functions. This is especially evident with the PUM driver's switchable "acquire" circuits engaged, and in the UIM driver after the second and third low-pass filters are in engaged. Finally, comparing against measurements taken with the coil driver monitor circuits (LHO:46854) it's dreadfully obvious. More investigation is required as to what's going on, but sadly those investigations take time that we don't have. I'm proceeding with attempting to fit a combination of the un-spoiled SR785 data and the less-complete-and-more-complicated monitor circuit data taken with DTT (again, LHO:46854). The ESD driver measurements (at least) appear to be good enough to move forward, as indicated by the table of results above.
Using the data from Jeff and Rich's measurements, I have fitted the ESD driver electronics. However, I ran into problems when trying to fit the PUM and UIM measurements. The raw output of the transfer function measurements looks unfamiliar to previous measurements and has puzzled Jeff and Rich when I showed it to them. 1) Summary plots from ESD driver measurements and fits 2) Puzzling PUM driver measurements 3) Puzzling UIM driver measurements Scripts for analysis of the data is located at: $CALSVN/trunk/Common/Electronics/H1/Scripts/model_ETMX_*_20190203.m and plots are found at: $CALSVN/trunk/Common/Electronics/H1/Results/SUSElectronics/ETMX/[UIM,PUM,TST]/2019-02-03/ The fit results for the ETMX ESD driver electronics is given below. Quadrant Low pass [z;p] (Hz) Summing node [z;p] (Hz) ----------------------------------------------------------------------------------------------------------------------- UL [13.871+/-0.721, 15.668+/-0.748; 2.186, 2.186] [129.736e3+/-2.818e3; 3.213e3+/-15.78, 31.549e3+/-381.9] LL [13.666+/-0.817, 15.570+/-0.850; 2.163, 2.163] [90.736e3+/-694; 3.177e3+/-7.088, 26.699e3+/-145.6] UR [14.9049, 14.9054; 2.2222, 2.2223] [93.521e3+/-729; 3.279e3+/-7.534, 26.617e3+/-146.2] LR [13.335+/-0.486, 15.861+/-0.513; 2.157, 2.157] [131.520e3+/-2.867; 3.238e3+/-15.9, 31.618e3+/-380.8] Note above that the UR quadrant fit looked odd when looking purely at magnitude residuals. We saw that there was about a 1% offset in the band of primary interest (1 Hz - 1 kHz) above ~30 Hz which we attribute to the fact that LISO is attempting to minimize the fit error on both magnitude and phase simultaneously. When fitting purely on magnitude, the discrepancy is greatly reduced, at the cost of a slightly larger wiggle on the phase error (still less than a degree). These have not yet been installed into the SUS output filter banks, but should be done so at the next opportunity. We will ruminate on the PUM and UIM measurements and attempt to repeat these, again, at the next opportunity.