Displaying reports 43441-43460 of 88617.Go to page Start 2169 2170 2171 2172 2173 2174 2175 2176 2177 End
Reports until 09:32, Tuesday 22 January 2019
H1 PSL
edmond.merilh@LIGO.ORG - posted 09:32, Tuesday 22 January 2019 - last comment - 09:52, Tuesday 22 January 2019(46564)
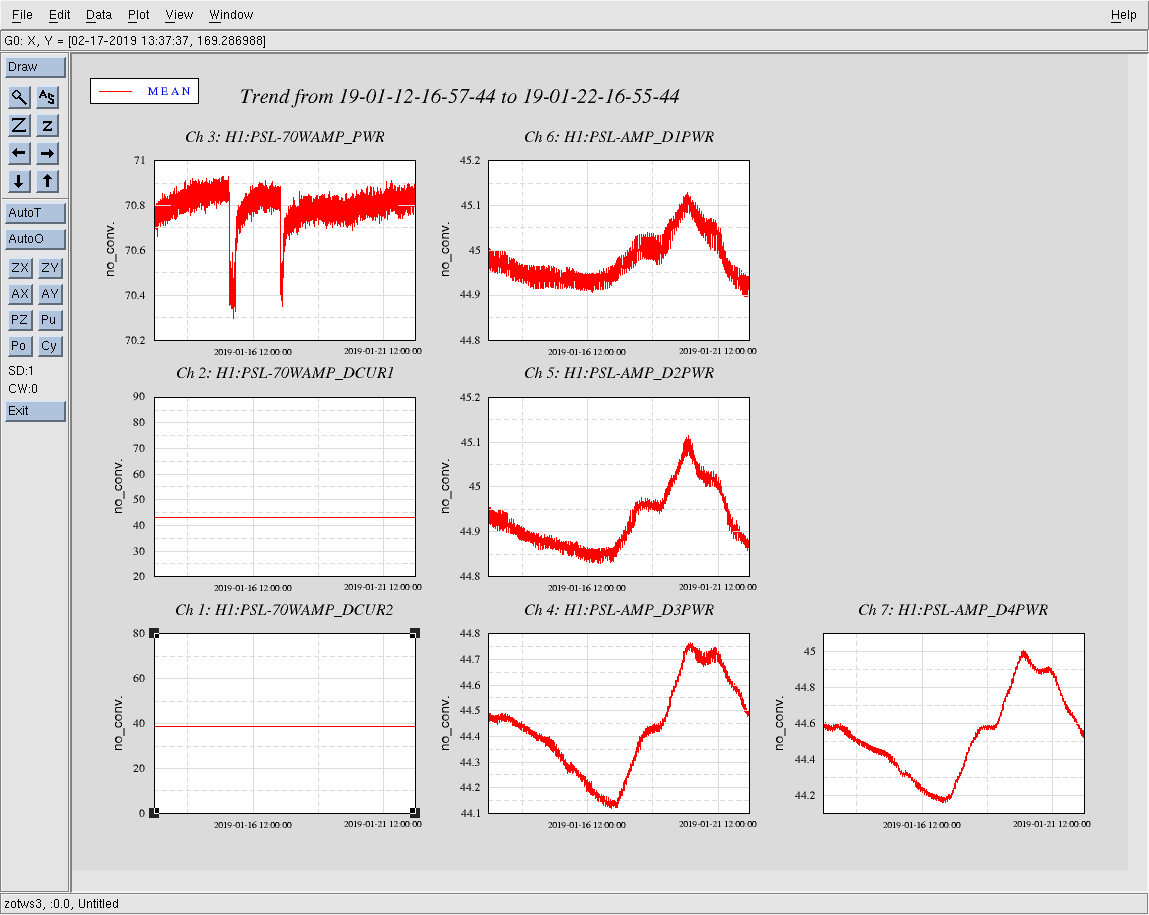
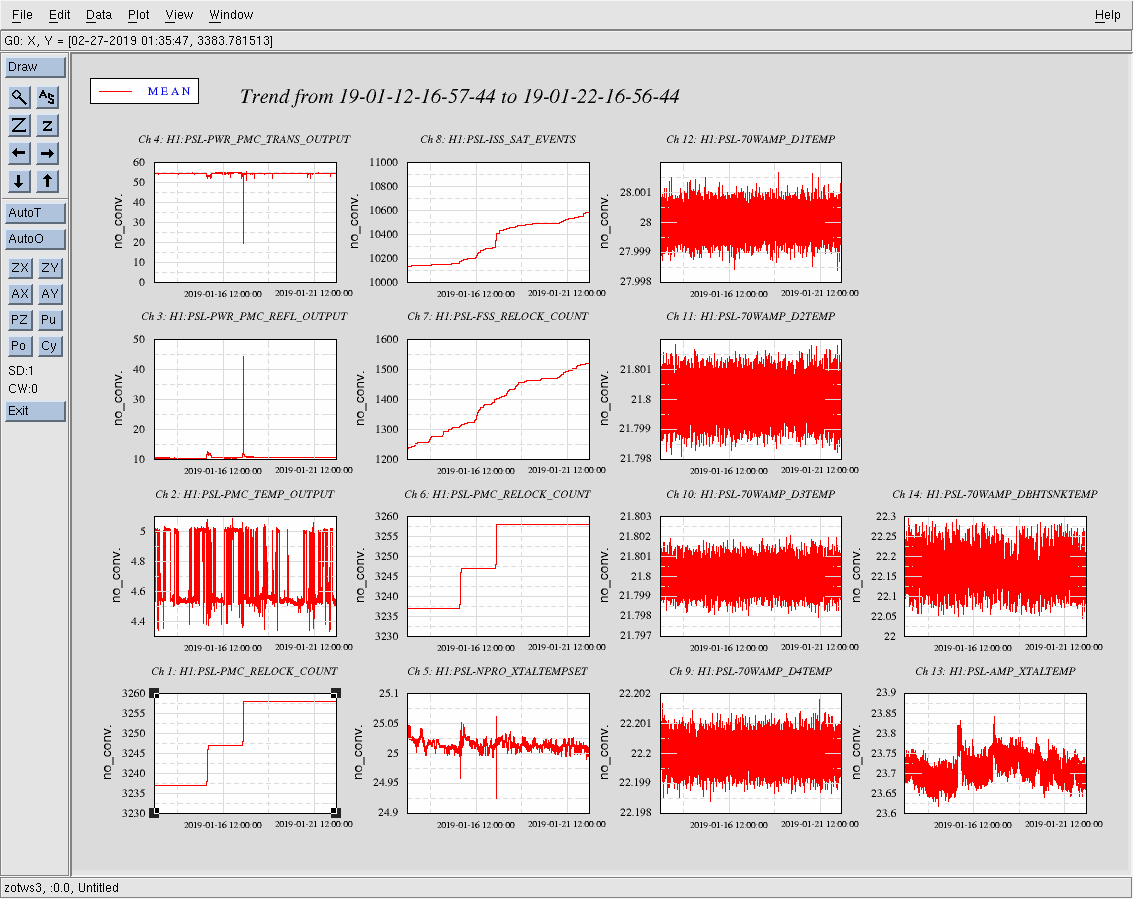
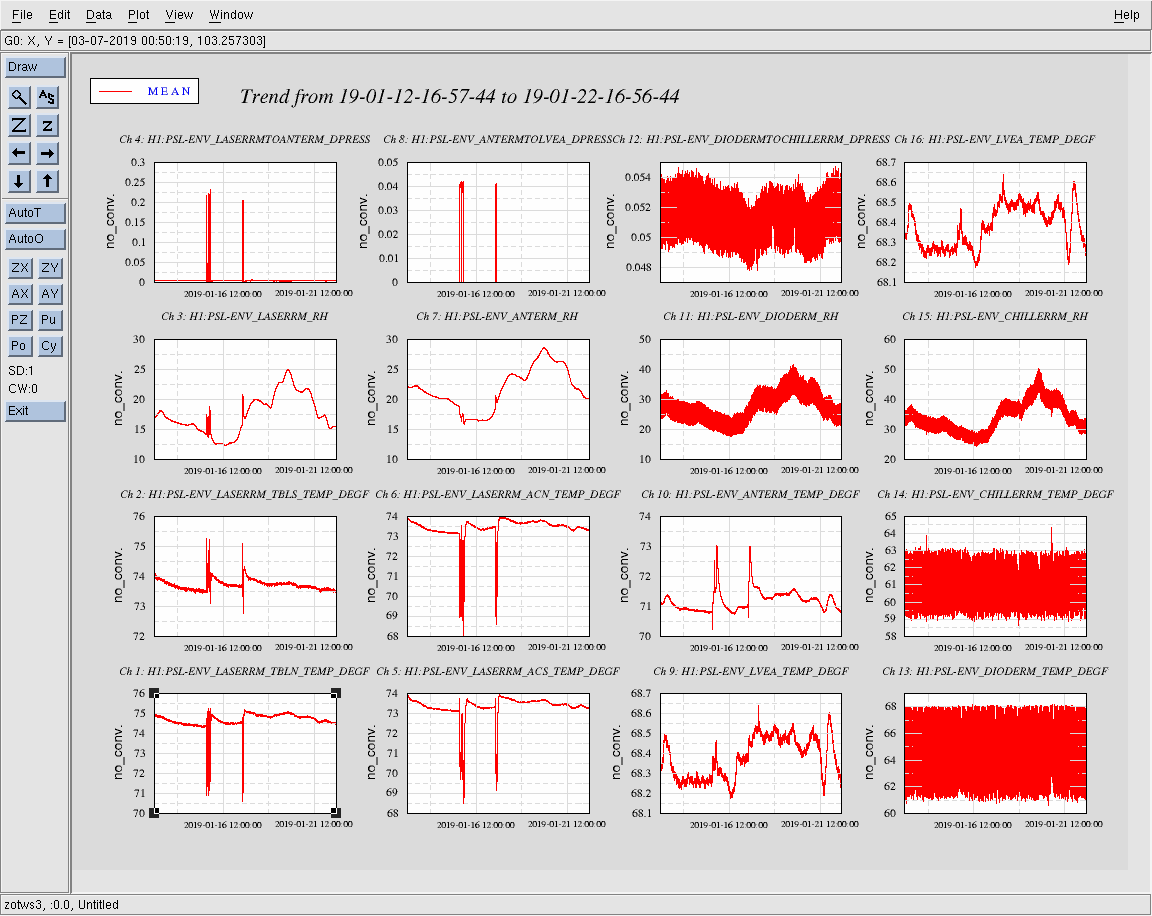
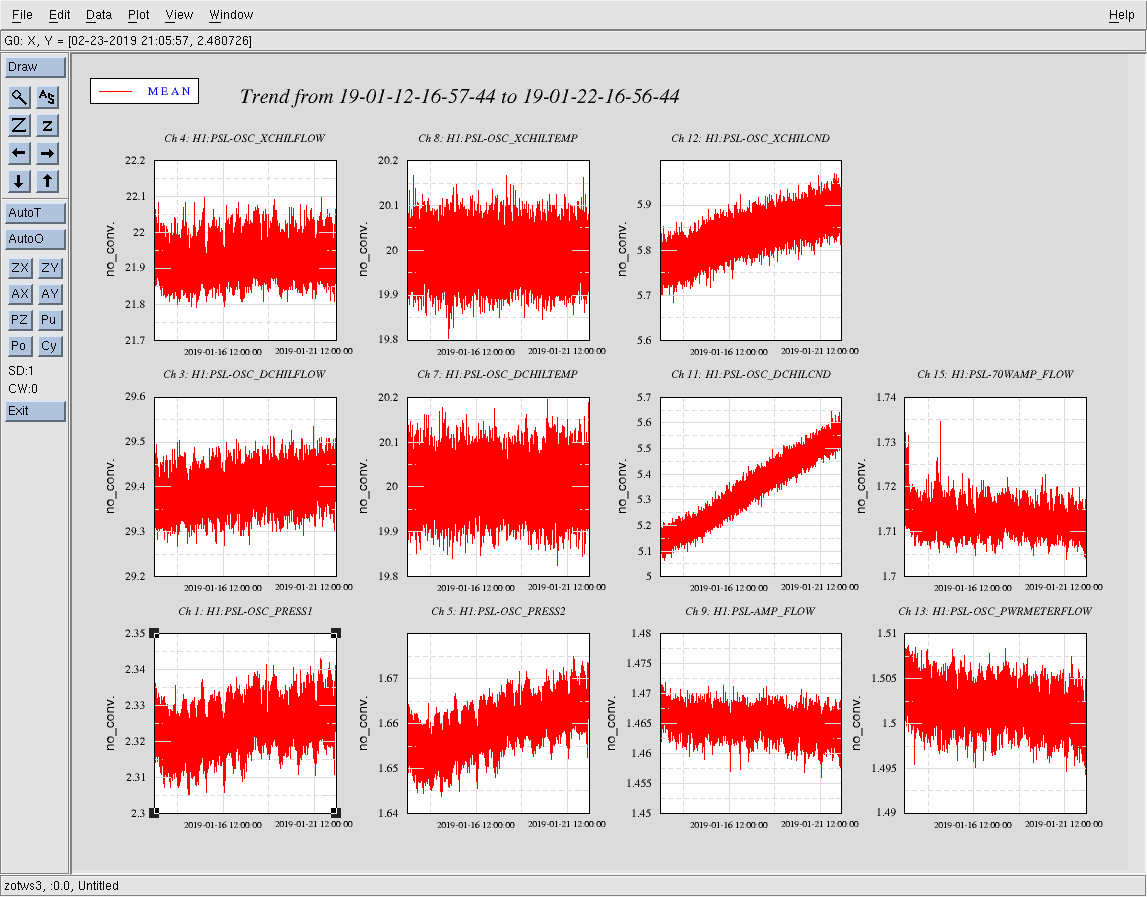
PSL Weekly Report - 10 Day Trends FAMIS #10593
Images attached to this report
Comments related to this report
jason.oberling@LIGO.ORG - 09:52, Tuesday 22 January 2019 (46567)

Everything looks normal with these trends.  One note: the two downward dips in 70W amp power in WeeklyXtal.png (H1:PSL-70WAMP_PWR) are due to incursions into the PSL enclosure; this is indicated by corresponding changes in enclosure temperature, relative humidity, and laser room-to-anteroom differential pressure, found on WeeklyEnv.png.  The first is during last Tuesday (1-15-19), when Cheryl and Robert were working on the IO system (optic swap and mount damping); the second was last Thursday (1-17-19), when Peter was performing FSS measurements.

H1 TCS (TCS)
corey.gray@LIGO.ORG - posted 09:27, Tuesday 22 January 2019 (46563)
TCS Chillers FAMIS Task (#11475)

Addressed TCS Chillers (09:15-09:21 AM PST today)

H1 ISC (ISC)
craig.cahillane@LIGO.ORG - posted 04:28, Tuesday 22 January 2019 - last comment - 17:41, Tuesday 22 January 2019(46560)
Further RIN investigations
Koji, Craig

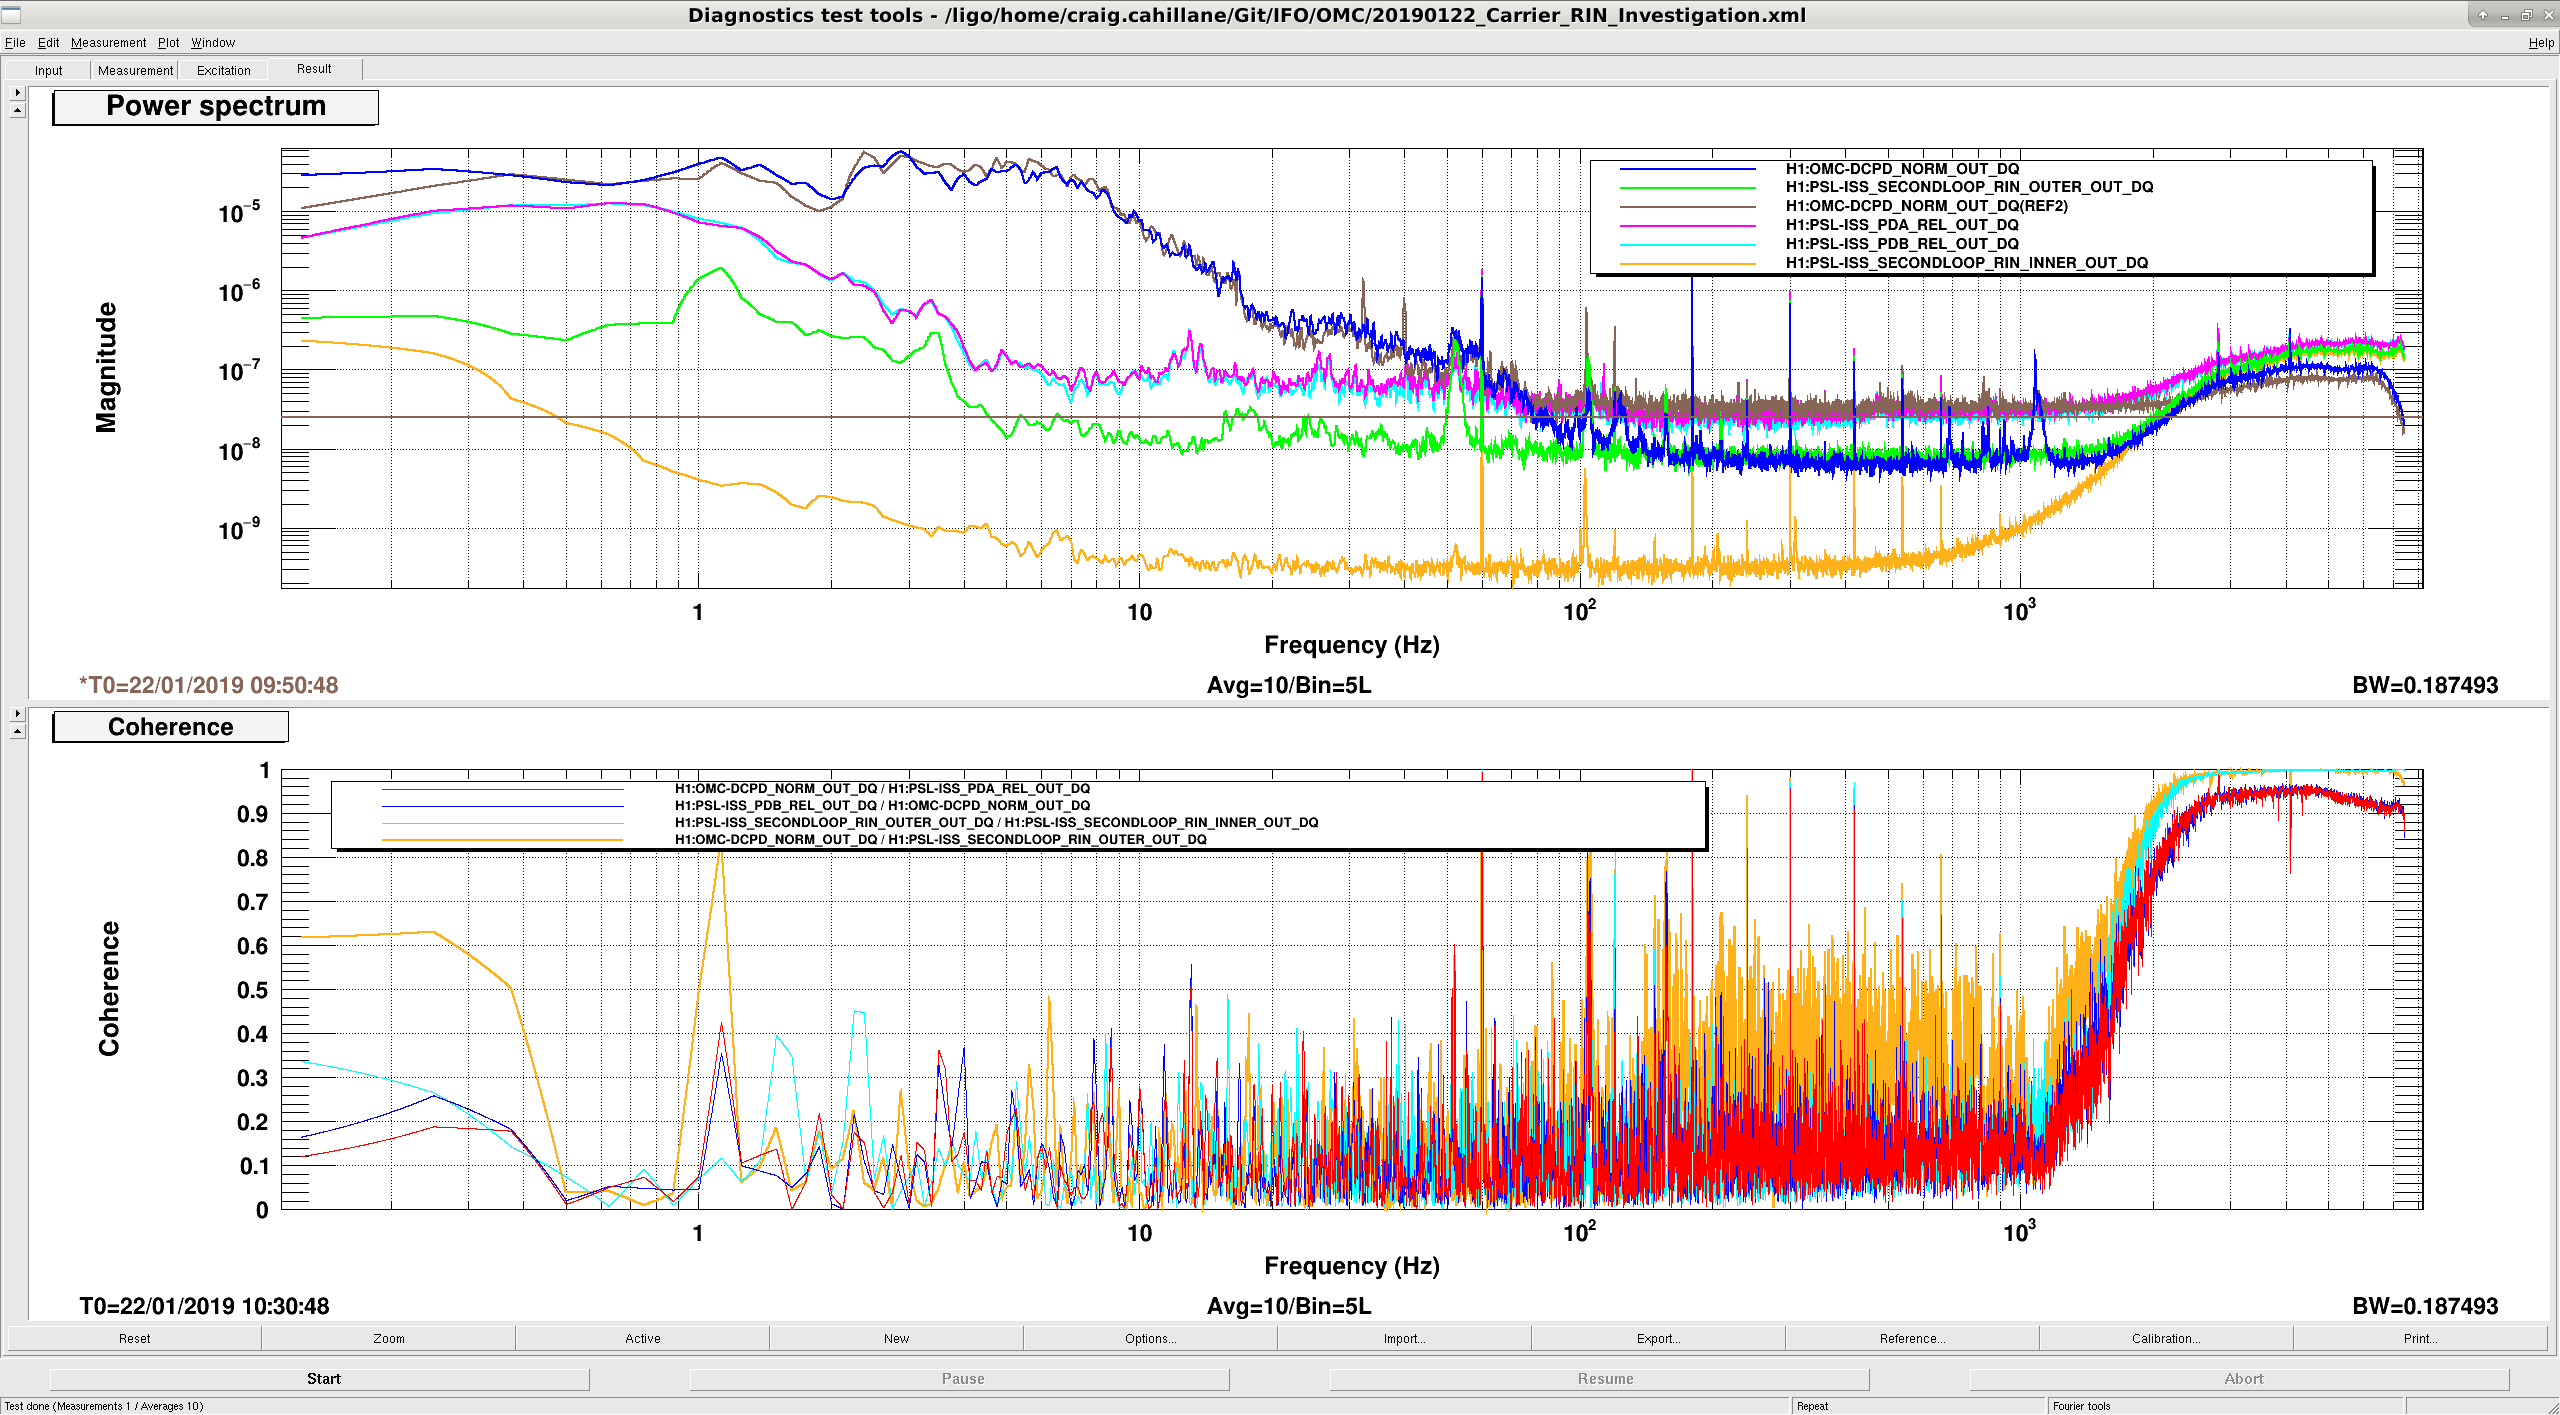
Tonight we investigated intensity noise further.  We locked the OMC on just the 45 MHz at 30 watts with 18 dB whitening gain, and then locked it on carrier at 20 W with 0 dB whitening gain.  This is a repeat of here.

We found that carrier and 45 MHz noise levels are similar.  (See attachment one, carrier RIN is Blue, 45 MHz RIN is Brown)

We were confused about why 100 and 1000 Hz the carrier noise is lower.  We believe that this is mostly a shot noise effect.  
For 45 MHz we have 0.5 mA on the OMC DCPDs, while for carrier we had 34.3 mA.  This corresponds to RIN shot noise levels of 2.5 × 10⁻⁸ 1/rtHz and 3.1 × 10⁻⁹ 1/rtHz.
- The carrier is mostly limited by the ISS second loop sensing noise, as seen from the green curve in attachment one.  
- The 45 MHz flattens out right around our shot noise limit around 100 Hz.
- Both carrier and 45 MHz have similar RIN spectra below 100 Hz.

Recap:
We know that the 9 MHz modulation depth has a real effect on the DARM noise, seen here as well.  During the holiday party we were able to improve DARM noise by increasing the DARM offset, which could be due to increased carrier drowning out the 9 MHz noise.
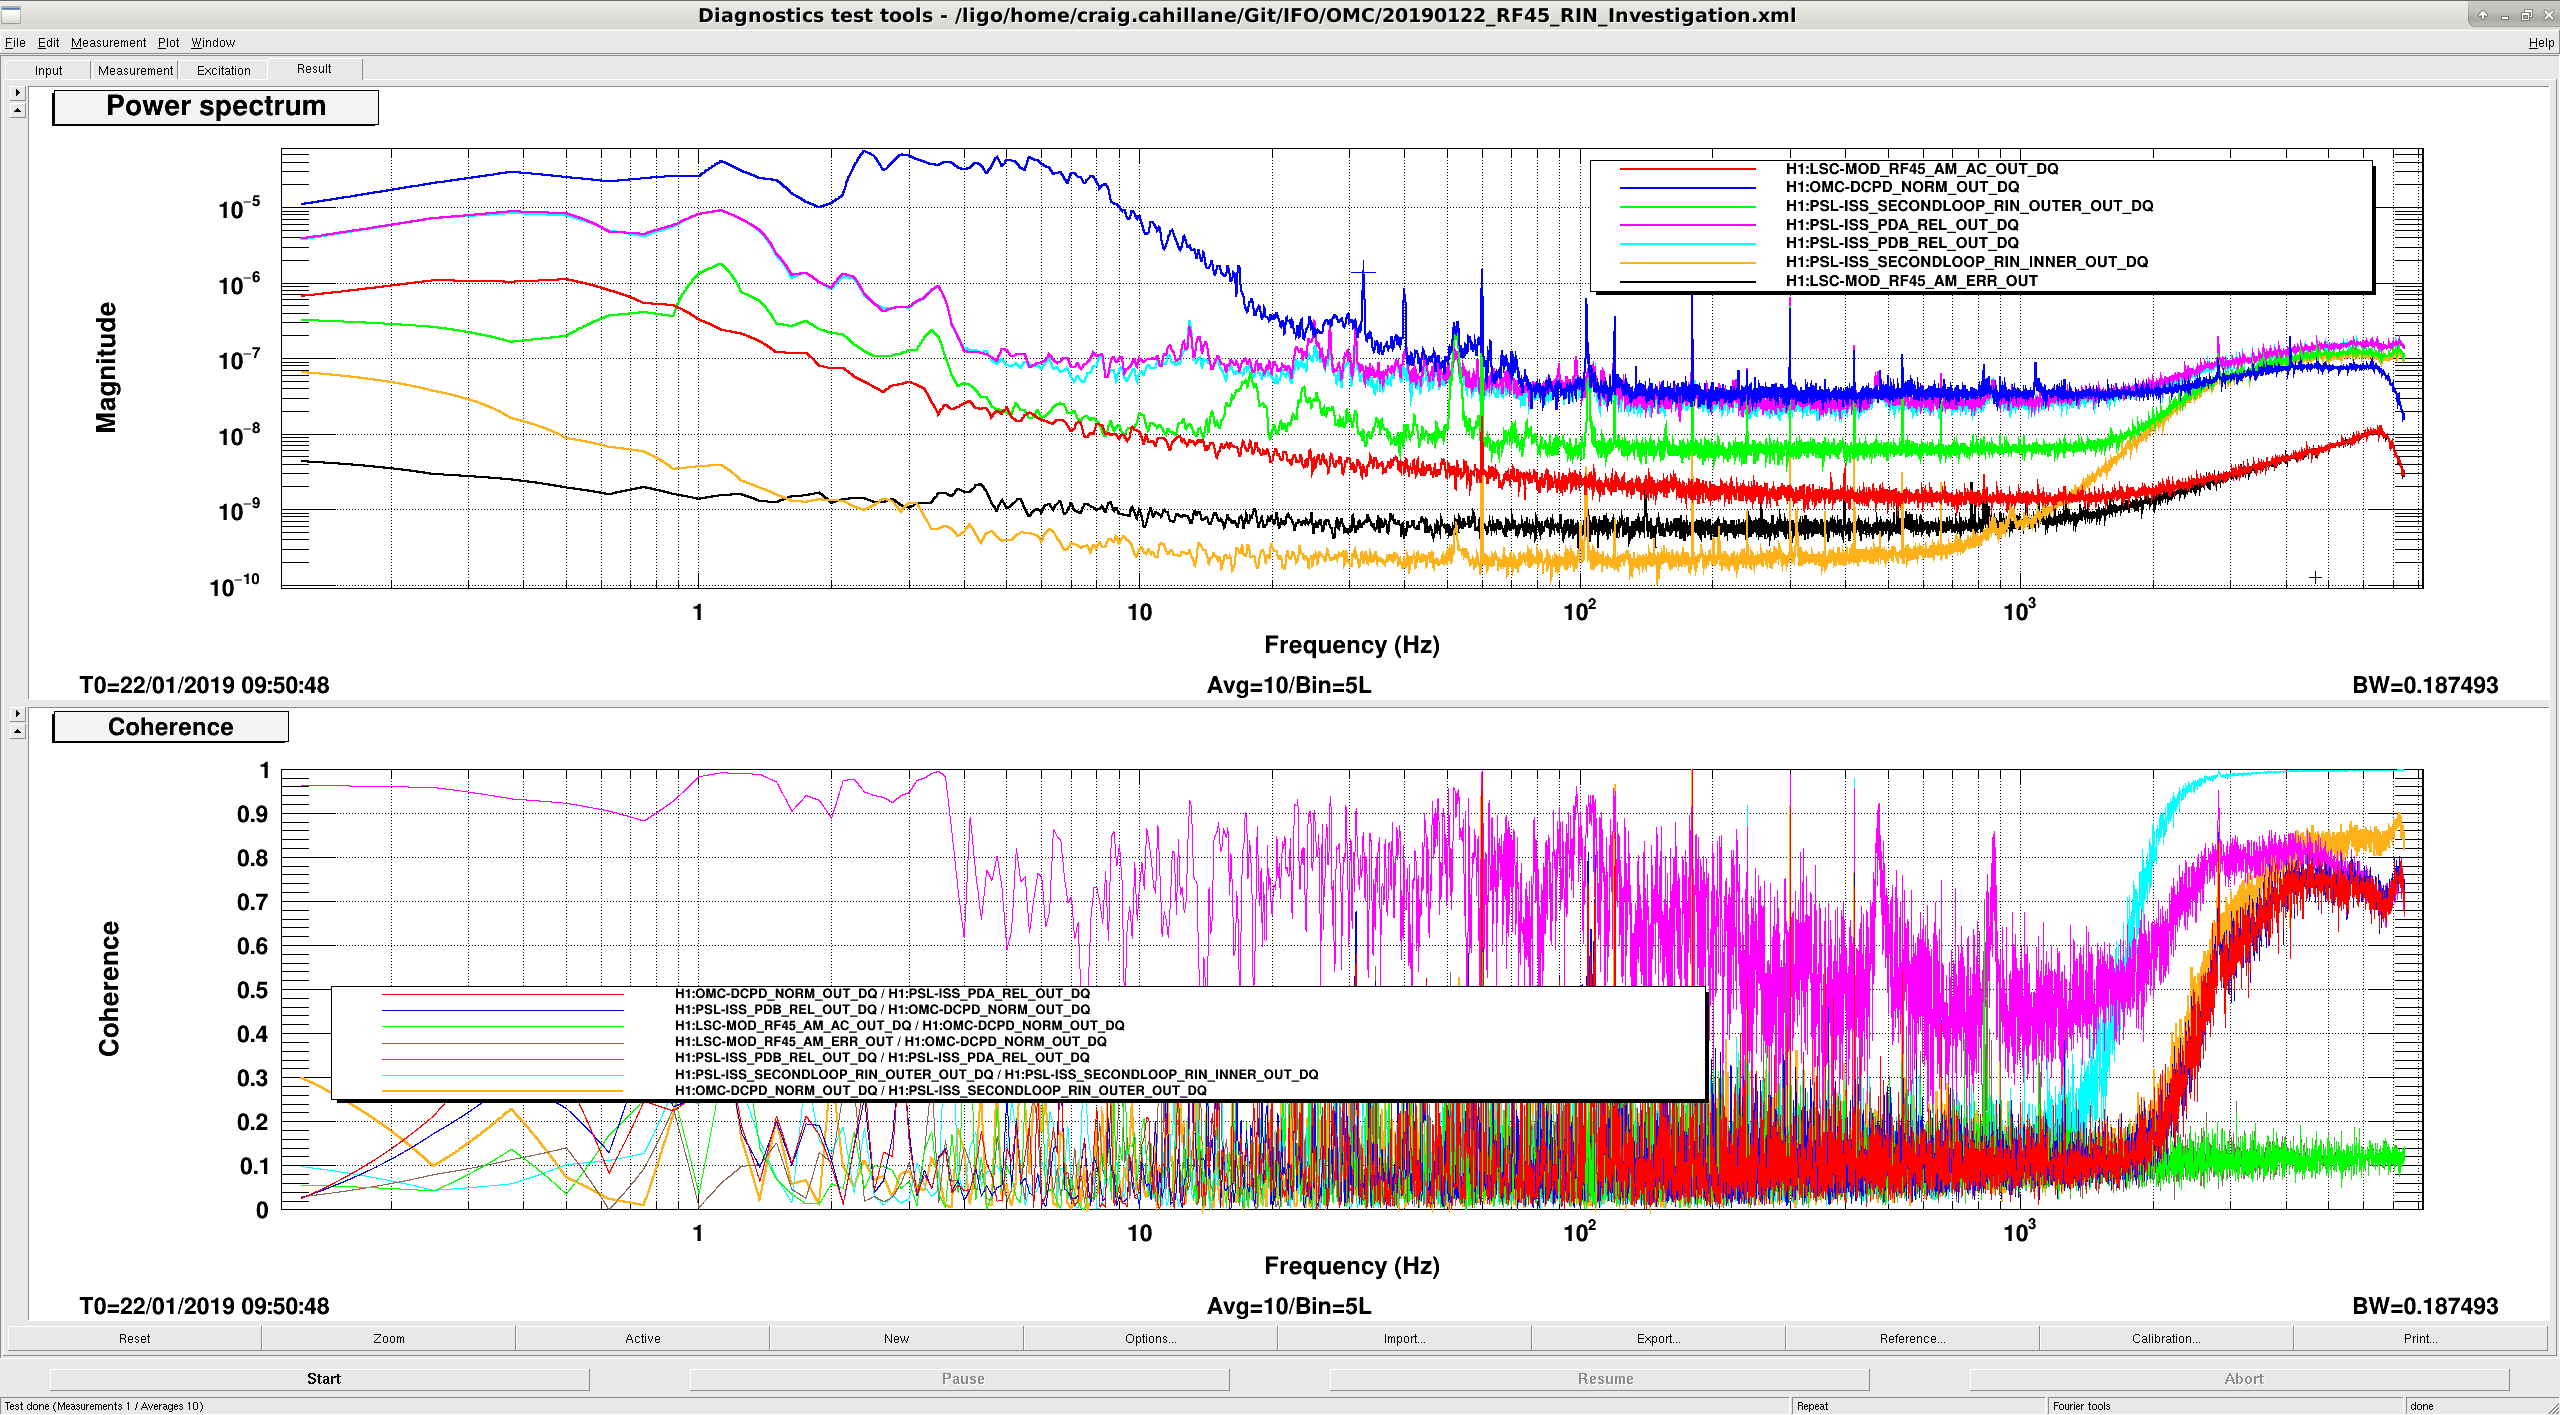
We also know that our OMC measured RIN in the sidebands cannot be explained from the noise in our RF AM stabilization scheme, or the ISS.
We are pretty sure that the IMC FSR is reasonably close to our 1f modulation frequency.

Conclusions:
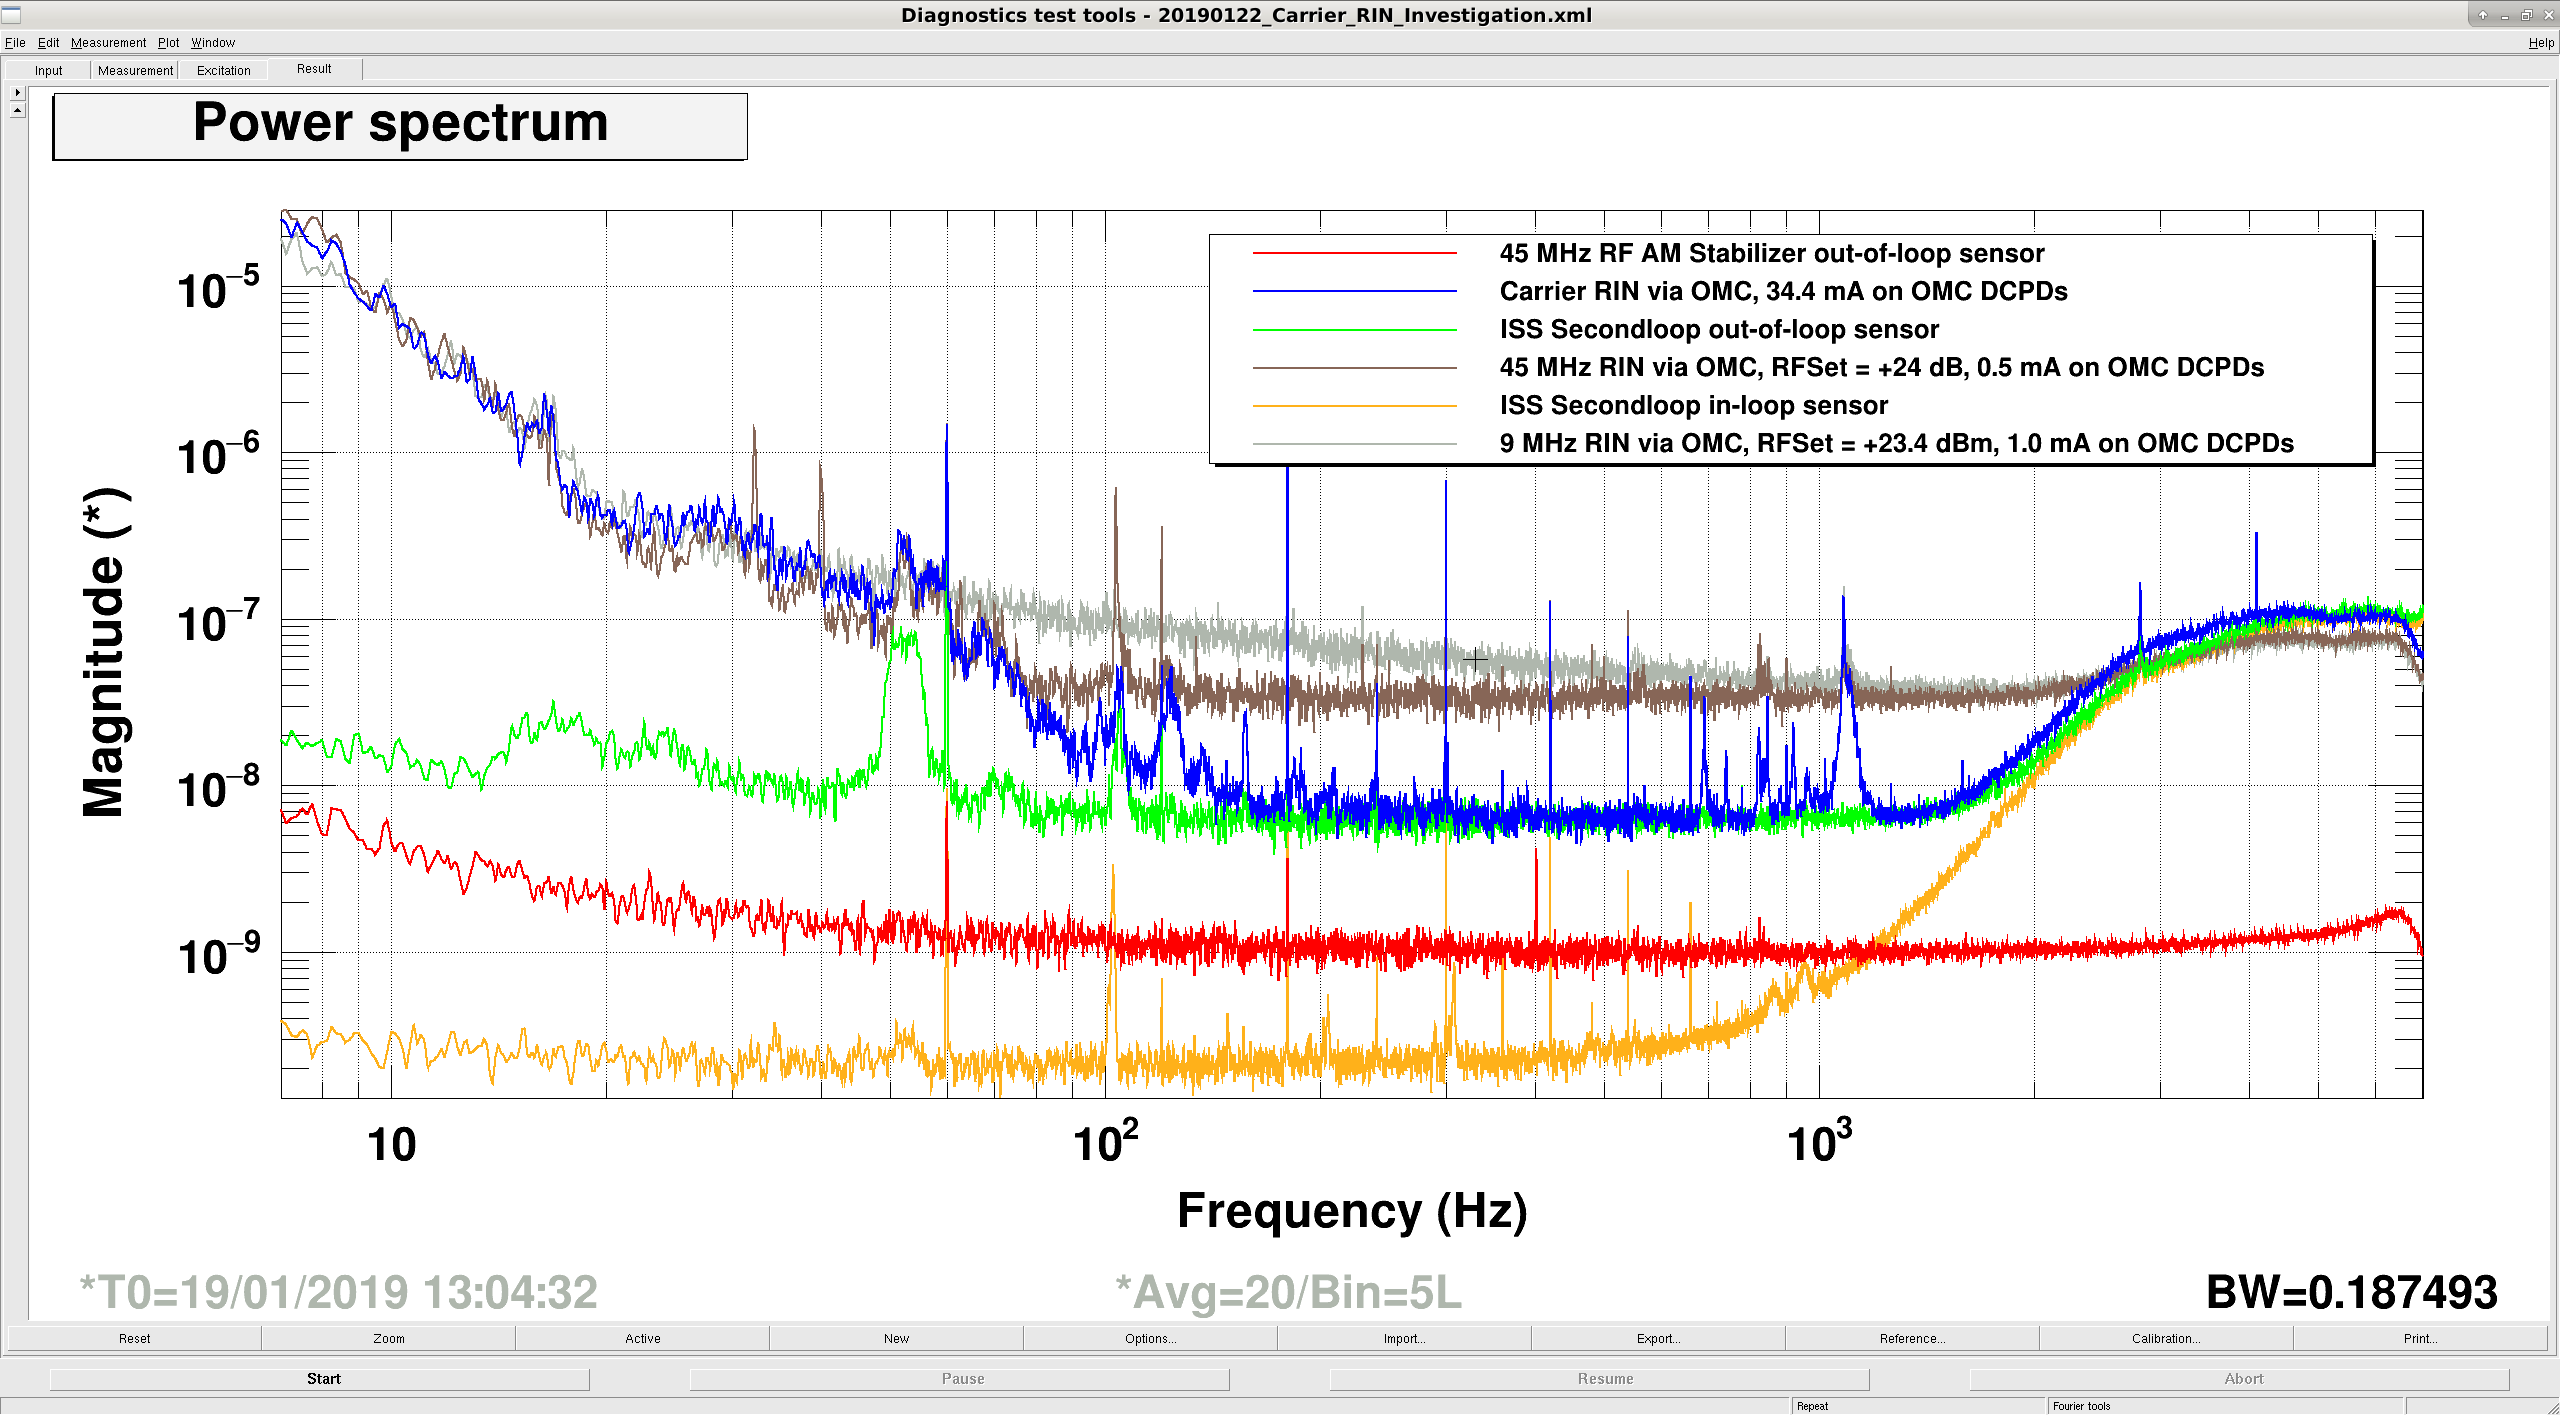
We here note that our shot noise from the OMC sideband measurements is not good enough from 80 Hz onwards to be able to tell what our actual 45 MHz sideband RIN noise level is.  
Below 100 Hz, carrier and 45 MHz RIN seem to be limited by the same mechanism, we don't know what it is.  
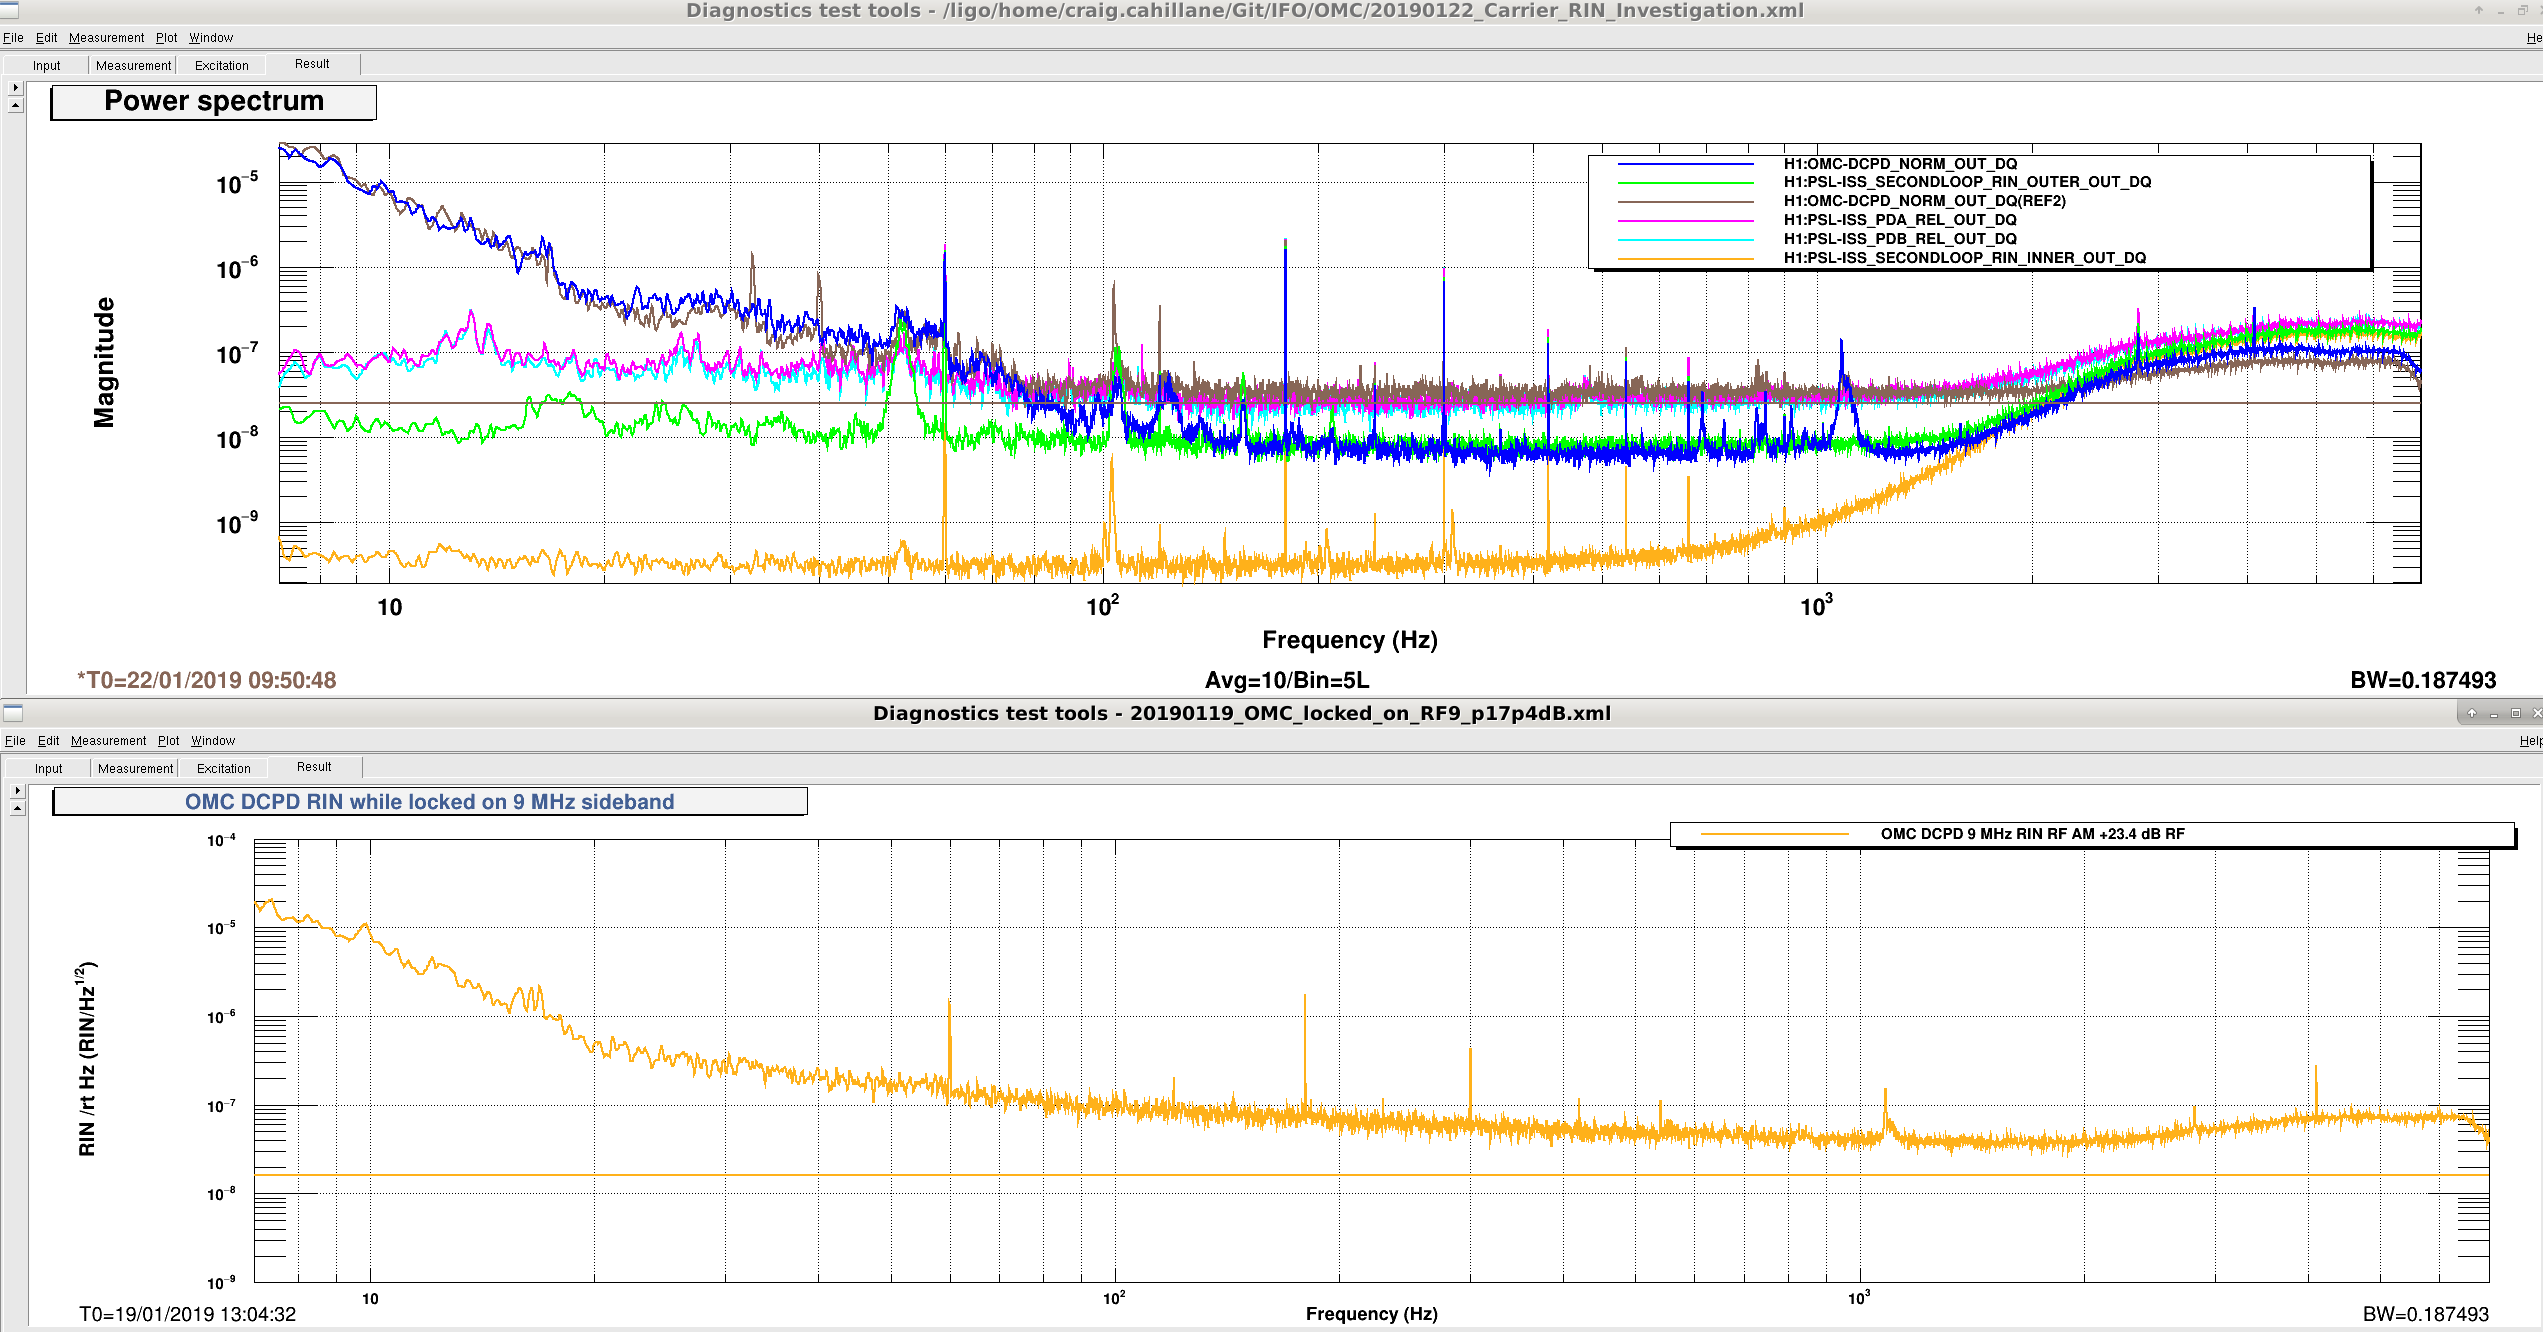
9 MHz is not ever limited by shot noise in the OMC RIN measurement, and is overall worse than both carrier and 45 MHz RIN after 20 Hz, where it starts falling much more slowly. (Attachment three)

-------------------------------------------------------------------------------------------------------------

Past OMC carrier RIN measurement
Images attached to this report
Comments related to this report
daniel.sigg@LIGO.ORG - 09:44, Tuesday 22 January 2019 (46565)

The AM stabilization circuit uses Schottky diodes to rectify the RF and get an error signal for its internal stabilization servo. At the highest output power, the flicker noise of these diodes will show as1/f noise in the power spectrum. This was not a problem with the old EOM, since it had higher Q and we never needed to go beyond 17 dBm drive power for 9 MHz, whereas we use ~24 dBm now.

PS. DTT has an import/export function.

craig.cahillane@LIGO.ORG - 17:41, Tuesday 22 January 2019 (46586)
Learned how to import in DTT.  Shown is carrier, 9 MHz, and 45 MHz together.
Images attached to this comment
H1 ISC (ISC)
craig.cahillane@LIGO.ORG - posted 03:02, Tuesday 22 January 2019 - last comment - 14:41, Tuesday 22 January 2019(46559)
CHARD P, DHARD P swept sines
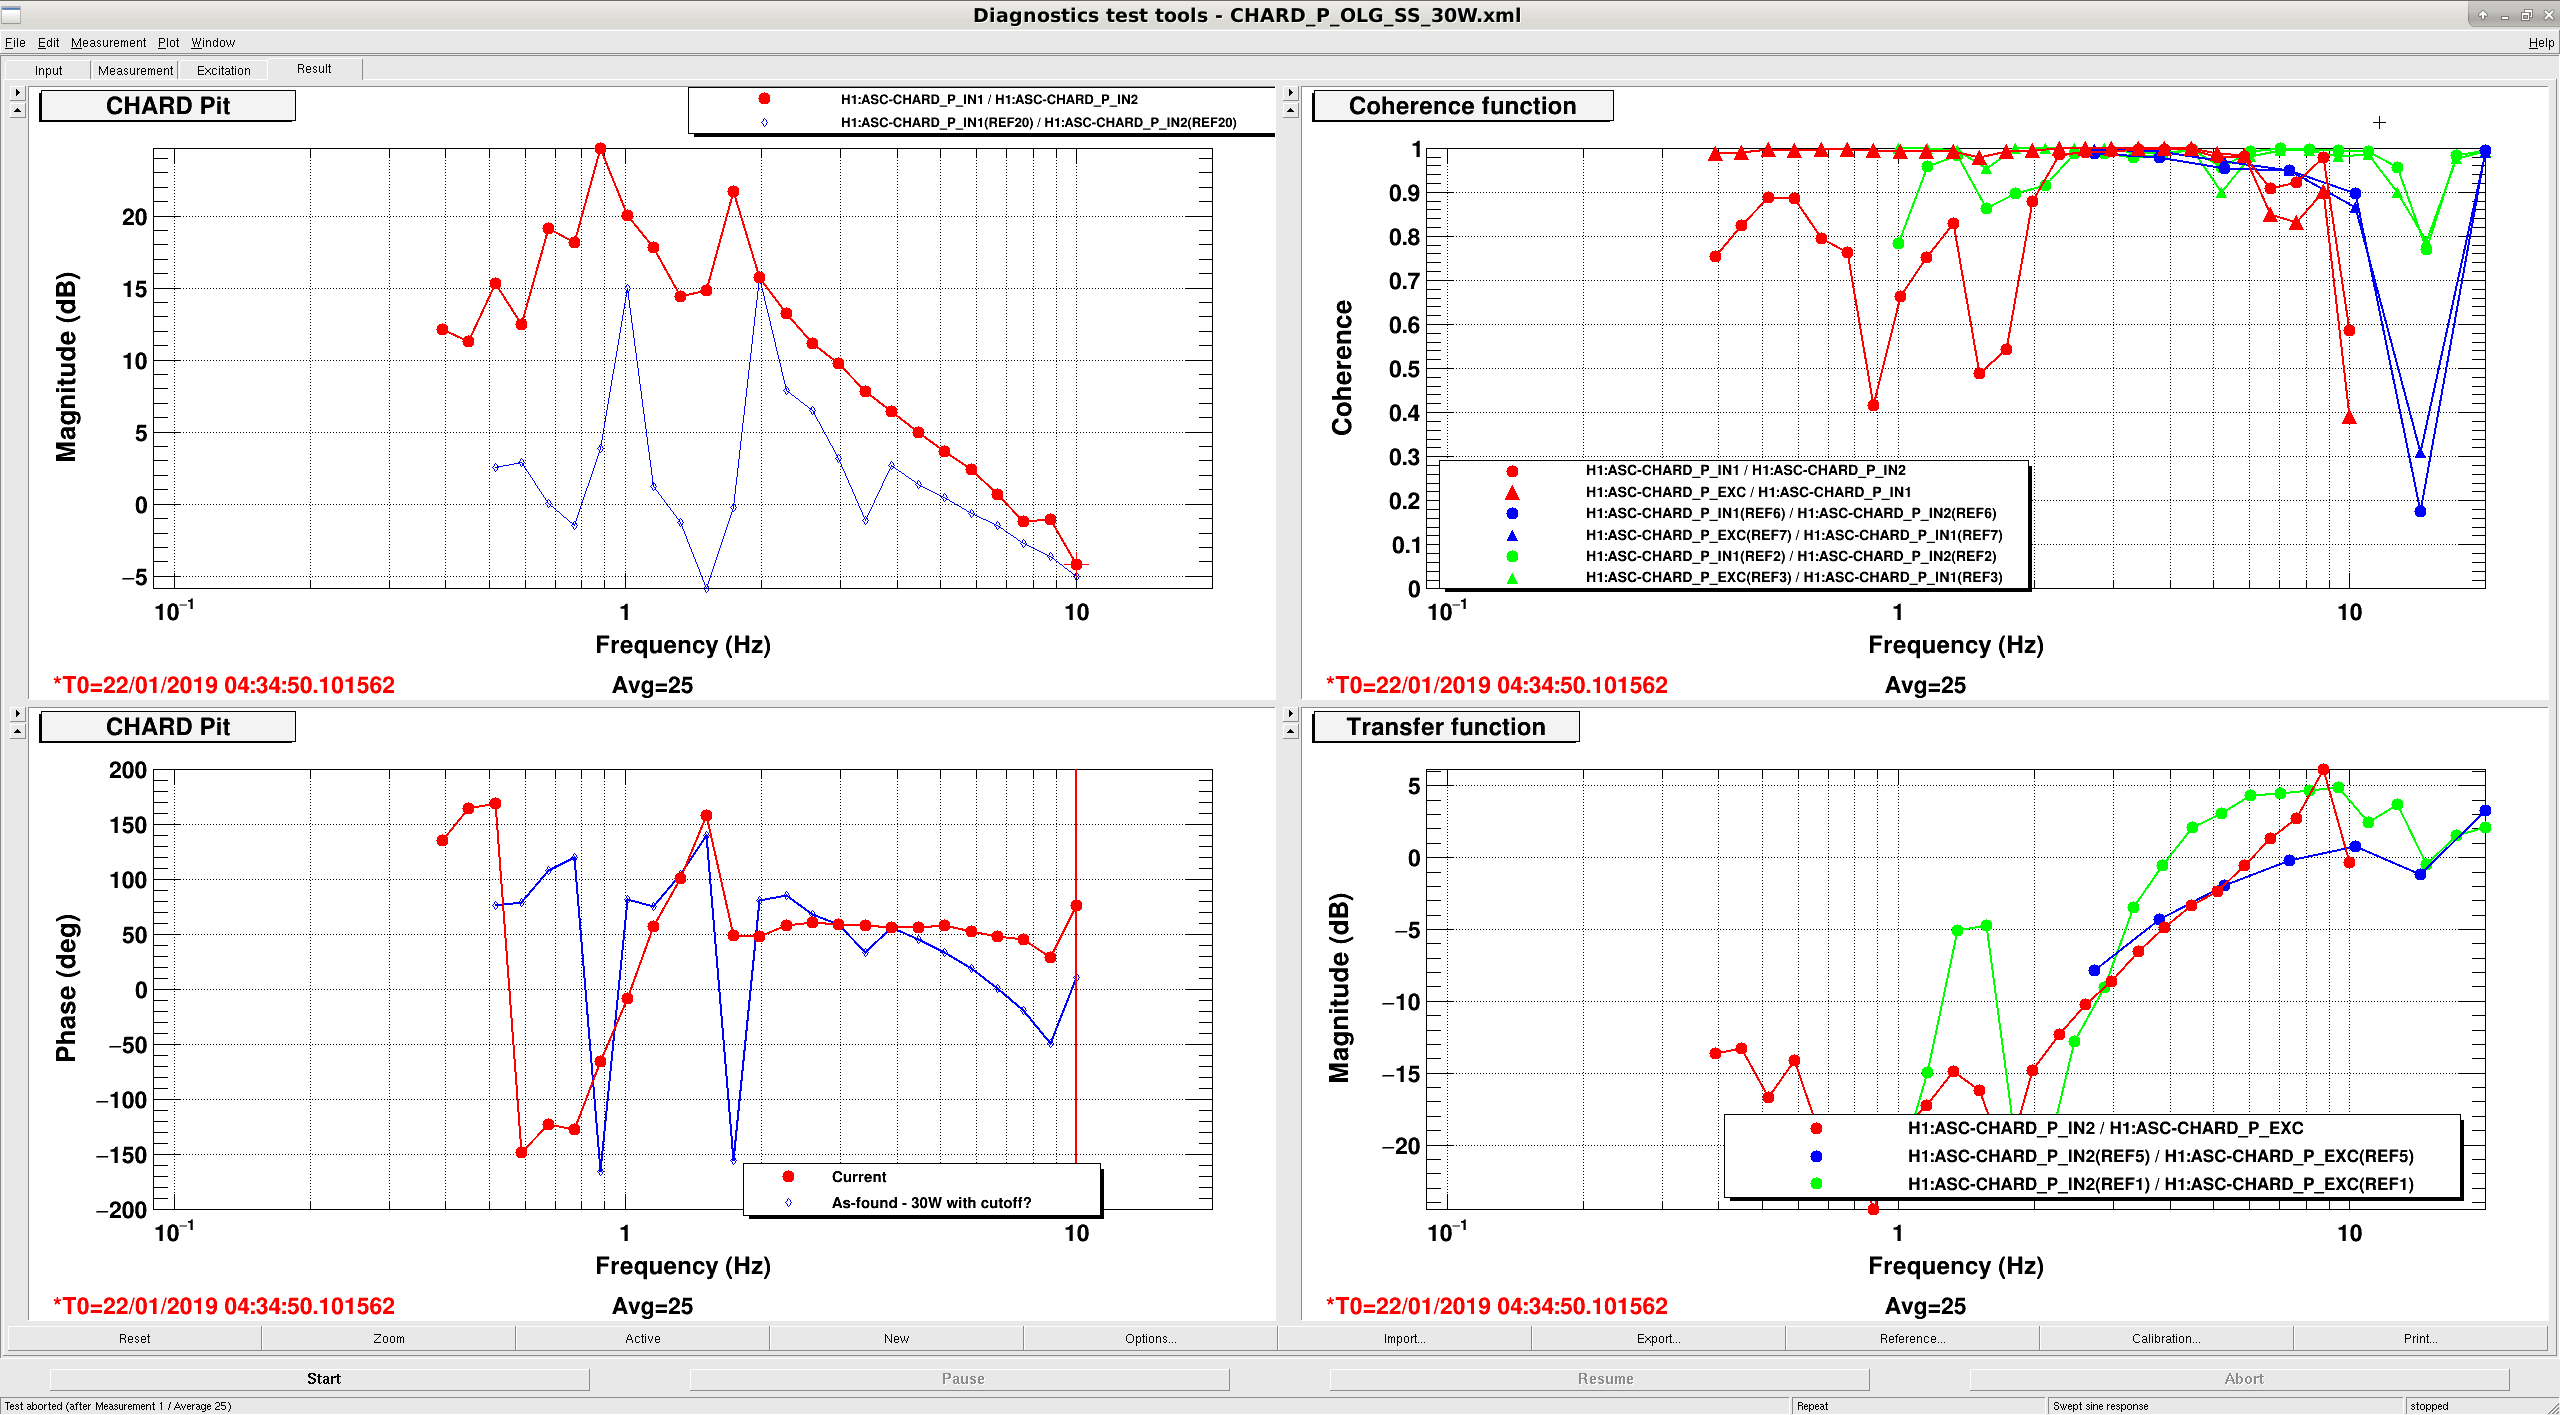
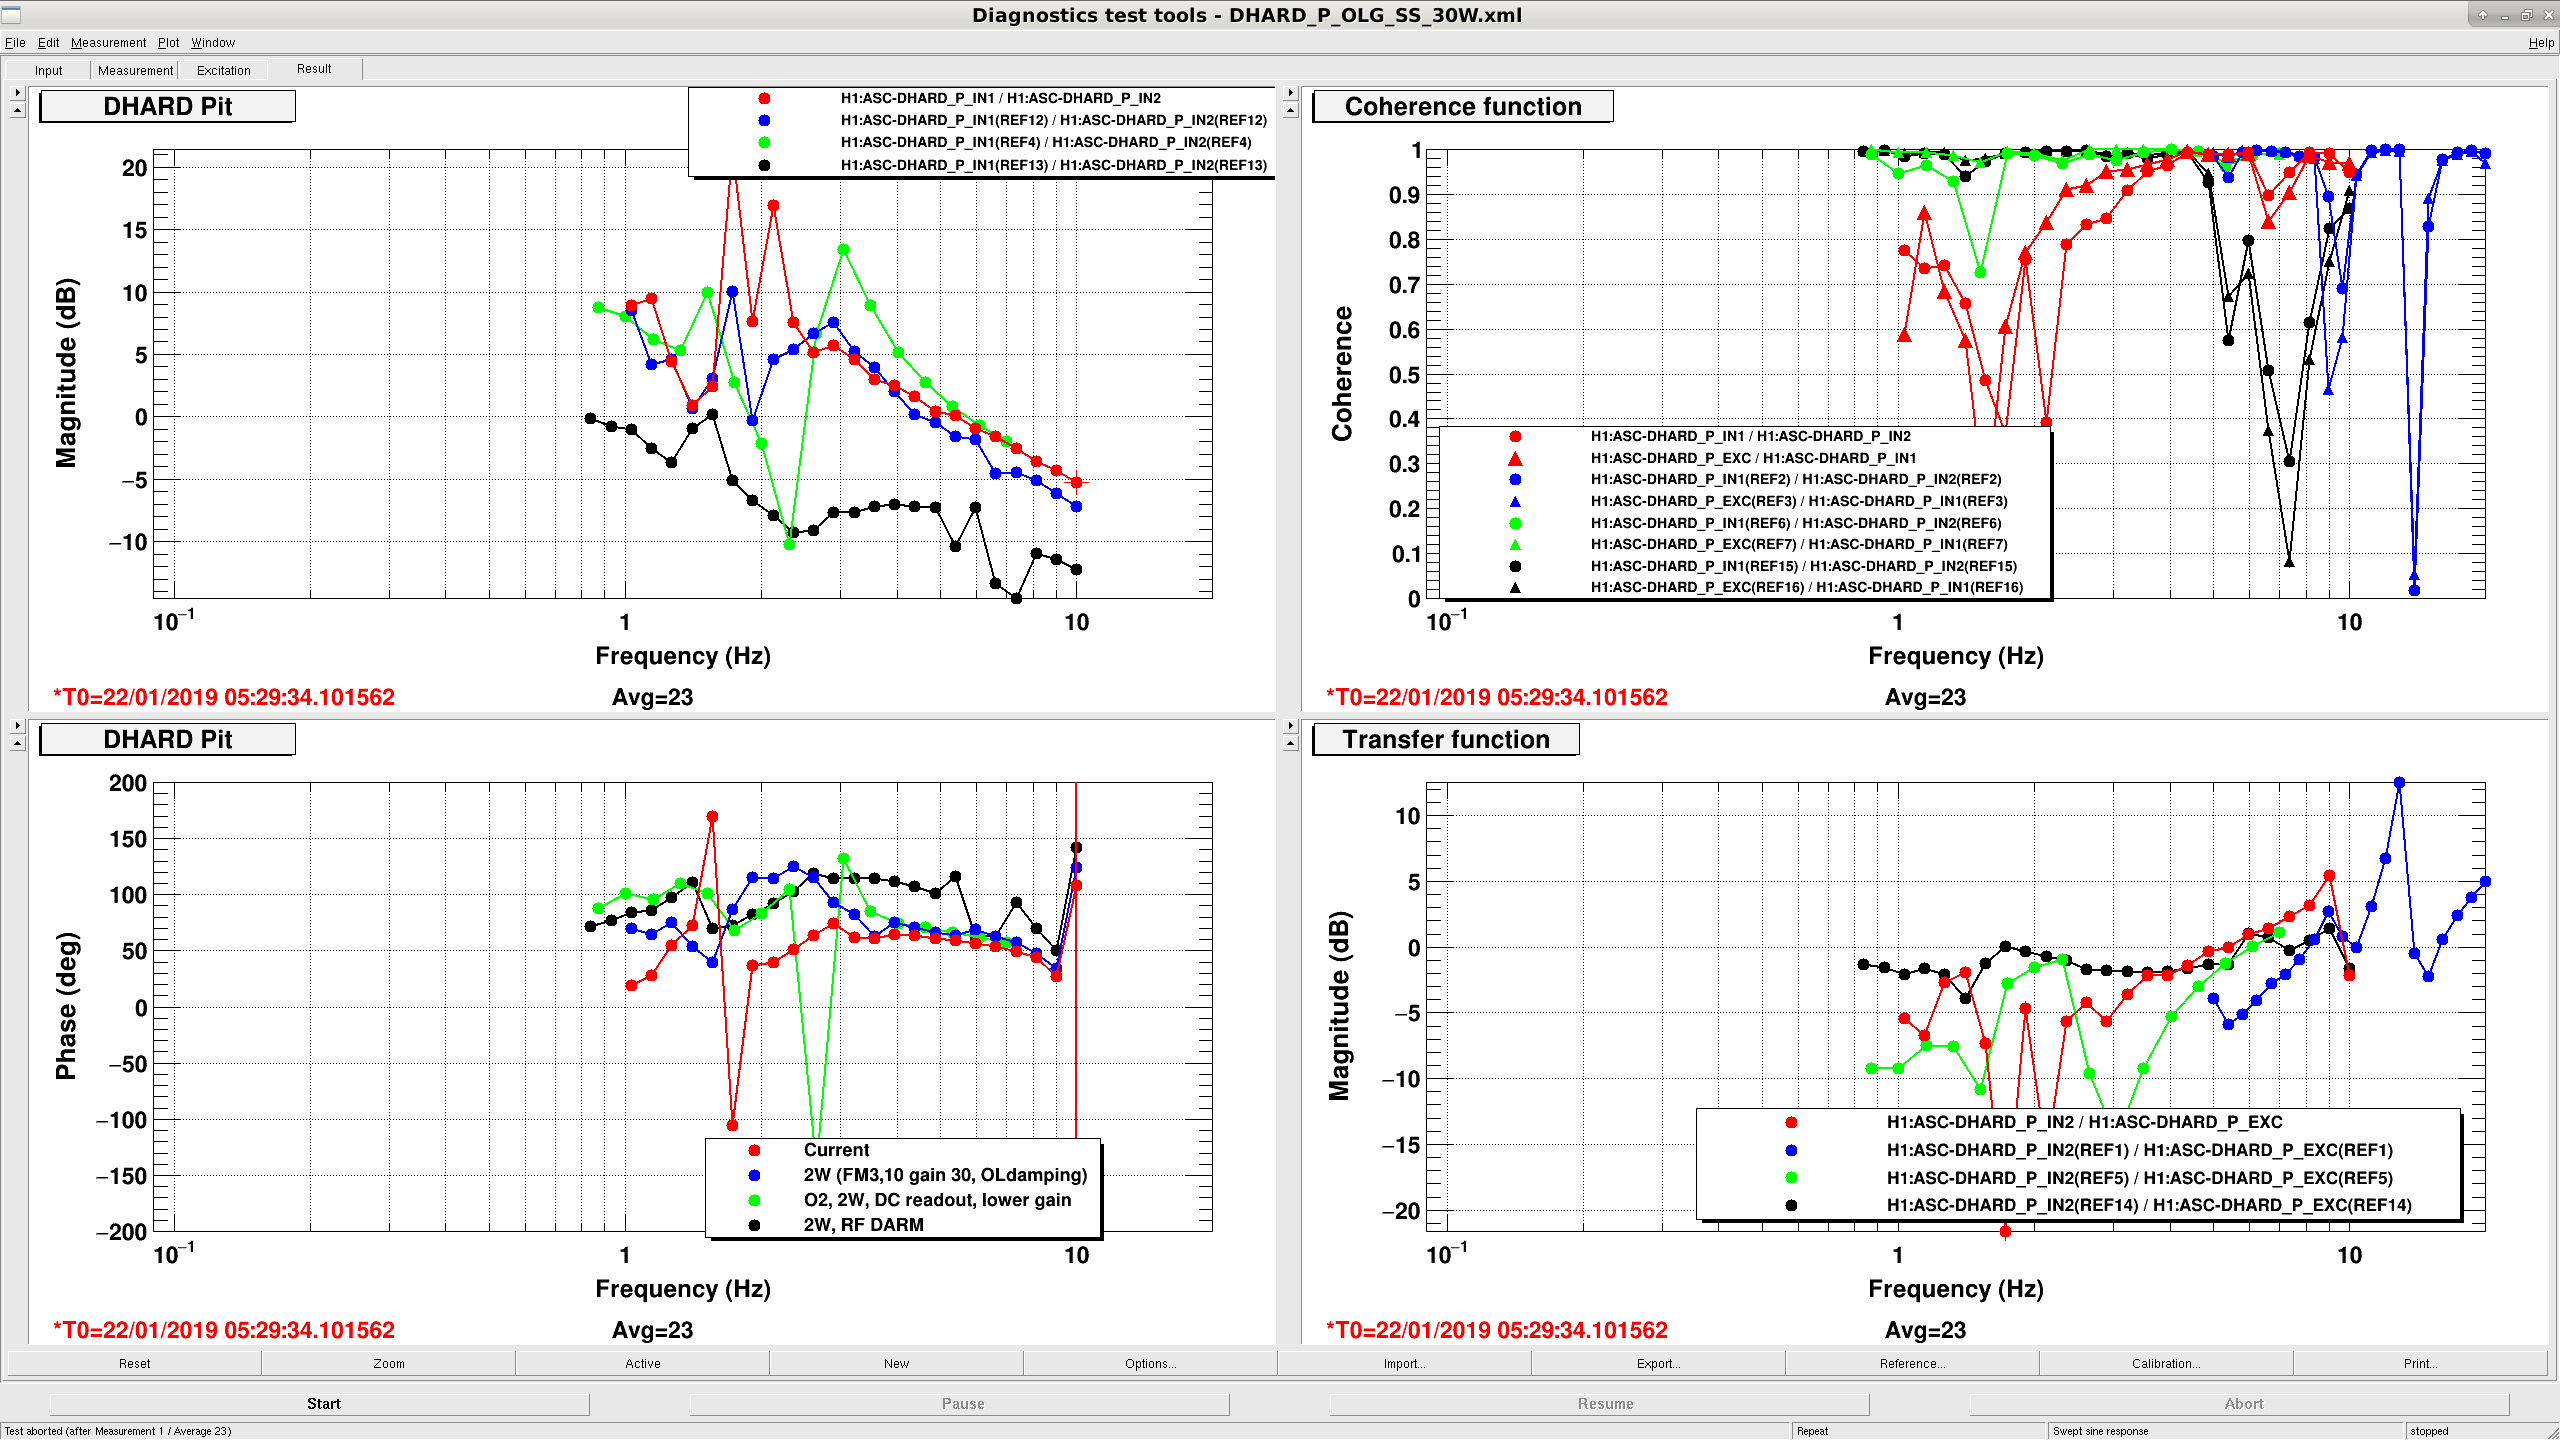
We took some CHARD, DHARD P measurements tonight, neither seem responsible for the 1 Hz oscillation reported earlier.
We lost lock due to a 6.4 earthquake five hours ago.

Images attached to this report
Comments related to this report
sheila.dwyer@LIGO.ORG - 11:01, Tuesday 22 January 2019 (46571)

These measurements were taken with a gain of 2 in CHARD P, and a SWSTAT of 38429, which means this happened before the gain is reduced to 0.6 (10dB lower) and the elliptic low pass at 10 Hz is engaged.  Although we have 0 degrees of phase at 1 Hz, it seems like even after the changes in low noise ASC we should still have 10dB of gain   at 1 Hz.  

For DHARD P this was also taken before the changes in low noise ASC (gain is 50, SWSTAT is 38420), where the gain will be reduced by 4.5 dB and the one of the low passes will be engaged (either ELP10 or ELP17).  The gain reduction for DHARD seems like the most suspect thing here, especially since the coherence is low for the 1 Hz point in Craig's measurement.

jenne.driggers@LIGO.ORG - 14:41, Tuesday 22 January 2019 (46580)

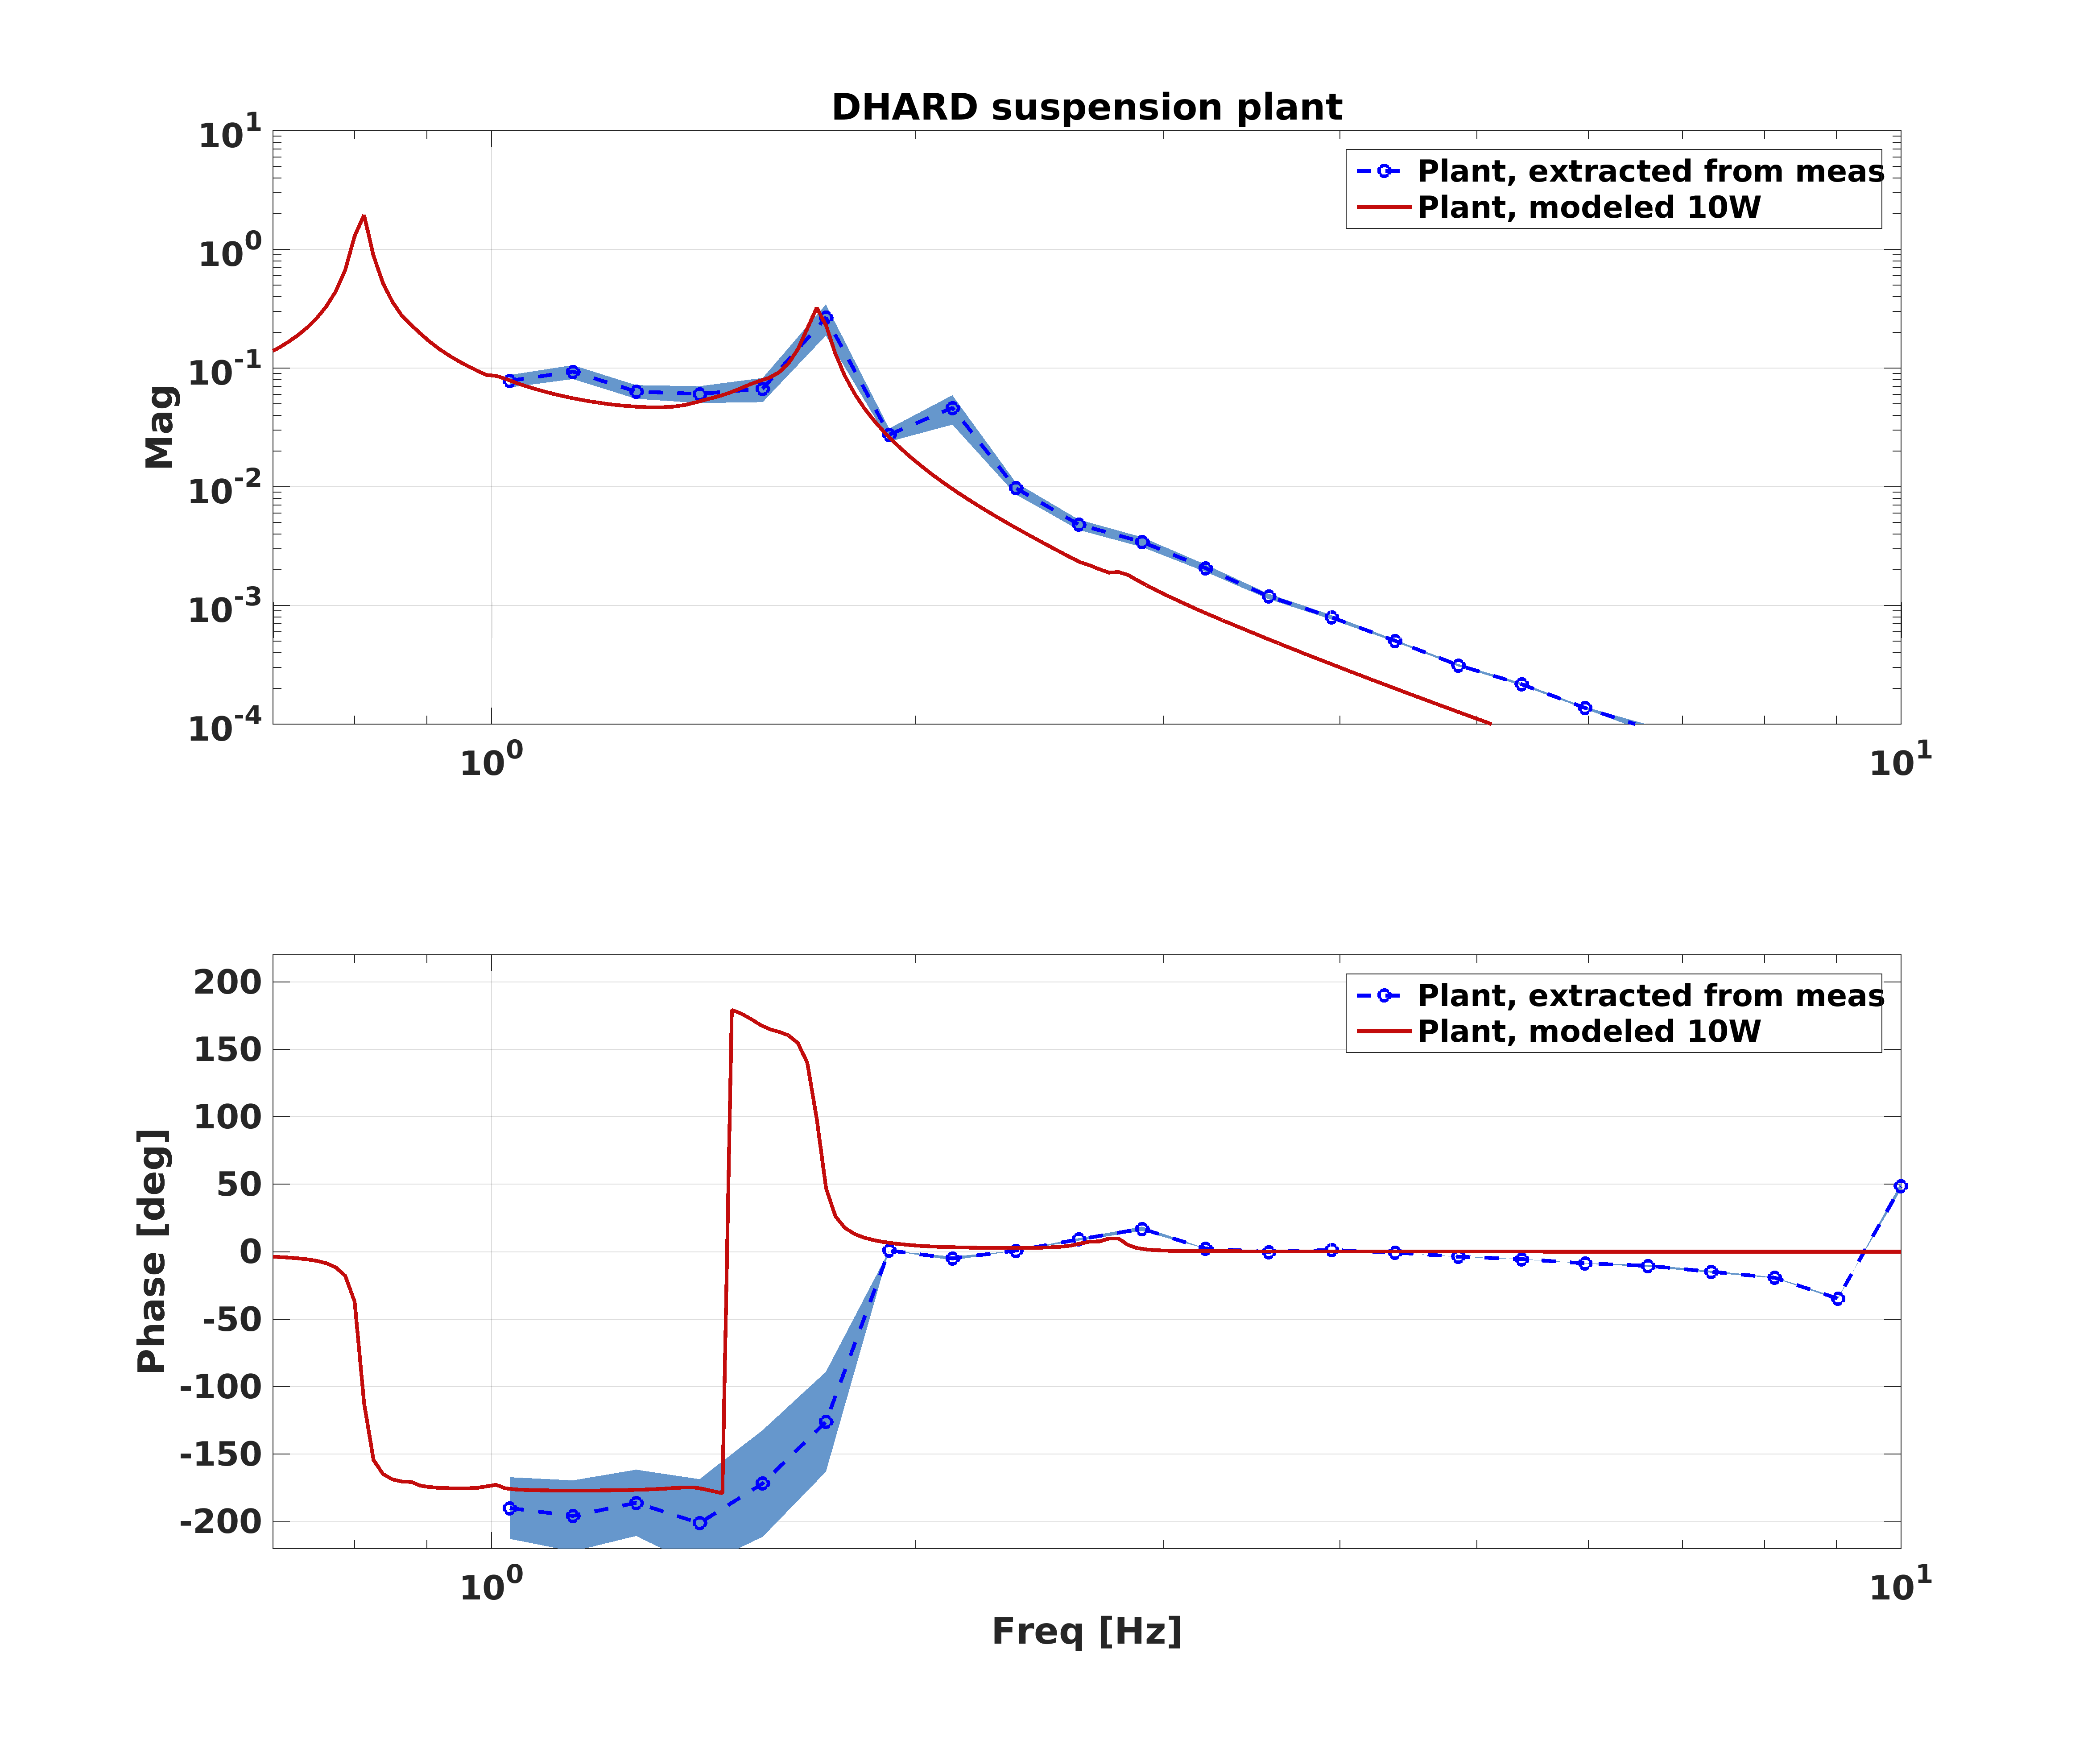
I think we may need to understand our DHARD plant better.  I've taken the measurement from the parent alog, and extracted the suspension plant by dividing by the control filters that were in use at the time.  I plot this against a model of the DHARD pitch plant at 10W.  (Note that the measured data was taken at 30W, but the radiation pressure compensation was engaged to make it look like a 10W plant, which is why I compare to the 10W system.)

Also plotted are some rough uncertainties for the measured plant. 

You can see that this measurement is consistent with Hang's in alog 46179, where he notes that the measured phase is doing opposite of what one expects for a pendulum system.  So, while the OLG looks stable, we probably have something funky going on here.

Images attached to this comment
H1 ISC
sheila.dwyer@LIGO.ORG - posted 19:20, Monday 21 January 2019 (46556)
some ASC work today

TVo, Sheila, Koji and Jonathan

Today ASC required our attention, so we spent some time on it.  It looks like the combination of moving the spot position on ETMY and phasing AS72 have helped our build ups when the ASC is engaged at 2W, and perhaps the drop off in POP18 is a bit better. 

Dither Phases:

Phasing AS72:

Engaging ASC/ no more POP QPD feedback:

LOWNOISE ASC:

PRMI to DRMI transition:

We had an accidental DRMI lock where SRM was badly mis-alinged, and we were able to walk SRM back in without immediately losing lock.  This happened at 0:59 UTC on Jan 22nd, PRCL gain was 8 and MICH gain was 2.8.

H1 ISC (ISC)
craig.cahillane@LIGO.ORG - posted 03:29, Monday 21 January 2019 (46553)
Power Up Thermalization
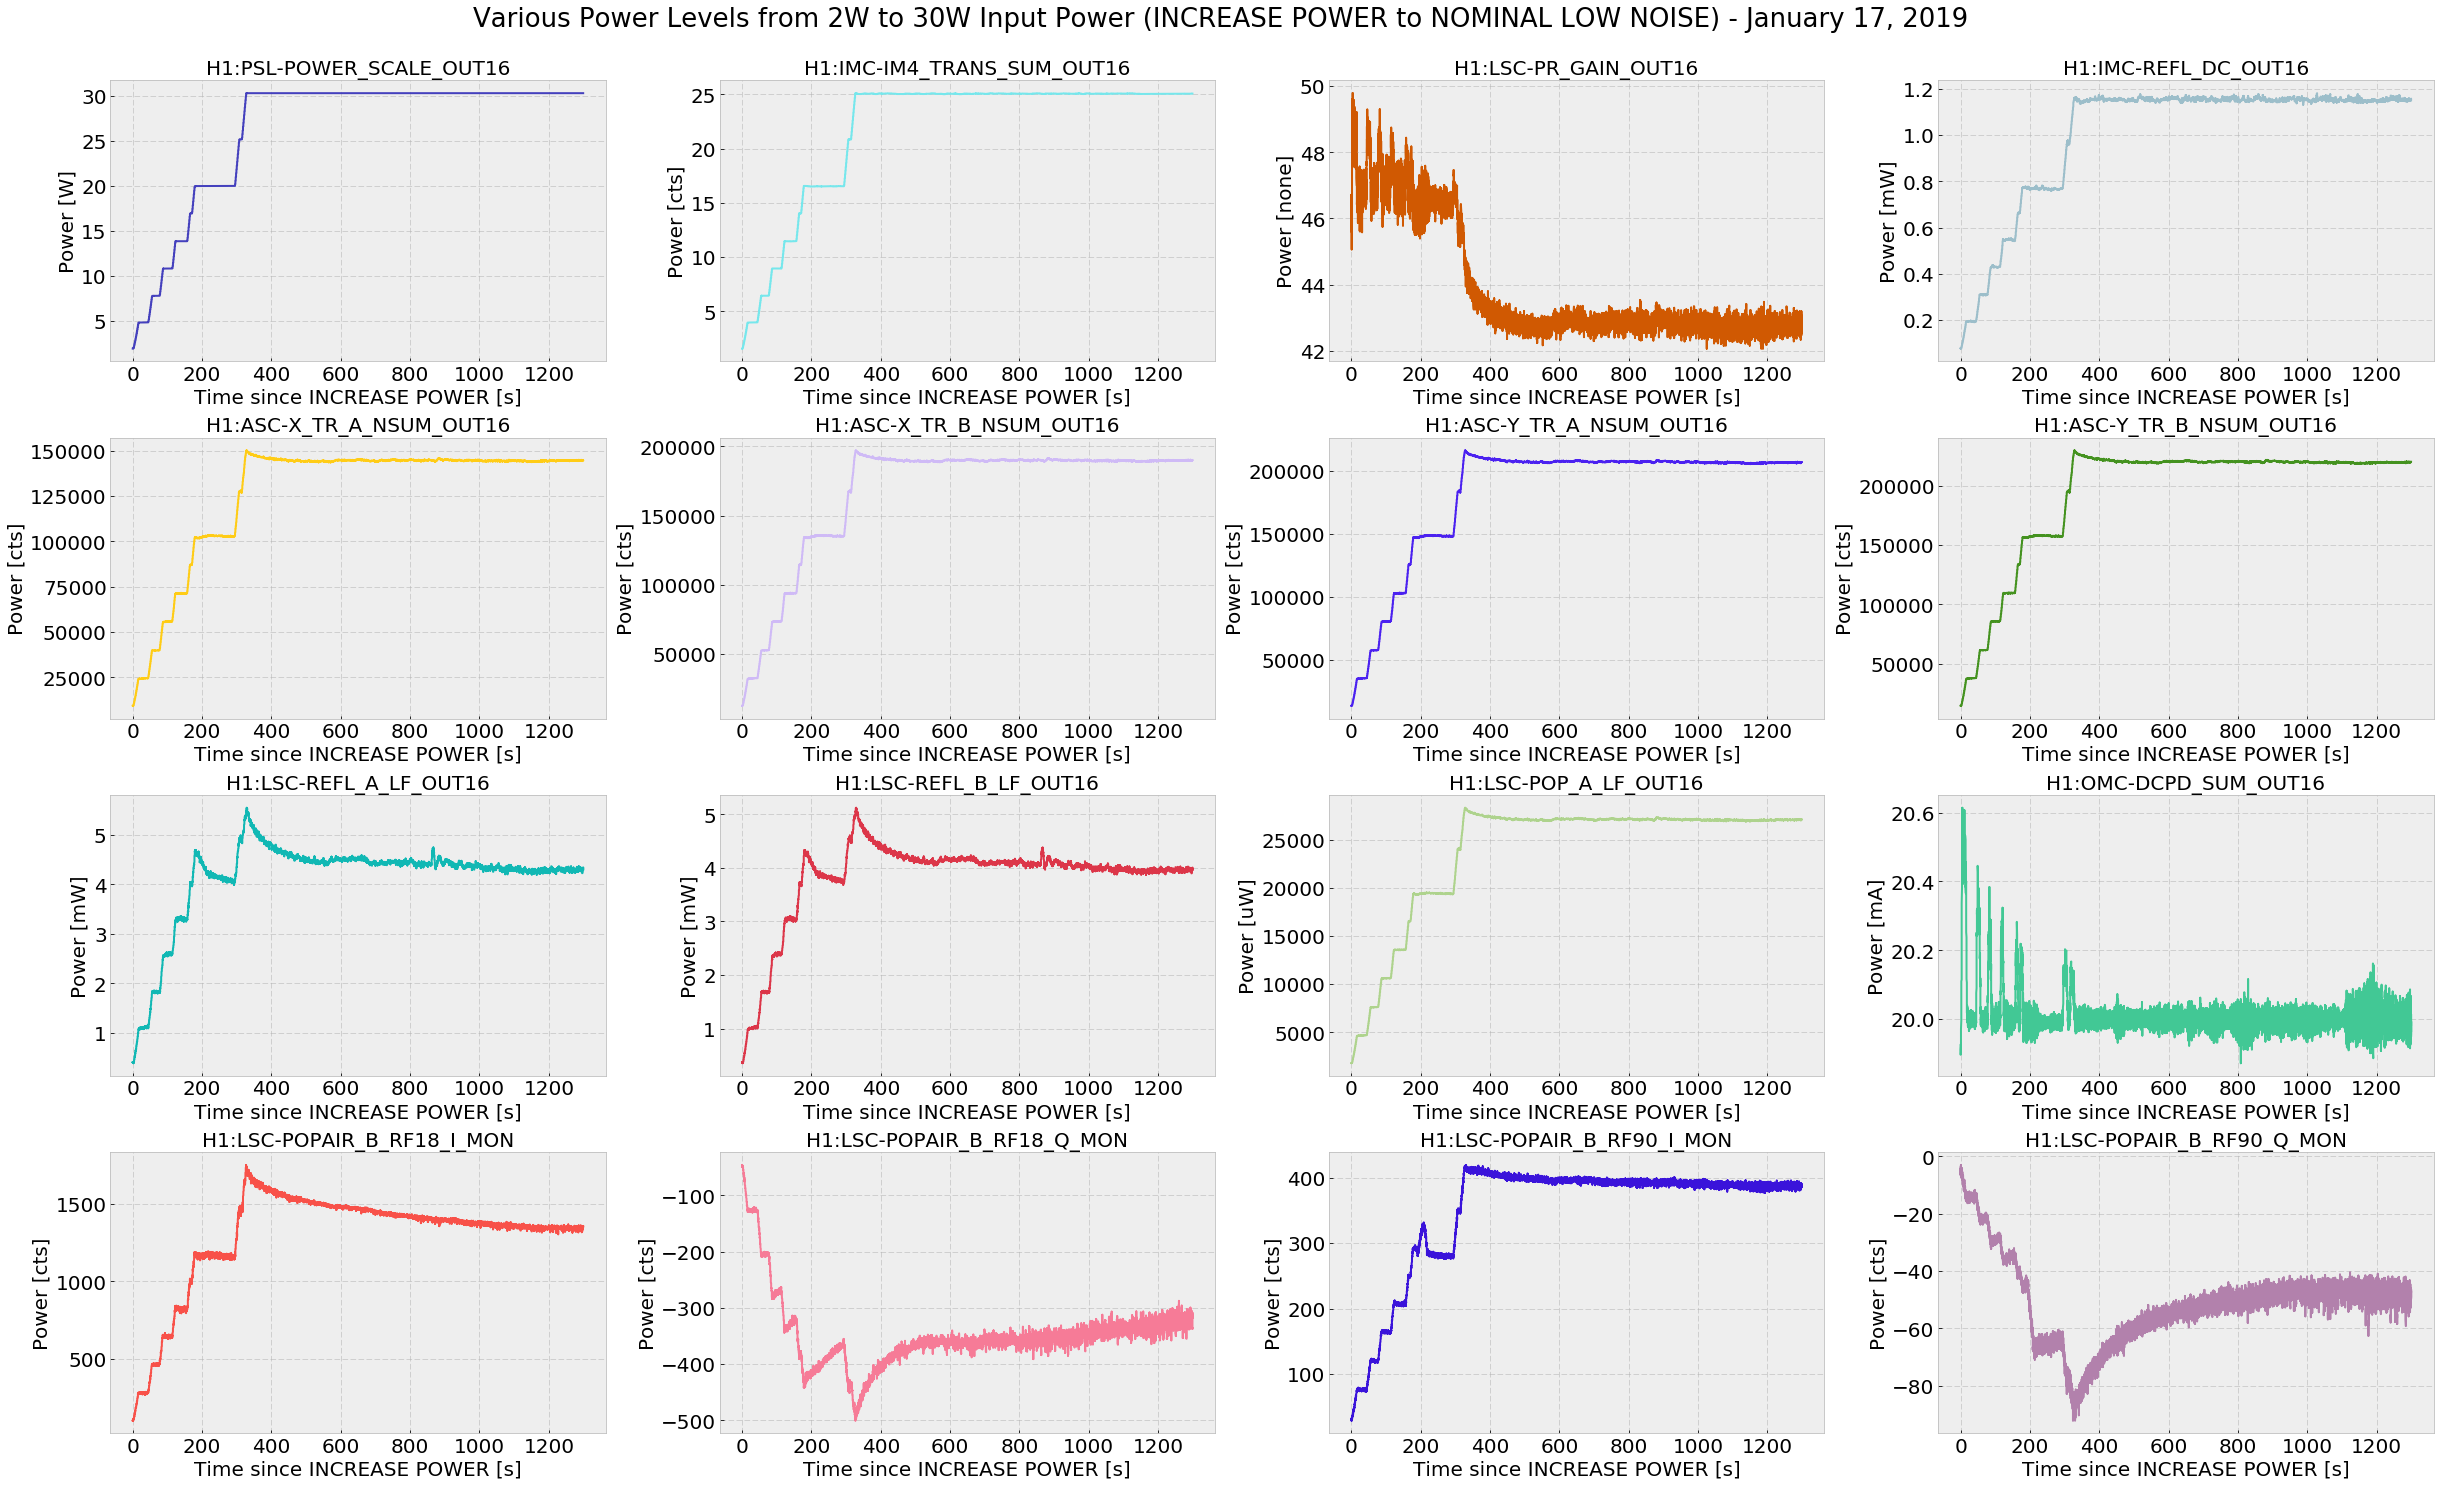
I've looked at most of the power ports of the interferometer to try to get a feel for how IFO thermalization is affecting power levels.

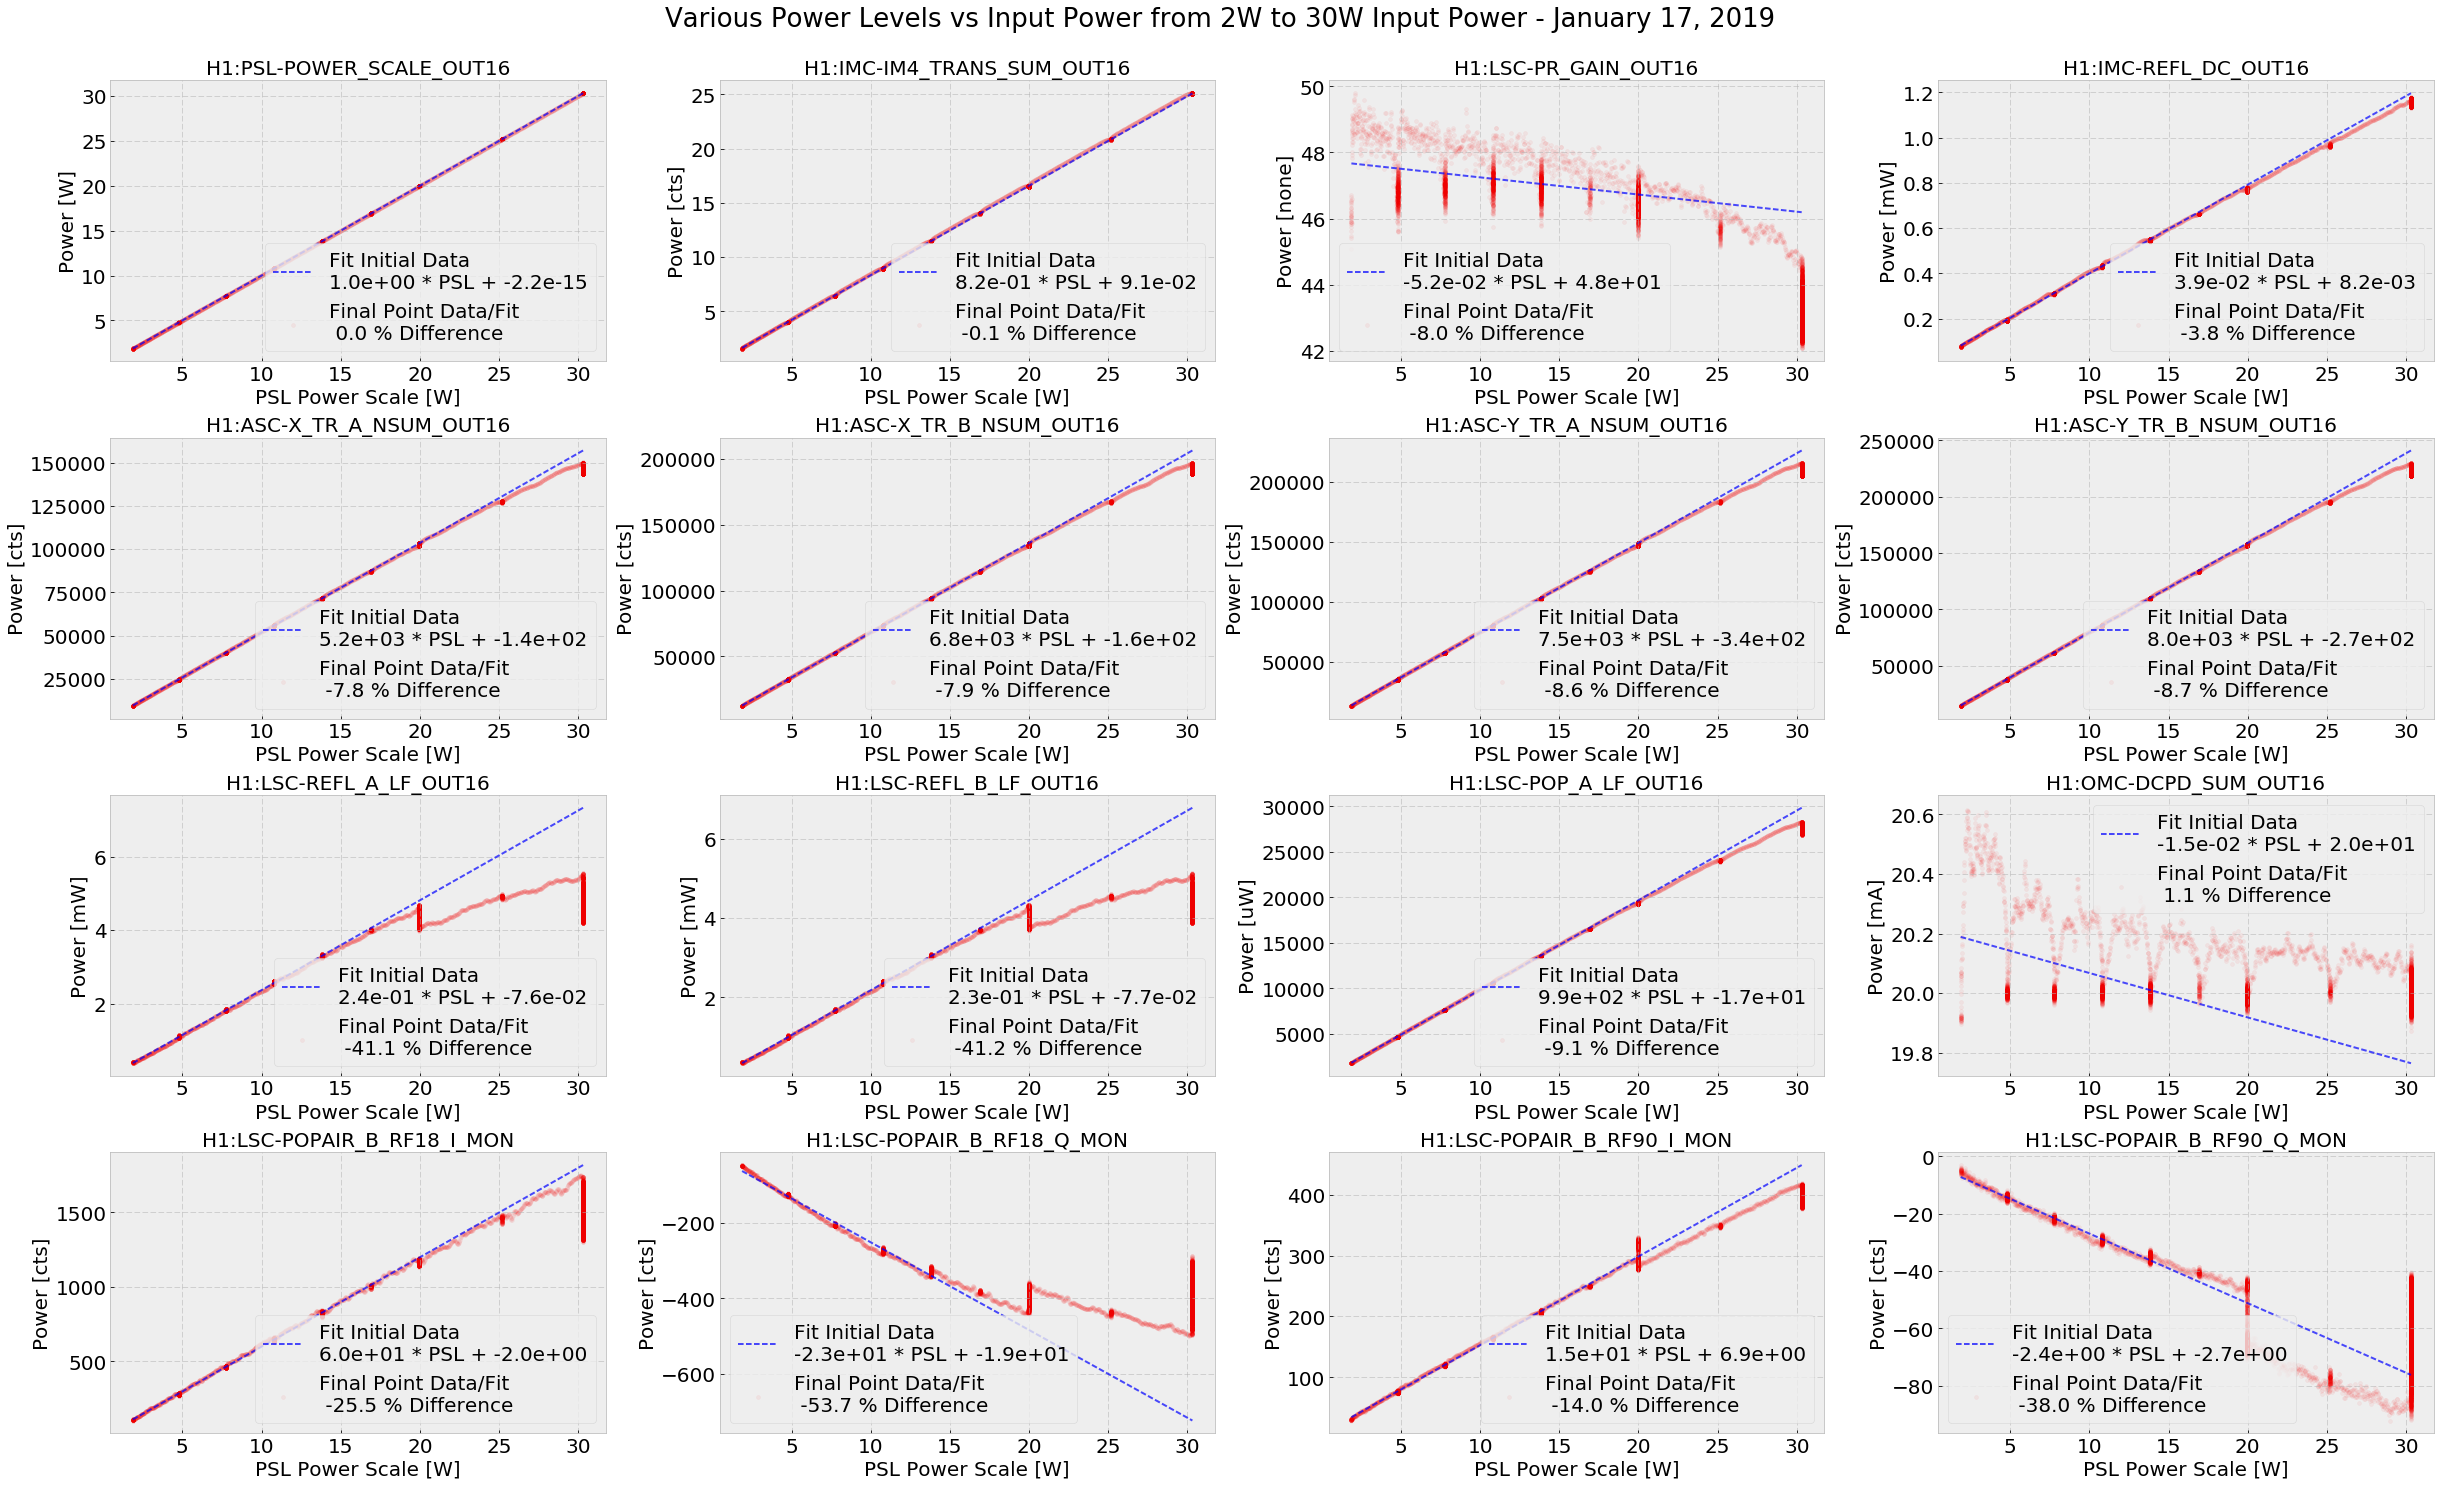
I looked at the time series of the PSL power, PR gain, Arms Transmission, REFL A/B LF, POP LF, and POP 18/90 I/Q from the beginning of a Jan 17 INCREASE POWER to NOMINAL LOW NOISE state transition.
- We reduced 45 modulation depth by 3 dB (from 27 to 24 dB on the 45 RFSET slider) at around 200 seconds at 20 W input power. 
- We did NOT reduce RF 9 modulation depth.
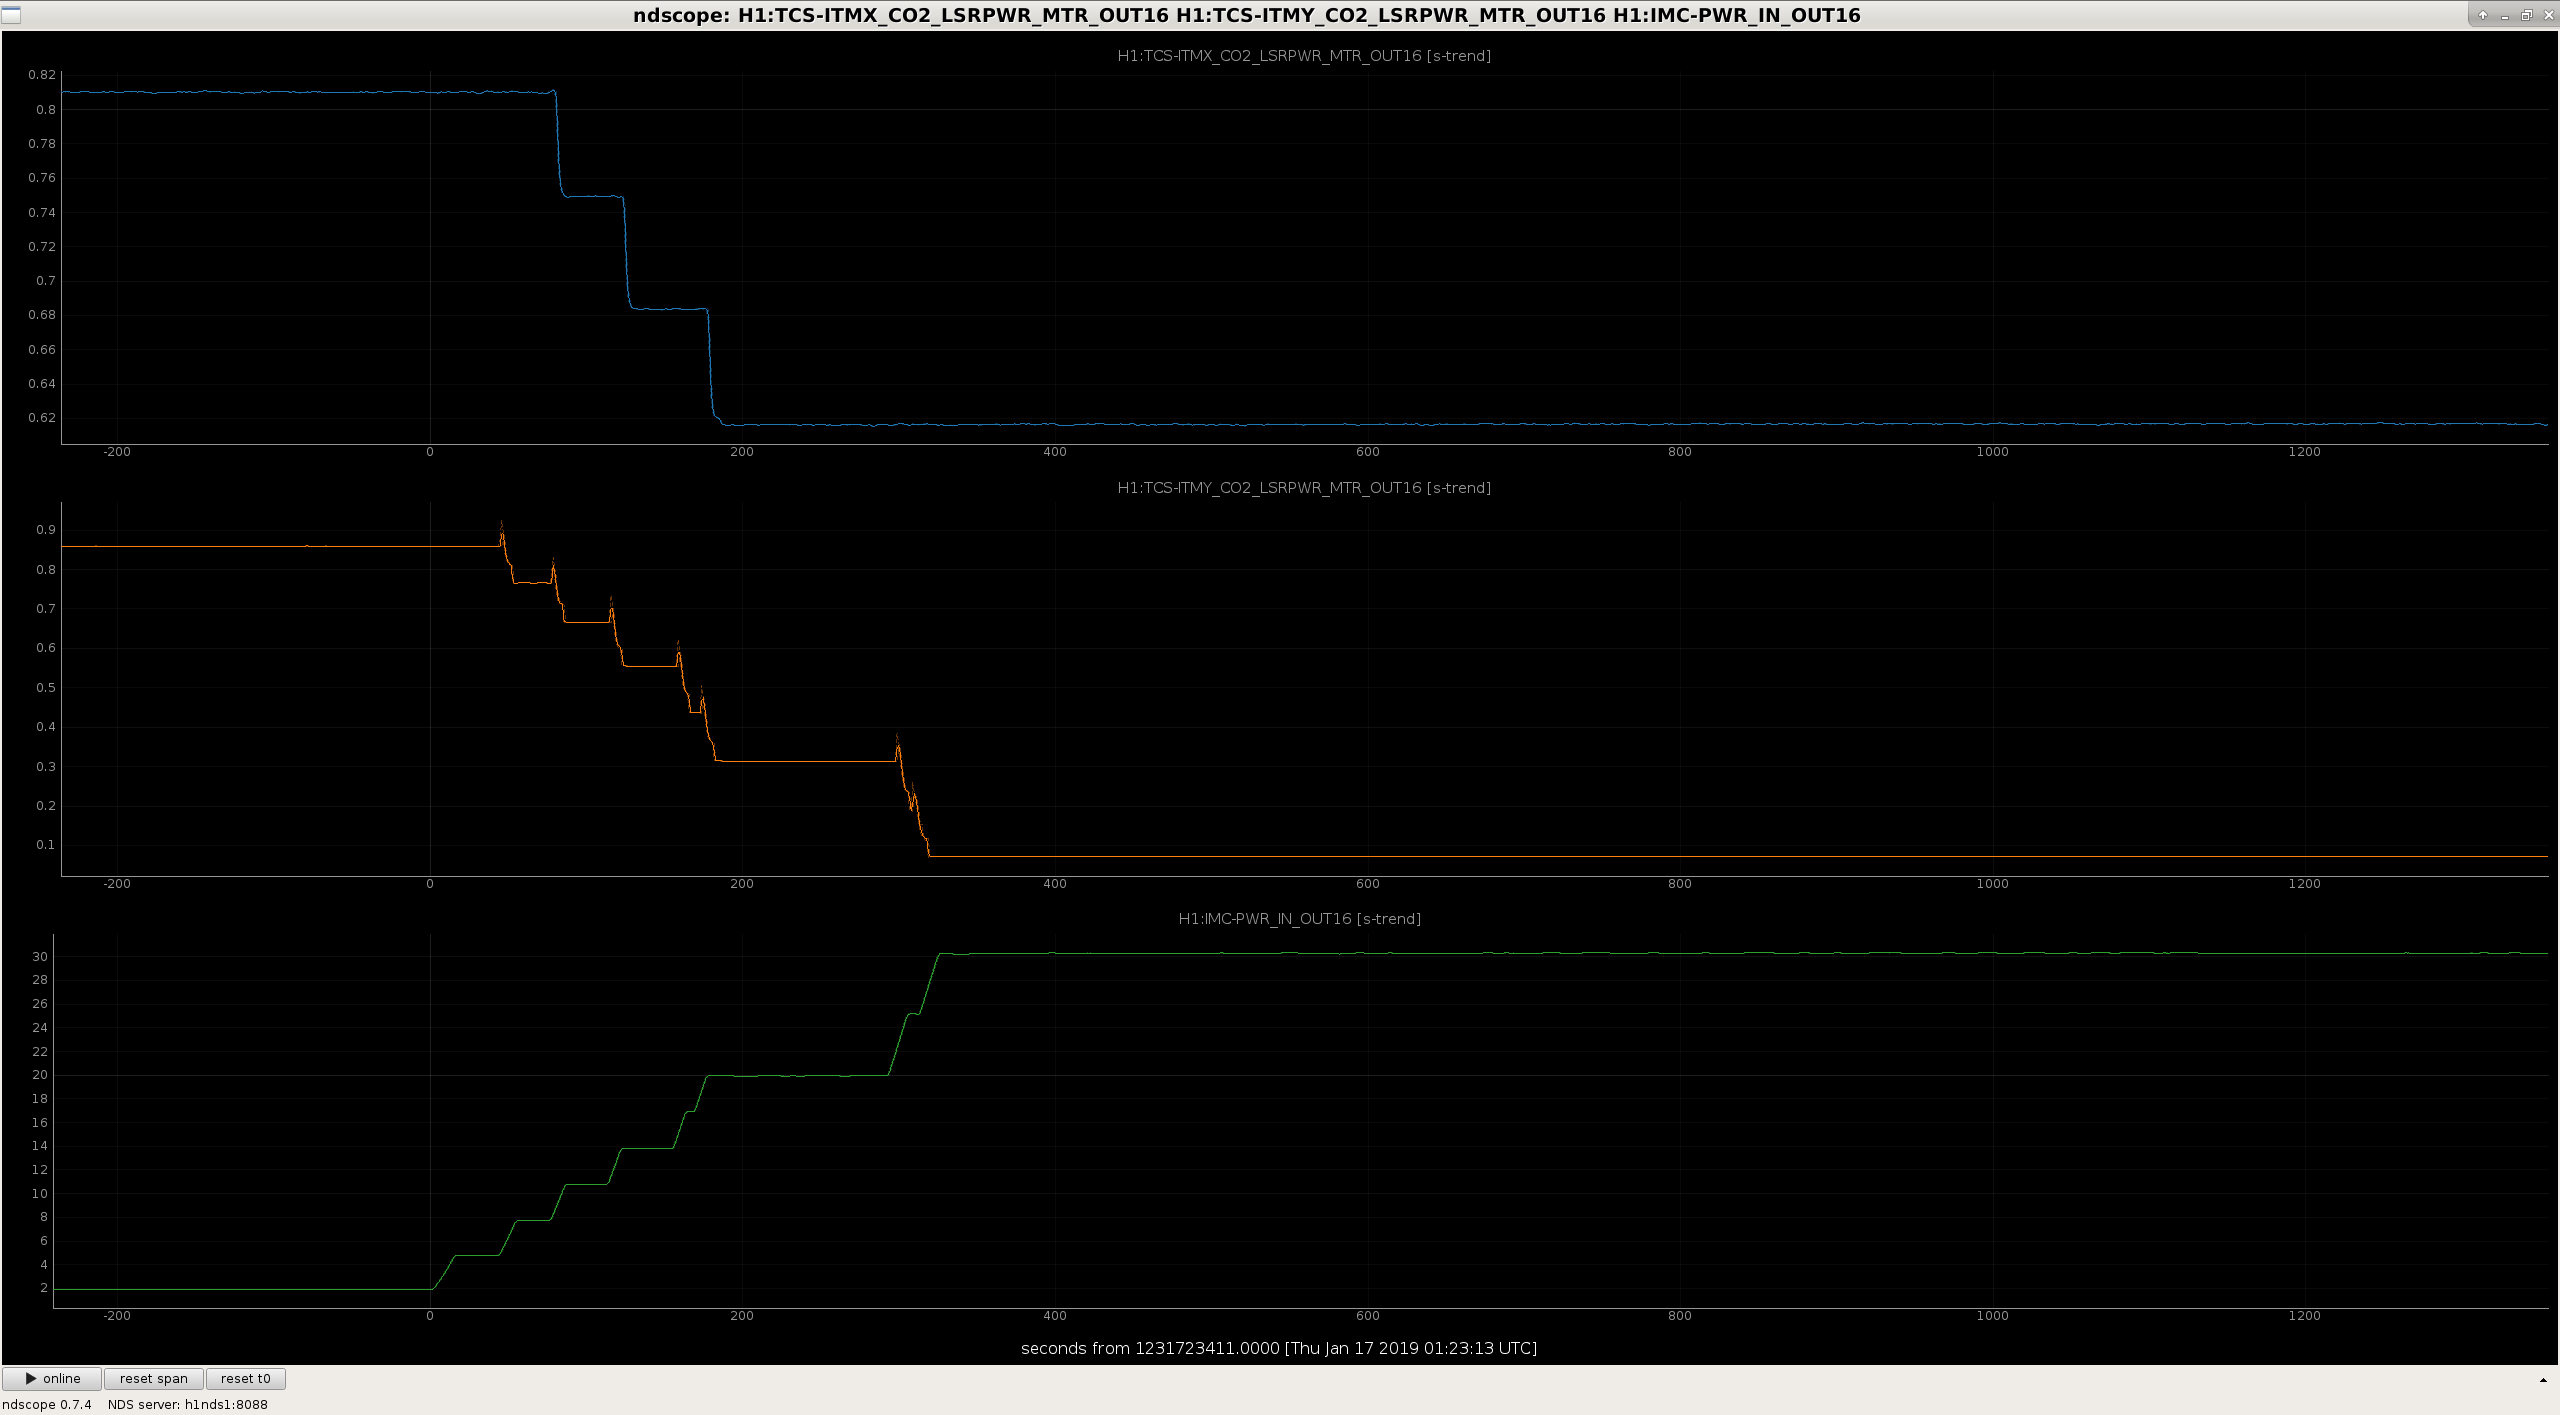
- Within the first 180 seconds, the TCS CO2 X moved from 0.81 to 0.62 W, and TCS CO2 Y moved from 0.86 to 0.07 W.

In attachment two, I fit a line to each of the early-stage power up numbers (from the first 150 seconds) to indicate what a linear response to power increases ought to look like.
When powering up from 2 to 30 W:
- The arm transmissions fall by 8%.  
- POP LF falls by 9%.  This means most of our PRG thermalization losses in build-up come from increased arm losses.
- REFL LF lost 41%.  The REFL port is more complex because the CARM loop is trying to keep it as dark as possible in carrier, and PRCL is trying to keep 9 MHz on resonance as well.  REFL LF is probably mostly seeing the collapse of the 9 MHz sidebands, along with some 8% losses from the arms, and 15% losses from the 3 dB 45 MHz mod depth reduction.
- POP 18 lost 26%.
- POP 45 lost 14%.  7% comes from the modulation depth reduction.


Images attached to this report
H1 ISC (ISC)
georgia.mansell@LIGO.ORG - posted 02:35, Monday 21 January 2019 - last comment - 03:35, Monday 21 January 2019(46554)
Locking notes from tonight - remaining dithers moved, a nice quiet lock stretch, 50Hz noise

Skipped initial alignment. Worked ok, not sure if it saved time, I had to do quite a bit of by-hand alignment during lock acquisition.

Sheila previously suggested the ALS Y arm glitches show up when it is raining. I noticed that this afternoon ALS Y arm glitches were frequent, and it was raining. Now the y-arm glitches are gone and it is not raining. Coincidence?

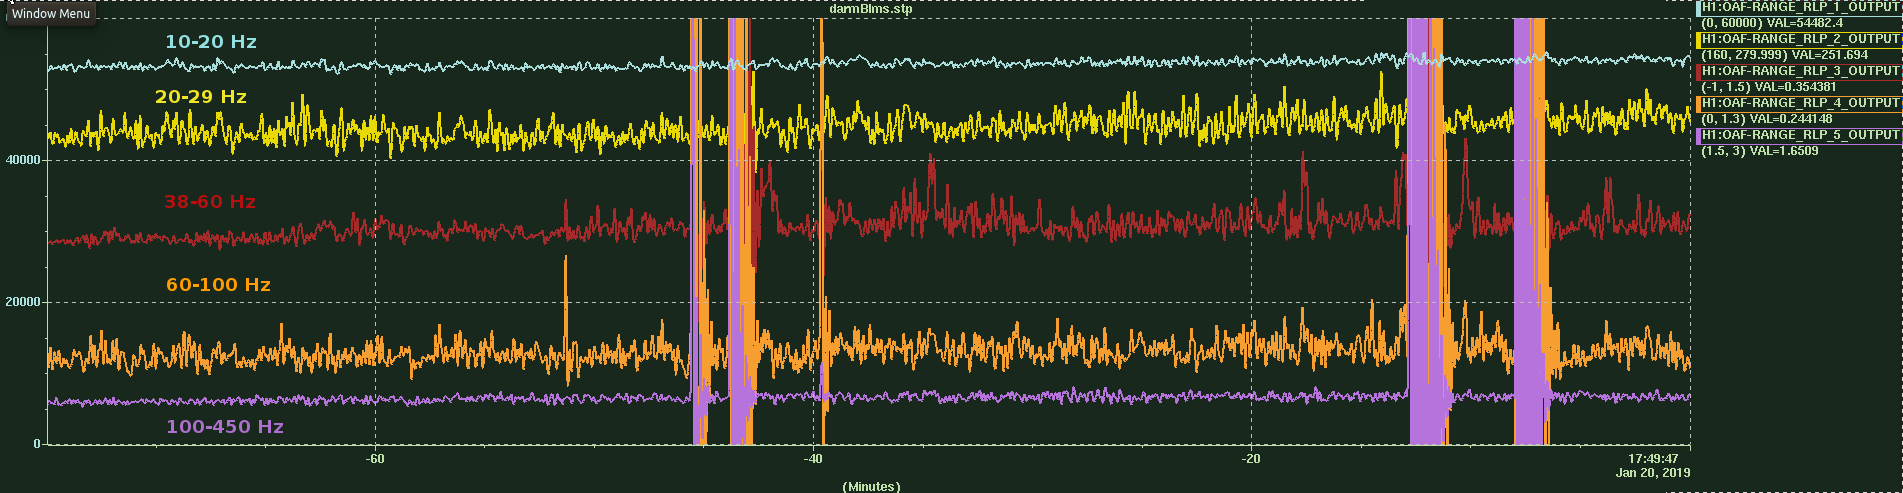
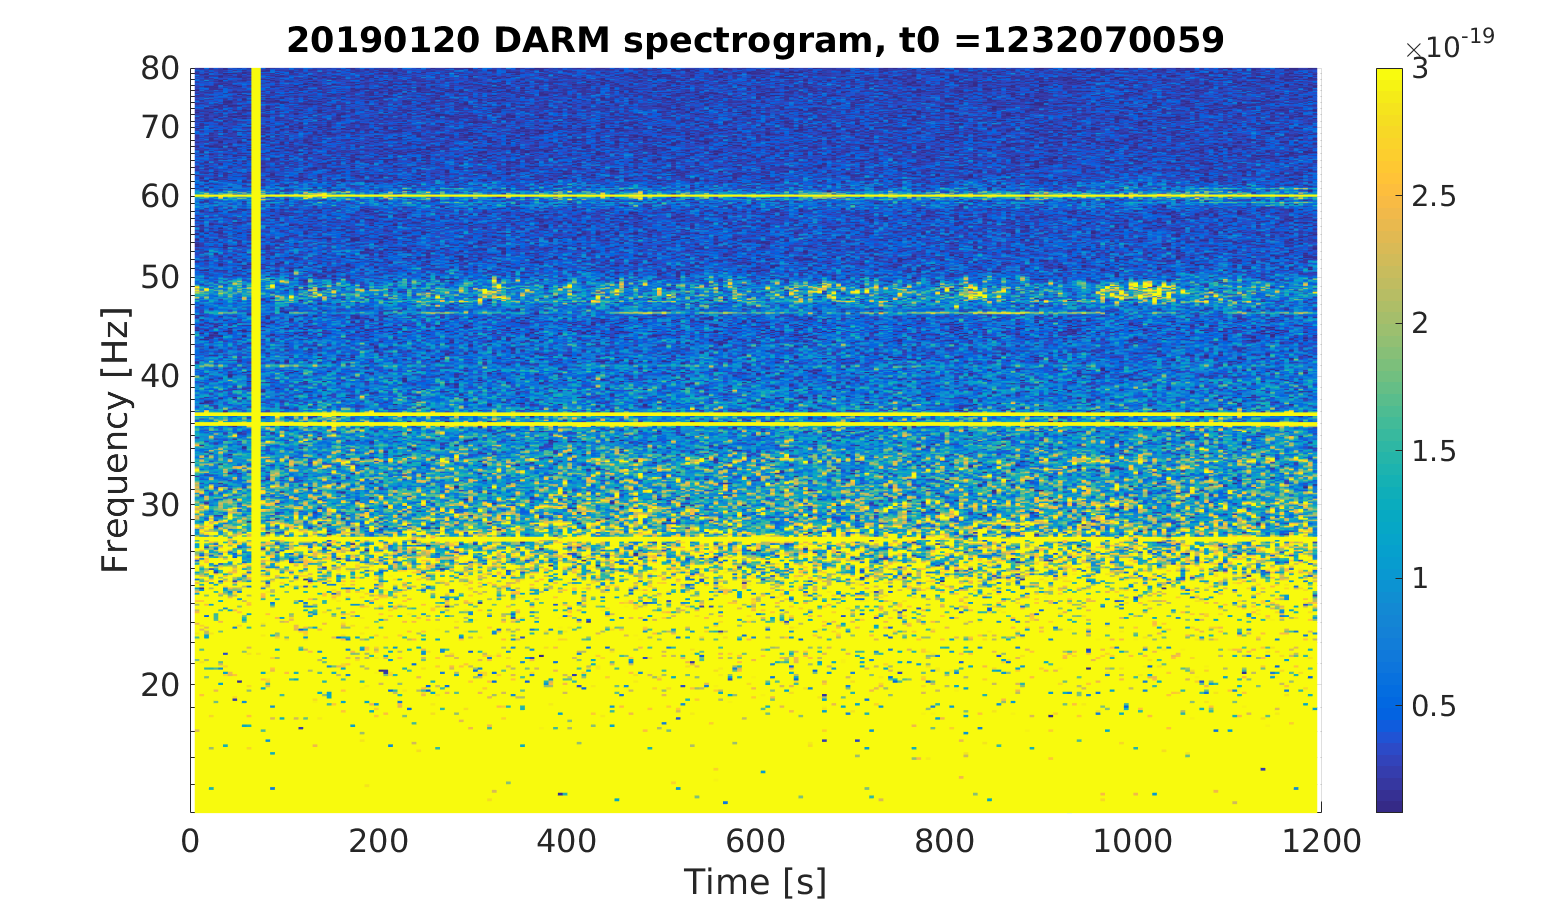
Had 45 mins of NLN with no glitches, 1232065259 - 1232057789. Later in the same lock a ~50Hz scatter-looking lump showed up. First attached figure is DARM BLRMS as the lump first showed up, with excess noise in the red BLRMS progressively gets worse. The second attached figure is a spectrogram for a period later in the lock, also showing line at 46.1 Hz line that drifts in and out of the spectrum.

Moved ads dither lines (PIT3, YAW3, YAW5), implemented in guardian. The gains and phases of these loops will likely need further fine tuning in the future, so far we've successfully acquired and powered up with the new lines. In a later lock I had problems engaging the other dither loops due to a low frequency ring up. I reduced the gain of the dither loops during acquisition, and re-increased the gain in the INCREASE_POWER state so we don't spend too much time waiting for things to converge.


Had several locklosses from ENGAGE_ASC_FOR_FULL_IFO, where SRC1, SRC2, PRC1, PRC2 yaw ran away after increasing the PRC1, PRC2 and SRC1 gains. Made the convergence checker for PRC2 and SRC2 stricter and increased wait times, PRC2 is especially slow to converge.


Craig plugged in the SR785 by the PSL racks to take CARM transfer functions, this made the 120 Hz line worse, and in the next two locks we had broadband noise DARM that was coherent with excess noise also visible in SRCL and PRCL. In one lock the noise was at ~750 Hz, and the next from ~80-400 Hz. We went out to unplug the SR785 through the main door to the LVEA and lost lock when tip toeing past HAM2. In the next lock, with the SR785 unplugged, the noise was gone. We went back into the LVEA to plug the SR785 back in, this time through the back door, and again lost lock while tiptoeing past IOT2L.

Images attached to this report
Comments related to this report
craig.cahillane@LIGO.ORG - 03:35, Monday 21 January 2019 (46555)ISC
Picture of SR785 coupling to SRCL, PRCL, MICH, and DARM, but curiously not CARM.  The SR785 was plugged into TEST1, TEST2, and EXC A of the common mode board.  The PSL ground loop is somehow strongly coupling to the POP error signals, particularly POP9.  The mechanism of this coupling is still unclear.

I've plugged the SR785 back in for more CARM loop measurements, and the increased broadband noise is not here as of now.  
Images attached to this comment
H1 IOO (IOO, SUS)
cheryl.vorvick@LIGO.ORG - posted 23:54, Saturday 19 January 2019 (46549)
Power Spectrum and Coherence for MC1-MC3 and IM1-IM4, taken 4 days this month

Some were taken during NLN, others are full lock, but not yet NLN.  January 3rd, 13th, 15th, and 17th.

Non-image files attached to this report
H1 AOS (SQZ)
terry.mcrae@LIGO.ORG - posted 17:09, Saturday 19 January 2019 (46547)
HAM6 fiber feed-through tests


Performed the tests Fabrice suggested below, basically cleaning, inspecting measuring fibers and sleeves at the HAM6 green fiber feed-through, with no improvement.

1 - Couple a new low insertion loss fiber (let's call it 'Air-3') after the the current one ('Air-2'), and check the transmission.
2 - Remove the mating sleeve at the feedthru,  gently clean the tip of the of the feedthru ferule. Spray air in the mating sleeve and put it back on.
3 - Connect 'Air-3' to the feethru, and check the transmission.
4-  Remove 'Air-3' from the chain

Initial power 20.4mW at input coupler -> 2.6mW out on green Refl.
Take out 'Air-2' inspect, -> transmission=12.5 mW. 'Air-2' looked scratched replaced with 'Air-2_5'  transmission 12.6 mW (end A/B insertion loss .41/ .45 dB)

'Air-3' (end A/B insertion loss = .10/.15 dB). Power trans 'Air-3' = 10.5 mW. Remove mating sleeve at feed-through, clean feed-through ferrule, spray mating sleeve replace. Insert 'Air-3' transmission on green Refl = 0.5 mW

Remove 'Air-3', clean 'Air-2_5' again insert -> 1.5 mW onto green Refl.

Put original 'Air-2' back -> 2.6 mW on green refl.

This is now the max. I could not recover any more power regardless of how "loose" or "tight" the connection was. It's possible the ferrule may have been scratched or got contaminated when putting the sleeve back on (it's rather awkward). The ferrule can be cleaned but not inspected because of the location. After the 1.5mW transmission measurement with Air-2_5'  I was just glad to recover 2.6 mW transmission with 'Air-2' to green Refl, which after Nutsinee's latest post, still allows us to move on for a bit.

Note 'Air-2' had very low insertion loss at the HAM6 end (.15 dB) and this is probably why the transmission to the vacuum fiber was better than 'Air-2_5' even though 'Air-2' was scratched.


H1 IOO (IOO)
cheryl.vorvick@LIGO.ORG - posted 16:29, Saturday 19 January 2019 (46546)
The optic, IO_MB_M3, replaced in the main beam, has multiple damage sites that are consistant with the amount of scatter

On Jan. 15th I replaced IO_MB_M3, which is in the main beam, in the IO path on the PSL.

After Robert added the tuned damper, I replaced the optic, and realigned the IMC_IN beam, using my GigE cameras, and the single bounce off of MC1 to the IMC WFS, and the results are that the IMC optics changed 5urad or less in each DOF from before the optic swap, results described in detail in alog 46436.

Robert found the jitter peak from this optic was greatly reduced, described in alog46494.

I've cleaned and inspected the optic that was removed, and found 6 small dings in an arc on the front surface, ranging from about 3mm to 16mm from the center of the 2 inch optic.

These damage sites are consistent with what was likely considered minor impact, and with the scattering from the optic.

I can't yet confirm that the scattering has been reduced with the new optic, as there was no time to evaluate.  I will evaluate at the next possible opportunity.

The attached files show two views of the optic's damage, and those features that are on the front surface are circled in yellow.  Both files are ~8MB.

Non-image files attached to this report
H1 SQZ (SQZ)
nutsinee.kijbunchoo@LIGO.ORG - posted 15:26, Saturday 19 January 2019 (46545)
Squeezer is healthy, ~4dB squeezing possible

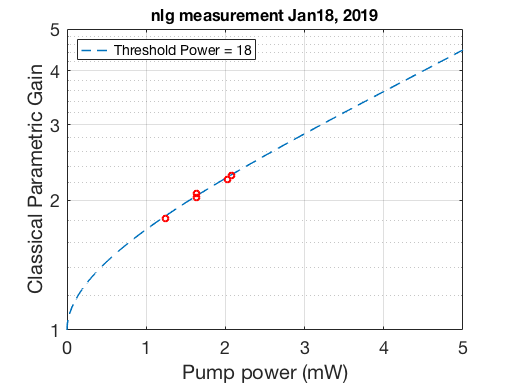
Yesterday I double checked that our threshold power still makes sense compared to alog45528. This could be an indication that our crystal is doing fine. The measurement was taken with 20dB attenuator on 80MHz RF modulation.

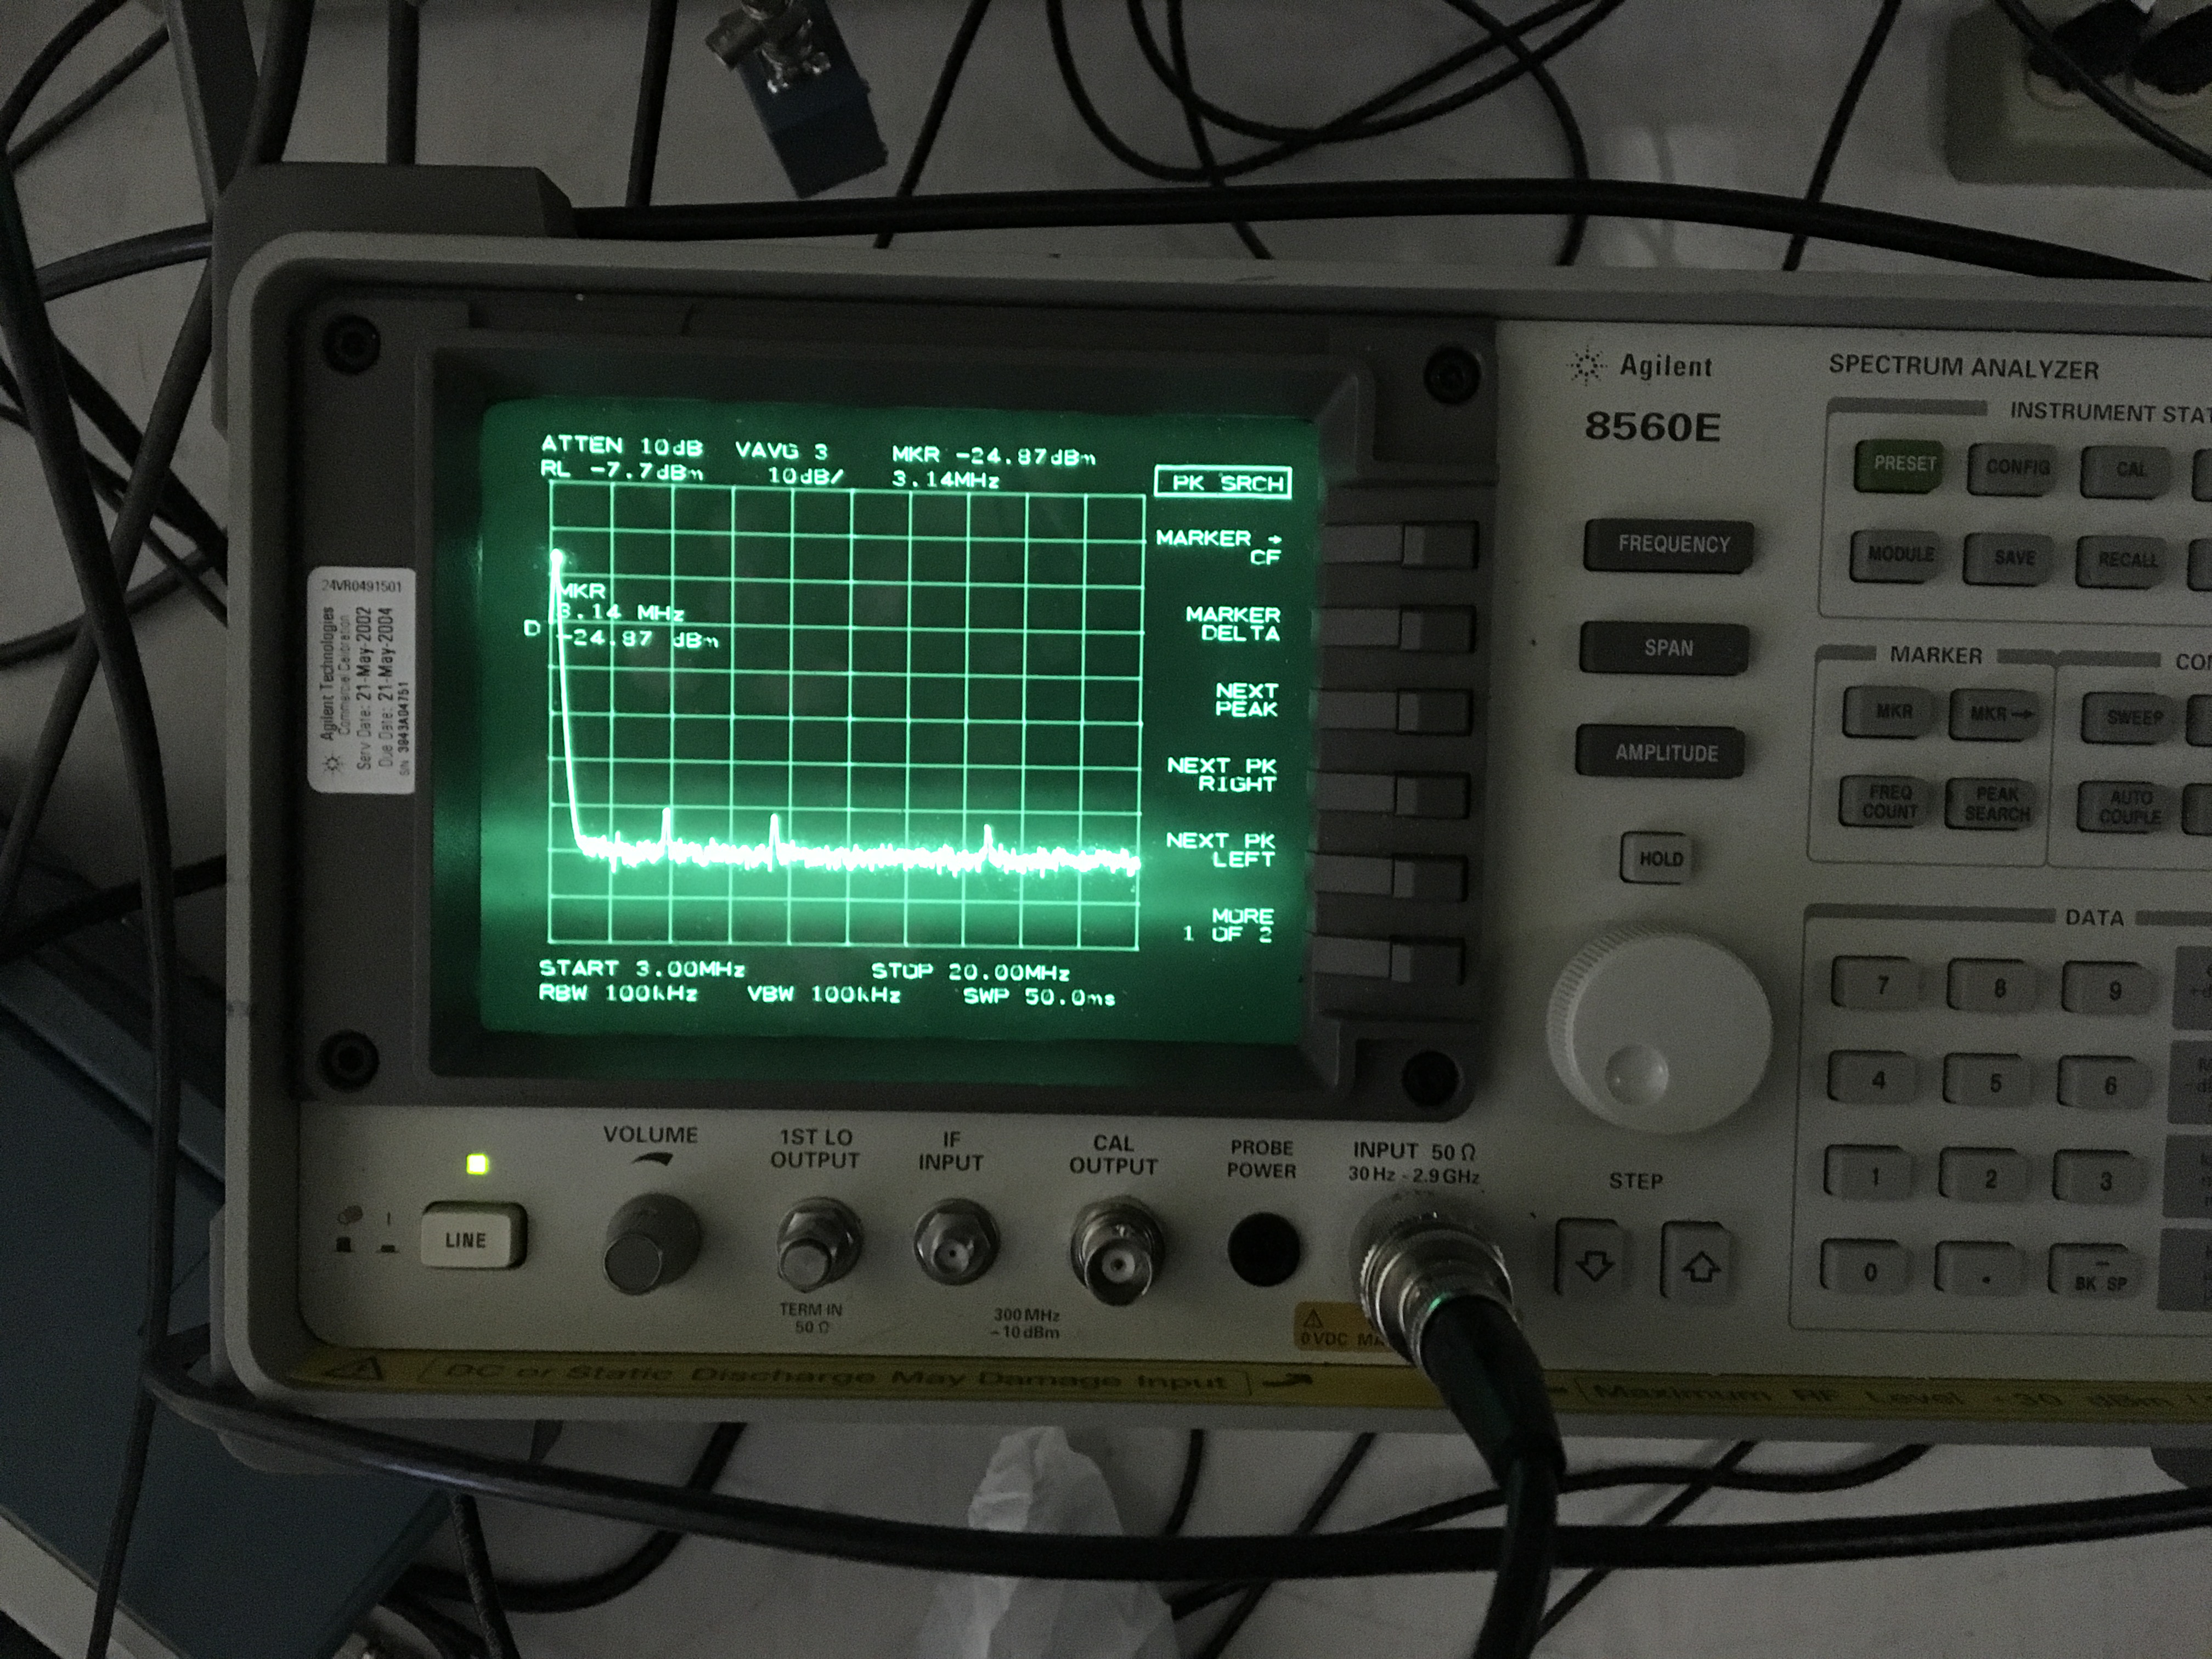
I measured SQZ/ASQZ using Mephisto LO to get a direct comparison to alog45586. Along the way I found that I have been saturating the homodyne (I normally set the RF analyzer to 1MHz - 5MHz so I missed all the peaks at 6, 9, 12, ... MHz). I used LO power of 0.5mW and CLF of 5uW. The total power was less than what we used back in August (alog43738) which we used 1 mW LO power and 10uW seed without saturating the homodyne.

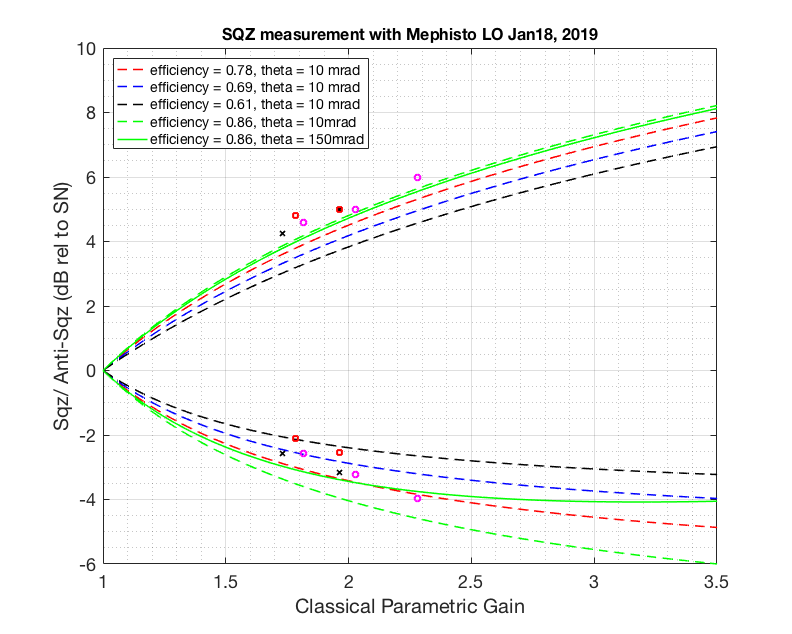
Attached a sqz/asqz result. The magenta/round datapoint were taken with 20dB attenuator on the 80MHz modulation signal, HD not saturated. The black Xes were taken without 20 dB attenuator on the 80MHz modulation signal to ensure that extra 80MHz sidebands do no harm (except that we get less non linear gain). The red round data points were taken when the HD was saturated. The CLF needed to be turned down by a factor of 10 (0.5uW total to the HD) for the HD to not saturate (where we saw no more 3MHz harmonics).

Looking at ASQZ alone it almost seems like we have 95% efficiency but you would need A LOT of phase noise to explain the squeezing. ASQZ also doesn't seem to be affected by extra phase noise introduced by the saturated homodyne, only sqz does (which makes sense, so I'm not sure if it totally explains what we measured with PSLLO here). But the fact that we can see 4dB here is a good enough indication that we can move on (and that we probably don't need to move the crystal). The solid green plot I tried giving it an arbitrary phase noise (that LLO found) just to see how that fits. If it's real I wouldn't know where that could have come from (it doesn't show on LO IMON). 


Images attached to this report
Non-image files attached to this report
H1 CDS (GRD)
david.barker@LIGO.ORG - posted 09:44, Saturday 19 January 2019 - last comment - 09:06, Tuesday 22 January 2019(46543)
trending h1guardian1 ethernet port statistics

Jonathan, TJ, Jamie, Dave:

Following h1guardian1's upgrade to a 2-cpu, 40 hyper-threaded core machine on Wednesday, I started trending its ethernet port statisics Friday afternoon. Every 10 minutes ifconfig reports the port input/output errors. Jamie and TJ will see if any EPICS-CA errors correlate to ethernet port issues.

When the script was started the only error was an accumulated 1048 receive overruns (i.e. RX FIFO errors). We suspected that these may have been acquired when h1pemey/DAQ were restarted Thursday.

No further errors have been seen since program start (see attachment)


Images attached to this report
Comments related to this report
thomas.shaffer@LIGO.ORG - 09:06, Tuesday 22 January 2019 (46562)

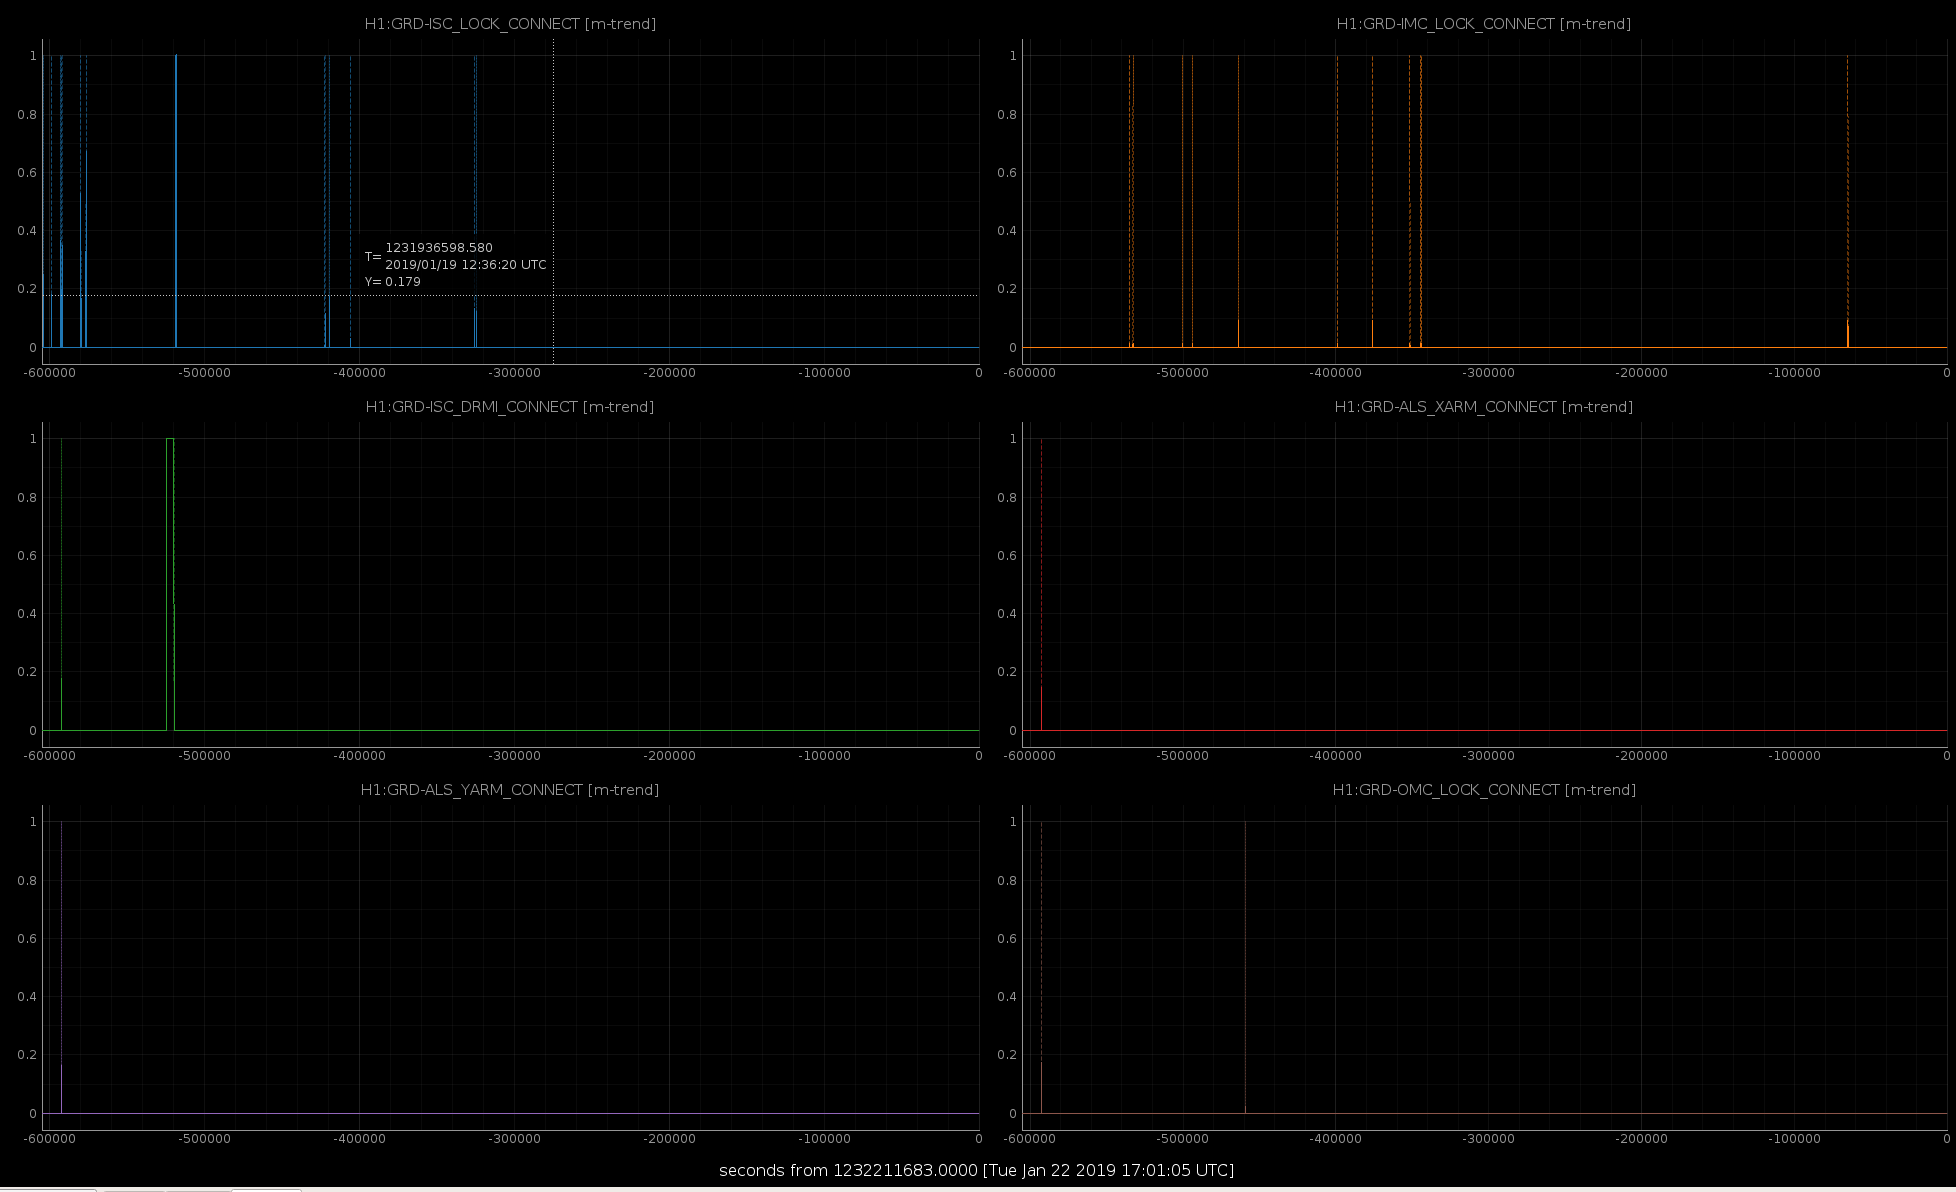
Just as a note to the connection errors with h1guardian1, I quickly trended the H1:GRD-{node}_CONNECT channel for 6 of the more used nodes (ISC_LOCK, IMC_LOCK, OMC_LOCK, ISC_DRMI, ALS_YARM, ALS_XARM) and there was only one connection error over the weekend. These nodes used to have multiple a day, so this seems like a good sign, but a more thorough investigation is still needed.

Images attached to this comment
H1 ISC (ISC)
craig.cahillane@LIGO.ORG - posted 06:21, Saturday 19 January 2019 - last comment - 18:40, Sunday 20 January 2019(46541)
RIN Investigations
Koji, Craig

Koji has the idea that maybe our IMC FSR is not exactly equal to our RF 9 modulation frequency, and this is responsible for additional 9 MHz RF AM seen by Sheila and Jenne.
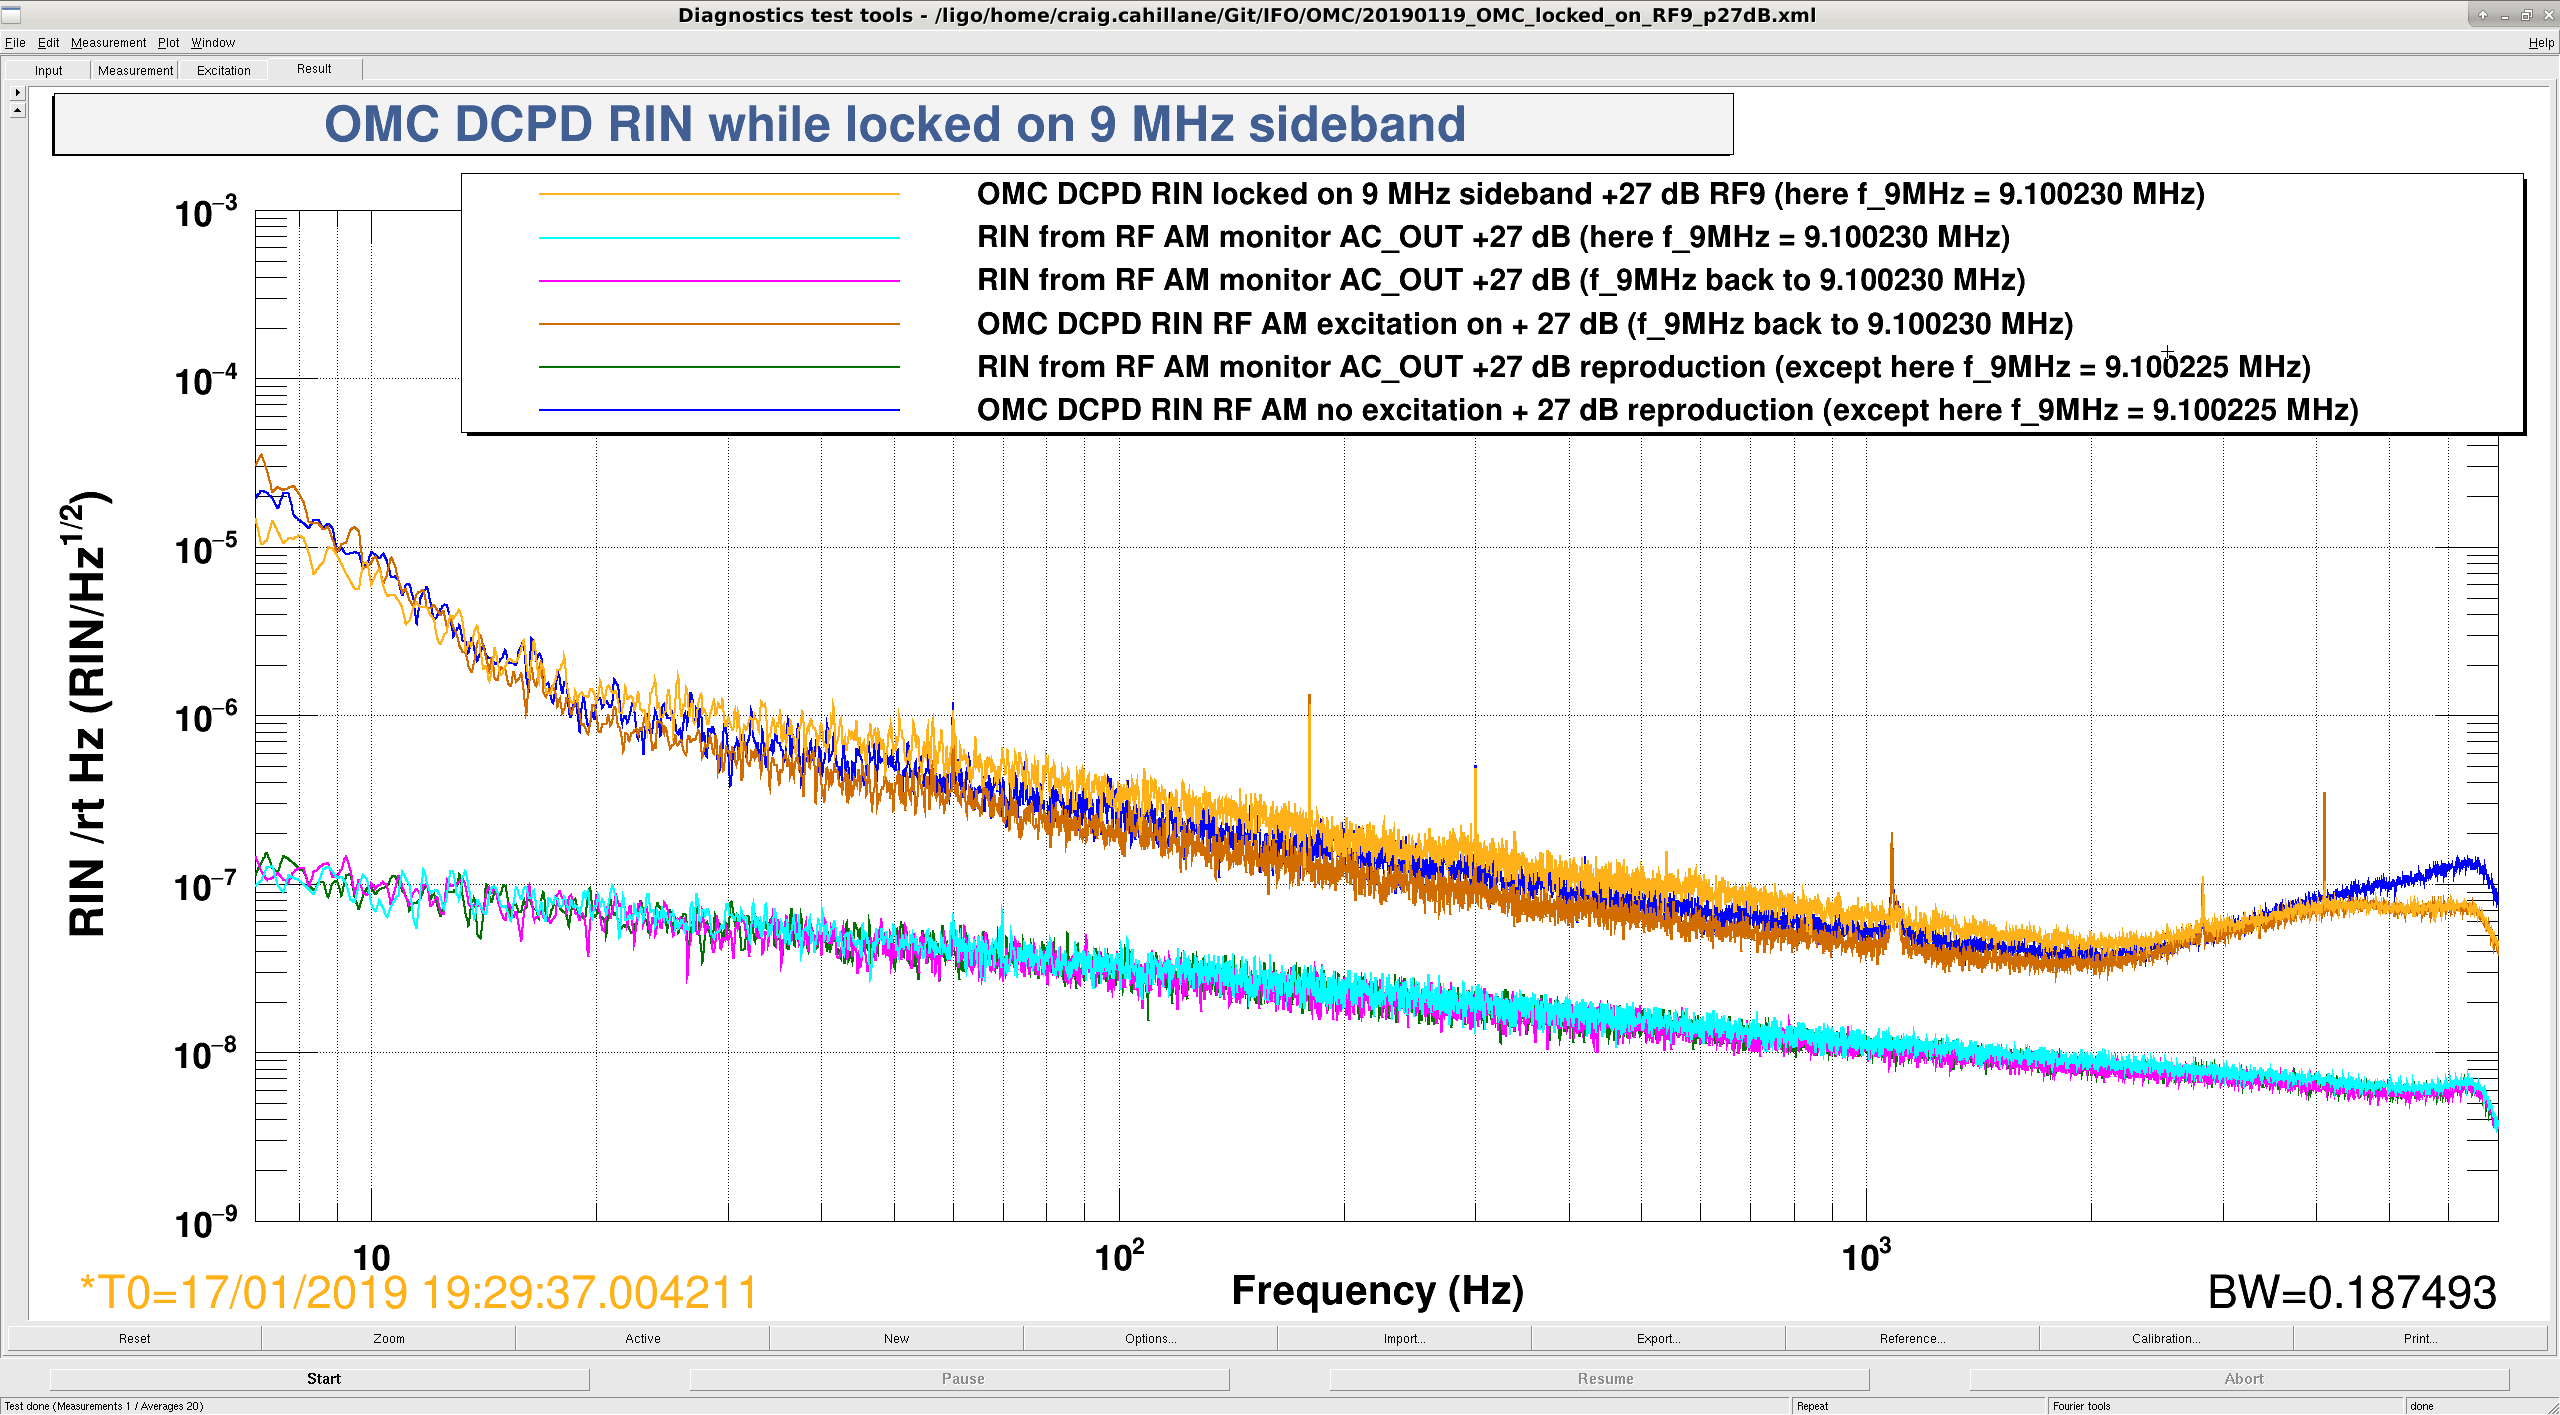
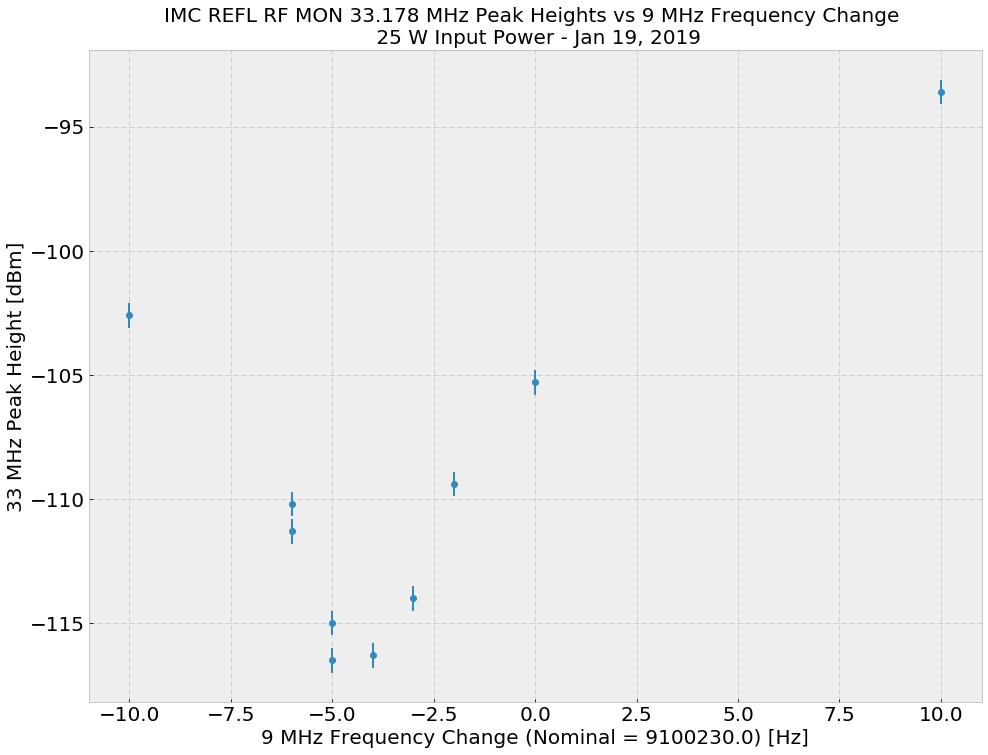
So today Koji and I moved the modulation frequency around.  We used the double modulation technique for finding the FSR by looking at the 24 + 9 = 33.178 MHz peak and trying to minimize it.  
We found that the frequency was already pretty well tuned.  We moved it around from 9.100230 MHz and found the best rejection of 33.178 MHz peak at 9.100225 MHz.  Larger movement of the modulation frequency (on the order of 10s of Hz) resulted in much higher 33.178 MHz peaks.

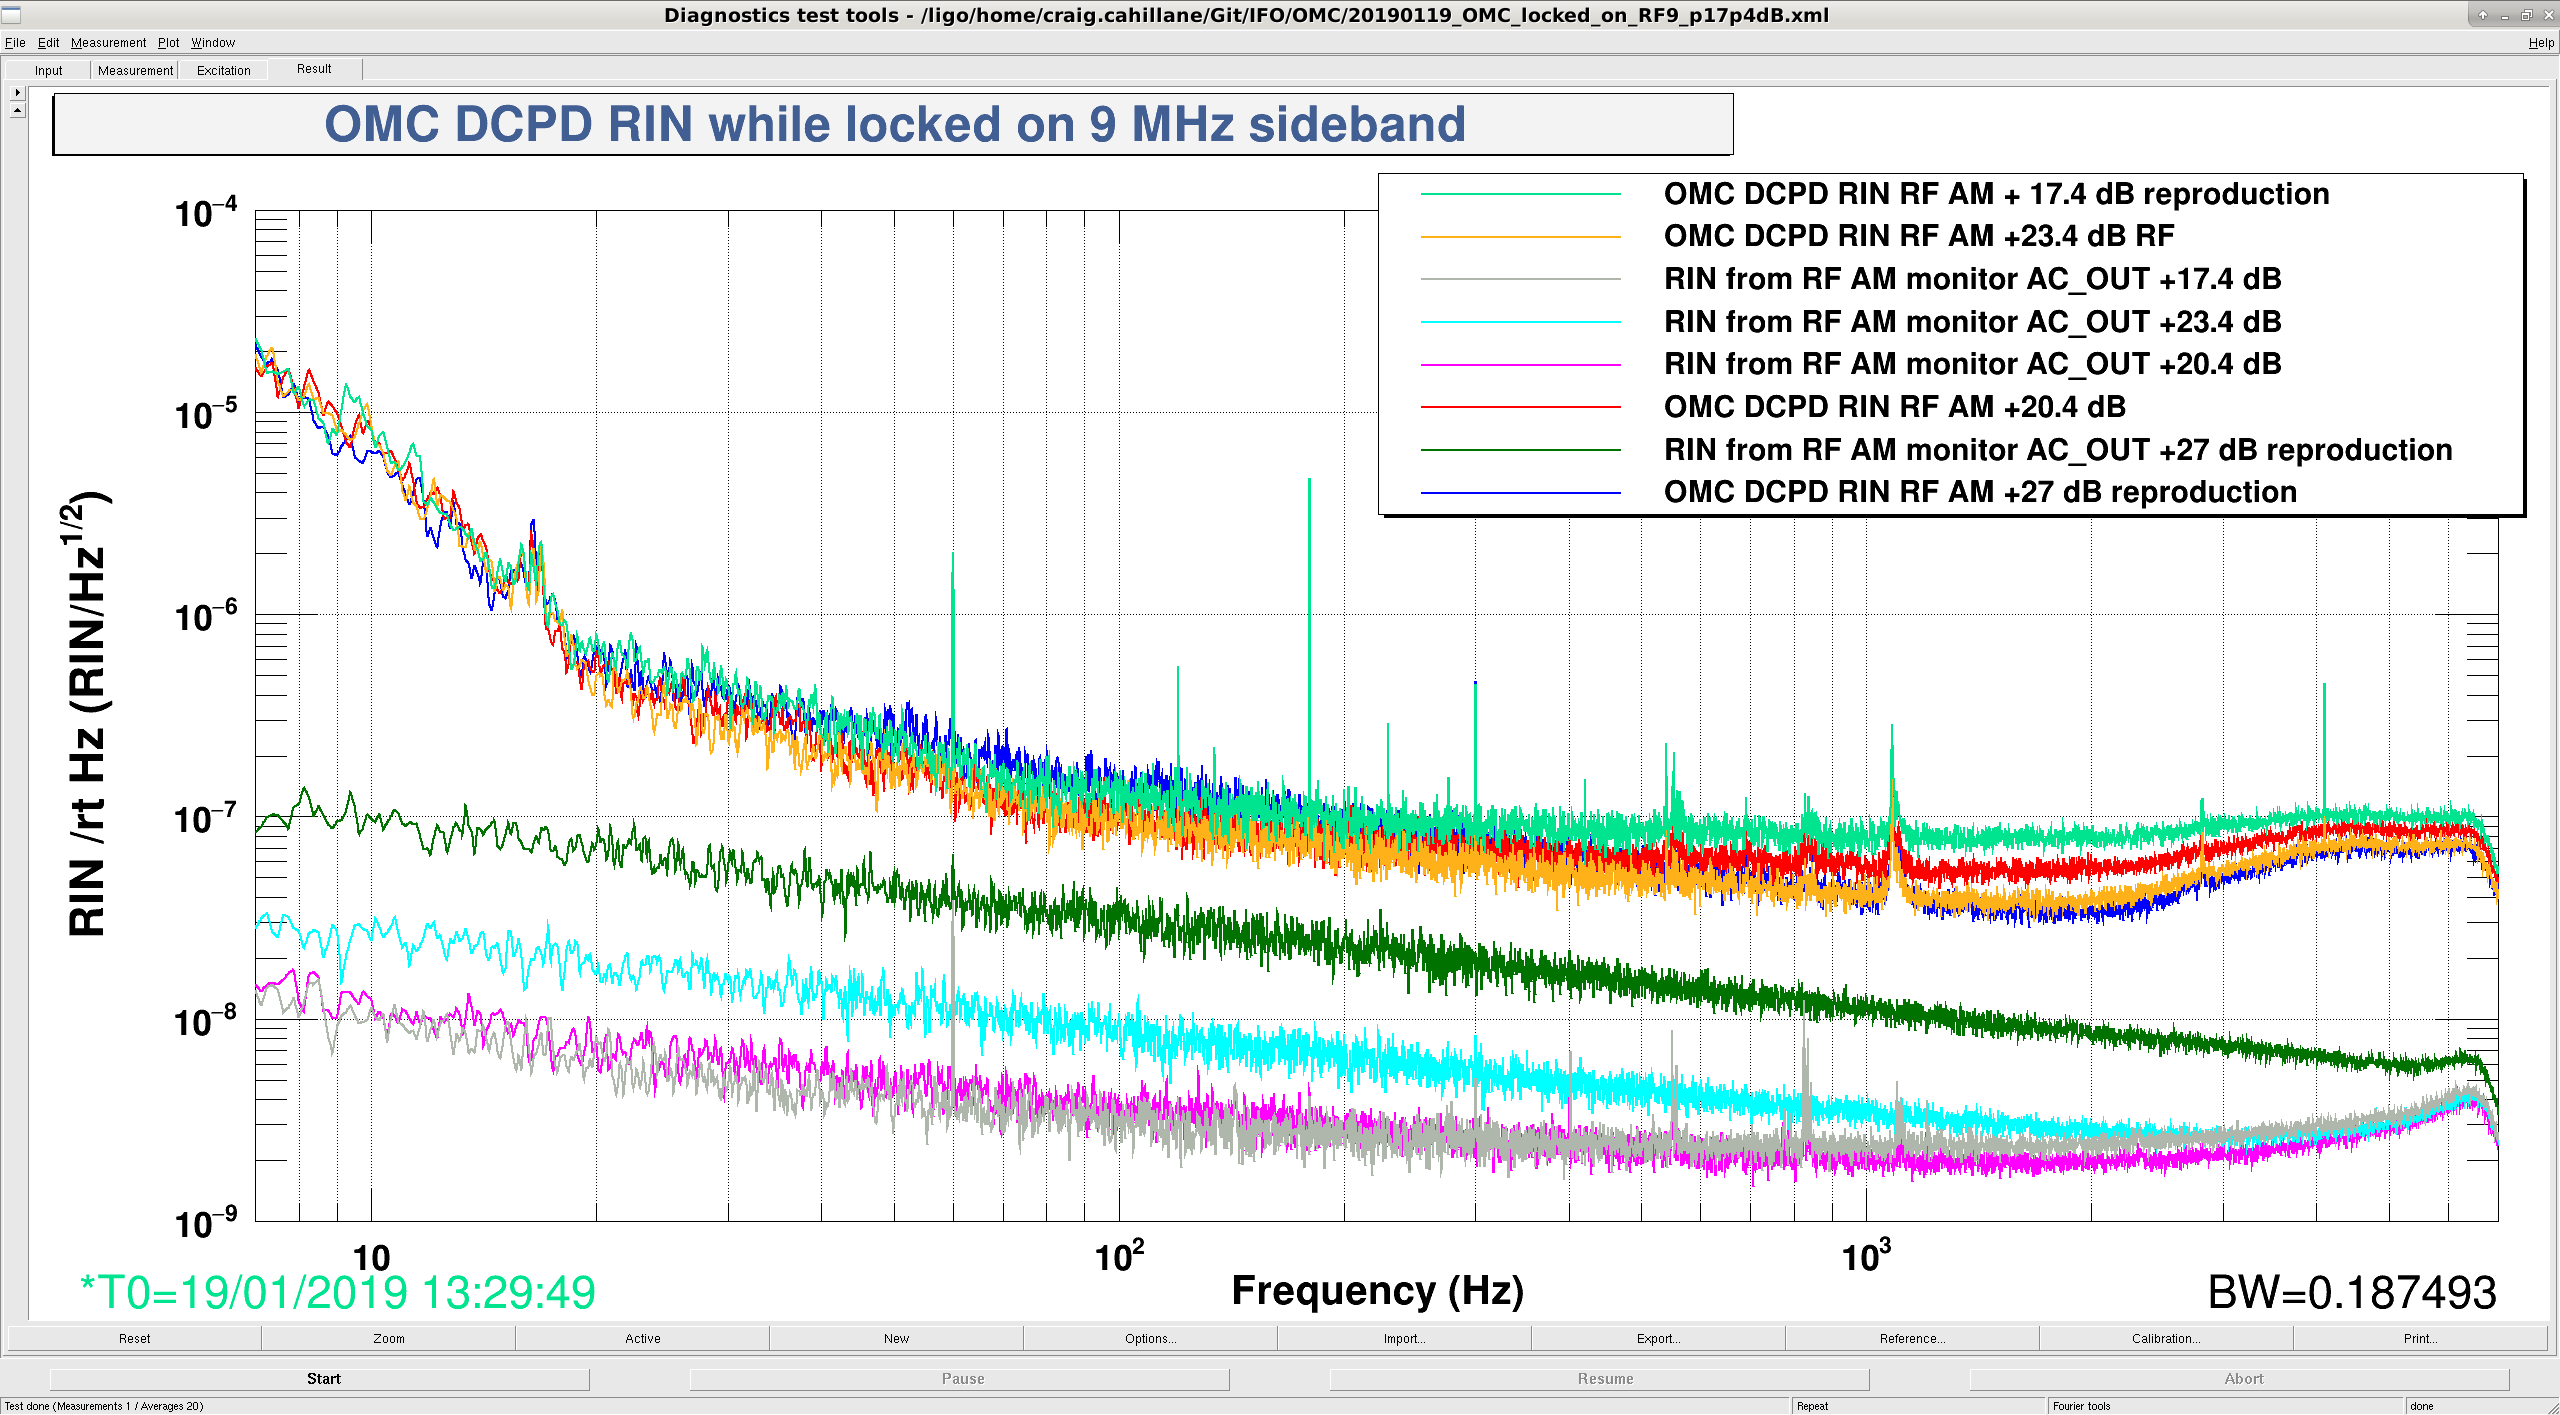
Then we tried repeating Sheila and Jenne's OMC 9 MHz locking test.  The results are plotted below.
The first attachment shows the OMC DCPD spectra and RF AM monitor spectra, each one appropriately calibrated into RIN, for different RF9 modulation slider values.  We see a moderate (factor of 2) win from going from +27 dB to 23.4 dB, otherwise 9 MHz RIN remains about constant.
The second attachment shows the effect of changing the 9 MHz modulation frequency by 5 Hz.  The 9 MHz RIN seems to be independent of our frequency move. 

We note that the move from 23.4 dB to 27 dB on the RF9 slider actually does increase the modulation depth, since the OMC DCPD SUM increases when this is done.  Koji suspects that his measurements from before measuring the response of the EOM suffered from broadband saturations spoiling the linear response.  Going above 23.4 dB on the 9 slider is still not recommended.
We moved the modulation frequency back to 9.100230 MHz and left it there.

-------------------------------------------------------------------------

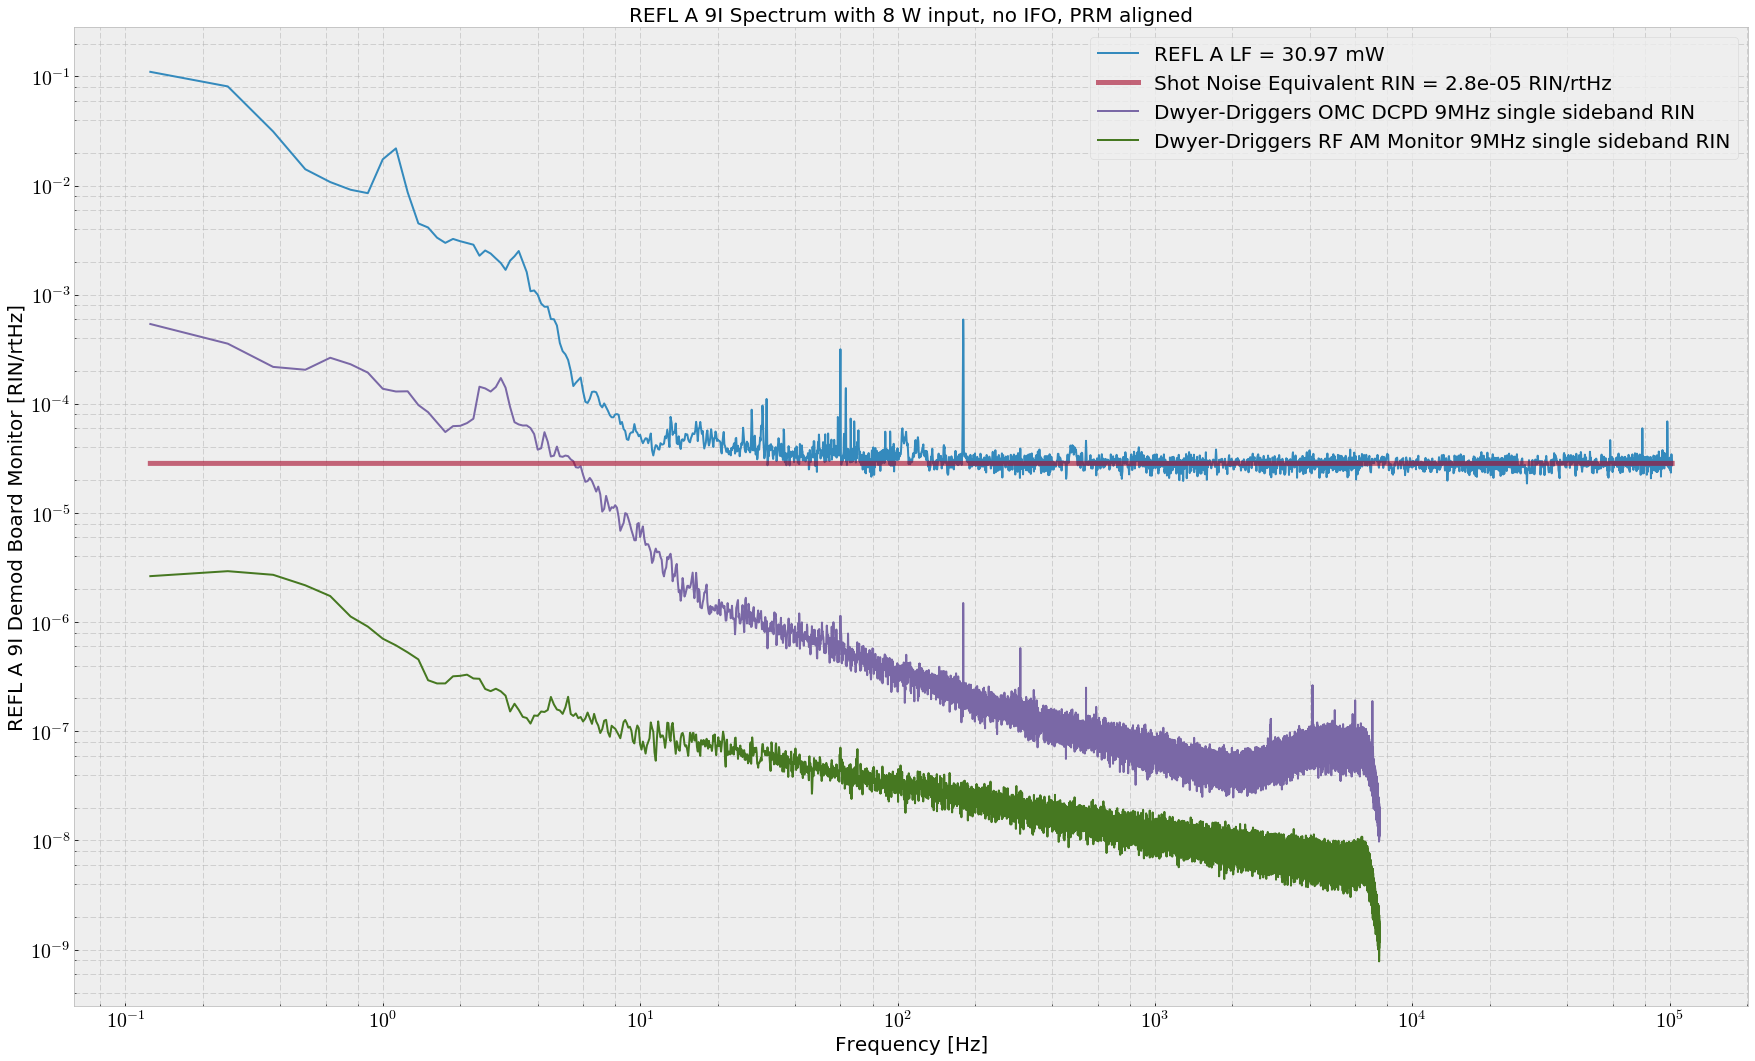
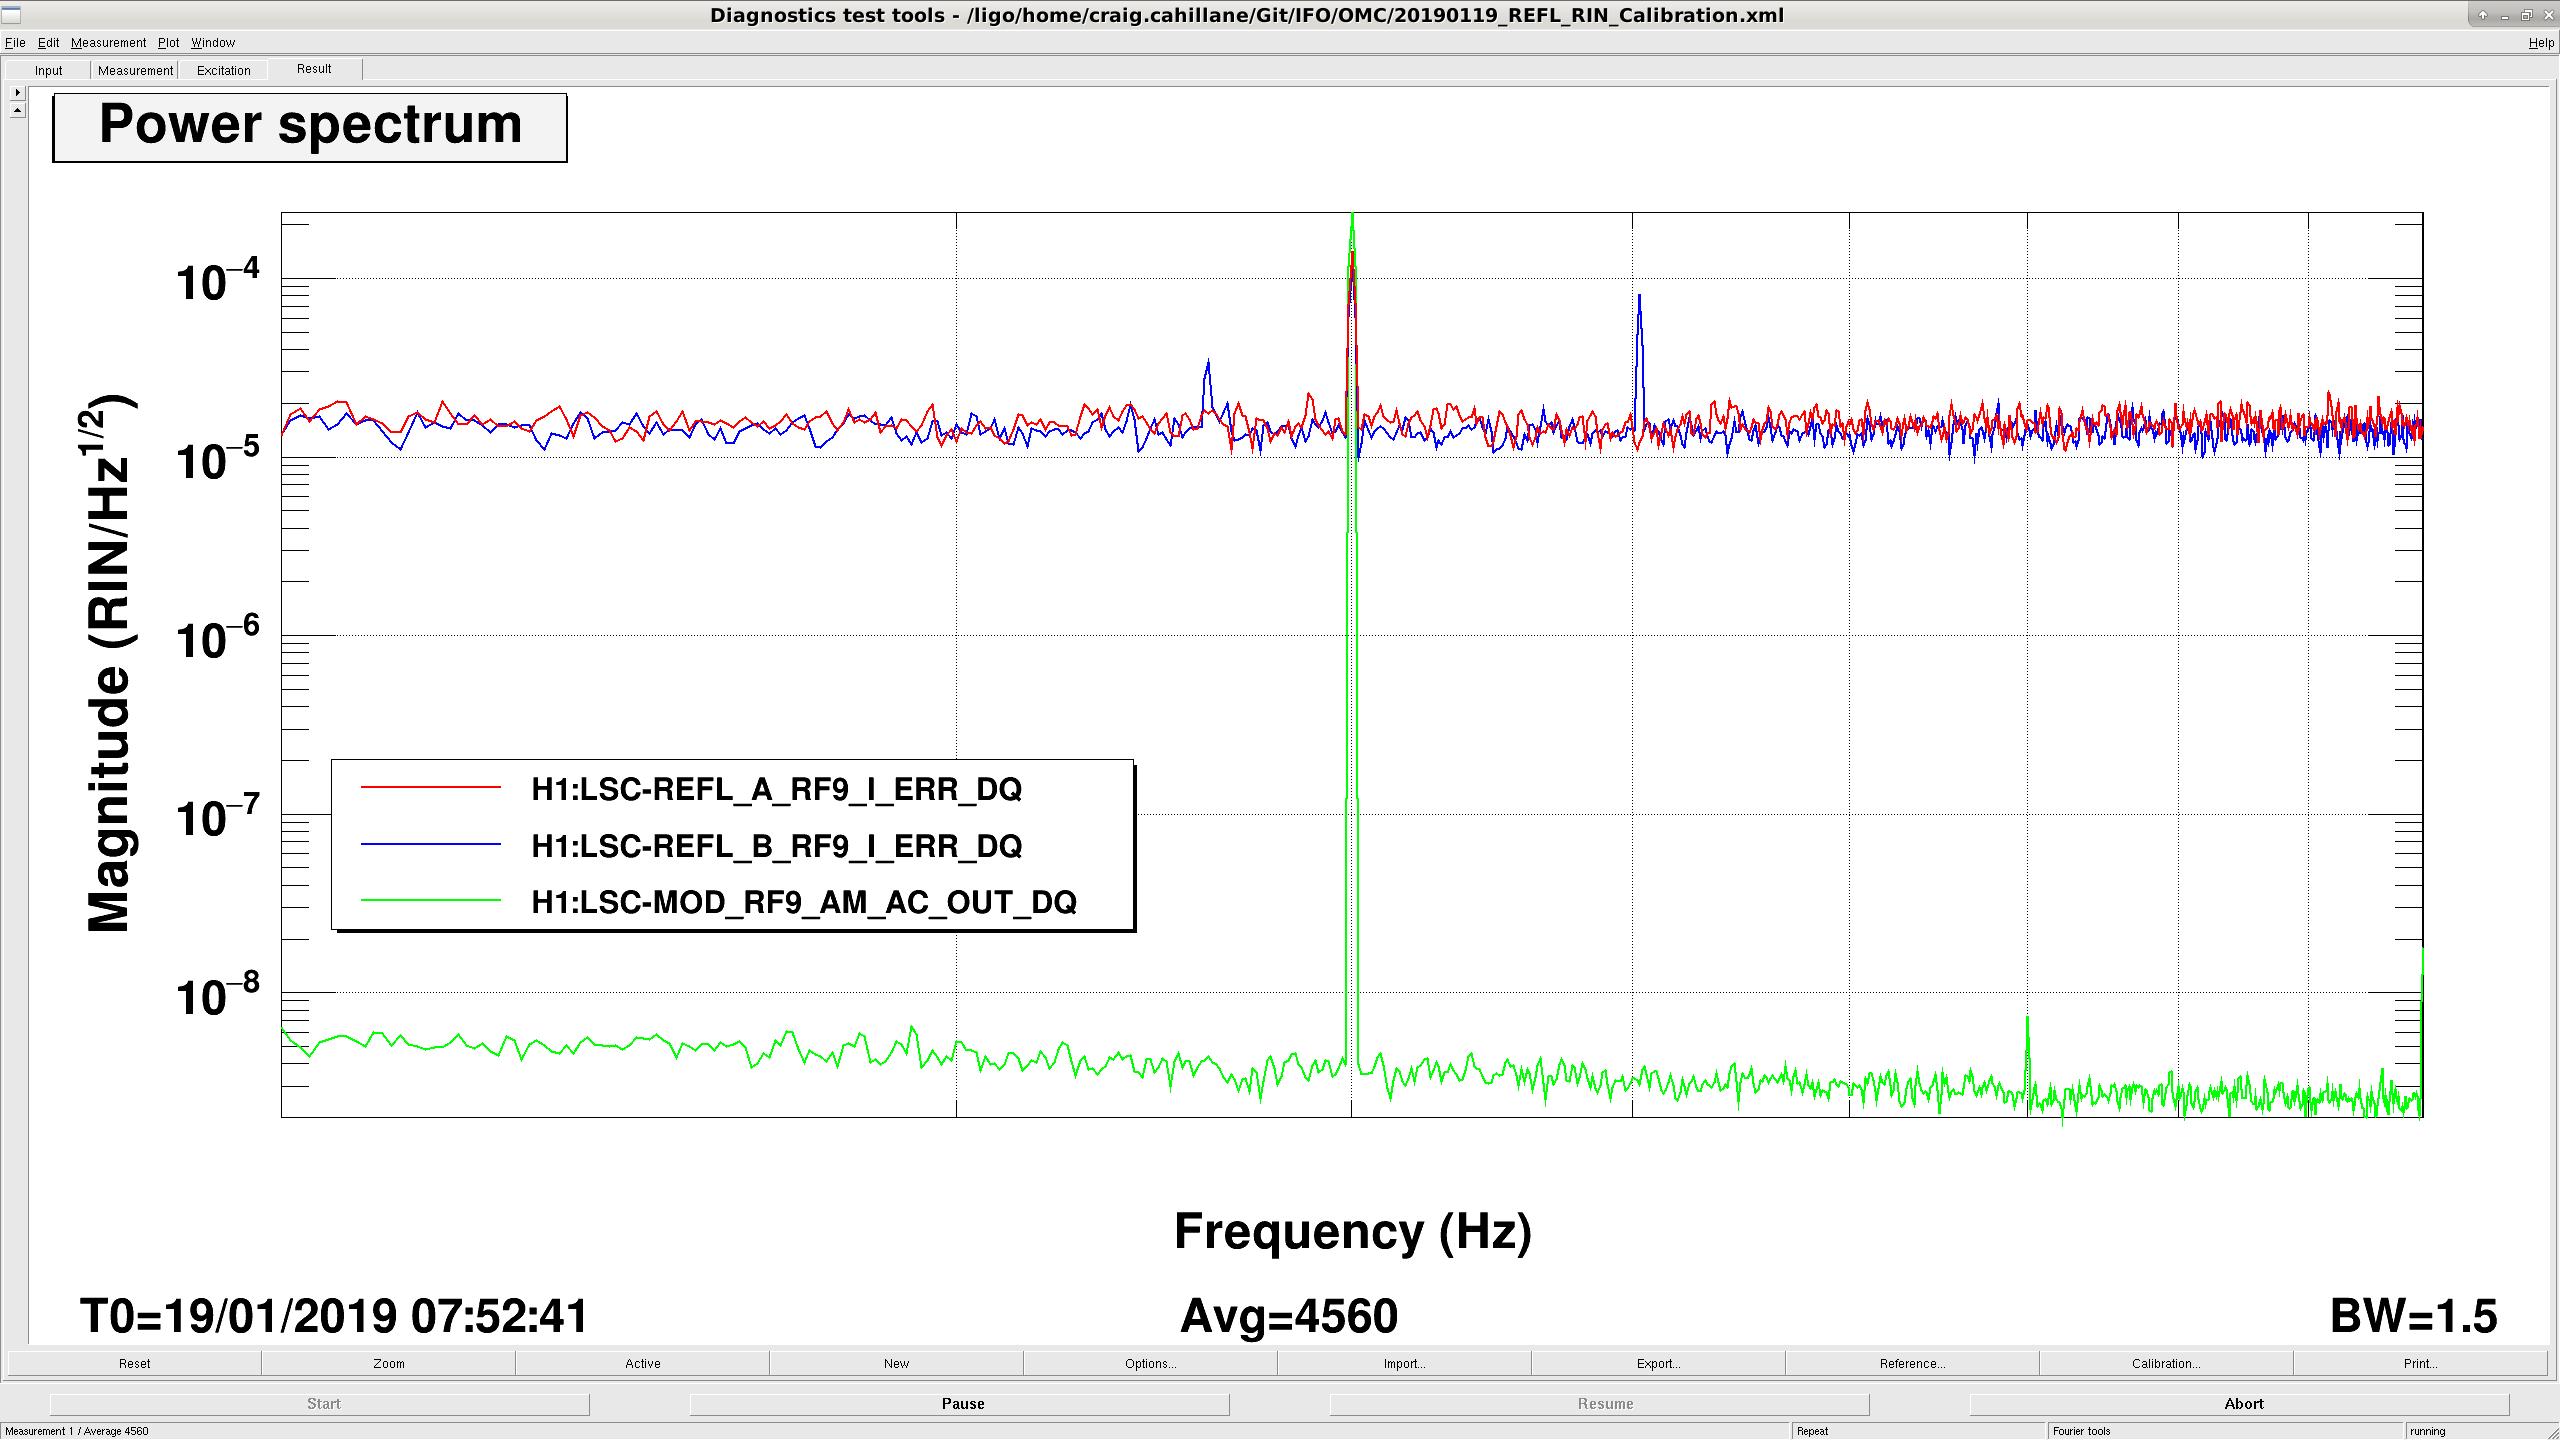
We also injected a line into the EOM driver for the 9 to calibrate the REFL A 9I pd into units of RIN.  It seems that REFL A 9I is a pretty poor RIN sensor relative to the OMC and RF AM monitor. (attachment 3)


Images attached to this report
Comments related to this report
daniel.sigg@LIGO.ORG - 10:09, Saturday 19 January 2019 (46544)

Optics Express 23 (2015) 19417; http://dx.doi.org/10.1364/OE.23.019417 and also alog 13378.

Back then, we measured 9.100235.6 Hz (paper) and 9.100229 Hz (alog). So the FSR changed by less than 11 Hz, or ~1 ppm. Or in other words, the cavity length of ~16.5 m changed by less than 20 µm, since the last measurements 5 years ago.

craig.cahillane@LIGO.ORG - 18:40, Sunday 20 January 2019 (46550)
Some notes about the measurement that were not mentioned before:

- We measured out of IMC REFL RF OUT with the IMC locked with 25 watts input requested.

- Attachment one is the data on the 33 MHz Peak vs 9 MHz changes we acquired.

- Attachment two is the calibration of REFL A/B 9I RIN we got by injecting AM into the 9 MHz stabilizer.
Images attached to this comment
H1 AOS
craig.cahillane@LIGO.ORG - posted 03:45, Friday 18 January 2019 - last comment - 18:49, Sunday 20 January 2019(46520)
REFL A/B 9I Shot Noise Spectra
Koji, Craig

We became interested in Sheila and Jenne's 9 MHz RIN measurement, and so set out to measure a more complete spectrum of the 9 MHz demodulated REFL PD noise to gain some perspective on the 9 MHz amplitude modulation transmitted through the IMC.

First we shuttered the PSL and measured a full suite of dark noise spectra.  
Then we requested ITMs and SRM misaligned, PRM aligned, and 8 watts of input laser power.  This gave us 30.97 mW on REFL A LF and 28.52 mW on REFL B LF.

This is not a direct comparison of 9 MHz RIN as measured by Jenne and Sheila; their measurement is capable of picking out a single sideband, while ours is the usual carrier and sidebands beatnote.  We'll think about the comparison of each measurements' RIN.
Non-image files attached to this report
Comments related to this report
daniel.sigg@LIGO.ORG - 09:45, Friday 18 January 2019 (46525)

Units in the plot? Not sure how you distinguish shot noise from RFAM with a measurement at just one incident power.

craig.cahillane@LIGO.ORG - 18:49, Sunday 20 January 2019 (46551)
H1 IOO (IOO)
cheryl.vorvick@LIGO.ORG - posted 03:24, Friday 18 January 2019 - last comment - 18:02, Monday 21 January 2019(46521)
measuring the beam spot location on CW1, the first optic in the IO Faraday

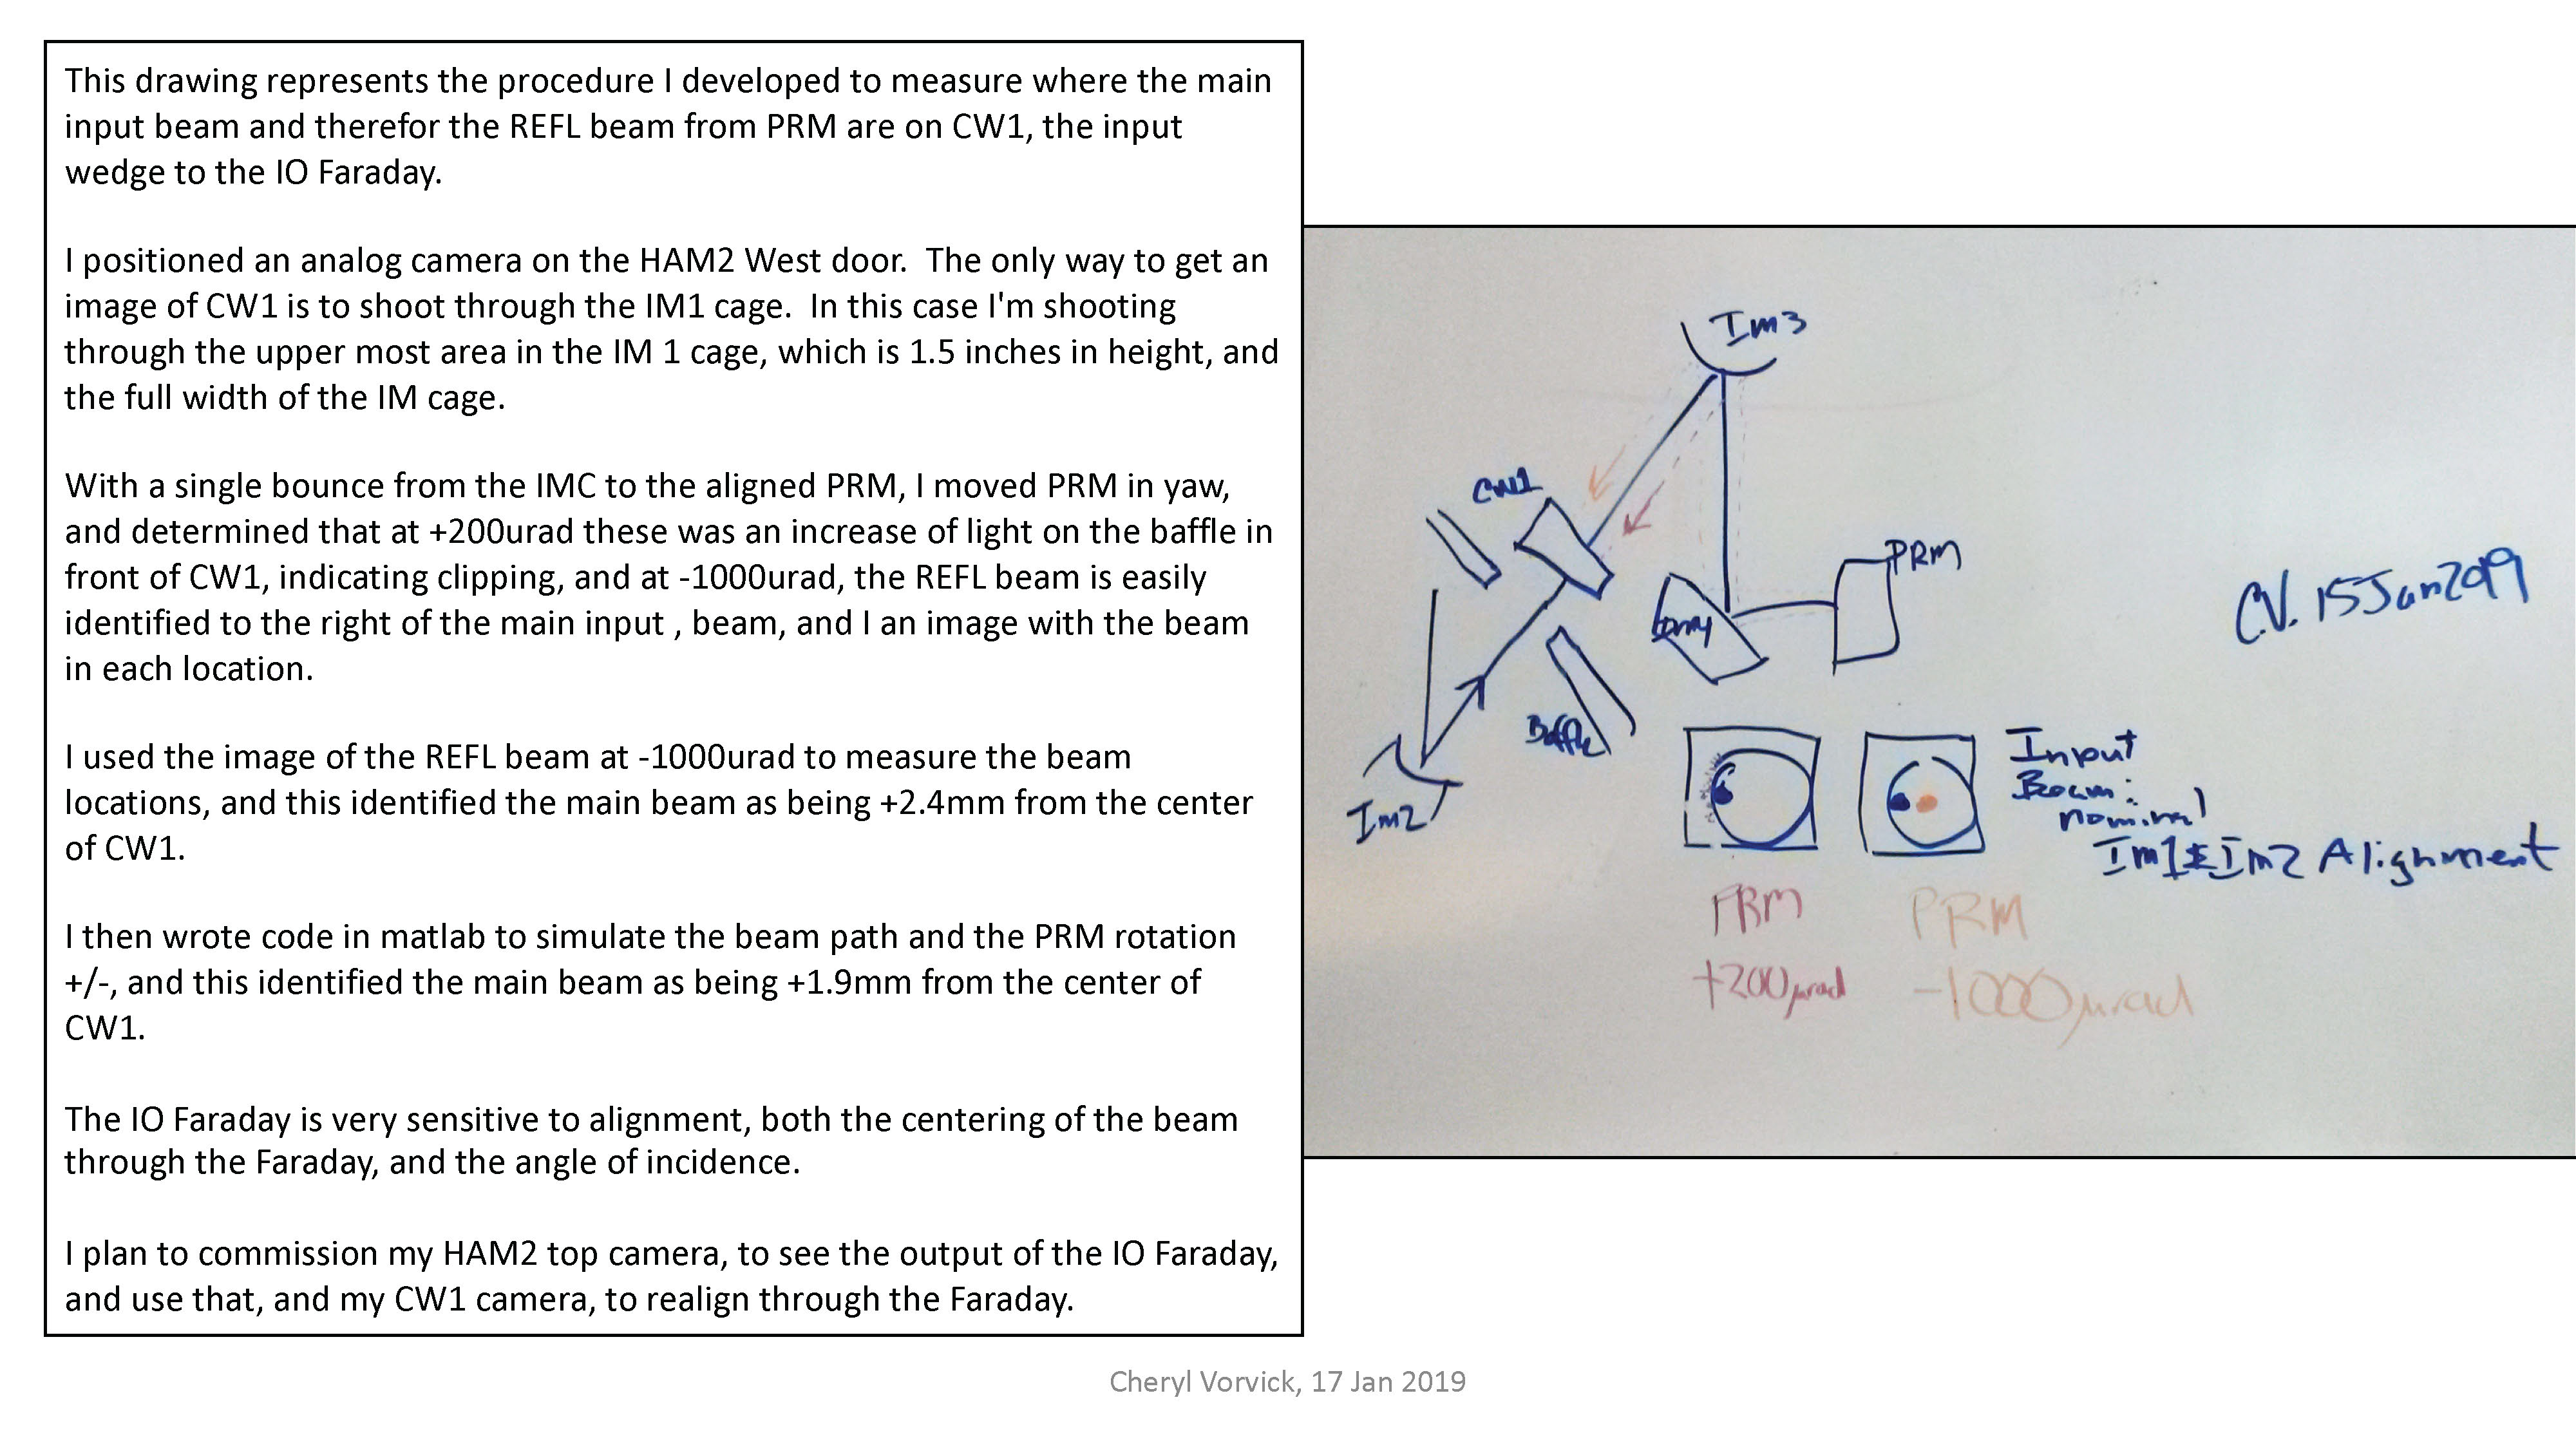
I put a camera on the HAM2 West door, which looks at CW1, the back side of the wedge, which is carefully aligned to shoot through the IM1 tower.

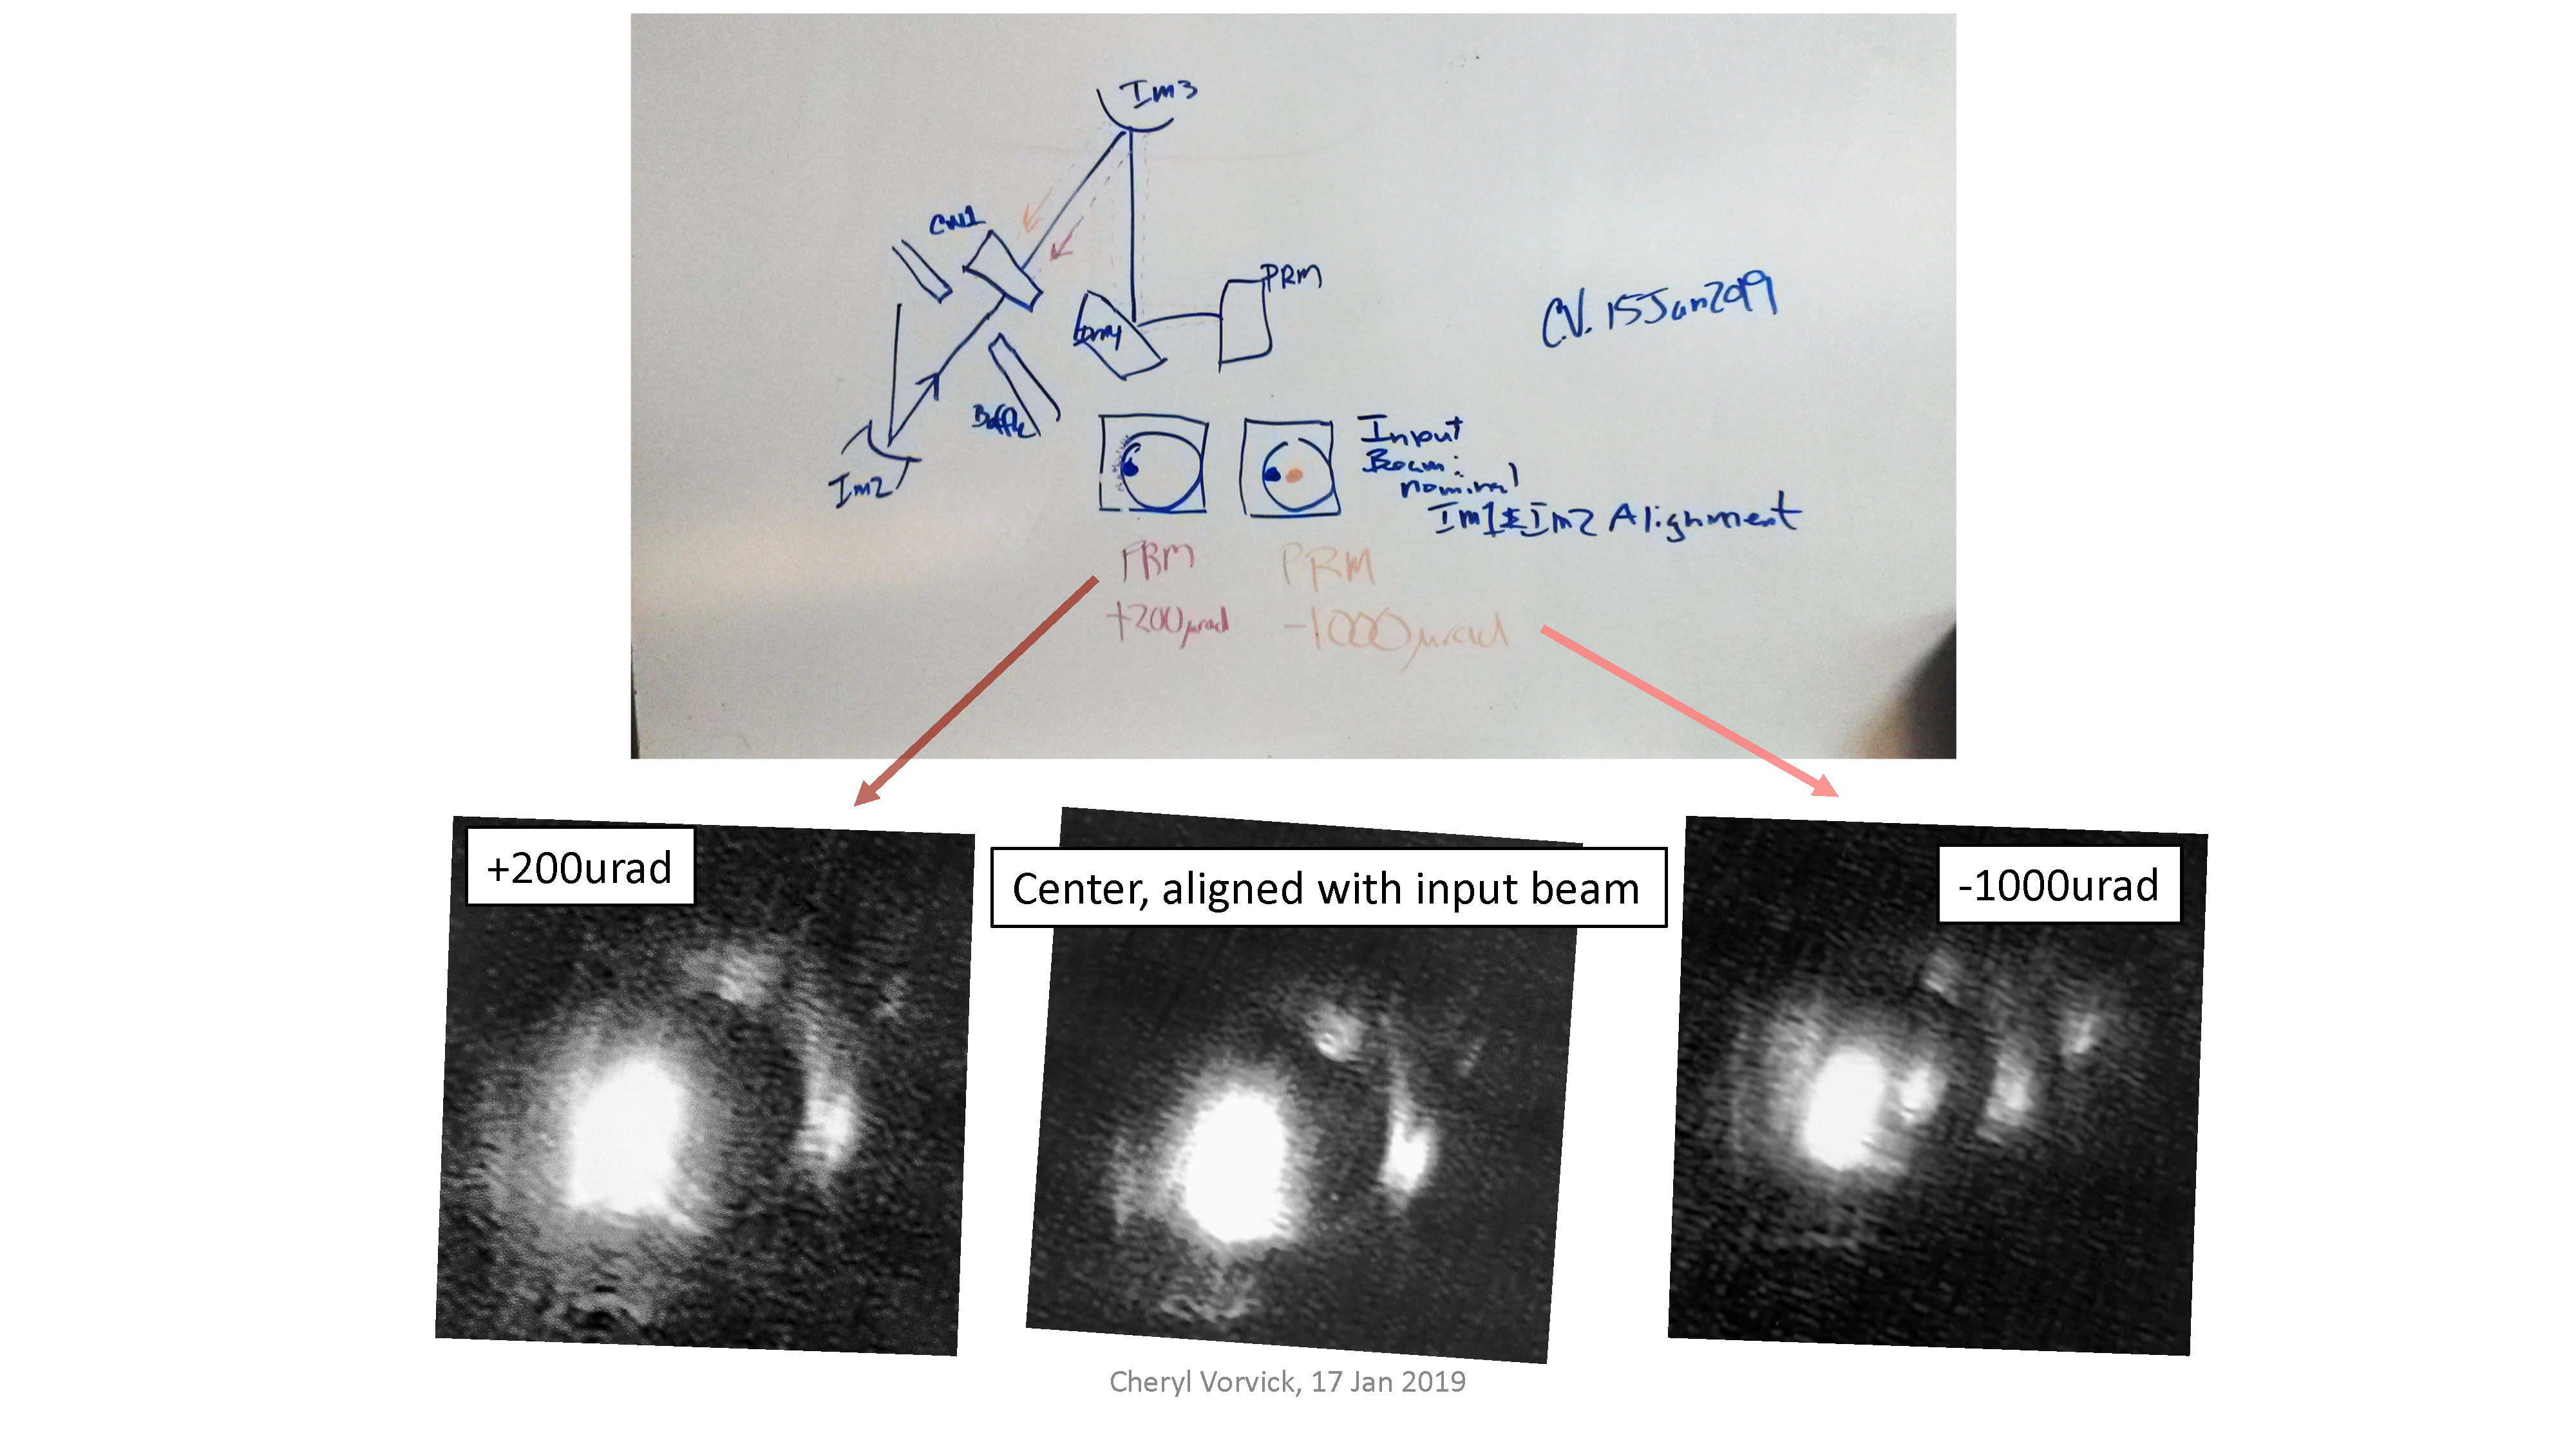
This week I developed a procedure to use PRM with a single bounce, to move the REFL beam on CW1, and and look for clipping.  The procedure revealed that when PRM is in it's aligned position plus an additional 200urad in yaw, there's an increase in light on the baffle, consistent with the REFL beam starting to clip.  With PRM at -1000urad, the REFL beam is clearly seen on CW1 to thr right of the main input beam.

Using the image and a beam path simulation I wrote in matlab, I've measured the main input beam to be between 2mm and 3mm from center.

I need to adjust my HAM2 top camera to improve the view of the IO Faraday output side, which is planned for next Tuesday, in order to realign through the Faraday, to correct the mis-centering at both the input and output Calcite Wedges.


compared to the main input beam, which I've used to identify the location of the main input beam on the wedge.  A diagram and images attached.

Images attached to this report
Comments related to this report
cheryl.vorvick@LIGO.ORG - 03:36, Friday 18 January 2019 (46522)

I've written up how I measured beam positions using images.  My measurements from the image are consistently about 20% larger than the beam path simulation.  Given the uncertainties in both methods, and and uncertainties in the beam path, I'm not concerned about the 20% difference. 

Both measuring methods identify the main input beam as 2+ mm from the center of CW1, which will effect the IO Faraday performance.

Non-image files attached to this comment
cheryl.vorvick@LIGO.ORG - 18:02, Monday 21 January 2019 (46557)

I've recalculated the centering of the main beam on CW1, after Keita identified my original calculation as low by about 10%.

My updated calculation shows the main beam as +2.2mm from the center of CW1, where I had originally posted +1.9mm.

The measured value from the image is +2.4mm, so the updated value of +2.2mm is now within 10% of the measured value.

Attachment is updated to show the change.

Non-image files attached to this comment
H1 ISC (ISC)
craig.cahillane@LIGO.ORG - posted 17:46, Wednesday 16 January 2019 - last comment - 16:44, Monday 05 August 2019(46483)
IMC REFL and REFL A/B shot and dark noise levels
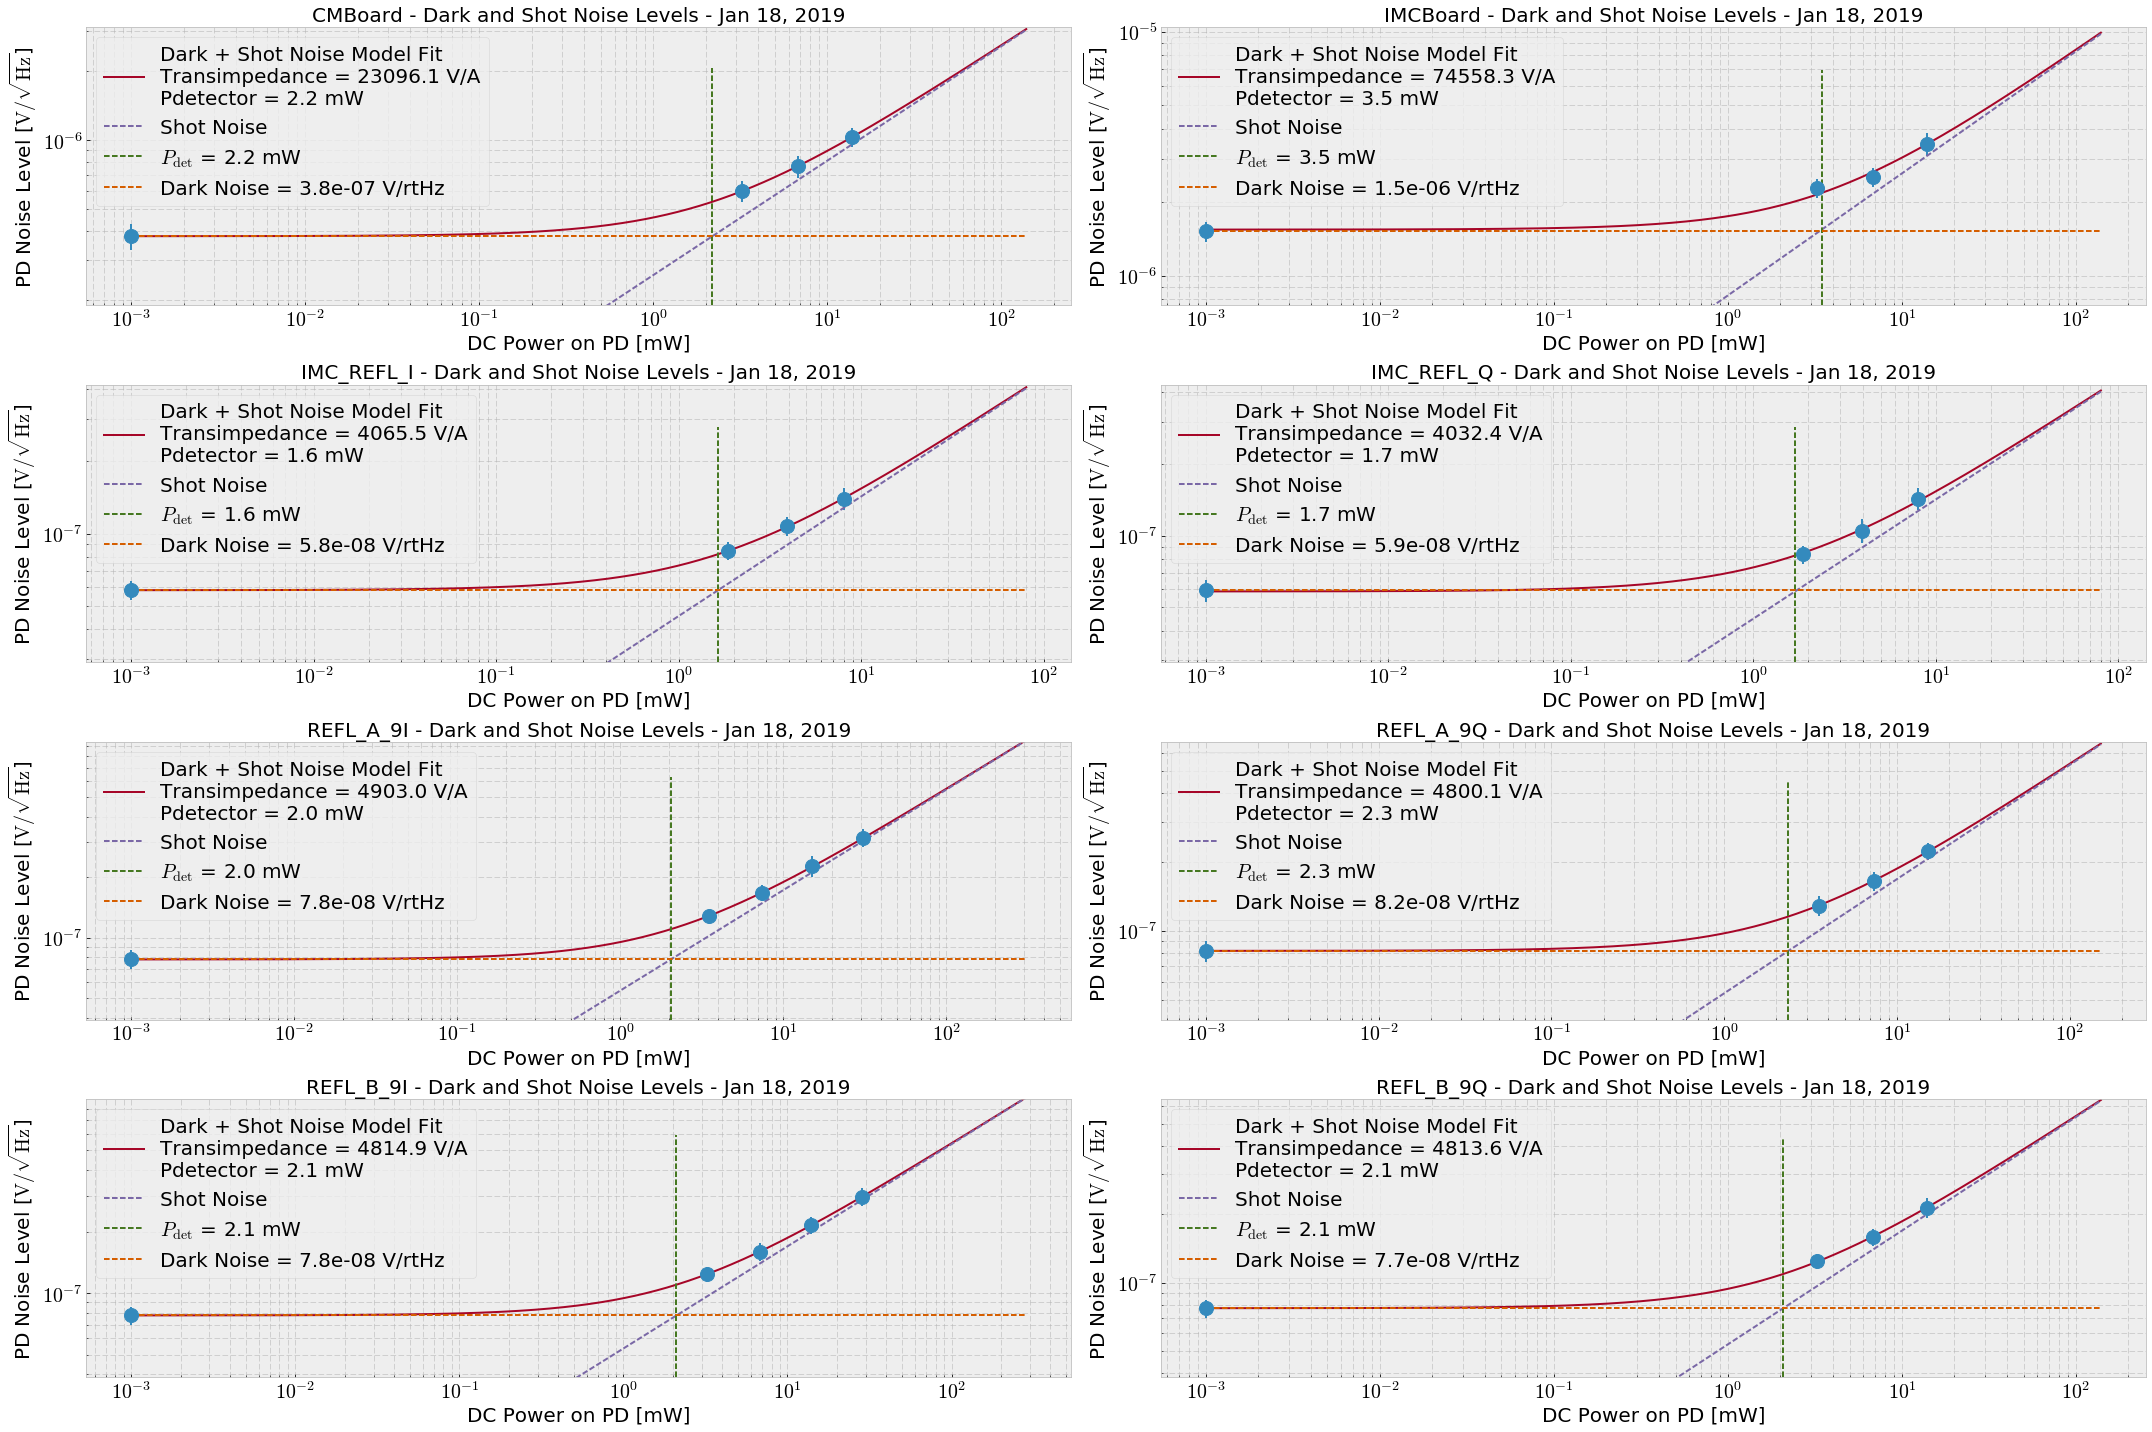
On Monday evening, Koji and I went out and measured the shot and dark noise of the IMC/CARM PDs.  Then, Koji taught me how to think about photodiode noise.  Slides 35 and 36 of G1401145

Model:

where nV is the voltage noise floor, T is the transimpedance, e is the electron charge, R is the responsivity of e λ/(h c) = 0.858 A/W, QE is the quantum efficiency of 0.9, PDC is the DC power from the incident light, and Pdet is the power apparent from the intrinsic detector noise (i.e. the incident power where shot and dark noise are equivalent).

We fit the measured shot and dark noise spectra for IMC REFL I/Q, REFL_A 9I/Q, REFL_B 9I/Q, and at the CARM and IMC servo board OUT2 locations with the nominal gain slider settings (OUT2 connected to IN1, CMB IN1GAIN = 6 dB, IMC Board IN1Gain = 28 dB).  REFL_A spectra are plotted in attachment 3 as an example.
For dark noise I shuttered the PSL.  For shot noise I measured with 1W, 2W, and 4W input requested power, and recorded how much light was reported by the LF channels:

Light Level      REFL_A_LF [mW]     REFL_B_LF [mW]    IMC_REFL_LF [mW]
----------------------------------------------------------------------
Dark                          0                  0                   0
1W PSL                     3.51               3.24                1.87
2W PSL                     7.38               6.80                3.92
4W PSL                    15.08              13.90                8.01

Full Lock                  4.36               4.02                1.15


Then, I found the average noise floors for each spectrum between 3 and 10 kHz, and fit the model to the data.  (attachment two)
I have let the transimpedance number from the fits capture the servo board gain sliders.

Photodiode      Transimpedance [V/A]     Pdet [mW]    IN1 Gain Slider [dB]
-------------------------------------------------------------------------------------
CMBoard                        730.4          2.2                       6
IMCBoard                      2357.7          3.5                      28
IMC_REFL_I                     128.6          1.6
IMC_REFL_Q                     127.5          1.7
REFL_A_9I                      154.9          2.0
REFL_A_9Q                      151.8          2.3
REFL_B_9I                      152.4          2.1
REFL_B_9Q                      152.2          2.1

Images attached to this report
Comments related to this report
craig.cahillane@LIGO.ORG - 19:02, Sunday 20 January 2019 (46552)
The transimpedance numbers above are incorrect.  In the model I did not convert mW to W for the calculation, so all numbers were scaled down.
Posted is a corrected plot.

Images attached to this comment
craig.cahillane@LIGO.ORG - 16:44, Monday 05 August 2019 (51038)
Comments from Daniel

"... the transimpedance typically describes the electronics gain. However,
yours doesn't. The shot noise eq is missing a sqrt(2), and the demod will fold noise 
below the LO and above the LO on top of each other, which results in another sqrt(2).

So, your T is twice as large as the electroncis gain. For IMC REFL the mesured RF gain
of the PD is 353 Ohm, the demod gain is ~5.4 which gives 1.9k."

Essentially, the above model ignores a overall factor of 2, and collects the demod gain of 5.4 into the transimpedance, which is not correct.

So, for IMC_REFL_I above, the transimpedance is actually 4065 / 5.4 / 2 = 376 ohms, close to the direct measured 353 ohms Daniel reports.
REFL_A_I transimpedance: 4903 / 5.4 / 2 = 454 ohm
REFL_B_I transimpedance: 4814 / 5.4 / 2 = 446 ohm
H1 CAL (CAL, INJ)
jameson.rollins@LIGO.ORG - posted 15:19, Tuesday 15 January 2019 - last comment - 09:24, Saturday 19 January 2019(46407)
new hardware injection front end model installed: h1calinj

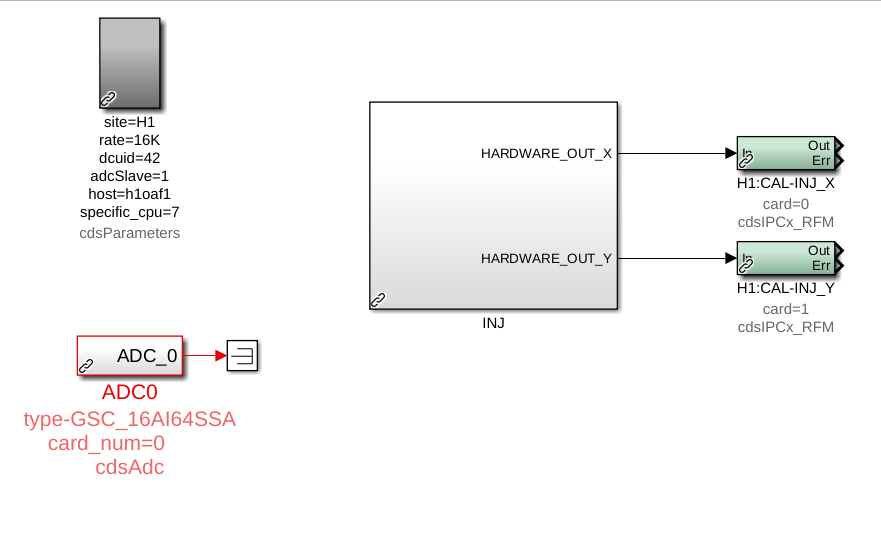
A new h1calinj model has been installed on the h1oaf1 machine.  This model will hold all front-end injection handling logic, including the injection EXC test points, under the channel prefix "H1:CAL-INJ_".  The existing injection handling code in the h1calex model ("H1:CAL-PINJX_") has been left as is for now to facilitate transitioning and testing.

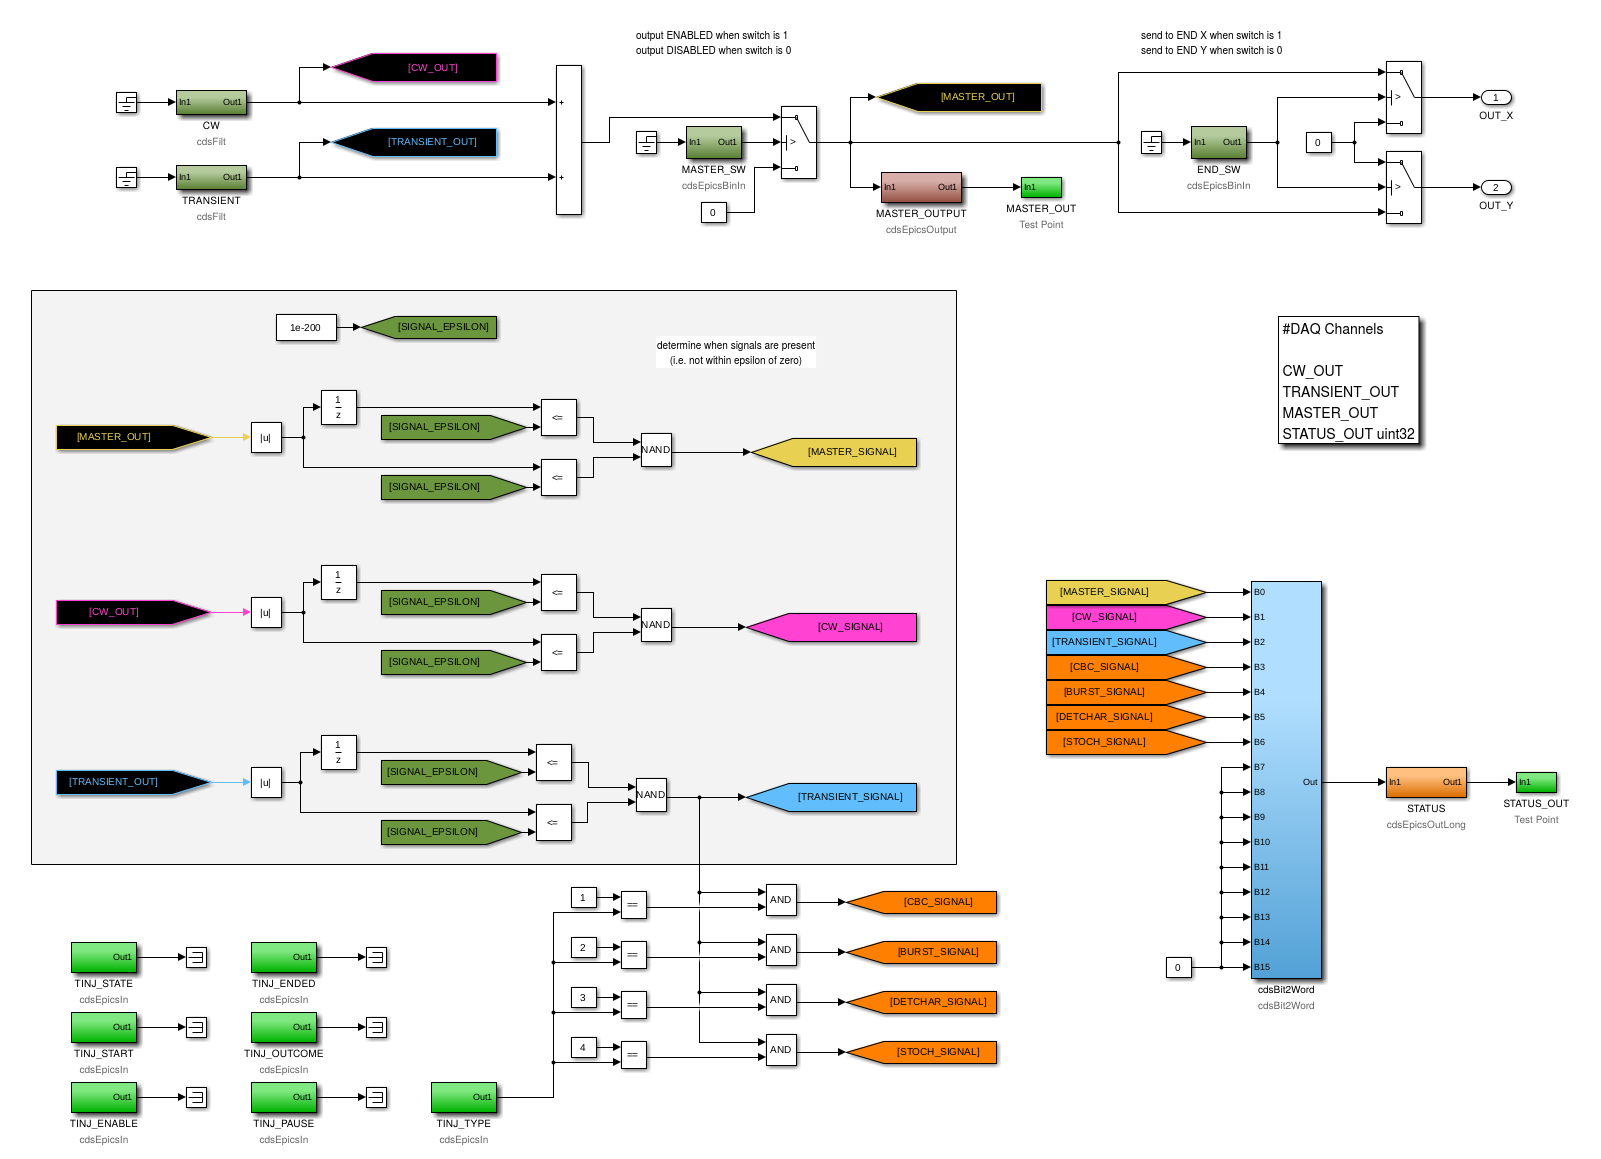
The first two attached images are of the top-level contents of the new h1calinj model, and of the contents of the "INJ" CAL_INJ_MASTER2 library part that contains all the core logic.  The top of the latter shows the main injection signal flow.  The two "CW" and "TRANSIENT" filter banks at the upper left hold the EXC inputs and calibration filters for the continuous-wave (CW) and transient (TRANSIENT) injection inputs respectively.  The outputs of the two modules are summed and the overall "MASTER" output goes through an output switch ("MASTER_SW"), and then finally a switch ("END_SW") that determines which of calex or caley receives the injection signal ("H1:CAL-INJ_{X,Y}" via cdsIPCxRFM).  Below the main signal path is logic to determine the presence of signals at various points in the injection path, and bundle that info into a single status word ("STATUS_OUT").

IPC receivers for the INJ_MASTER output sent from h1calinj (H1:CAL-INJ_{X,Y}) were added to the h1calex and h1caley models.  EPICS and acquired test point monitors of the received signals were also added.

NOTE: a single 2**14 Hz, 61 us cycle delay will be added to the injection path because of the IPC needed to carry the signal from the vertex to the ends.

The new acquired fast channels are:

The STATUS channels (the H1:CAL-INJ_STATUS_OUT_DQ uint32 fast channel and the H1:CAL_INJ_STATUS slow channel) have the following bits:

  1. MASTER
  2. CW
  3. TRANSIENT
  4. CBC
  5. BURST
  6. DETCHAR
  7. STOCH

A value of zero (0) indicates no signal of the specified type is present, and a value of one (1) indicates the presence of the specified signal.

The h1calinj model also holds the "TINJ" EPICS status bits, nominally set by the INJ_TRANS guardian node.  NOTE: the "H1:CAL-INJ_TINJ_" EPICS records were previously hosted by the ext_alert_ioc.py soft IOC running on the h1fescript0 machine.  The records were removed from the soft IOC and the process was restarted.

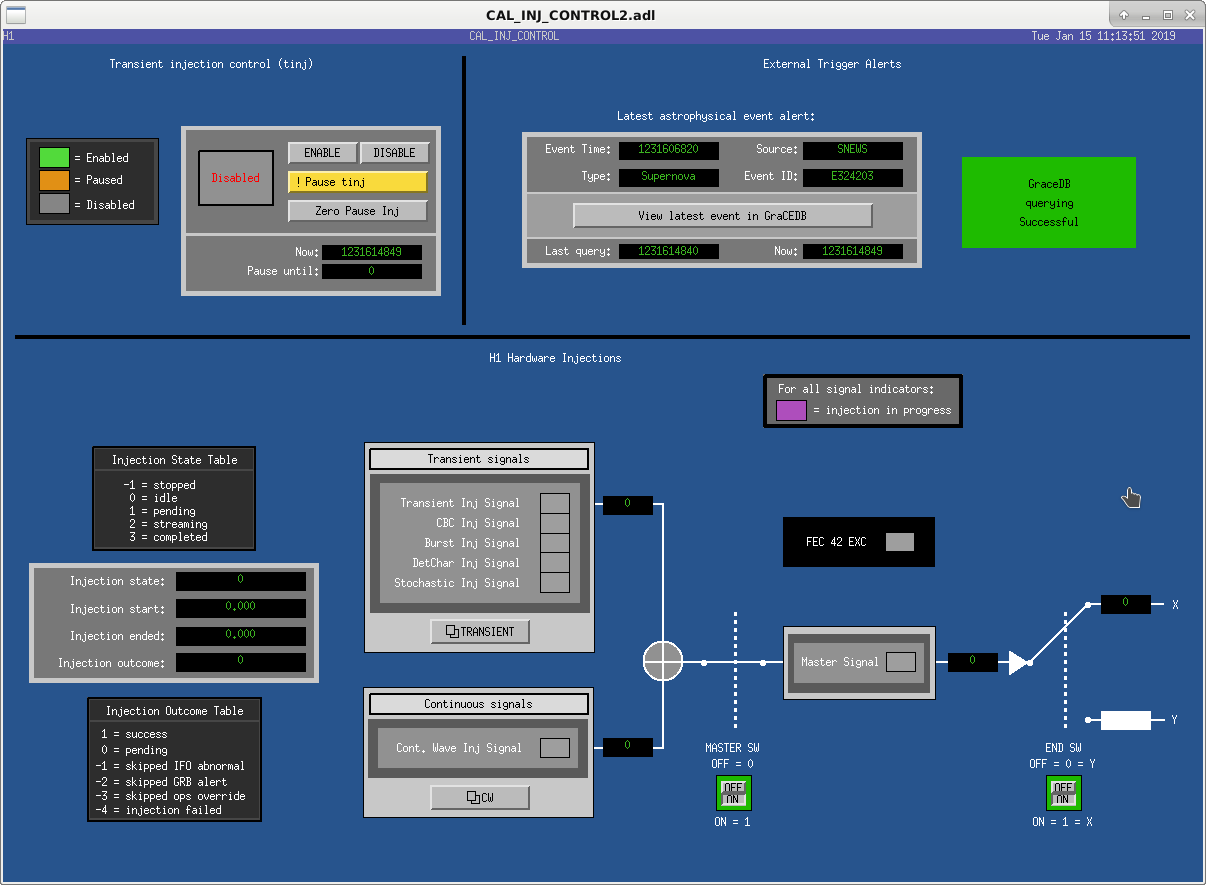
The final image attached is a new MEDM screen CAL_INJ_CONTROL2.   All functionality and status bits in the h1calinj model, and the monitors in h1calex and h1caley, are exposed.

As mentioned above, all the existing INJ infrastructure remains in place.  We leave it up to the INJ group to update the INJ_TRANS guardian, the psinject process, downstream monitors, etc.  We would like to schedule the removal of the old INJ infrastructure as soon as possible,

Images attached to this report
Comments related to this report
keita.kawabe@LIGO.ORG - 15:46, Wednesday 16 January 2019 (46480)

New MEDM screen is now accessible from the sitemap (cal-> hwinj ctrl). Old one is still there as "hwinj ctrl old".

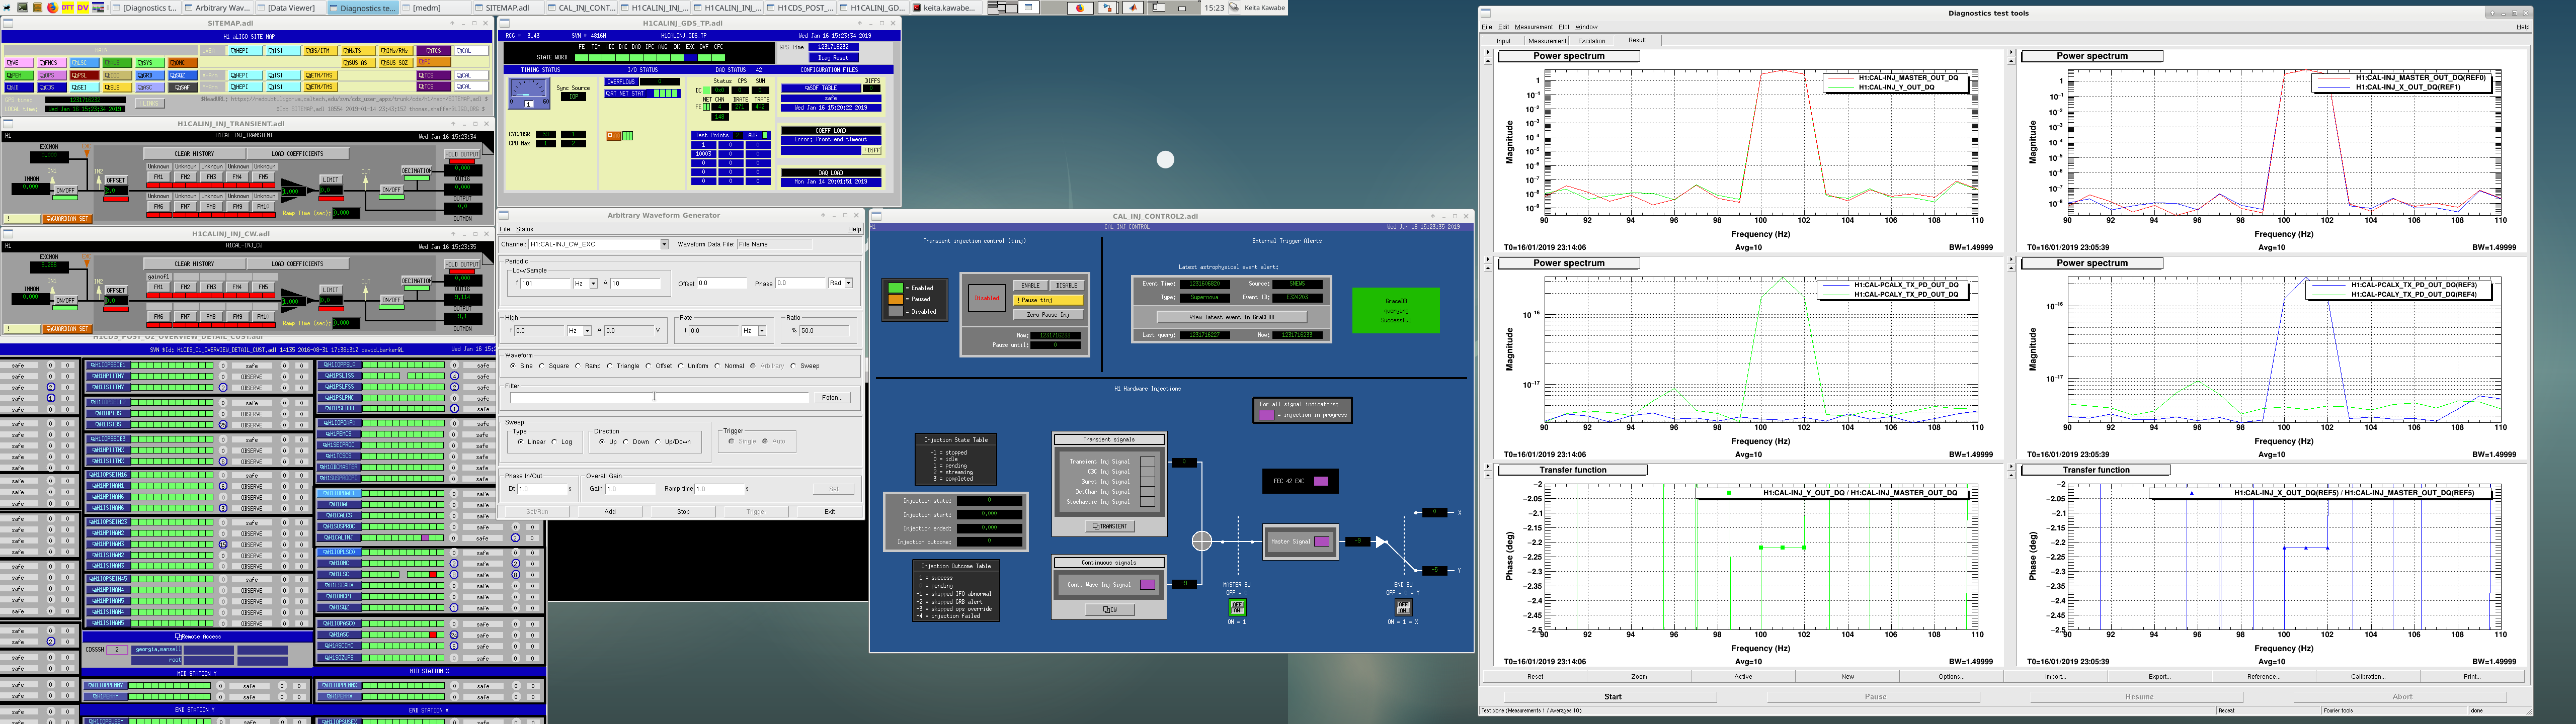
I briefly tested the new frontend.

  • TRANSIENT INJ Signal bit of H1:CAL-INJ_STATUS responded correctly to excitation as well as an offset in H1:CAL-INJ_TRANSIENT filter module.
  • CW INJ Signal bit of H1:CAL-INJ_STATUS responded correctly to excitation as well as an offset in H1:CAL-INJ_CW filter module.
  • MASTER Signal bit of H1:CAL-INJ_STATUS responded correctly to excitation as well as an offset in either INJ_TRANSIENT or INJ_CW filter module.
  • Excitation bit of H1:FEC-42_STATE_WORD only responded to excitations but not offsets (of course).
  • H1:CAL-INJ_END_SW=1 or 0 correctly delivered the MASTER_OUT signal to h1calex or h1caley model (monitor points are H1:CAL-INJ_X_OUT and H1:CAL-INJ_Y_OUT).
  • Time delay from MASTER_OUT to h1calex and h1caley was  61.035us, which is almost exactly 1/(2^14Hz). This was measured by injecting sine wave at 101Hz to CW and measuring the transfer function from MASTER_OUT to X_OUT or Y_OUT.
  • H1:CAL-INJ_X_OUT or Y actually does go to PCAL laser power (done by looking at H1:CAL-PCALX_TX_PD_OUT or Y).

No surprise in the above. See the screen shot.

One surprise was that I had some problem loading filters to the new model using foton. Jamie and Rolf are working to figure it out.

Images attached to this comment
keita.kawabe@LIGO.ORG - 15:30, Friday 18 January 2019 (46533)DetChar, INJ

(Jamie, Keita)

Existing filters in CAL-PINJX_TRANSIENT filter module were  copied over to the new CAL-INJ_TRANSIENT filter and loaded successfully, and the settings represented by the attached screen were put in SDF as safe.

Transient injection group should test the new infrastructure as soon as possible. The new channel to inject is H1:CAL-INJ_TRANSIENT_EXC.

Note that, as of now, the filter is automatically loaded after the model restart as expected, but you cannot reload as far as the model keeps running. CDS group is still investigating, but in the mean time if you need to load the filter, contact the site (e.g. myself) and we'll schedule to restart the model.

Images attached to this comment
david.barker@LIGO.ORG - 09:24, Saturday 19 January 2019 (46542)

I've opened FRS-12175 to cover the problem loading h1calinj's filter file.

Displaying reports 43441-43460 of 88617.Go to page Start 2169 2170 2171 2172 2173 2174 2175 2176 2177 End